
Technical Analysis
BTC/USDT
As disagreements over interest rate policy become more apparent within the Fed, members are placing different weights on inflation and employment balance. On the US side, Donald Trump’s messages regarding the new Fed Chair are influencing expectations about the future of monetary policy, while financial data from China points to ongoing economic pressures. At the same time, potential contacts between the US and Russia and new sanctions rhetoric keep geopolitical risks on the agenda. On the Asian front, the Bank of Japan’s preparation for its sharpest interest rate hike in nearly 30 years signals a new era in the global monetary policy outlook.
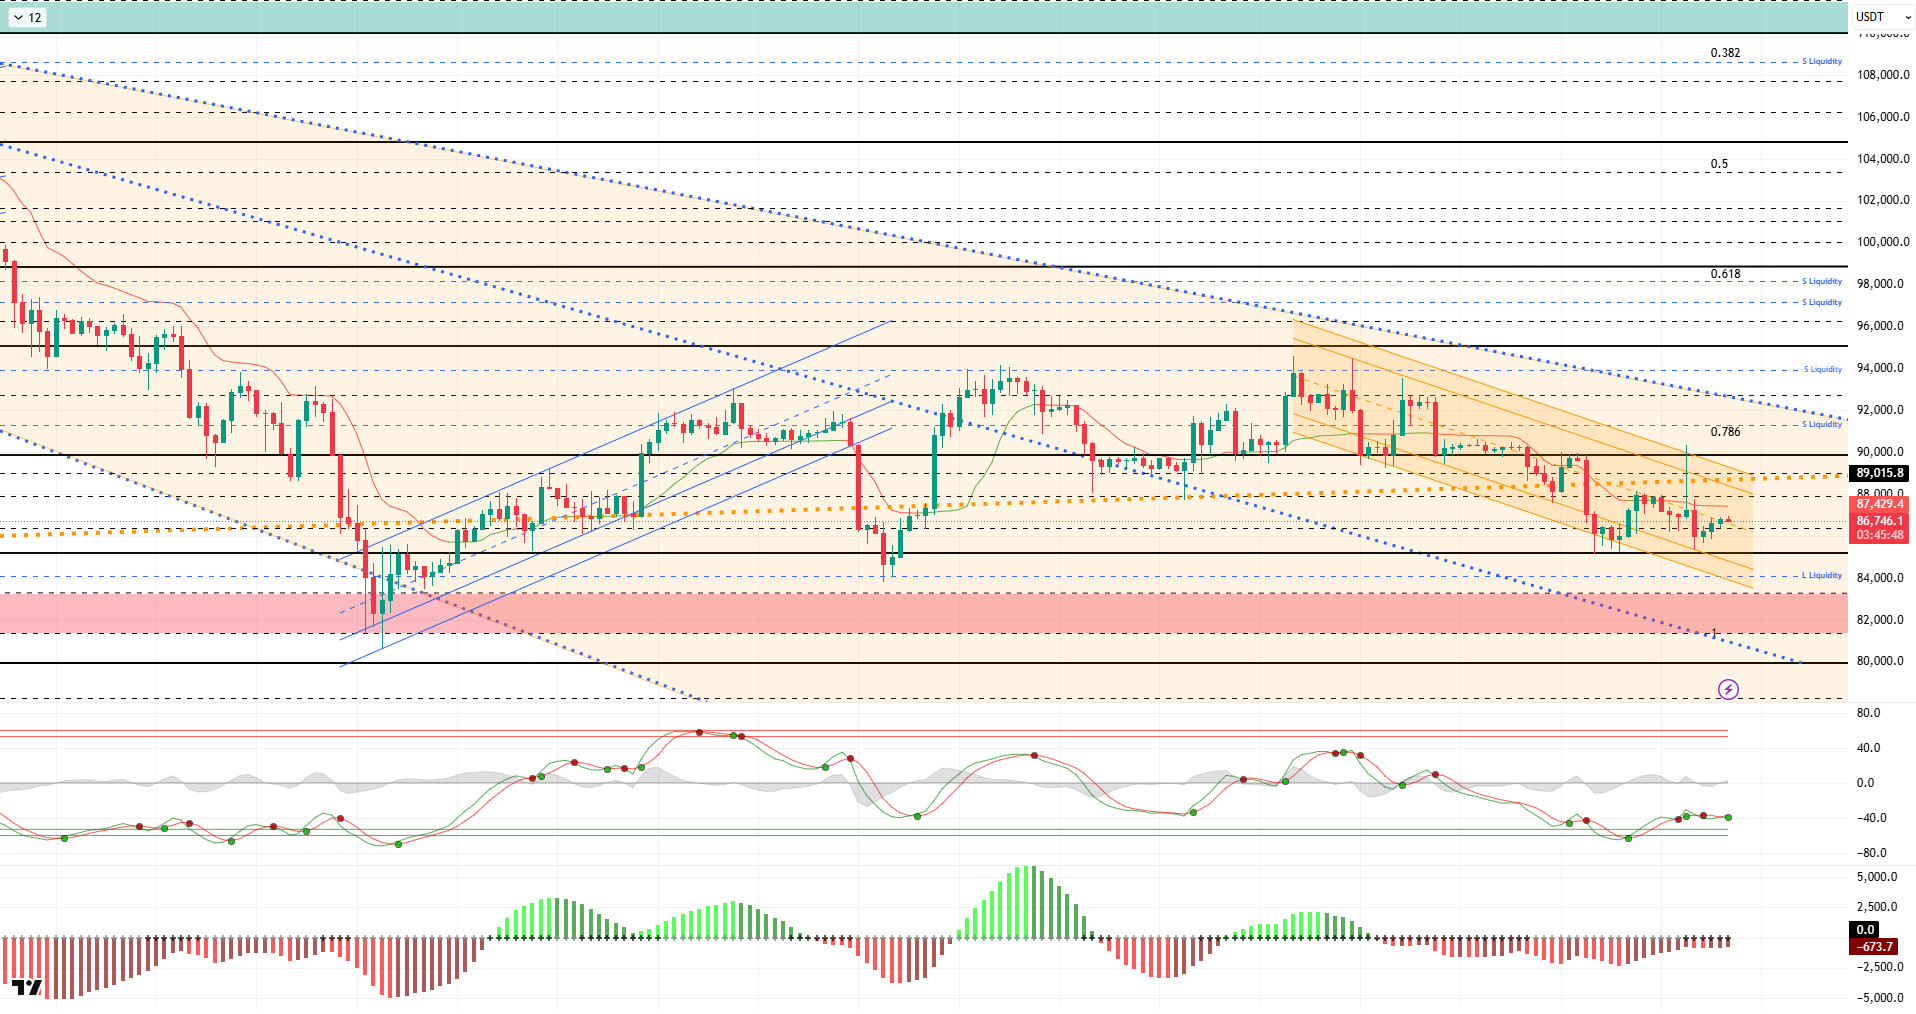
From a technical perspective, after breaking through the middle band of the channel in the previous analysis, BTC hit resistance at 88,000 and retreated slightly. Regaining momentum, the price spiked sharply towards the 90,000 level. With this movement, the price, which had bought liquidity, fell back at the same speed, retreating below the 87,000 level. Following the latest movement, BTC’s price movements continue to be under MM control.
Technical indicators show the Wave Trend (WT) oscillator continuing to display an indecisive picture just above the oversold zone. The histogram on the Squeeze Momentum (SM) indicator is attempting to gain momentum once again within the negative zone. The Kaufman Moving Average (KAMA) is currently moving above the price at the $87,400 level.
When examining the liquidation data, although the recent movement resulted in a short-term sell-off within the 88,000–90,000 range, investors seized this opportunity to accumulate heavily above the 90,000 level. The buy-in level recorded fragmented intensity around 85,000.
In summary, following the release of labor market data in the US economy, the market focused on inflation figures. During this period, Fed members continued to express differing views, reflecting the competitive effect created by Trump’s nominees for Fed chair. Geopolitical risks remain high between the US and Russia, while financial pressures continue in China. The BOJ is preparing for an interest rate hike. Technically, BTC, which retreated to the 80,500 level following the decline after its all-time high (ATH), rebounded strongly from this area. Subsequently, the price settled above the 90,000 level and entered a consolidation phase for a while, then retreated again, falling below the major uptrend line and testing the 85,000 level. An examination of liquidity data reveals that areas with concentrated short-term trading have been targeted, while long-term sell orders have yet to be tested. At this stage, the 85,000 level has become critical for the price to maintain its momentum. Closes and pricing above this level are an important indicator for regaining momentum. In this context, 88,000 stands out as the next target area, and if it is passed, liquidity areas will be monitored again. In the event of a possible selling pressure, the 85,000 level will be monitored as the last obstacle to the price forming a double bottom at the 80,000 level.
Supports: 85,000 – 84,100 – 83,300
Resistances: 86,400 – 88,000 – 89,000
ETH/USDT
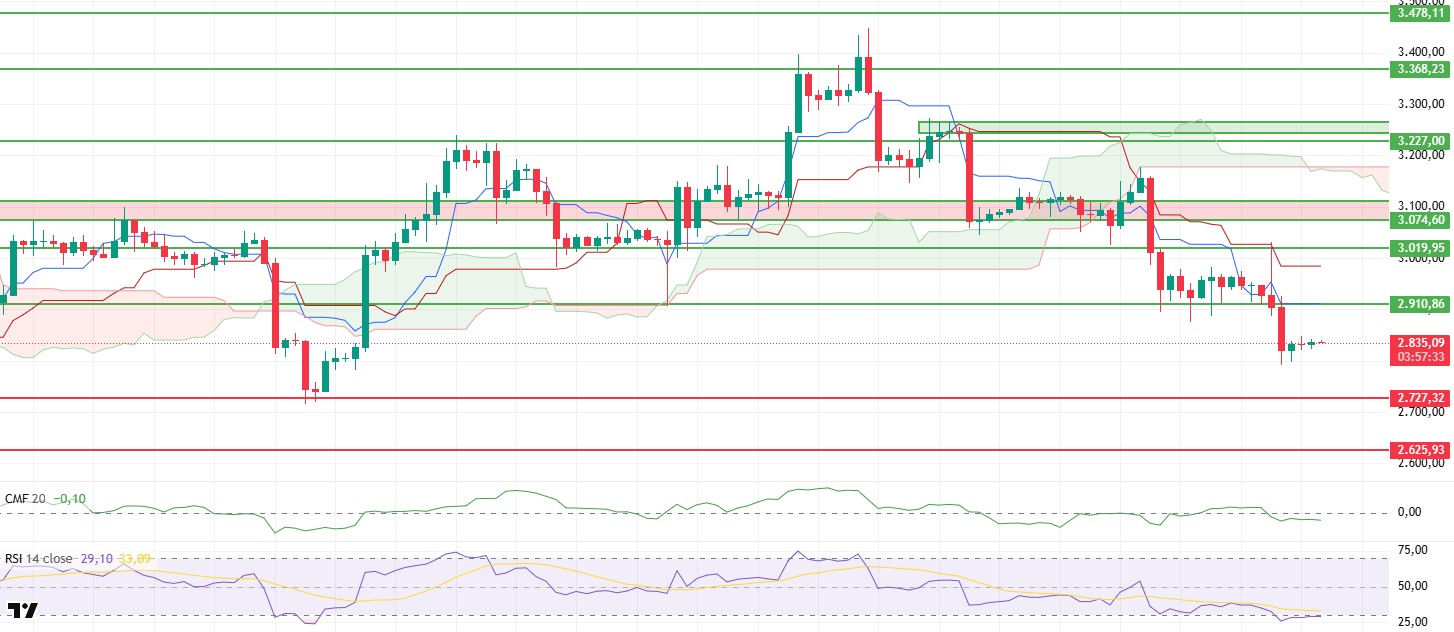
The ETH price was quite volatile yesterday evening, and the picture that emerges is one of the price settling in a weak zone after sharp fluctuations. Yesterday evening, a rapid rise tested the $3,019 resistance level, but this move failed to find strong liquidity support. Subsequent sharp sell-offs caused the $2,910 support level to break downwards, and the decline deepened to below the $2,800 level. A limited rebound occurred in the morning hours, with the price recovering to the $2,835 level, but this movement is currently far from a positive outlook.
Pressure on liquidity continues. The Chaikin Money Flow (CMF) indicator retreating into negative territory and moving sideways indicates that capital inflows remain weak and buyers have yet to establish a secure footing. Unless liquidity inflows gain strength, the risk of upward moves encountering selling pressure remains high.
On the momentum front, the market has reached the oversold zone. The Relative Strength Index (RSI) is moving in the oversold zone, indicating that short-term rebound buying could occur. However, this RSI outlook suggests a technical recovery rather than a strong trend reversal. For a sustained improvement in momentum, the RSI needs to clearly move away from this zone.
The technical structure is quite weak from the Ichimoku indicator perspective. The price continues to trade below the Kumo cloud and the Tenkan and Kijun levels. This positioning indicates that the downtrend remains valid in both the short and medium term and that upward attempts are not technically supported.
On the futures market side, the decline in open interest to $17 billion indicates that positions are being closed and risk appetite is decreasing. However, the funding rate returning to positive territory suggests that long positions are beginning to increase in the short term, but that this is not yet strong enough to push prices higher.
In the current outlook, the $2,910 level is once again a critical threshold. If prices remain below this level, a decline towards the $2,727 level appears likely. Conversely, a return above $2,910 could provide technical relief and pave the way for a renewed positive trend. At this stage, weak liquidity, fragile momentum, and negative technical structure suggest that a cautious approach to ETH should be maintained.
Below the Form
Supports: 2,727 – 2,625 – 2,500
Resistances: 2,910 – 3,019 – 3,074
XRP/USDT
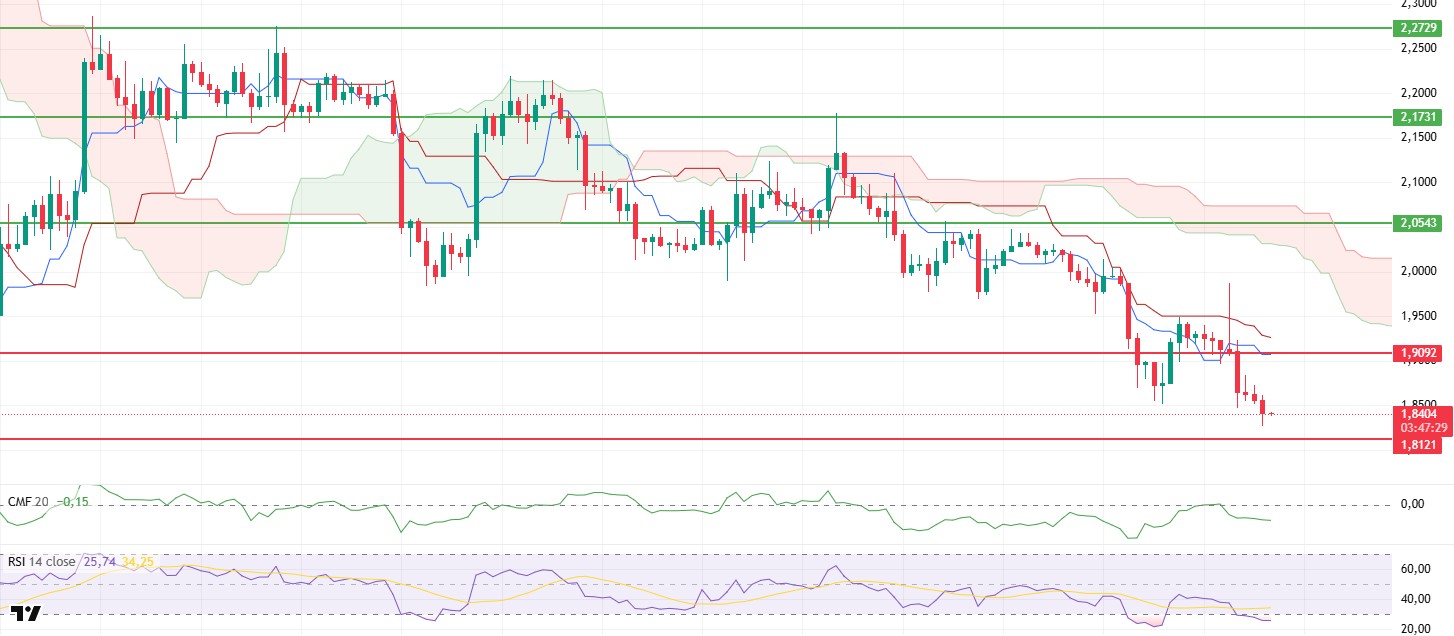
As we enter the morning hours on the XRP front, a picture emerges of significantly increased selling pressure and the price continuing to trade in a weak zone. The rise that reached $1.98 yesterday evening was not sustainable, and with heavy selling from this region, the $1.90 support level was broken downwards. After the break, the decline accelerated, and the price retreated to the $1.82 level. This movement shows that the limited recovery attempts seen in previous days have been completely invalidated and that sellers have clearly regained control.
The liquidity outlook has deteriorated sharply. The Chaikin Money Flow (CMF) indicator has fallen back into negative territory and continues its downward movement. The sharp liquidity outflows indicate that buyers have withdrawn from the market and that there is no strong capital support to counter the decline. As long as liquidity remains this weak, any rebound rallies are expected to be limited and short-lived.
Pressure is also mounting on the momentum front. The Relative Strength Index (RSI) has fallen to oversold territory, confirming a significant loss of momentum. While the RSI’s descent to these levels raises the possibility of a technical rebound in the short term, the current outlook suggests that such rebounds may not be strong enough to trigger a trend reversal. No lasting improvement is yet visible on the momentum front.
The technical structure remains quite weak from the perspective of the Ichimoku indicator. The price is trading well below the Kumo cloud, and the Tenkan and Kijun levels are still very high. This structure indicates that the downtrend remains valid in both the short and medium term and that upward movements are not technically supported.
Downside risks are currently at the forefront. If the price fails to hold around $1.82, a pullback towards the $1.81 level seems likely. Losing this region could cause the downtrend to evolve into a deeper structure. Conversely, if the price regains the $1.90 level, it could weaken the current negative scenario and bring a short-term search for equilibrium to the fore. However, at this stage, liquidity, momentum, and all technical indicators point to a cautious morning chart for XRP.
Supports: 1.8121 – 1.6224 – 1.2596
Resistances: 1.9092 – 2.0543 – 2.1731
SOL/USDT
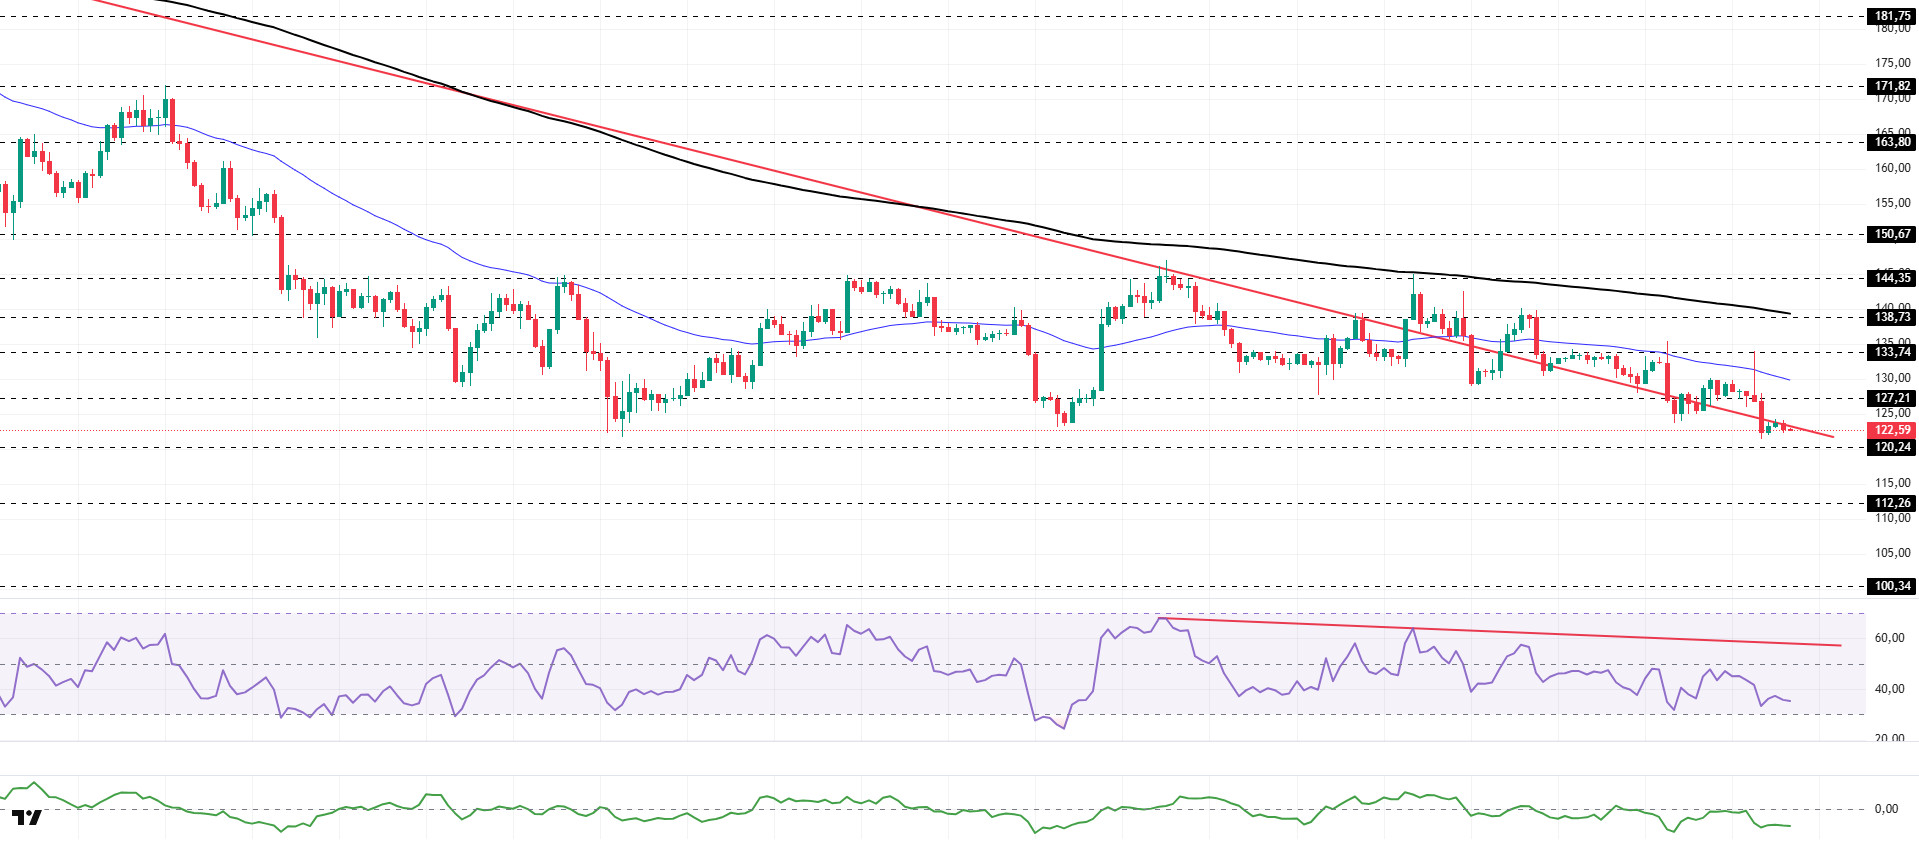
The SOL price experienced a pullback. The asset moved into the lower region of the downtrend that began on October 6. Testing the 50 EMA (Blue Line) moving average, which is a strong resistance level, the price experienced a pullback from here and moved into the lower region of the downtrend. Currently priced below the downward trend line and the 50 EMA (Blue Line) moving average, the asset may test the 50 EMA (Blue Line) moving average as resistance if it experiences an uptrend. If it experiences a pullback, the $120.24 level can be monitored.
On the 4-hour chart, it remained below the 50 EMA (Exponential Moving Average – Blue Line) and 200 EMA (Black Line). This indicates that it may be in a medium-term downtrend. At the same time, the price being below both moving averages indicates that the asset is trending downward in the short term. The Chaikin Money Flow (CMF-20) is in negative territory. However, balanced cash inflows and outflows may keep the CMF in negative territory. The Relative Strength Index (RSI-14) remained in the middle of negative territory. It also continued to stay below the downward trend that began on December 3. This signaled continued selling pressure . In the event of an uptrend driven by macroeconomic data or positive news related to the Solana ecosystem, the $138.73 level stands out as a strong resistance point. If this level is broken upward, the uptrend is expected to continue. In the event of pullbacks due to developments in the opposite direction or profit-taking, the $120.24 level could be tested. A decline to these support levels could increase buying momentum, presenting a potential opportunity for an upward move.
Supports: 120.24 – 112.26 – 100.34
Resistances 127.21 – 133.74 – 138.73
DOGE/USDT
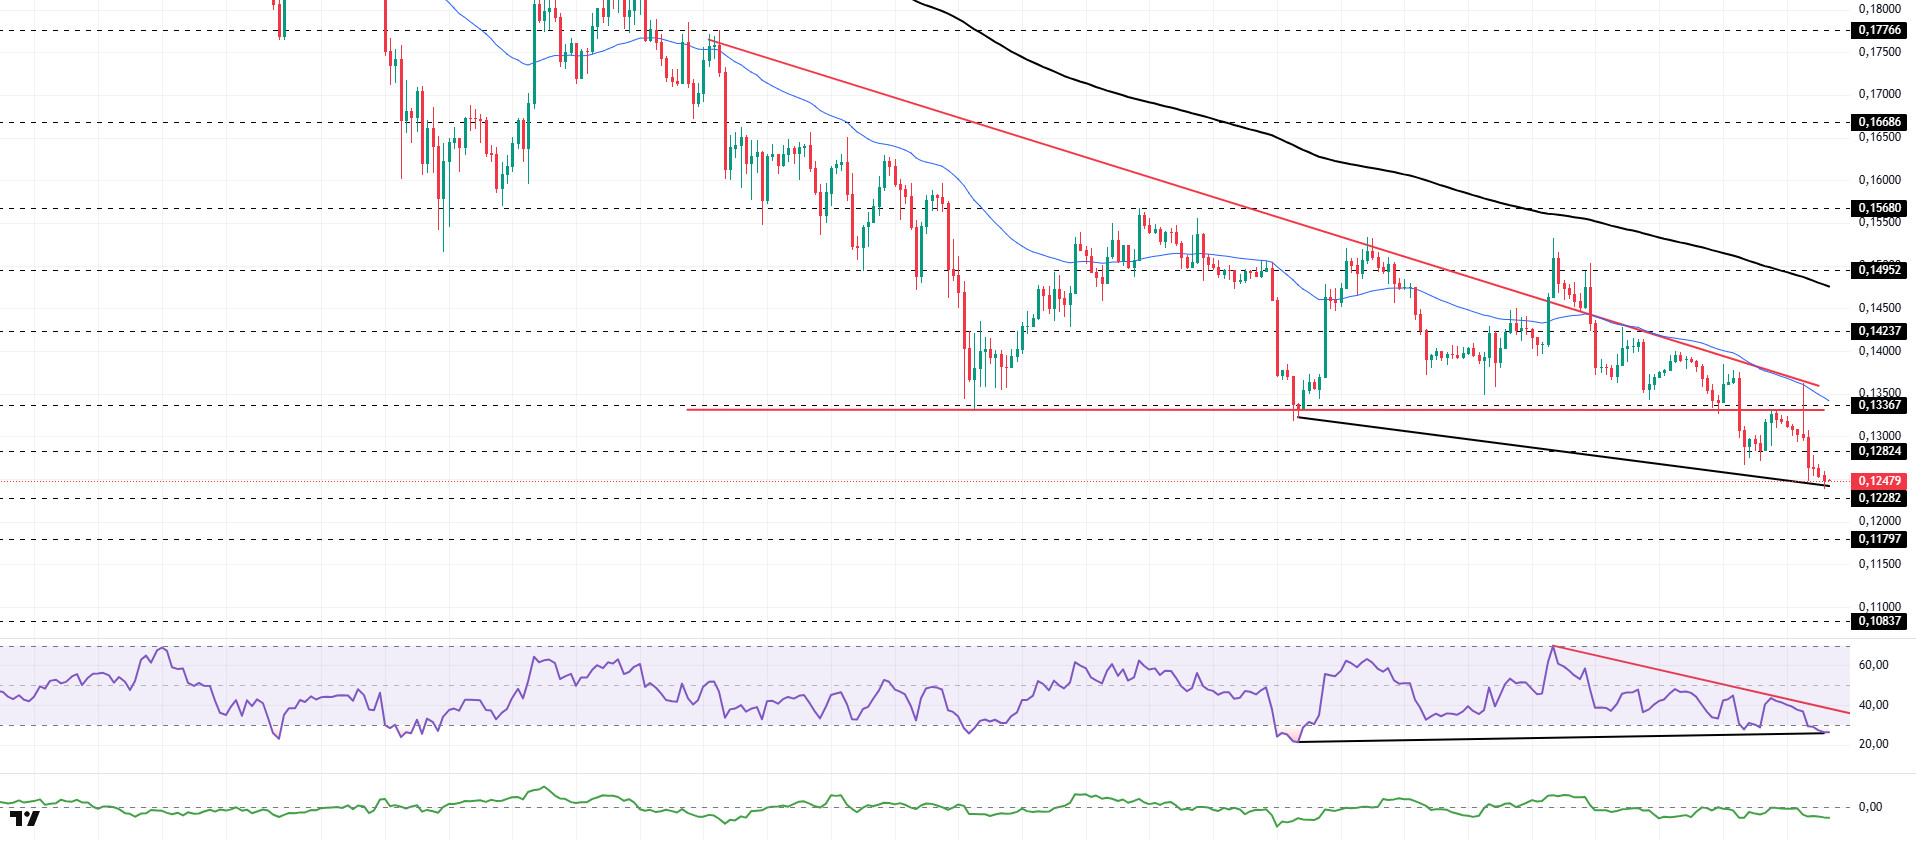
The DOGE price has lost value. The asset experienced a pullback, facing resistance from the base level of the descending triangle formation that began on November 13 and the 50 EMA (Blue Line) moving average. Currently continuing its decline, the asset may test the $0.12282 level as support if the pullback continues. If it experiences an uptrend, it may test the 50 EMA (Blue Line) moving average or the base level of the descending triangle formation as resistance.
On the 4-hour chart, the 50 EMA (Exponential Moving Average – Blue Line) remained below the 200 EMA (Black Line). This indicates that the downtrend may continue in the medium term. The price being below both moving averages indicates a downward trend in the short term. The Chaikin Money Flow (CMF-20) has fallen into negative territory. Additionally, an increase in money outflows could push the CMF deeper into negative territory. The Relative Strength Index (RSI-14) has fallen from the middle of the negative zone to the oversold level. This could trigger profit-taking, allowing the price to rebound. It also remained below the downward trend line that began on December 9. While this signals increased selling pressure, a positive divergence could prompt the price to react upward. In the event of an uptrend driven by political developments, macroeconomic data, or positive news flow in the DOGE ecosystem, the $0.14952 level stands out as a strong resistance zone. Conversely, in the event of negative news flow ( ), the $0.11797 level could be triggered. A decline to these levels could increase momentum and initiate a new wave of growth.
Supports: 0.12282 – 0.11797 – 0.10837
Resistances: 0.12824 – 0.13367 – 0.14237
Legal Notice
The investment information, comments, and recommendations contained herein do not constitute investment advice. Investment advisory services are provided individually by authorized institutions taking into account the risk and return preferences of individuals. The comments and recommendations contained herein are of a general nature. These recommendations may not be suitable for your financial situation and risk and return preferences. Therefore, making an investment decision based solely on the information contained herein may not produce results in line with your expectations.

