
Technical Analysis
BTC/USDT
In November, the US CPI came in below expectations at 2.7% year-on-year, signaling a continued slowdown in inflation alongside limited increases in energy and commodity prices. During the same period, initial jobless claims fell to 224K, indicating that the labor market remains resilient. In Europe, the ECB maintained its cautious stance by keeping the deposit rate steady at 2%, while the Bank of England cut rates for the first time since August 2024, lowering its policy rate to 3.75% and emphasizing the slowdown in inflation and weakening economic activity.
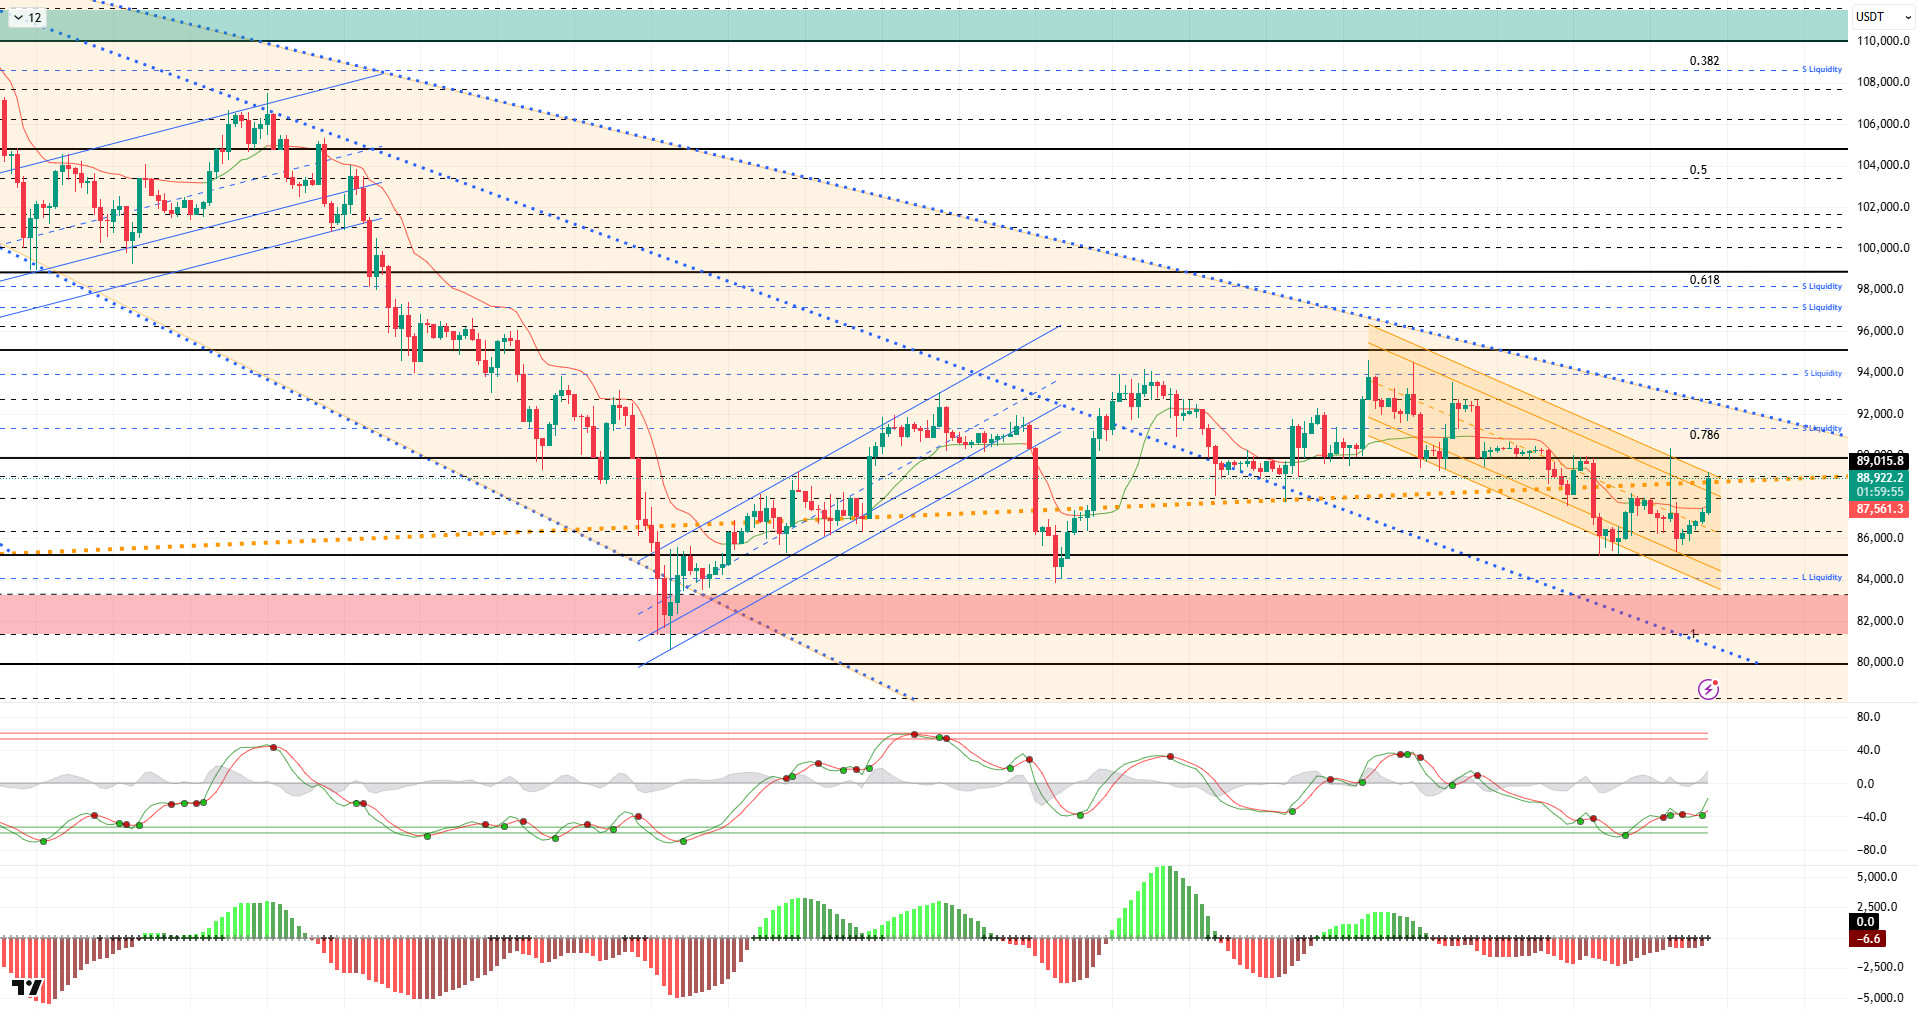
From a technical perspective, although BTC showed low volatility during the day, it gained momentum following the release of the data. Recording a high-volume bullish candle within the downtrend channel, BTC reached the trend extension and returned to the $90,000 level.If the price closes above this level, which is challenging the major uptrend line, it could once again trade above the 90,000 range. Otherwise, the previous upward movement could remain a spike and retreat to the 85,000 reference level.
Technical indicators continue to show indecision just above the oversold zone on the Wave Trend (WT) oscillator. The histogram on the Squeeze Momentum (SM) indicator is attempting to gain momentum once again within the negative zone. The Kaufman Moving Average (KAMA) is currently trading above the price level at $87,400.
When examining liquidation data, although the recent movement saw short-term selling pressure liquidate within the 88,000–90,000 range, investors appear to have seized this movement as an opportunity, creating quite intense accumulation above the 90,000 level. Buying pressure recorded fragmented intensity around the 85,000 level.
In summary, inflation data in the US economy was released well below expectations, along with missing data, indicating that inflationary pressure has weakened. On the other hand, the ECB kept interest rates unchanged today, while the Bank of England cut rates. Technically, BTC continues to trade within a minor downtrend channel, and there has not yet been a catalyst to form a new uptrend channel.Looking at liquidity data, it appears that areas with concentrated short-term trading are being targeted, while long-term sell orders have not yet been tested. At this stage, the 89,000 level has become a critical point for the price to maintain its momentum, as it marks the major uptrend. Closes and price action above this level are important indicators for regaining momentum. In this context, 90,000 emerges as the next target area, and if breached, liquidity zones will be monitored again. In the event of potential selling pressure, the 88,000 level will be monitored as a support area.
Supports: 88,000 – 86,300 – 85,000
Resistances: 89,000 – 90,000 – 91,400
ETH/USDT
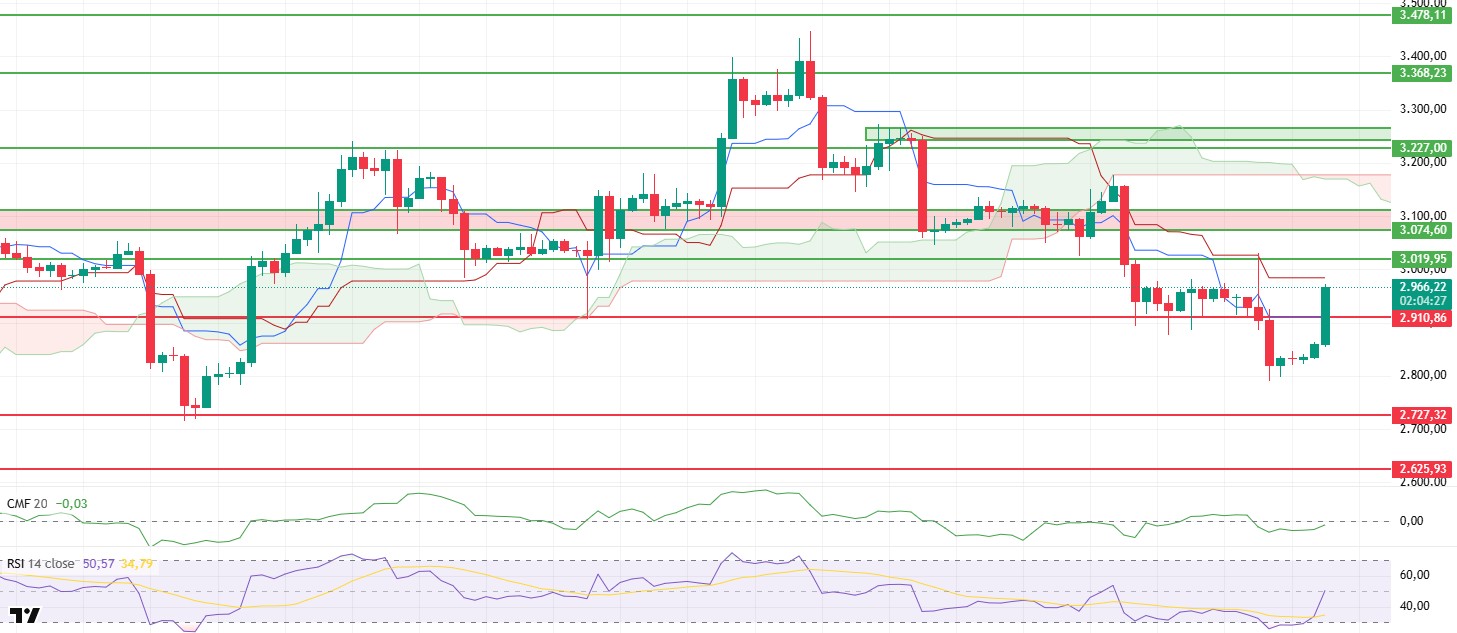
The ETH price showed an upward movement during the day, first reaching the $2,850 level. Following the announcement of the US annual inflation rate at 2.7%, buying accelerated and the price settled above $2,910, rising to around $2,970. This movement indicates that buyers have re-entered the market, at least in the short term, following the sharp sell-offs in recent days.
The liquidity picture has improved somewhat. Although the Chaikin Money Flow (CMF) remains in negative territory, it continues its upward trend. In addition, the positive trend of the Cumulative Volume Delta (CVD) indicator on the spot side shows that the rise is not solely due to long positions opened in the futures markets, but is accompanied by limited liquidity inflows. Since the CMF has not yet crossed into positive territory, it is important to closely monitor whether this flow will develop into a strong trend.
There is a clear strengthening on the momentum side. The Relative Strength Index (RSI) rose rapidly from the oversold zone to above the 50 level. This movement in the RSI indicates that selling pressure has weakened significantly and buyers have begun to take control in the short term. This recovery in momentum has expanded the upward movement range of the price.
The Ichimoku indicator also shows a partial improvement. The price has risen above the Tenkan level and reduced short-term pressure. However, the Kijun level has not yet been surpassed and stands out as an important threshold at around $2,985. If the price remains above this level, the upward trend could become more solid.
In the current outlook, the $2,910 level is a critical support position in the short term. As long as the price remains above this level, upward movements are likely to continue. On the upside, the $3,019 level can be monitored as the first resistance level. If this region is breached, buying activity is expected to accelerate. Conversely, a retest below $2,910 could signal a weakening of the recent rally and a resurgence of selling pressure. The overall picture, along with improvements in the indicators, suggests that upward momentum is regaining strength on the ETH side.
Supports: 2,910 – 2,727 – 2,625
Resistances: 3,019 – 3,074 – 3,227
XRP/USDT
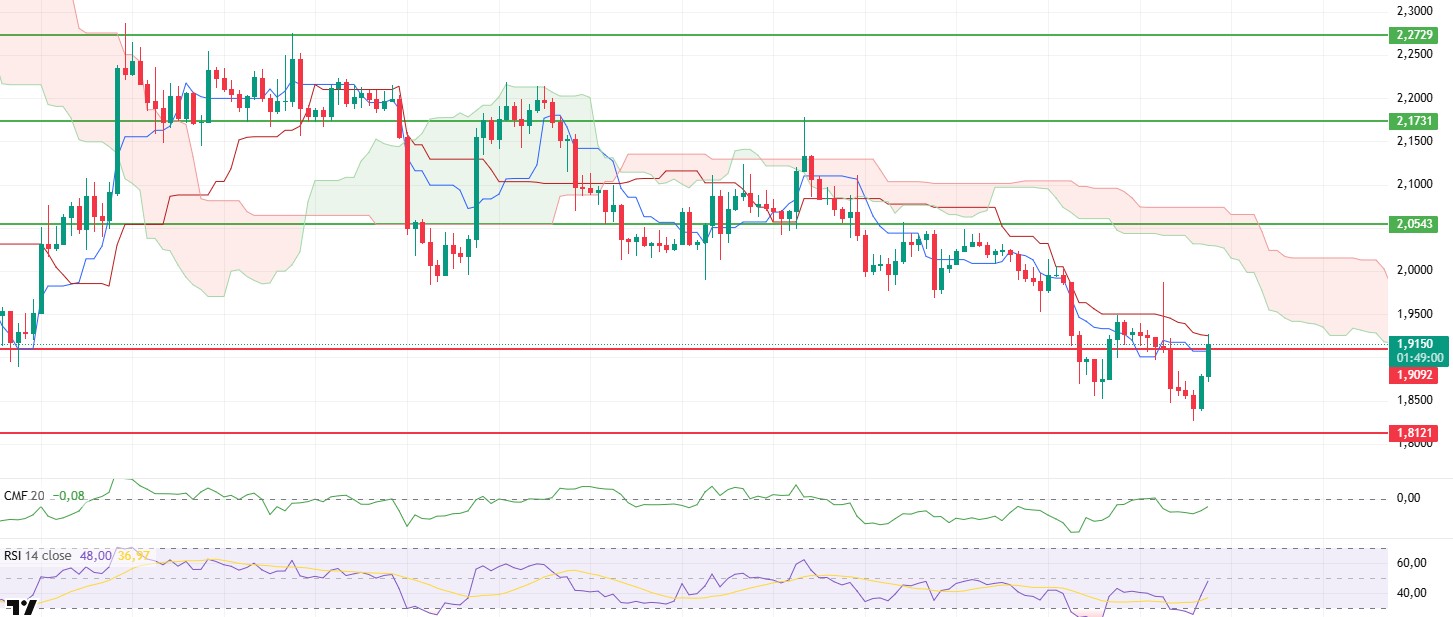
The XRP price saw a strong wave of buying after the US annual inflation rate was announced at 2.7%, recovering its intraday losses and settling back above the $1.90 level. The reversal of the sharp selling mood that prevailed in the morning hours shows that the market reacted quickly to the macro data and that buyers have re-entered the market. The price regaining this level in a short time suggests that the downside scenario has weakened for now.
On the liquidity front, the picture was more positive compared to the first part of the day. Although the Chaikin Money Flow (CMF) is still in negative territory, it has started to move upward. This outlook indicates that there has been a limited re-entry of liquidity into the market and that a search for equilibrium has begun after a period of heavy selling. Whether the CMF continues to move toward the zero line will be decisive for the continuation of the uptrend.
A significant improvement in momentum is noteworthy. The Relative Strength Index (RSI) has made a strong rebound from the oversold zone, rising above the 50 level. This movement in the RSI indicates that selling pressure has largely dissipated and buyers have taken control in the short term. This recovery in momentum is one of the most important factors expanding the upward movement of the price.
The technical outlook also indicates a partial recovery on the Ichimoku indicator. The price managed to rise above the Tenkan level and is currently attempting to break through the Kijun level. If it manages to stay above Kijun, the next stage could see it reach the $2.02 level, which corresponds to the lower band of the kumo cloud. Although it remains below the cloud, these moves indicate that technical pressure is beginning to ease.
The overall picture paints a more positive picture compared to this morning. If the $1.90 level is maintained, the upward trend is likely to continue and the price may test higher levels. Conversely, if this level is lost again, it could lead to a weakening of the intraday rally and a resurgence of selling pressure. Although indicators point to a recovery in XRP as of this evening, price behavior above $1.90 will be decisive in determining the direction.
Supports: 1.9092 – 1.8121 – 1.6224
Resistances: 2.0543 – 2.1731 – 2.2729
SOL/USDT
The SOL price showed a slight increase during the day. The asset moved back above the descending trend line that began on October 6. Testing the strong resistance level of the descending trend line, the price broke through it and gained momentum, increasing in value. Currently priced between the downward trend line and the 50 EMA (Blue Line) moving average, the asset may test the 50 EMA (Blue Line) moving average as resistance if it experiences an uptrend. In the event of a pullback, the $120.24 level could be monitored.
On the 4-hour chart, it continued to remain below the 50 EMA (Exponential Moving Average – Blue Line) and 200 EMA (Black Line). This indicates that it may be in a downtrend in the medium term. At the same time, the price being below both moving averages indicates that the asset is trending downward in the short term. The Chaikin Money Flow (CMF-20) is in negative territory. However, balanced cash inflows and outflows may keep the CMF in negative territory. The Relative Strength Index (RSI-14) remained in the middle of negative territory. It also remained below the downward trend line that began on December 3. This indicates that selling pressure continues. However, positive divergence should be monitored. If there is an upturn due to macroeconomic data or positive news related to the Solana ecosystem, the $138.73 level stands out as a strong resistance point. If this level is broken upwards, the rise is expected to continue. If there are pullbacks due to developments in the opposite direction or profit-taking, the $120.24 level could be tested. If there is a decline to these support levels, an increase in buying momentum could present a potential upside opportunity.
Supports: 120.24 – 112.26 – 100.34
Resistances: 127.21 – 133.74 – 138.73

DOGE/USDT
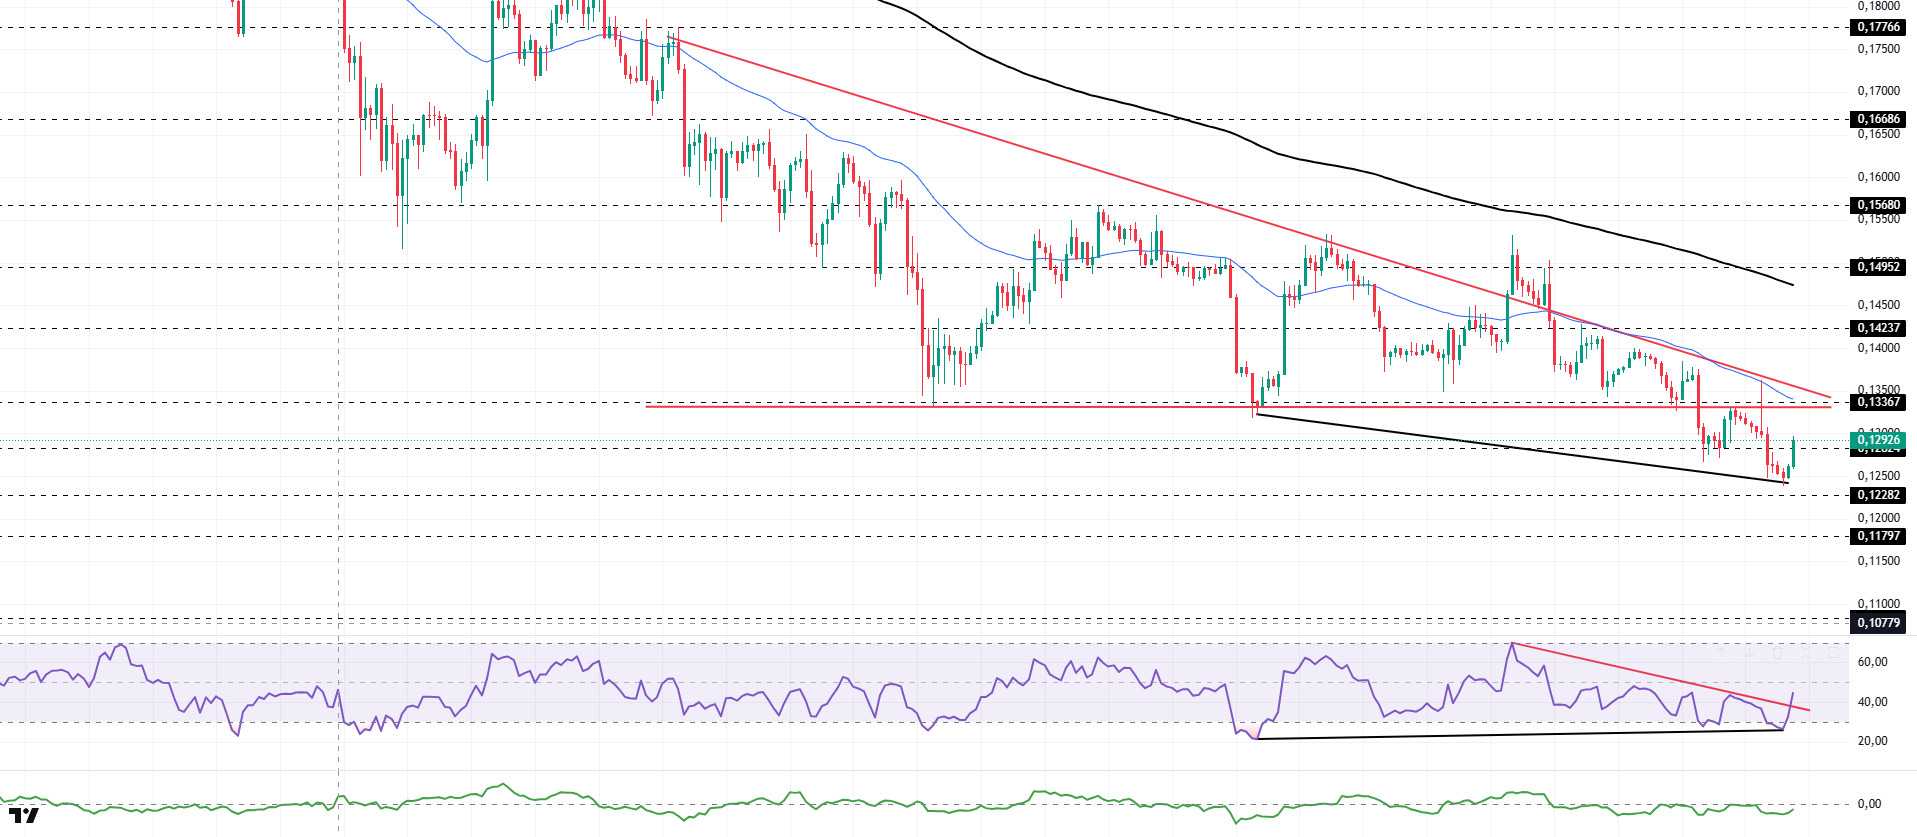
The DOGE price gained value during the day. The asset experienced a pullback, facing resistance from the base level of the descending triangle formation that began on November 13 and the 50 EMA (Blue Line) moving average. Currently testing the $0.12824 level as resistance, the asset may test the base level of the descending triangle formation as resistance if the uptrend continues. If it experiences a pullback, it may test the $0.12282 level as support.
On the 4-hour chart, the 50 EMA (Exponential Moving Average – Blue Line) remained below the 200 EMA (Black Line). This indicates that the downtrend could continue in the medium term. The price being below both moving averages indicates a downward trend in the short term. The Chaikin Money Flow (CMF-20) remained in negative territory. Additionally, a decrease in money outflows could push the CMF deeper into negative territory. The Relative Strength Index (RSI-14) rose from the oversold level in the negative zone to the middle zone. This could lead to profit-taking, allowing the price to recover. At the same time, it is currently testing the resistance level of the downward trend that began on December 9. If it breaks through this level, buying pressure may emerge. On the other hand, positive divergence should be monitored. In the event of an uptrend driven by political developments, macroeconomic data, or positive news flow in the DOGE ecosystem, the $0.14952 level stands out as a strong resistance zone. Conversely, in the event of negative news flow, the $0.11797 level could be triggered. A decline to these levels could increase momentum and initiate a new wave of growth.
Supports: 0.12282 – 0.11797 – 0.10837
Resistances: 0.12824 – 0.13367 – 0.14237
Legal Notice
The investment information, comments, and recommendations contained herein do not constitute investment advice. Investment advisory services are provided individually by authorized institutions taking into account the risk and return preferences of individuals. The comments and recommendations contained herein are of a general nature. These recommendations may not be suitable for your financial situation and risk and return preferences. Therefore, making an investment decision based solely on the information contained herein may not produce results in line with your expectations.

