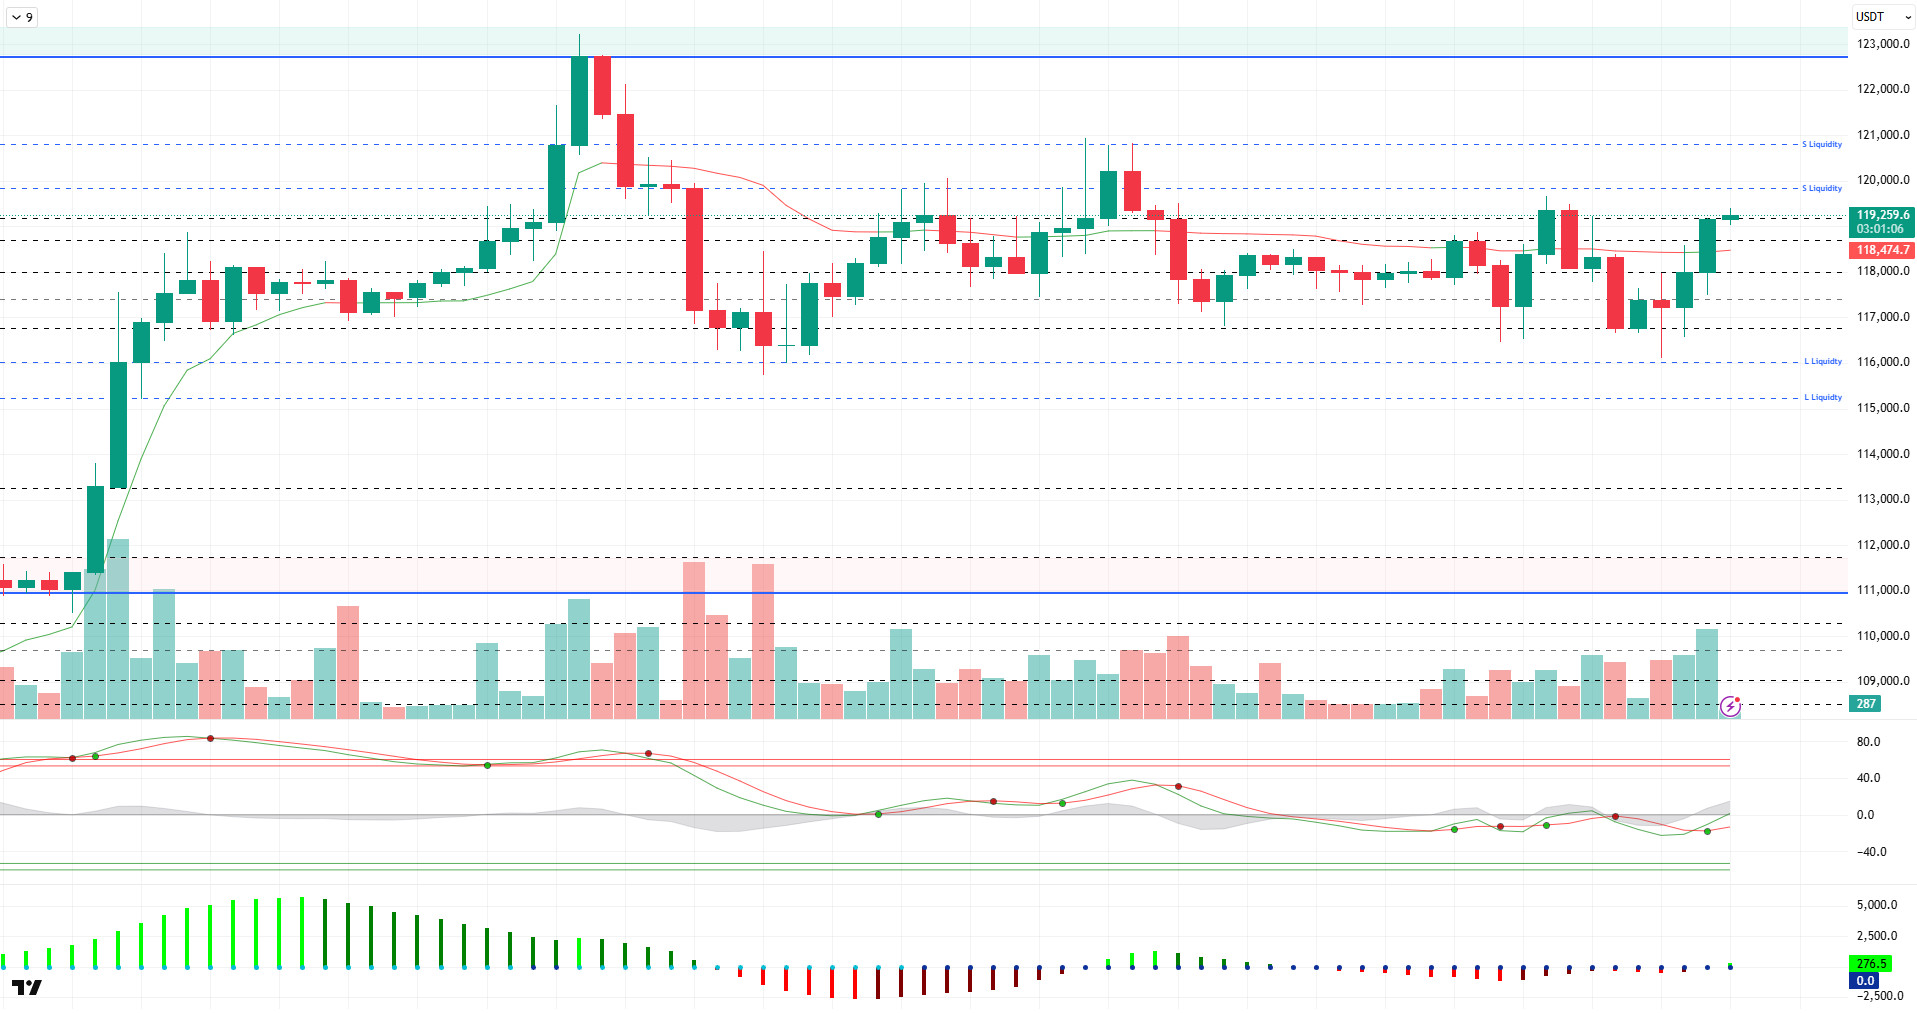
BTC/USDT
In his opening speech at the Fed’s banking conference, Fed Chairman Jerome Powell said that the pieces of the capital framework for large banks need to work in harmony. Powell did not comment on the economic outlook or monetary policy in his speech. US Treasury Secretary Bessent announced that annual customs revenues could reach 300 billion dollars and GDP growth is expected to exceed 3% in the first quarter of 2026. Bessent stated that there is no sign of Powell’s resignation, but he can leave the post if he requests. Strategy announced that it plans to conduct an IPO by issuing 5 million Series A STRC shares and to finance various corporate purposes, including Bitcoin purchases, with the proceeds.
Looking at the technical outlook, BTC price continues to consolidate horizontally near the ATH level. BTC, which has been moving in the 116,000 – 119,000 band for a while, is rebalancing within this range, although it occasionally sags outside these levels. BTC, which pushed 119,000 levels yesterday, fell to 116,000 in the evening hours. Then the recovering price managed to exceed the 117,500 resistance point, gained momentum and came back above the 119,000 level.
Looking at the technical indicators, the Wave Trend (WT) oscillator was indecisive in the mid-band of the channel after the recent decline, but turned upwards once again. The histogram on the Squeeze momentum (SM) indicator regained momentum and moved into positive territory. The Kaufman moving average is below the price at 118.400.
Analysing the liquidity data, the liquidation of heavy buying positions at the 116,000 level with the recent decline took place, while another buying tier continues to accumulate at the 115,000 level. In the selling tier, the sparseness of short-term transactions is noteworthy, while the long term continues to accumulate in the 119,000 – 123,000 band.
In summary, the price continues to consolidate near the ATH level as fundamental developments continue to contribute positively to pricing. While the technical outlook is unstable in the short term, causing horizontal movements, liquidity data determine the limits of price movements. In the continuation of the rise, closures above the 120,000 minor resistance point are followed, while new ATH levels may come to the agenda in case of a break. In a possible selling pressure, closures below the 118,600 support level may lead the price towards the 115,000 level.
Supports 118,600 – 117,500 – 116,800
Resistances 120,000 – 121,000 – 123,300
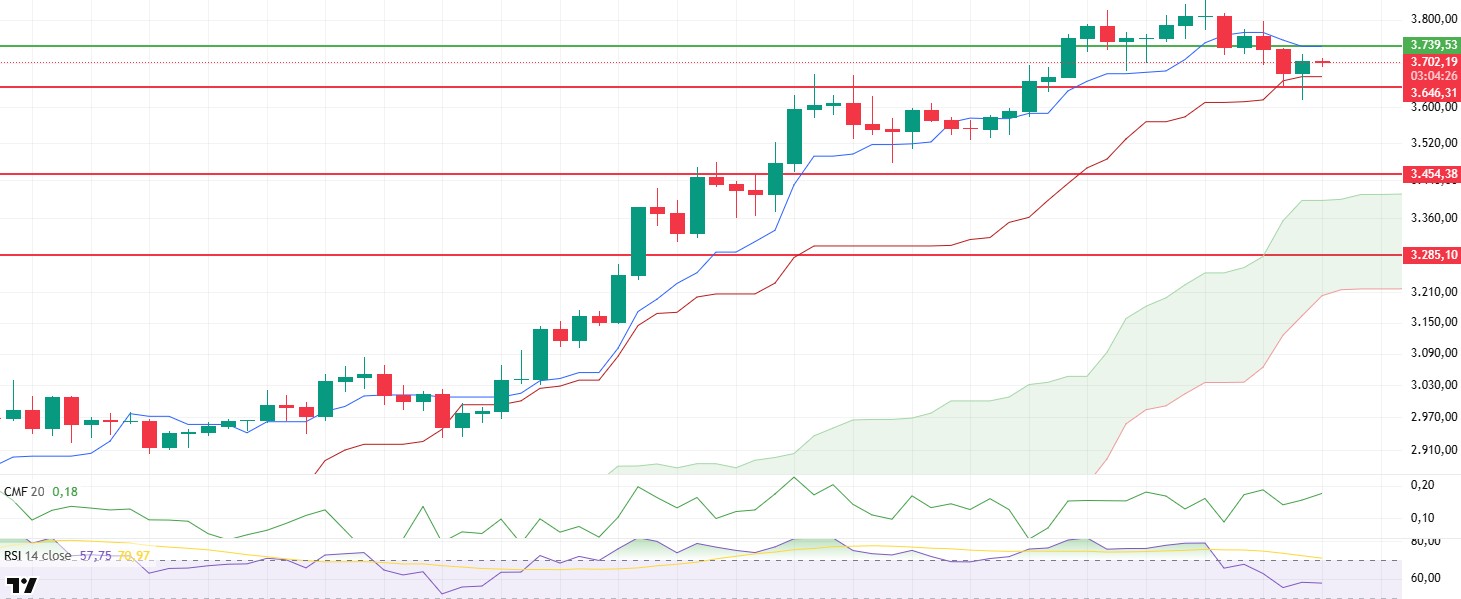
ETH/USDT
ETH price broke down the support zone at $3,646 during the day and retreated to $3,617. However, with the reaction purchases from this region, the price rebounded and rose to $3,700. While this rise indicates that especially short-term investors maintain their appetite for buying, it is seen that there is still a strong liquidity flow in the market despite the high volatility. Technical indicators support this situation. The fact that the Chaikin Money Flow (CMF) indicator remains in positive territory and continues its upward trend indicates that the capital entering the market continues to increase and the buy side is still dominant.
When the Ichimoku indicator is analyzed, it is seen that the price is still priced above the kijun level. This continues to paint a positive picture, especially in terms of the short-term technical outlook. As long as it stays above the kijun level, the upward trend can be expected to be maintained. On the other hand, the Relative Strength Index (RSI) indicator is showing a horizontal movement with support at 55. The fact that the RSI is out of the overbought zone and holding at balanced levels indicates that the upside potential is technically sustainable and a suitable ground is being prepared for a new wave of buying.
In the light of this data, the possibility of a rebound in the price towards $3,800 is technically strong, provided that the support at $3,646 is maintained. However, if this support level is lost, the market may enter a deeper correction in the short term, which may cause the price to retreat to the $3,450 level. Therefore, for investors, the $3,646 level stands out as a critical threshold in terms of both direction and risk management.
Supports 3,646 – 3,455 – 3,285
Resistances 3,739 – 4,084 – 4,381
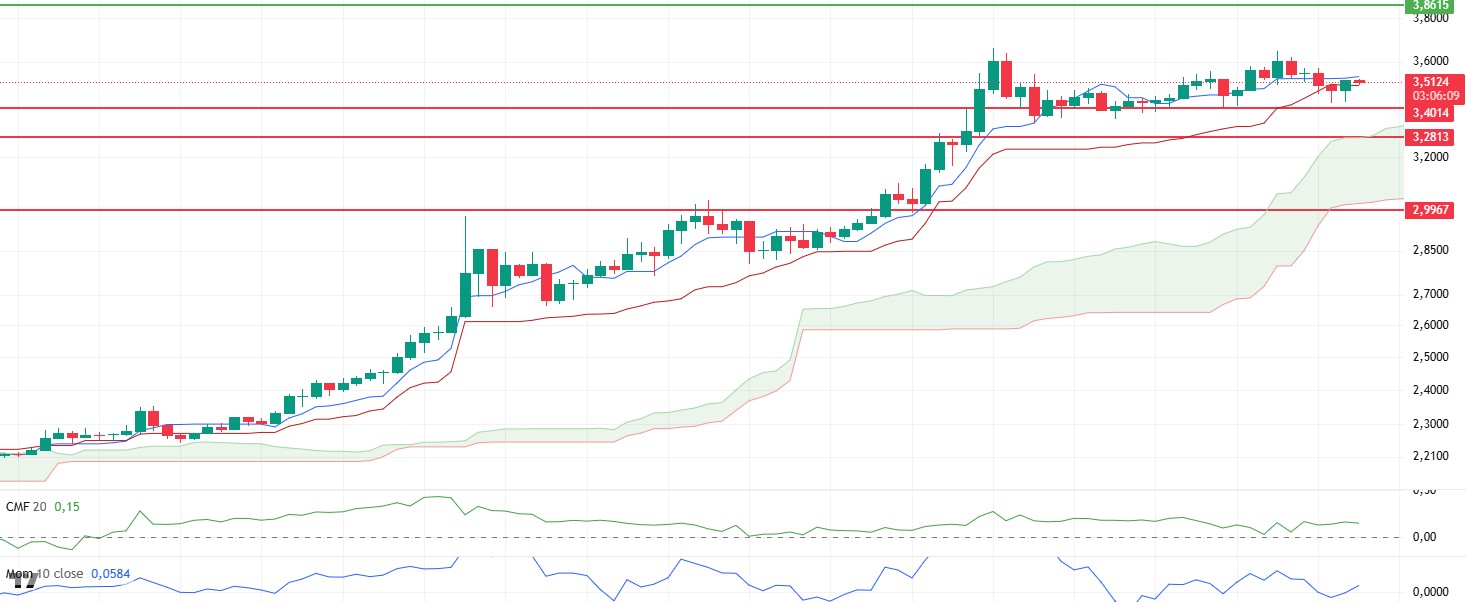
XRP/USDT
XRP price retreated to the level of $3.42 during the day due to the effect of selling pressure. However, with the increasing purchases from this point, the price managed to recover strongly and rise above the $3.50 level again. This rise shows that especially short-term investors are turning to opportunity buying and the market is reacting from an important support level. During this volatile price action, technical indicators suggest that the overall market structure remains positive.
When the Chaikin Money Flow (CMF) indicator is analyzed, it is seen that the indicator continues its horizontal course in the positive zone despite the sharp retracement of the price. This structure reveals that liquidity inflows are still ongoing, albeit not fully strong, and structurally, buyer interest in the market is maintained. CMF’s holding in the positive area confirms that external capital inflows are still continuing during the price recovery process.
In terms of the Ichimoku indicator, it is noteworthy that the price briefly dipped below the kijun level but quickly rebounded back above it. This suggests that the market has rejected the declines in the short term and the technical buying bias is still strong. The recovery of the kijun level should be considered as a positive signal, especially in terms of short-term direction.
In this process, it is seen that there is a noticeable recovery on the momentum side along with the upward movement of the price. This strengthening in momentum indicates that the uptrend may continue in the short term.
As a result, it seems possible that XRP may test the $3.60 level once again in the evening hours as the price continues its recovery trend. However, in order for this scenario to remain valid, it is critical to maintain the $3.40 level strongly. If this level is broken downwards, it is possible that the declines will accelerate and continue until the support of 3.28 dollars.
Supports 3.4014 – 3.2813 – 2.9967
Resistances 3.8615 – 4.000 – 4.4000
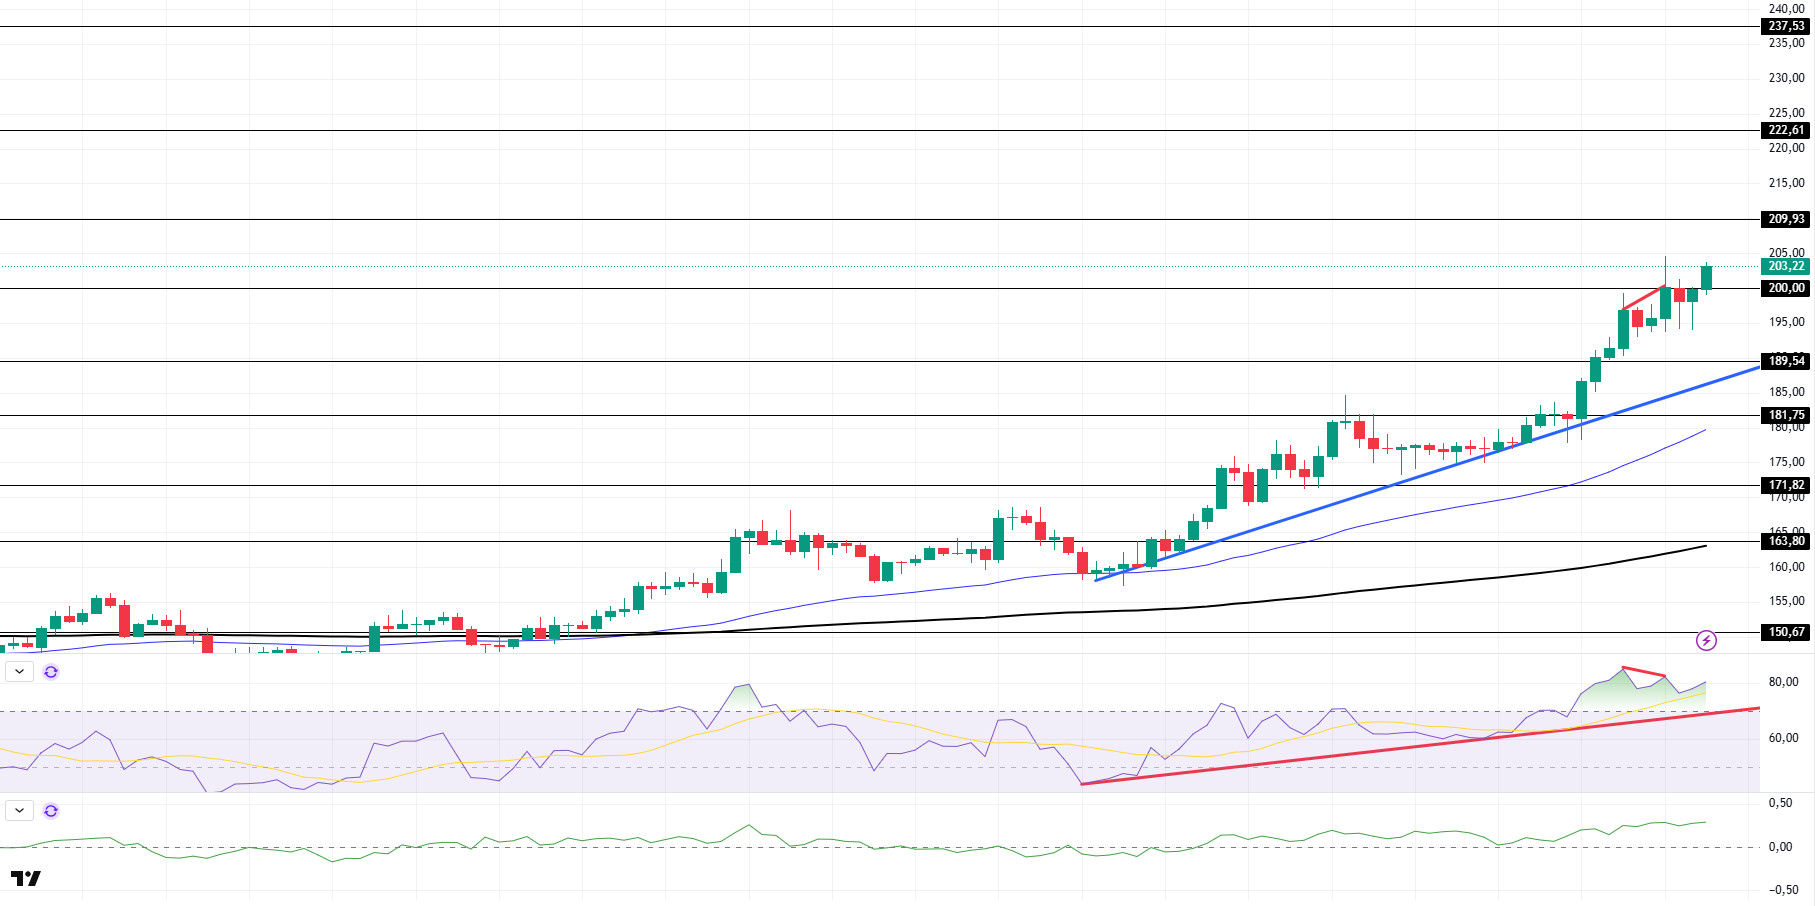
SOL/USDT
The SOL price was flat during the day. The asset continues to remain above the uptrend that started on July 15. Accelerating upwards from the uptrend, the price broke the $189.54 level, supported by the $171.82 level, and hit resistance at the $200.00 level and retreated from there. The price, which is currently testing this as resistance again, may test the $ 209.93 level if the rise continues.
On the 4-hour chart, the 50 EMA (Blue Line) continues to be above the 200 EMA (Black Line). This suggests that the bullish trend may continue in the medium term. At the same time, the fact that the price is above both moving averages suggests that the market is currently in a bullish trend in the short term. On the other hand, a large difference between the two moving averages may trigger a bearish or sideways trend. Chaikin Money Flow (CMF-20) remained in positive territory. However, a decrease in money inflows may move CMF into negative territory. Relative Strength Index (RSI-14), on the other hand, continues to be in positive territory and is in overbought territory. However, selling pressure has emerged. However, a negative mismatch has formed. This may bring a decline. In addition, it remained above the uptrend that started on July 15. The $209.93 level stands out as a strong resistance point in case of an uptrend on the back of macroeconomic data or positive news on the Solana ecosystem. If this level is broken upwards, the rise can be expected to continue. If there are pullbacks due to contrary developments or profit realizations, the $ 181.75 level can be tested. In case of a decline to these support levels, the increase in buying momentum may offer a potential bullish opportunity.
Supports 189.54 – 181.75 – 171.82
Resistances 200.00 – 209.93 – 222.61
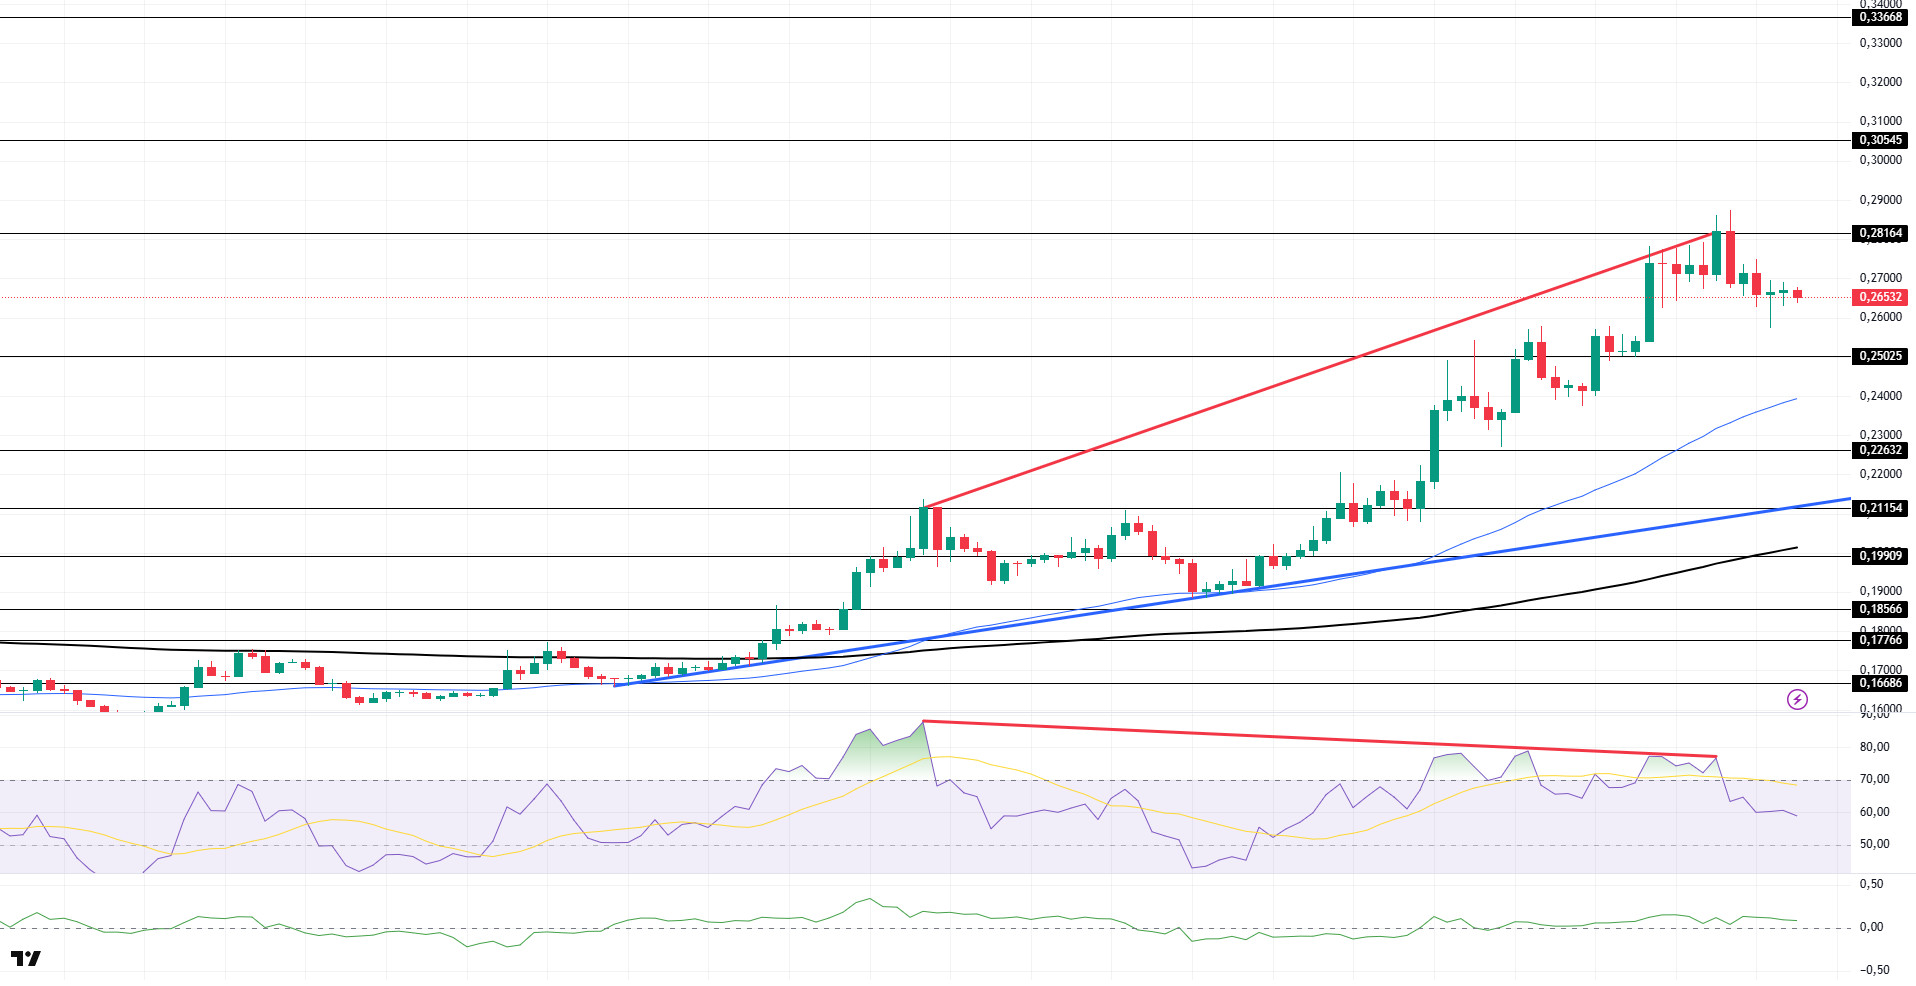
DOGE/USDT
DOGE price continued to decline during the day. The asset continued to stay above its 200 EMA (Black Line) and 50 EMA (Blue Line) moving averages in an uptrend that started on July 7. Breaking the strong resistance at $0.25025, the asset tested the $0.28164 level but failed to sustain its momentum and started to retreat from there. In case of a continuation of the retreat, the $ 0.25025 level should be followed. If the upward acceleration starts again, it may test the $ 0.30545 level.
On the 4-hour chart, the 50 EMA (Blue Line) continues to be above the 200 EMA (Black Line). This suggests that the asset is bullish in the medium term. The fact that the price is above both moving averages suggests that the asset is bullish in the short term. A large difference between the two moving averages may cause the price to follow a bearish or sideways trend. Chaikin Money Flow (CMF-20) continued to be in positive territory. In addition, negative money inflows may move CMF into negative territory. Relative Strength Index (RSI-14) retreated to the middle of the positive zone. At the same time, selling pressure continues. In addition, there is a regular divergence pattern. This may cause the price to fall further. The $0.30545 level stands out as a strong resistance zone in case of a rally in line with political developments, macroeconomic data or positive news flow in the DOGE ecosystem. In the opposite case or possible negative news flow, the $0.25025 level may be triggered. In case of a decline to these levels, the momentum may increase and a new bullish wave may start.
Supports 0.25025 – 0.22632 – 0.21154
Resistances 0.28164 – 0.30545 – 0.33668
Legal Notice
The investment information, comments and recommendations contained herein do not constitute investment advice. Investment advisory services are provided individually by authorized institutions taking into account the risk and return preferences of individuals. The comments and recommendations contained herein are of a general nature. These recommendations may not be suitable for your financial situation and risk and return preferences. Therefore, making an investment decision based solely on the information contained herein may not produce results in line with your expectations.