
Technical Analysis
BTC/USDT
The strong increase in non-farm payrolls and the decline in jobless claims show that the labor market remains resilient despite signs of weakening, while the rise in the unemployment rate keeps the soft landing debate alive. Despite this picture, the market continues to price in the possibility of a Fed rate cut at its December meeting.
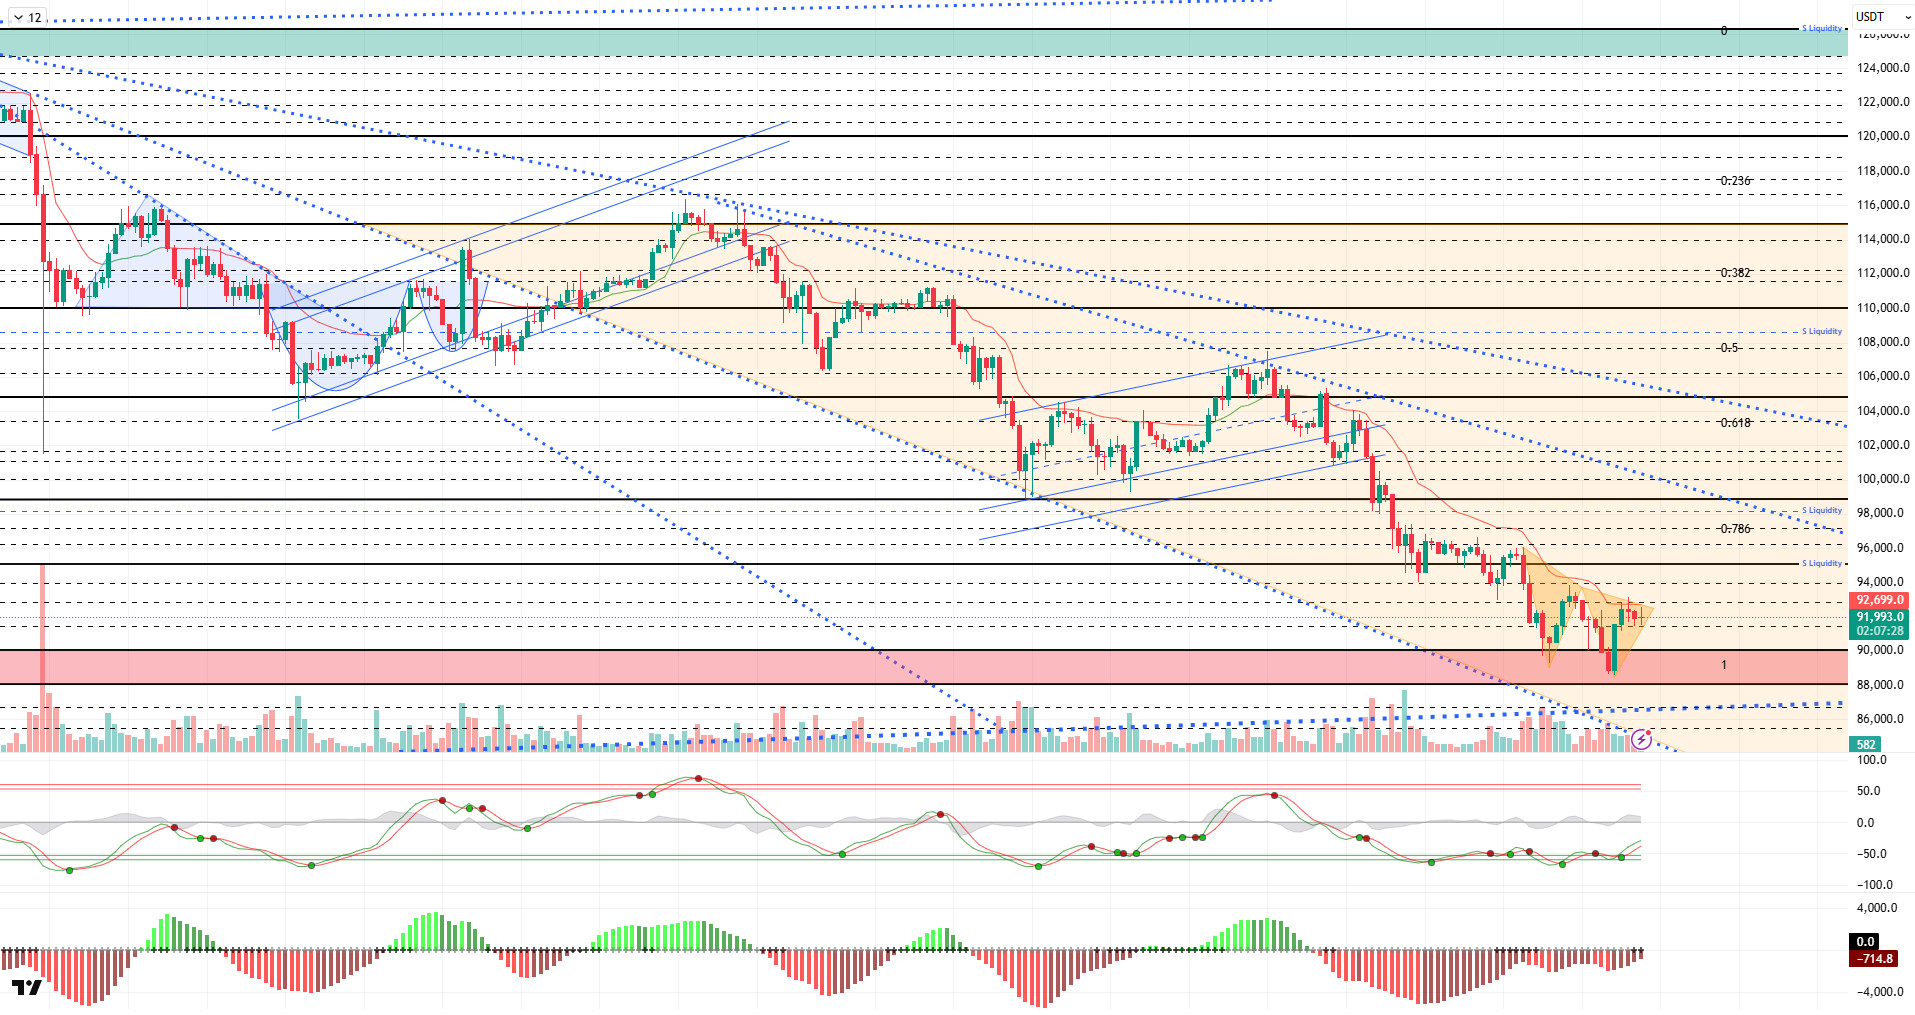
From a technical perspective, BTC continues to maintain its rise after the second dip level, while appearing to be stuck in a horizontal range. At the time of writing, the price is trading at $91,700, searching for direction.
Technical indicators show that the Wave Trend (WT) oscillator, after an indecisive buy/sell signal, has turned upward from the oversold zone by giving a buy signal. The histogram on the Momentum (SM) indicator is attempting to regain strength after reaching maximum weakness within the negative zone. The Kaufman Moving Average (KAMA) is currently positioned above the price at the $92,700 level.
According to liquidation data, although the buy level occasionally tries to gain traction around 89,000, it results in liquidation due to the price’s volatile movements. In contrast, the sell levels maintain their intensity at the 94,000 level, while intense accumulation continues within the 97,000-98,000 band.
In summary, while disagreements over December interest rate cut expectations in the Fed minutes and pressure from geopolitical developments came to the fore, US unemployment data came in above expectations. Nvidia’s strong earnings report was the key factor driving the price. Technically, the price continued its downward momentum, pulling the new low to 88,500. Liquidity data indicates that sell-heavy positions continue to dominate. Going forward, closing above the 90,000 level will be critical for the price to gain momentum, and the 93,700 resistance level will be monitored once again in an upward movement. In the event of potential selling pressure, the 90,000 level emerges as a critical reference area, and in the event of a breakout, the 88,500 bottom zone will be monitored.
Supports: 90,000 – 89,000 – 88,100
Resistances: 91,400 – 92,600 – 93,700
ETH/USDT
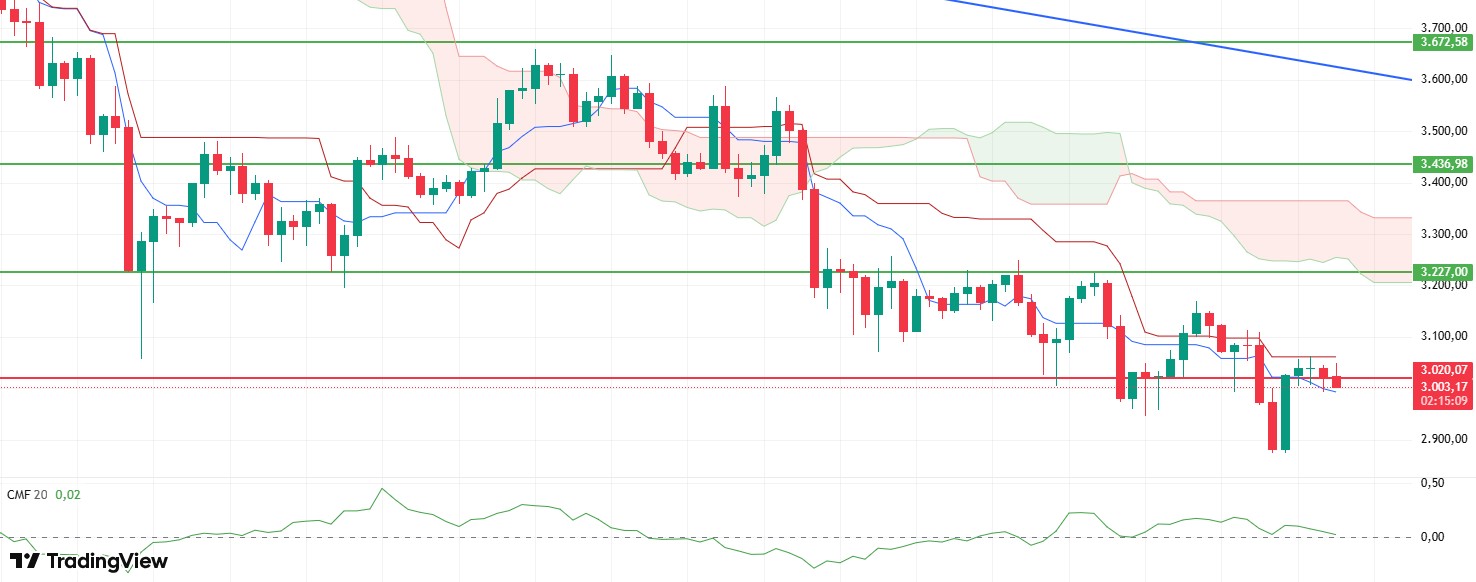
The ETH price moved within a narrow range during the day, gaining upward momentum initially due to the impact of NFP and unemployment data from the US, rising to the $3,050 level. However, this reaction was short-lived, and the price subsequently fell back to the $3,000 level amid selling pressure. Despite data-driven volatility, the price’s attempt to stabilize in this region indicates that the market is still searching for direction.
Although the Chaikin Money Flow (CMF) indicator experienced a slight pullback during the day, it is noteworthy that the indicator remains in positive territory. The fact that liquidity flow remains intact indicates that selling pressure is limited for now and buyers have not completely withdrawn from the market. This structure keeps alive the possibility of continued upward reactions in the short term.
The Relative Strength Index (RSI) indicator continues to look weak. The lack of significant momentum suggests that the price may struggle at times in its upward attempts.
When examining the Ichimoku indicator, it is seen that the price is still stuck between the Tenkan and Kijun levels. This structure suggests that there is no clear direction and that the market is in a decision phase. Unless sustainability is achieved above the Kijun level, it may be difficult for short-term positive signals to strengthen.
If the price manages to hold above the $3,020 level in the evening hours, positive momentum is likely to continue, and attempts to rise back toward the $3,050 to $3,115 range may be seen. However, closing below this level could weaken the outlook and pave the way for a steeper decline. Therefore, the $3.020 level is particularly critical for determining the short-term direction.
Supports: 3,020 – 2,760 – 2,550
Resistances: 3,227 – 3,436 – 3,672
XRP/USDT
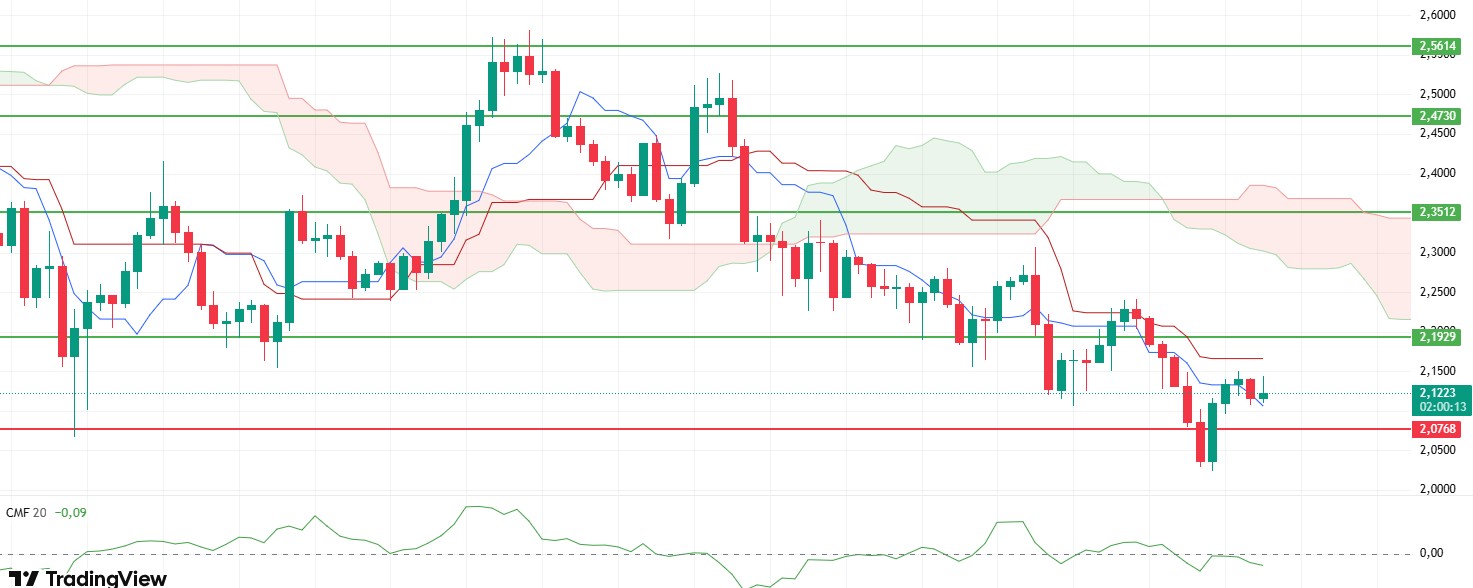
The XRP price moved within a narrow range throughout the day, gaining a short-term upward momentum amid volatility caused by NFP and unemployment data from the US, rising to the $2.15 level. However, this buying reaction was not sustained, and the price quickly retreated, experiencing a correction towards the $2.12 level. This market structure, which is seeking direction amid the impact of the data, presents an unstable outlook in the short term.
The Chaikin Money Flow (CMF) indicator remaining in negative territory and showing a downward trend indicates that liquidity outflows from the market are continuing, albeit at a slight pace. This scenario suggests that the buying side is struggling to gain strength and that short-term upward movements may remain limited.
The morning analysis outlook for the Relative Strength Index (RSI) remains largely unchanged. The lack of a significant increase in momentum serves as a reminder to approach short-term pricing cautiously. The RSI’s tight appearance indicates that the market has yet to establish sufficient groundwork for a strong change in direction.
The Ichimoku indicator shows that the price is maintaining its squeeze structure between the Tenkan and Kijun levels. This structure indicates that the market is seeking equilibrium before establishing a clear direction. The price’s struggle to rise above the Kijun level reveals that medium-term pressure persists and that the main trend cannot be considered positive as long as it remains below the cloud.
In the short-term outlook, the $2.07 level remains the most critical support. As long as the price stays above this level, rebound buying may continue, and the $2.15 region could be retested. However, closes below $2.07 could deepen the weak structure and push the price back toward the $2.02 region.
Supports: 2.0768 – 1.9092 – 1.7729
Resistances: 2.1929 – 2.3512 – 2.4730
SOL/USDT
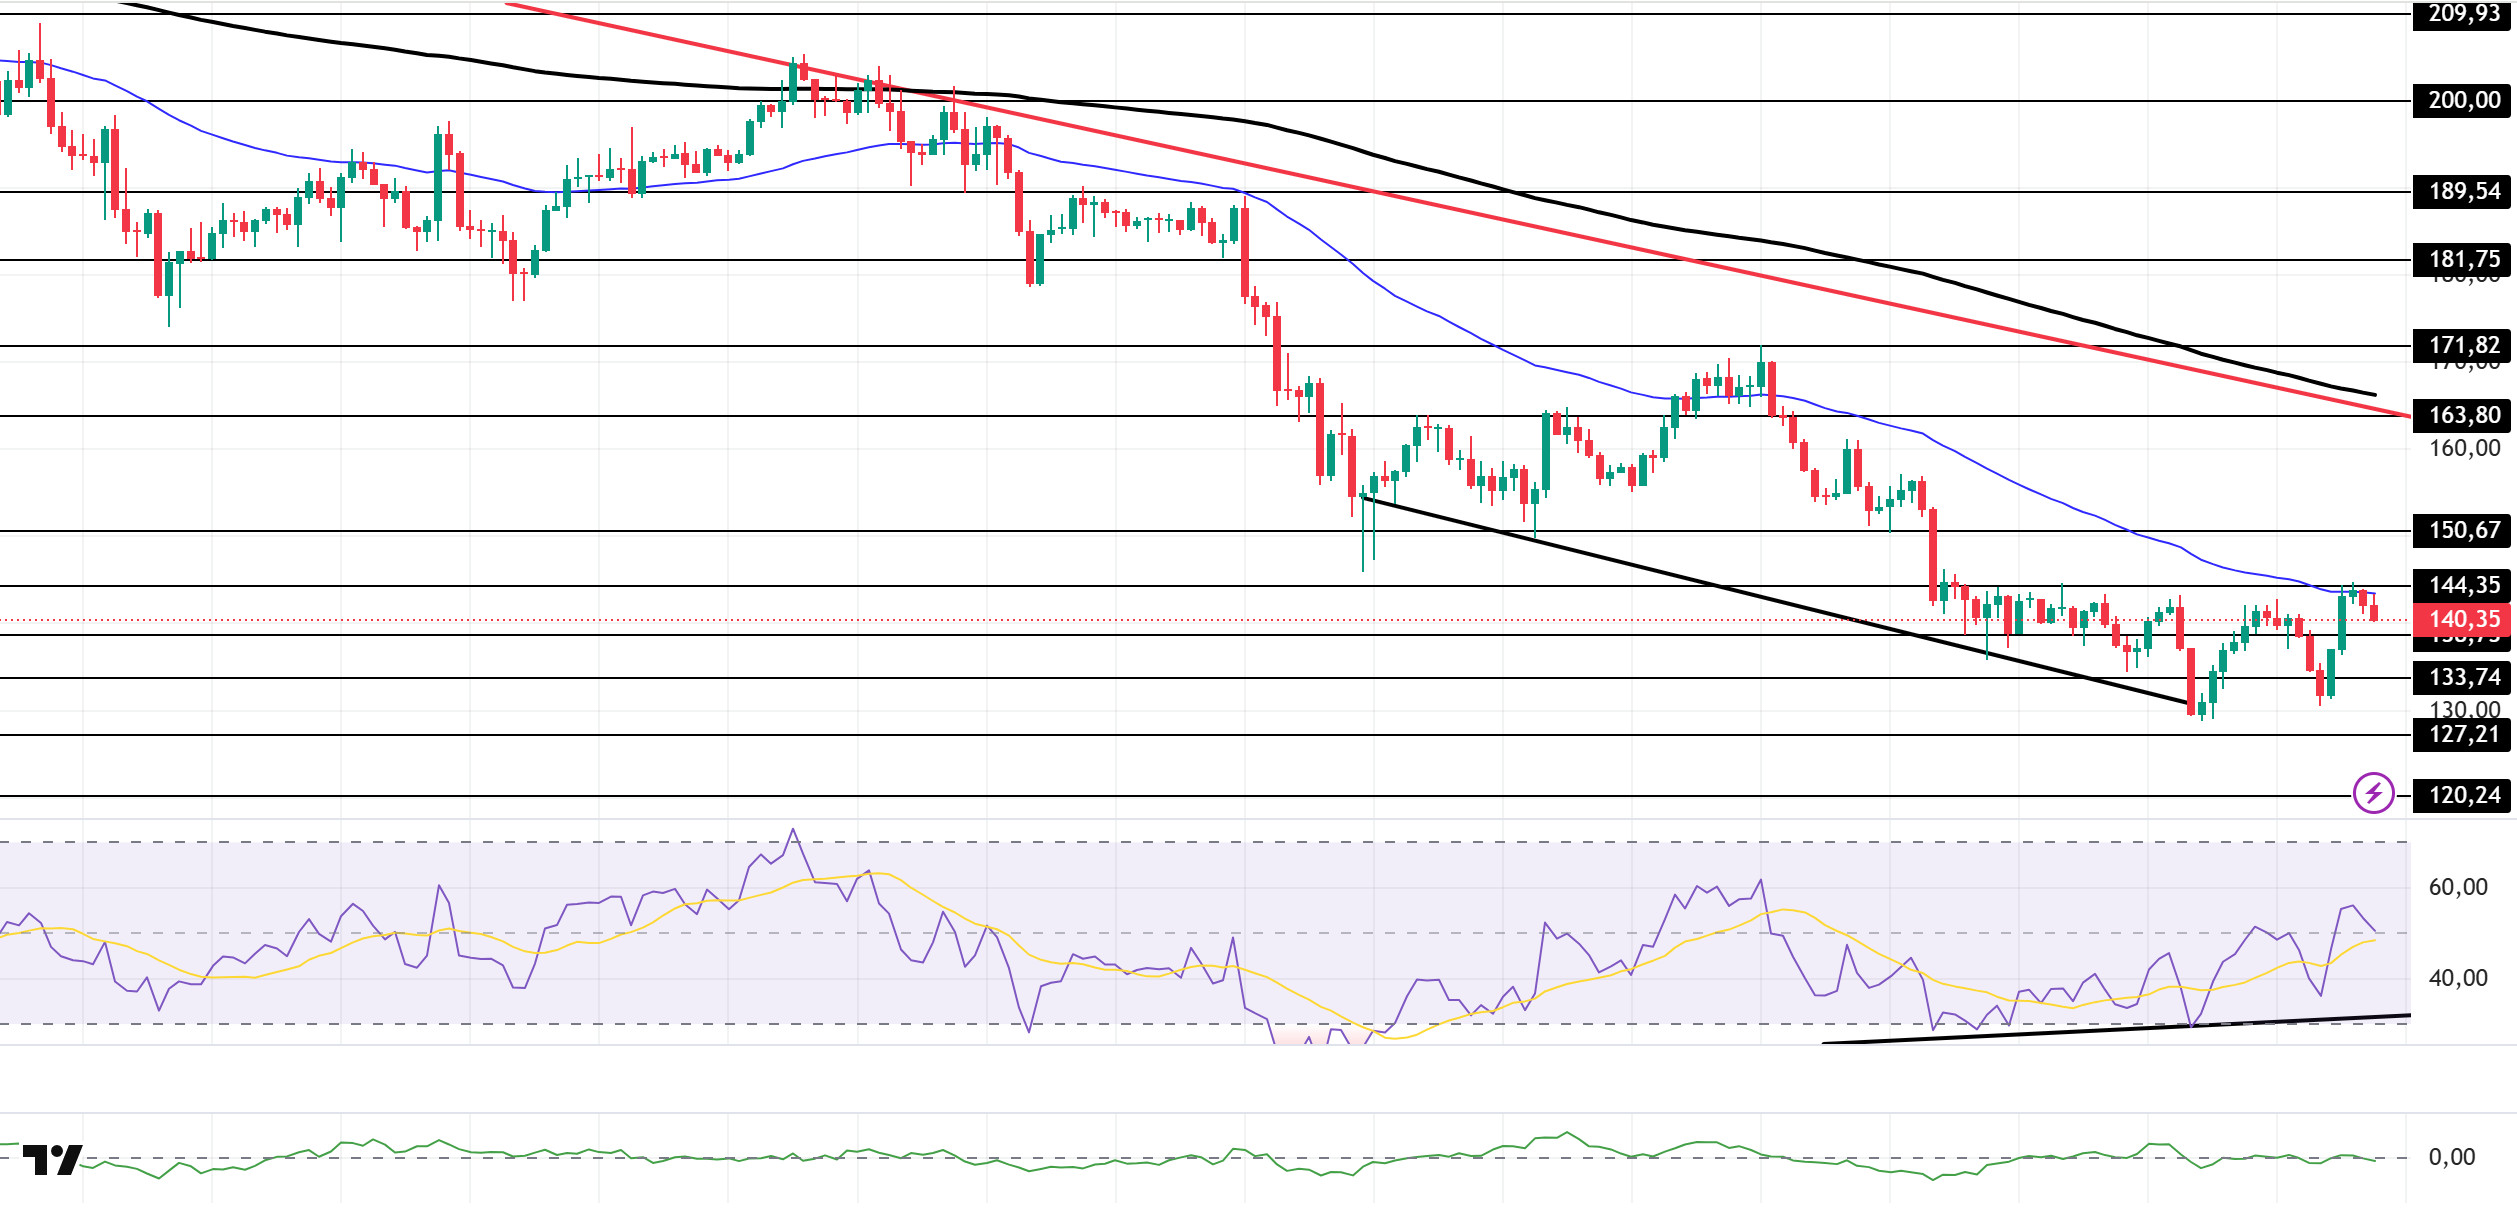
The SOL price showed a slight decline during the day. The asset remained in the lower region of the downtrend that began on October 6. Gaining momentum from the strong support level of $133.74, the asset is currently testing the 50 EMA (Blue Line) moving average as resistance. If the upward trend continues, it may test the downward trend line. In the event of a pullback, the $127.21 level could act as support.
The price continued to remain below the 50 EMA (Exponential Moving Average – Blue Line) and 200 EMA (Black Line) on the 4-hour chart. This indicates a potential downtrend in the medium term. Additionally, the price being below both moving averages suggests a downward trend in the short term. On the other hand, the gap between the two moving averages shows that the asset may experience a horizontal or upward movement. Chaikin Money Flow (CMF-20) is at a neutral level. However, the balance in cash inflows may continue to keep the CMF at a neutral level. The Relative Strength Index (RSI-14) managed to stay in positive territory. It is also above the upward trend that began on November 4. This indicates that buying pressure continues. If there is an uptrend due to macroeconomic data or positive news related to the Solana ecosystem, the $163.80 level stands out as a strong resistance point. If this level is broken upwards, the uptrend is expected to continue. If pullbacks occur due to developments in the opposite direction or profit-taking, the $127.21 level could be tested. A decline to these support levels could increase buying momentum, presenting a potential upside opportunity.
Supports: 138.73 – 133.74 – 127.21
Resistances: 144.35 – 150.67 – 163.80
DOGE/USDT
21Shares’ Dogecoin ETF received approval for listing on Nasdaq.
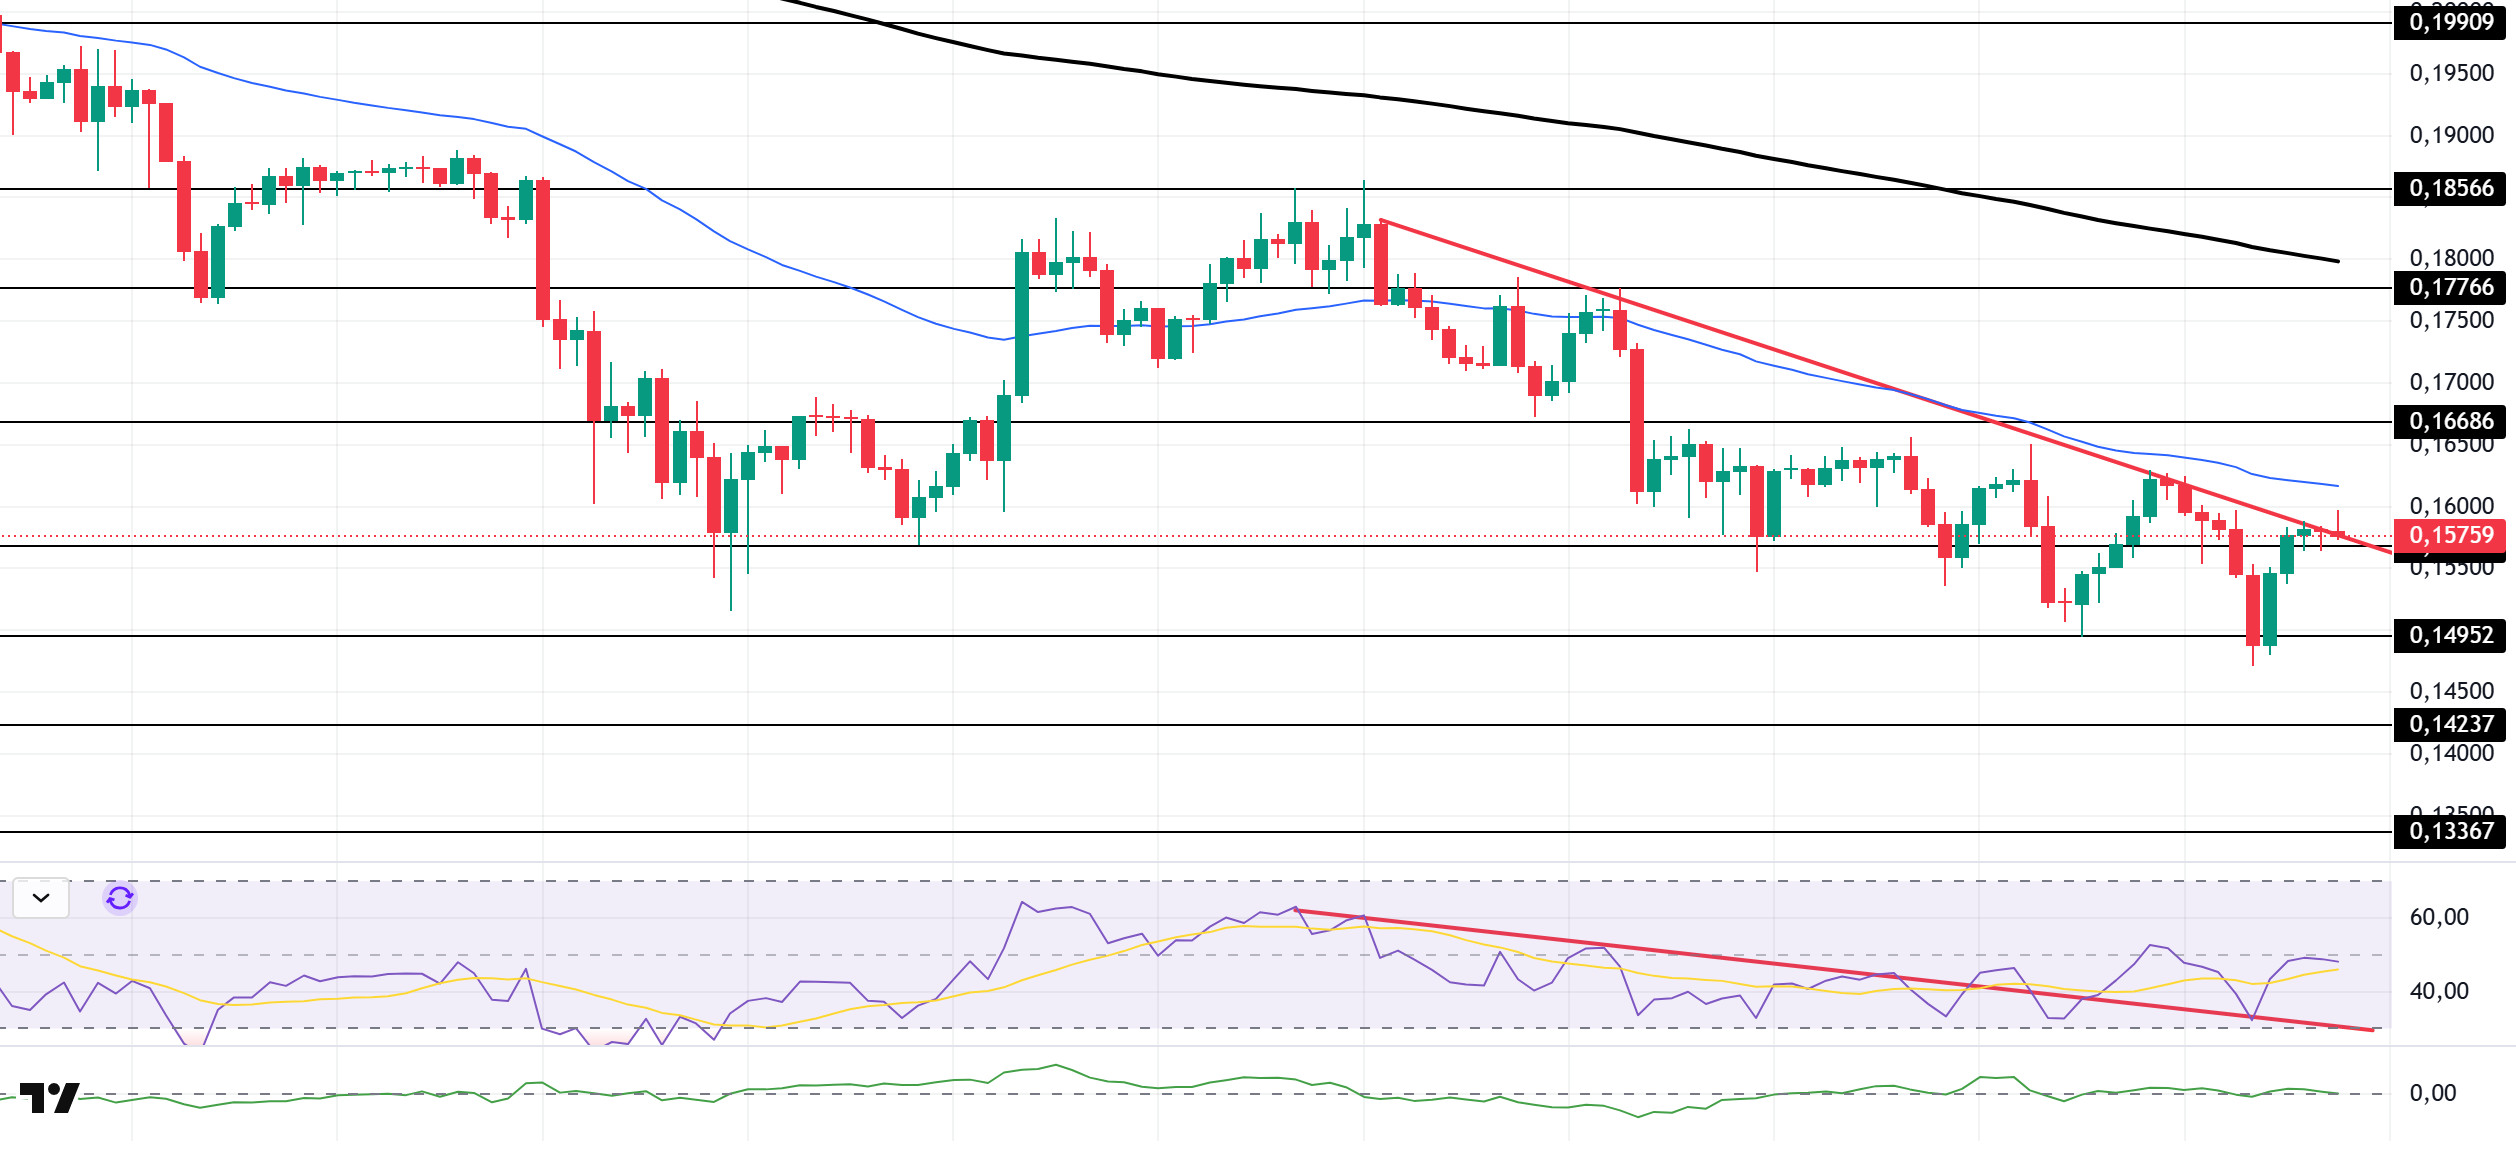
The DOGE price remained flat during the day. The asset continued to trade in the lower region of the downtrend that began on November 11. Currently testing the downtrend line as resistance, the price could test the 50 EMA (Blue Line) moving average and the $0.16686 level as resistance if the uptrend continues. In case of a pullback, it could retest the $0.14952 level.
On the 4-hour chart, the 50 EMA (Exponential Moving Average – Blue Line) remained below the 200 EMA (Black Line). This indicates that a downtrend may begin in the medium term. The price being between the two moving averages indicates that the price is in a decision phase in the short term. On the other hand, the large difference between the two moving averages increases the potential for the asset to experience a horizontal or upward movement. The Chaikin Money Flow (CMF-20) is at a neutral level. Additionally, a decrease in cash inflows could push the CMF into negative territory. The Relative Strength Index (RSI-14) is near the neutral level in the negative zone. It also remained above the downward trend that began on November 10, indicating that buying pressure continues. In the event of potential increases driven by political developments, macroeconomic data, or positive news flow within the DOGE ecosystem, the $0.17766 level emerges as a strong resistance zone. Conversely, in the event of negative news flow, the $0.14237 level could be triggered. A decline to these levels could increase momentum and initiate a new wave of growth.
Supports: 0.15680 – 0.14952 – 0.14237
Resistances: 0.16686 – 0.17766 – 0.18566
SUI/USDT
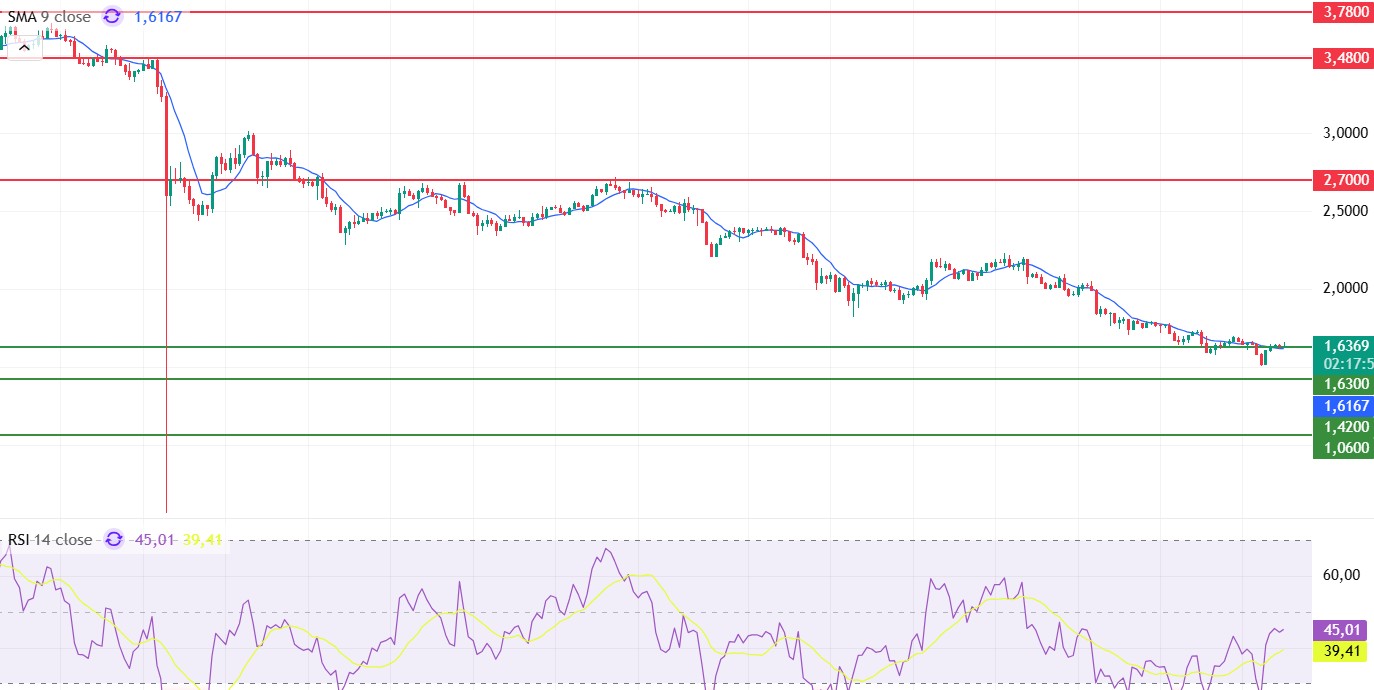
Looking at Sui’s technical outlook, we see that the price has been moving sideways around the $1.63 level on a 4-hour basis, influenced by fundamental developments. The Relative Strength Index (RSI) is currently in the range of 45.01 – 39.41. This range indicates that the market is trading close to the buy zone; a drop in the RSI to the 40.00 – 35.00 range could signal a potential buying point. If the price moves upward, the resistance levels of $2.70, $3.48, and $3.78 can be monitored. However, if the price falls to new lows, it could indicate deepening selling pressure. In this case, the support levels of $1.63, $1.42, and $1.06 come to the fore. Based on the trend line, a pullback to $1.42 appears technically possible. According to Simple Moving Averages (SMA) data, Sui’s average price is currently at $1.61. The price remaining above this level indicates that the current uptrend could technically continue.
Supports: 1.06 – 1.42 – 1.63
Resistances: 2.70 – 3.48 – 3.78
Legal Notice
The investment information, comments, and recommendations contained herein do not constitute investment advice. Investment advisory services are provided individually by authorized institutions taking into account the risk and return preferences of individuals. The comments and recommendations contained herein are of a general nature. These recommendations may not be suitable for your financial situation and risk and return preferences. Therefore, making an investment decision based solely on the information contained herein may not produce results in line with your expectations.

