
Technical Analysis
BTC/USDT
Messages from the Trump–Zelensky meeting showed that diplomatic efforts to resolve the Ukraine war continue, but the process remains fragile, particularly due to Russia’s stance. China’s symbolic sanctions against US defense companies over arms sales to Taiwan indicate that strategic tensions between major powers remain high.Japan’s continuation of its expansionary fiscal policy with a record budget and the Bank of Japan’s emphasis on gradual normalization of interest rate hikes reveal a balanced but cautious approach on both the fiscal and monetary policy fronts in global markets.
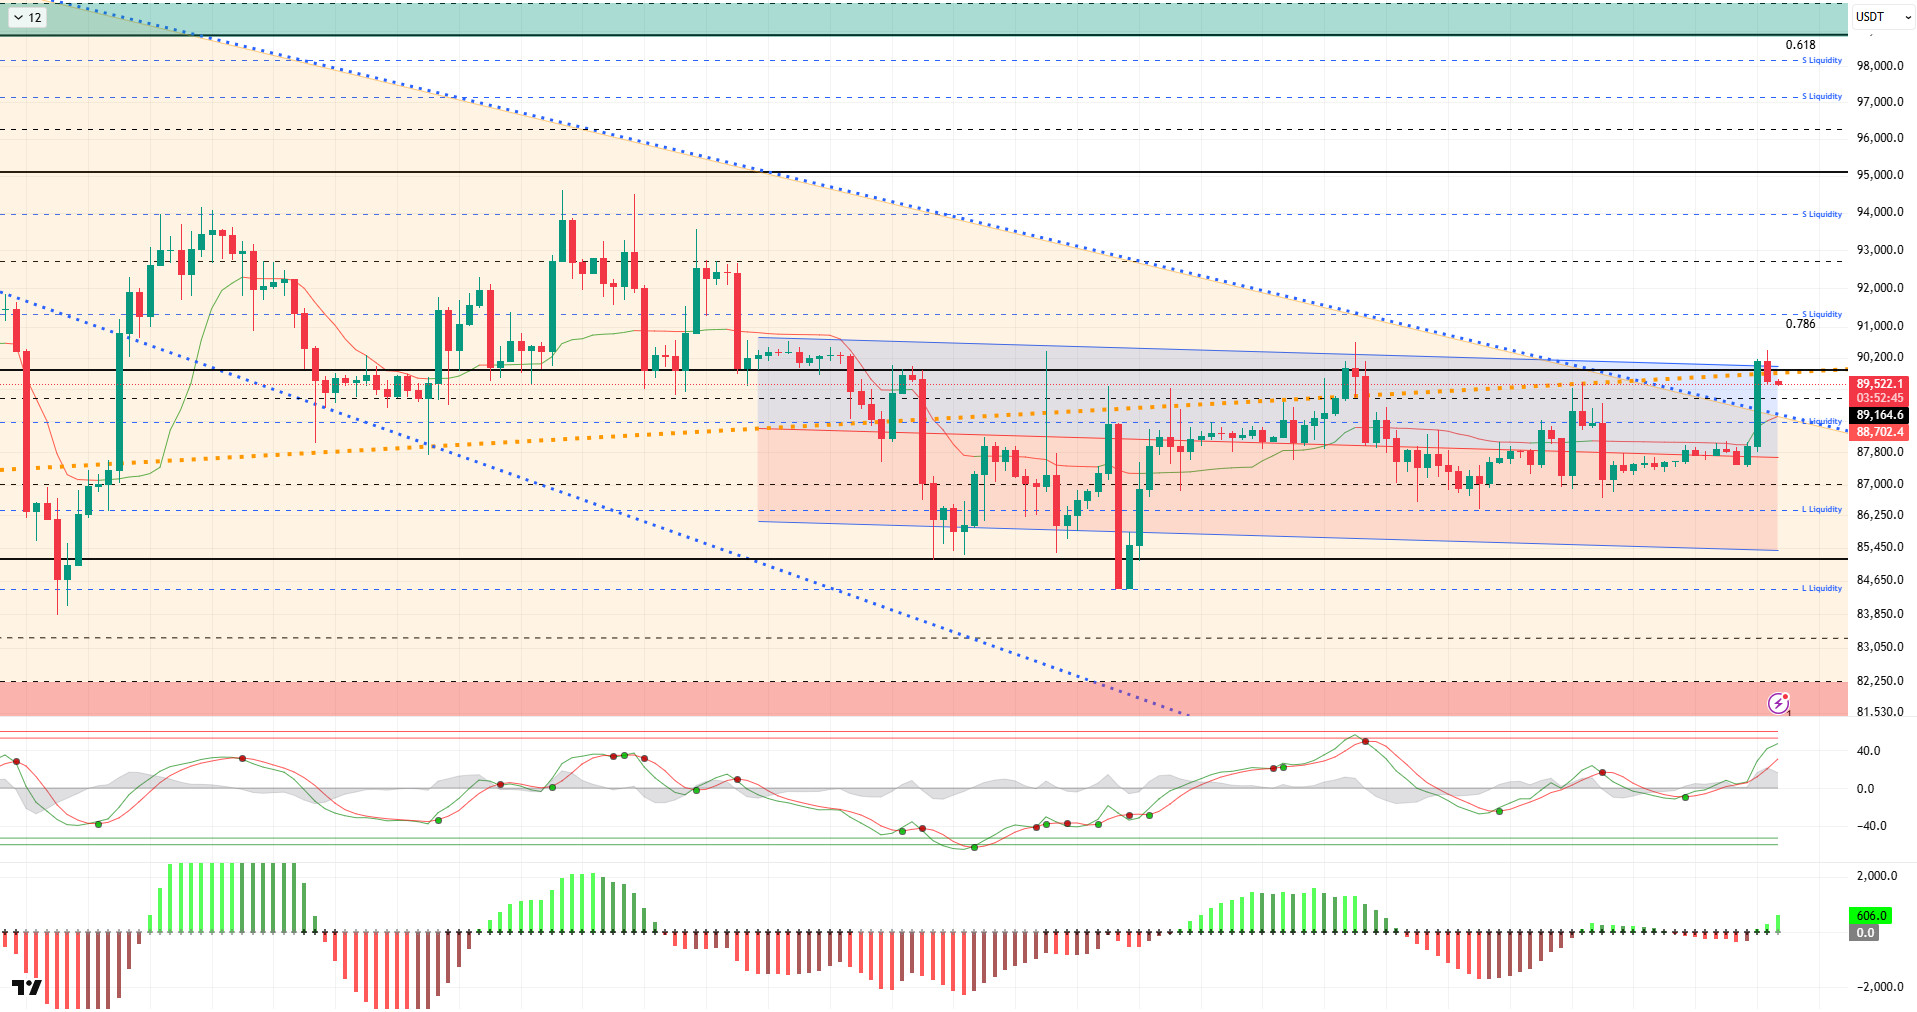
From a technical perspective, although BTC occasionally loses the 87,000 level, which is the midpoint of the declining trend line, it manages to recover and move above this level. Since its ATH, the price has gradually declined within the orange band and, following the latest movement, has broken out of the band with a narrowing structure. At the time of writing, the price is trading just above the major uptrend at the 89,600 level and continues to test the 90,000 reference level. Following the recent rise, closes above this level will be necessary for the uptrend to continue. On the other hand, as we enter the last two days of the year, the price’s attempt to close the year negatively with a 4.19% decline is another factor to watch.
Technical indicators show that the Wave Trend (WT) oscillator has reached the overbought zone while maintaining its buy signal in line with the uptrend. The histogram on the Squeeze Momentum (SM) indicator has moved into positive territory, aligning with the oscillator. The Kaufman Moving Average (KAMA) is currently trading just below the price level at $88,600.
When examining liquidation data, an increase is seen in short-term buy levels, with the 86,000 and 88,000 levels emerging as levels where accumulation has increased. In contrast, short-term sell orders are being liquidated at the 90,000 level, while the 91,000 level and above stand out as the liquidity zone in a broader time frame.
In summary, the Trump–Zelensky meeting shows that diplomacy is ongoing but no clear agreement has been reached yet. While tensions continue on the China-US-Taiwan axis with trade moves, the BoJ’s expansionary budget plans stand out despite its interest rate hike. Technically, BTC continues to trade within a falling trend channel, with no clear upward movement yet.An examination of liquidity data reveals that areas with concentrated short-term trading are being targeted, while long-term selling levels have not yet been tested. After this stage, the 89,000 level will be monitored as a critical point where the major uptrend passes through for the price to regain momentum. Closes and price action above this level will be an important indicator for regaining momentum, and a break above it could signal an acceleration in the upward trend. If selling pressure intensifies, 88,000 will emerge as a short-term liquidity zone, while 86,000 will be monitored as another liquidity zone.
Supports: 88,500 – 86,300 – 85,000
Resistances: 89,000 – 90,000 – 91,400
ETH/USDT
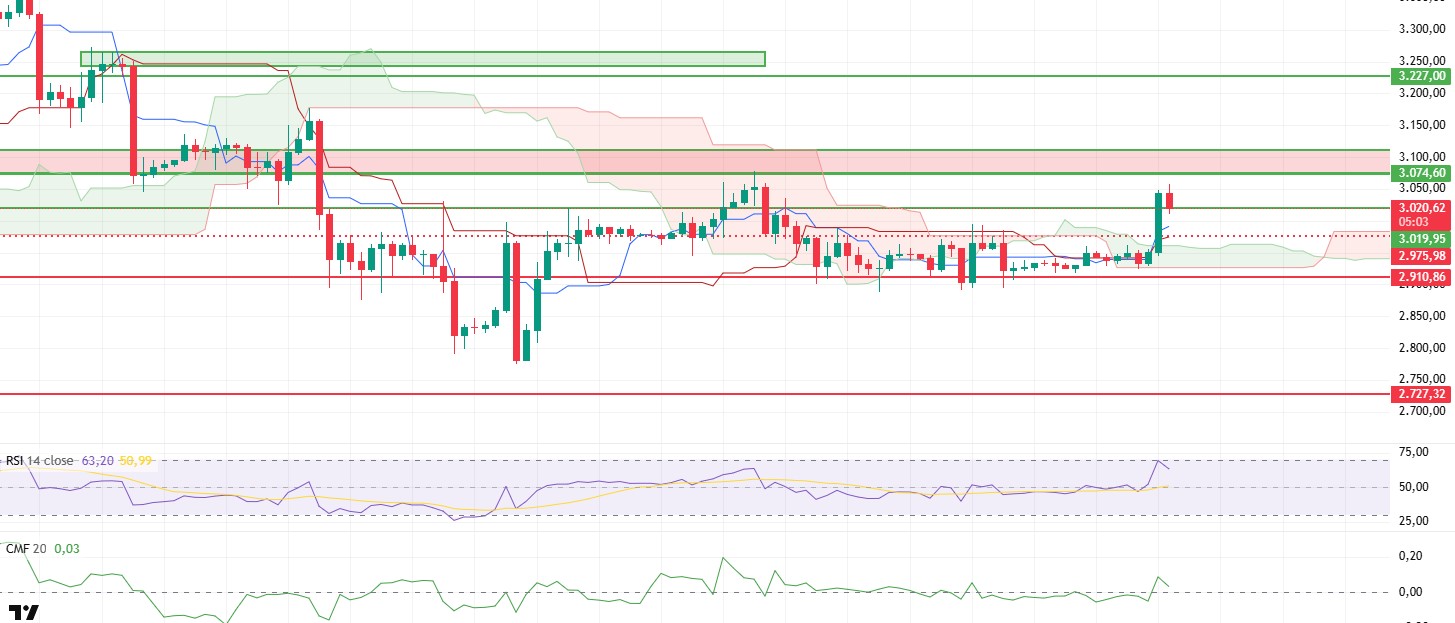
ETH price behavior recovered significantly after the pullback experienced before the weekend. ETH, which fell to the $2,910 support level on Friday, rose to the $2,930 range with buying from this area. It traded calmly within this range over the weekend. With the weekly close, buyers regained the upper hand and the price broke above the $3,020 resistance. This move indicates that the market has turned upward in the short term.
The liquidity flow picture is more vibrant compared to previous days. The Chaikin Money Flow (CMF) has moved back into positive territory, indicating an increase in liquidity entering the market. However, a closer look at the transaction details reveals that the rise is primarily driven by futures transactions rather than spot purchases. The Cumulative Volume Delta (CVD) indicator shows that demand is not as strong on the spot side, while the rapid increase in open interest confirms a significant rise in long positions. This structure indicates that a large portion of the rise comes from leveraged transactions.
On the momentum side, a more cautious signal has emerged. After rising to the overbought zone, the Relative Strength Index (RSI) has started to pull back from this area. This movement in the RSI indicates that buying appetite is approaching its peak and that the likelihood of a short-term pause is increasing. Therefore, even if the price continues to move upward, occasional pullbacks may not be surprising.
The technical outlook remains strong from the Ichimoku indicator perspective. The price has settled above the Tenkan and Kijun levels and is trading above the kumo cloud. The Tenkan line remaining above the Kijun indicates that the positive technical structure is intact. This outlook shows that buyers still have the advantage in terms of the overall trend.
Although technical indicators show that the upward trend remains intact in the overall assessment, the possibility of a correction in the short term should not be overlooked. As long as the price remains above the $3,020 level, the upward trend is expected to continue. If the price falls below this level, a limited pullback to the $ range may occur first, followed by a search for a new equilibrium. The outlook is positive at this stage, but the pace of the rise may be volatile in the short term.
Below the Form
Supports: 3,019 – 2,910 – 2,727
Resistances: 3,074 – 3,227 – 3,368
XRP/USDT
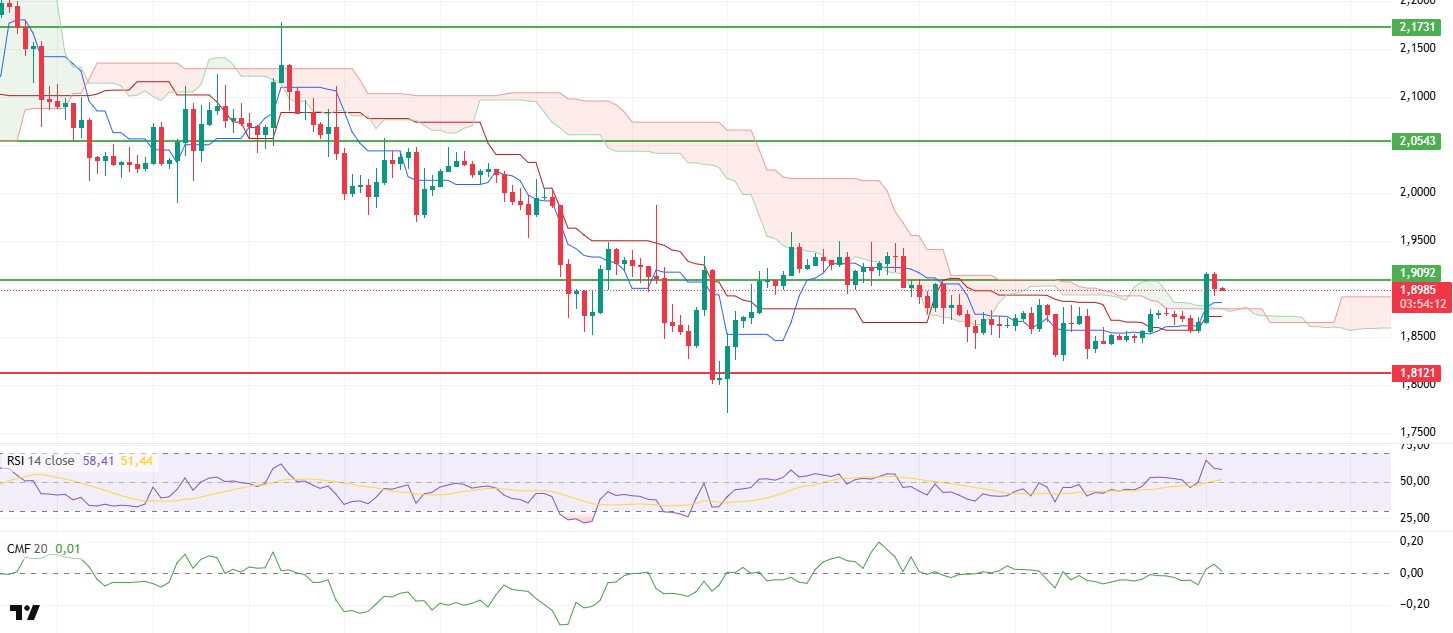
Following a narrow range of movement over the weekend on the XRP side, the pace picked up with the weekly close. The price quickly reached the $1.90 level, bringing the long-unbroken zone back into focus. This rise indicates that the previous days’ stagnant structure has been broken and that the market is now looking for direction upwards. However, the slowdown in trading around $1.90 shows that this level remains a strong threshold.
The liquidity picture appears to have partially recovered. The Chaikin Money Flow (CMF) has moved into positive territory, but the limited slope is noteworthy. Although money has started flowing into the market, this flow is not yet strong enough to create a sustained buying wave. Therefore, liquidity behavior should be closely monitored for the continuation of the uptrend.
There is a movement in line with the rise on the RSI front. The indicator continued its upward trend and is balanced in these areas. This outlook indicates that selling pressure has decreased and buyers have not retreated. However, the RSI lingering at these levels also signals that the price may slow down in the short term.
On the technical side, the Ichimoku indicator presents a more constructive picture. The price has risen above the kumo cloud, and the Tenkan and Kijun levels appear to have been surpassed. This structure suggests that a positive change has occurred in the medium-term outlook. From a technical perspective, it can be said that the market has moved from its previous weak structure to a more solid foundation.
In the overall assessment, the $1.90 level is in a decisive position. If sustainability can be achieved above this region, a continuation of the upward movement seems possible. In the opposite scenario, a new equilibrium could form with calmer and more limited pullbacks below this level ( ). The current picture shows that the direction has turned upward, but the pace has not yet fully settled.
Supports: 1.8121 – 1.6224 – 1.5146
Resistances: 1.9092 – 2.0543 – 2.1731
SOL/USDT
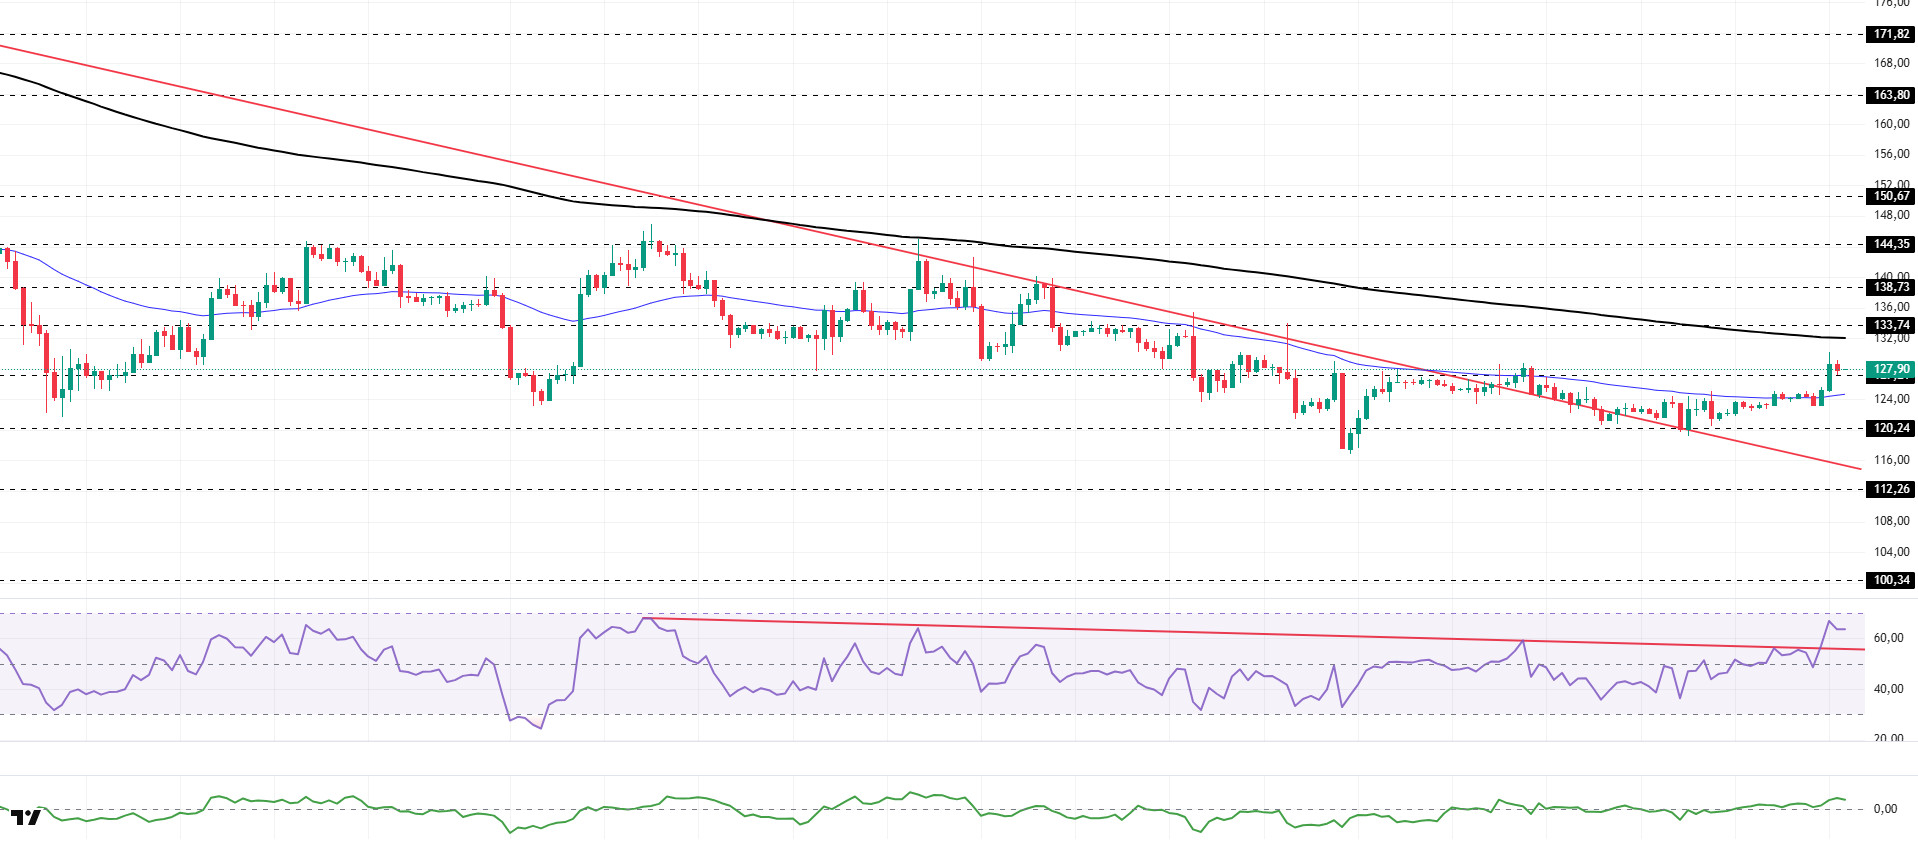
The SOL price experienced an increase. The asset continued to remain in the upper region of the downward trend that began on October 8. Testing the strong support level of $120.24 and the downward trend as support and gaining momentum, the price broke above the 50 EMA (Blue Line) moving average and continued its upward movement. Currently preparing to test the 200 EMA (Black Line) moving average as resistance, the asset could test the $138.73 level as resistance upon closing above this level. In case of a pullback, the 50 EMA (Blue Line) moving average could act as support.
The price remained below the 50 EMA (Exponential Moving Average – Blue Line) and 200 EMA (Black Line) on the 4-hour chart. This indicates that the downtrend is continuing in the medium term. At the same time, the price being between both moving averages signaled that the asset is in a decision phase in the short term. The Chaikin Money Flow (CMF-20) moved into positive territory. However, an increase in money inflows could push the CMF to the upper points of the positive zone. The Relative Strength Index (RSI-14) rose from the middle of the negative zone to the upper region of the positive zone. At the same time, it broke above the downward trend that began on December 3. This signaled the formation of buying pressure. If there is an increase due to macroeconomic data or positive news related to the Solana ecosystem, the $138.73 level stands out as a strong resistance point. If this level is broken upwards, the increase is expected to continue. In the event of pullbacks due to developments in the opposite direction or profit-taking, the $112.26 level could be tested. A decline to these support levels could increase buying momentum, presenting a potential upside opportunity.
Supports: 127.12 – 120.24 – 112.26
Resistances: 133.74 – 138.73 – 144.35
DOGE/USDT
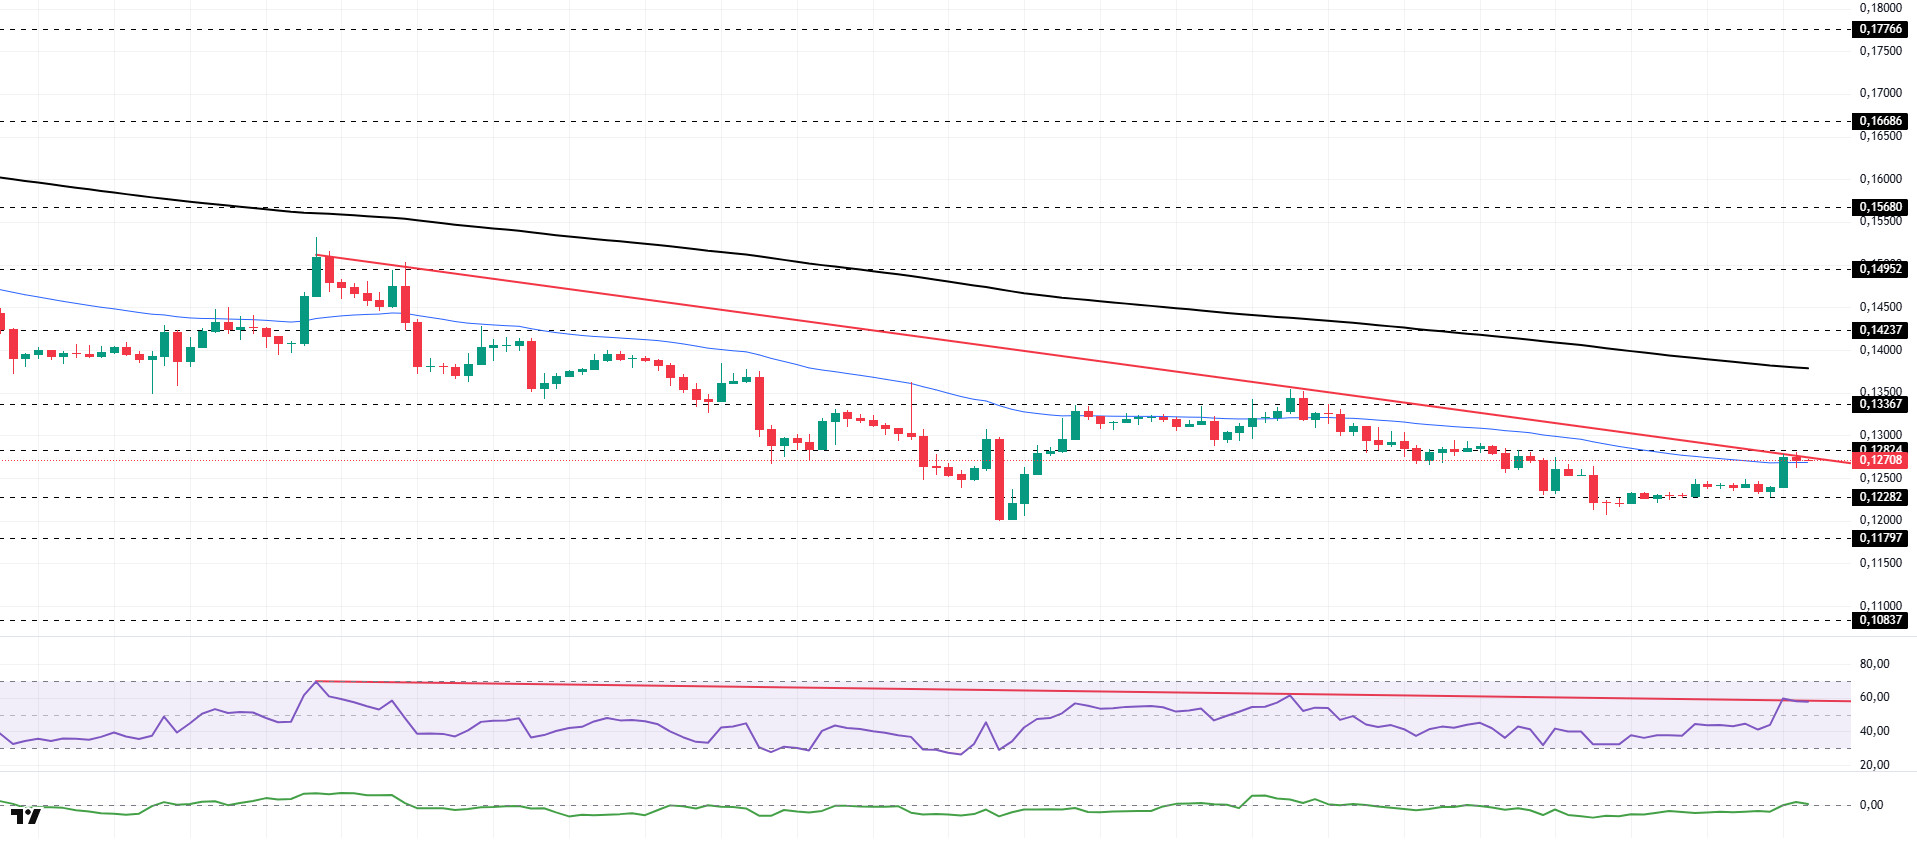
The DOGE price experienced an uptrend. The asset gained momentum from the strong support level of $0.12282 and continued its upward movement. The price, which is currently testing the 50 EMA (Blue Line) moving average and the descending trend that began on the 9th as resistance, may test the 200 EMA (Black Line) moving average as resistance in candle closes above this level. If it experiences a pullback, the $0.12282 level may act as support again.
On the 4-hour chart, the 50 EMA (Exponential Moving Average – Blue Line) remained below the 200 EMA (Black Line). This indicates that the downtrend may continue in the medium term. The price being below both moving averages suggests a downward trend in the short term. The Chaikin Money Flow (CMF-20) rose from negative territory to neutral levels. Additionally, a decrease in money inflows could push the CMF back into negative territory. The Relative Strength Index (RSI-14) has moved into positive territory. At the same time, it is currently testing the resistance level of the downward trend that began on December 9. Breaking through this level could create buying pressure. In the event of an uptrend driven by political developments, macroeconomic data, or positive news flow in the DOGE ecosystem, the $0.14237 level stands out as a strong resistance zone. Conversely, in the event of negative news flow, the $0.11797 level could be triggered. A decline to these levels could increase momentum and initiate a new wave of growth.
Supports: 0.12282 – 0.11797 – 0.10837
Resistances: 0.12824 – 0.13367 – 0.14237
BNB/USDT
From a technical perspective, BNB/USDT, which tested the downward trend upward with the support provided by the new candles, rose to the $930 level; however, increased selling pressure was observed in this region depending on market conditions. With the effect of increased selling pressure, the asset appears to have continued its movement within a downward channel for some time.
However, BNB, which turned upward with the support it received from the middle band of the descending channel, gained positive momentum by breaking the upper band of the channel upward. In this direction, the asset rose above the previously determined target level of $860 and reached the $870 level. Although partial pressure is seen at these levels, the overall technical outlook is considered to maintain its positive structure.
In this context, BNB/USDT presents a positive picture in terms of the overall outlook. If upward price movements gain strength, the current positive outlook is expected to be supported.
Currently trading in the $850–$880 range, technical indicators for BNB show that low trading volume is limiting the upward momentum. Additionally, the RSI indicator reaching the 70 level with the recent increases and reacting from this level indicates that a limited correction movement may continue in the short term.
Within the technical outlook, if selling pressure increases, the price is expected to retest the $850 support level. If this level is broken downward, a pullback towards the $835 and $820 support zones could come into play.
On the other hand, if buying appetite is maintained and market momentum strengthens, BNB is expected to retest the $880 resistance level in the first stage. Breaking above this level could push the price above the downtrend line. If the trend breakout is confirmed and the price manages to stay above this level, a rise towards the $905 and $930 levels is technically possible.
Supports: 835 – 820 – 800
Resistances: 880 – 905 – 930

Legal Notice
The investment information, comments, and recommendations contained herein do not constitute investment advice. Investment advisory services are provided individually by authorized institutions taking into account the risk and return preferences of individuals. The comments and recommendations contained herein are of a general nature. These recommendations may not be suitable for your financial situation and risk and return preferences. Therefore, making an investment decision based solely on the information contained herein may not produce results in line with your expectations.

