
TECHNICAL ANALYSIS
BTC/USDT
Crypto markets are entering a new era with US President Donald Trump’s order to create strategic crypto reserves. Trump announced that he has authorized the presidential working group to hold major crypto assets such as BTC, ETH, XRP, SOL and ADA as reserves. Stating that this step is part of his goal of making the US the global crypto capital, Trump emphasized that this is a critical move for the country’s financial future. David Sacks, the White House’s director of artificial intelligence and crypto policy, announced that a crypto strategic reserve was created under the Presidential Decree and more details will be shared at the White House Crypto Summit on March 7.
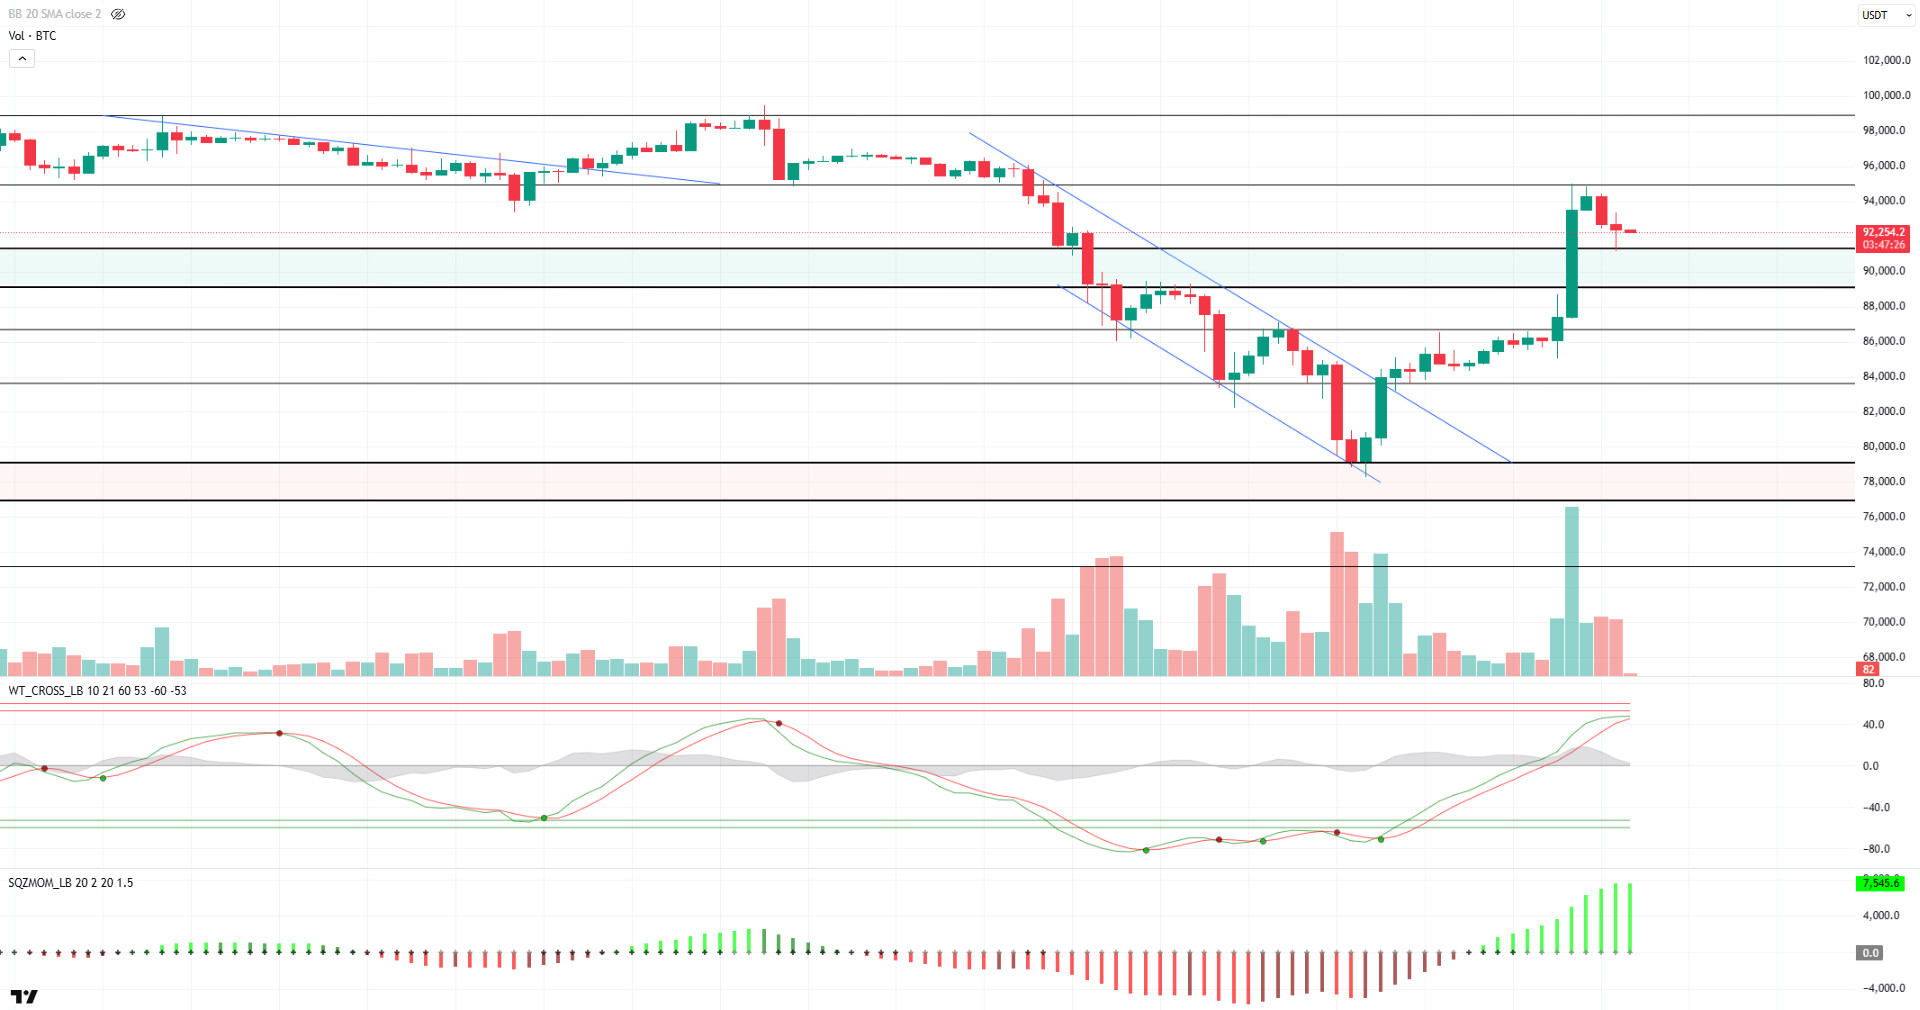
When we look at the technical outlook, a sharp upward movement was seen in BTC price with the effect of optimistic developments on the fundamental side. BTC, which displayed a weak outlook at the 85,000 level before the development and was preparing to retreat, rose rapidly after the positive news flow and realized a V-shaped recovery by testing the 95,000-resistance level. Currently, BTC, which retains most of its gains, is trading at 92,400. When the technical oscillators are analyzed, it is observed that although there is a sell signal on the hourly charts, it maintains its buying signals by approaching the overbought zone on the 4-hour charts. A neutral outlook prevails on daily charts. A significant increase in momentum indicators indicates that the bullish momentum in the market may continue. In order for the upward movement to continue, first the 92,800 level and then the closes above the 95,000 level, which is the major resistance point, will be followed. If the 95,000 level is exceeded, BTC can be expected to form a strong trend. On the other hand, the 91,400 level stands out as the first support zone in the bullish correction.
Supports 91,400 – 89,000 – 86,700
Resistances 92,800 – 95,000 – 97,000
ETH/USDT
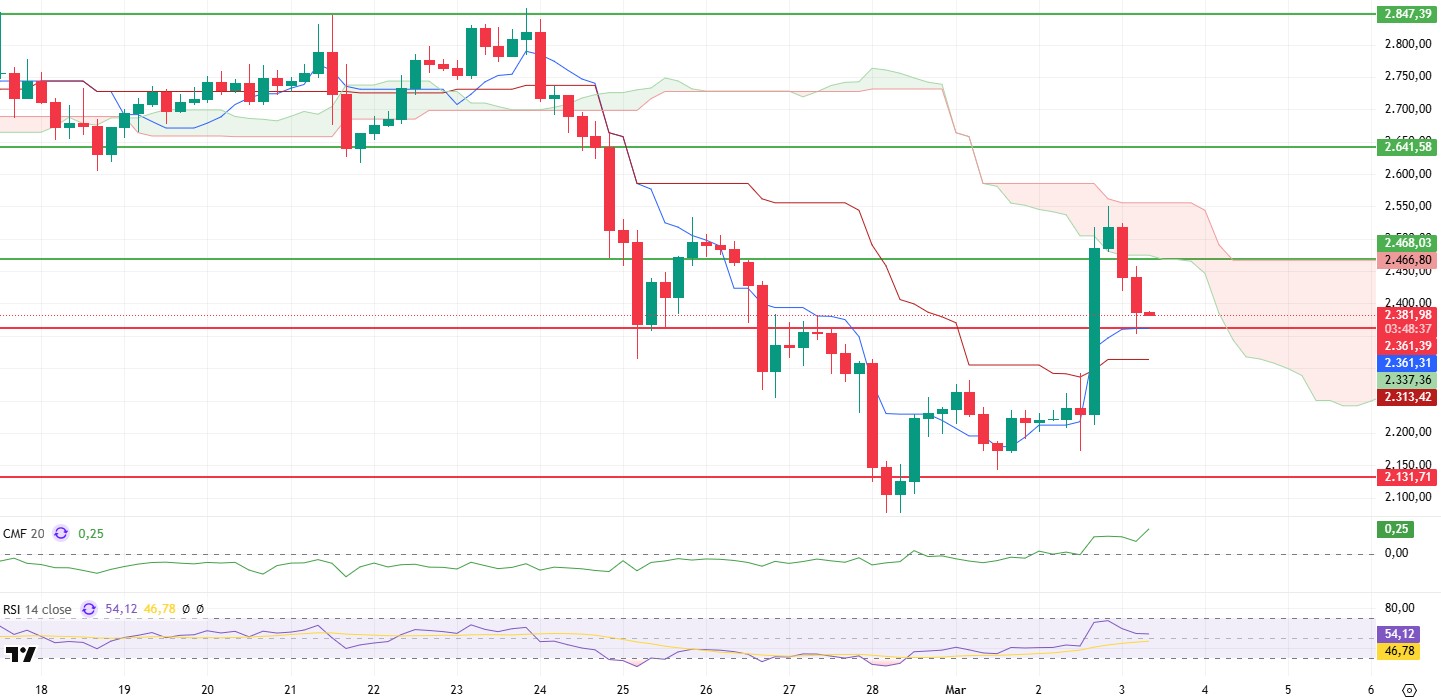
ETH managed to break above the $2,500 level last night on a strong wave of buying after US President Donald Trump announced that he was including ETH in his plans to create a US crypto reserve. While this rise caused the price to touch the Ichimoku cloud, there was some retracement with heavy sell orders overnight and in the morning.
In terms of technical analysis, the fact that the price rose above the tenkan and kijun levels again and the tenkan level cut the kijun level upwards is considered as a positive signal for the market. This technical structure indicates that the trend may gain upward momentum. In addition, the Chaikin Money Flow (CMF) indicator, which shows liquidity flow, moved in positive territory, indicating that the market is supported by strong buyer interest. Although the CMF indicator declined slightly with the recent pullback, it still remains in positive territory, confirming that buyers continue to dominate the market.
It is evaluated that the current retreat is largely due to profit realizations. In the short term, the support of $ 2,361 stands out as a critical threshold. If this level is maintained, the ETH price can be expected to rise above the $ 2,500 level again during the day. However, it should be noted that if the 2,361 support is breached, selling pressure could increase and lead to a deeper correction. In conclusion, ETH’s technical structure and market dynamics suggest that the bullish trend could be maintained in the short term. However, it is important to closely monitor support levels and ensure risk management depending on price movements.
Supports 2,361 – 2,131- 1,907
Resistances 2,468 – 2,641 – 2,847
XRP/USDT
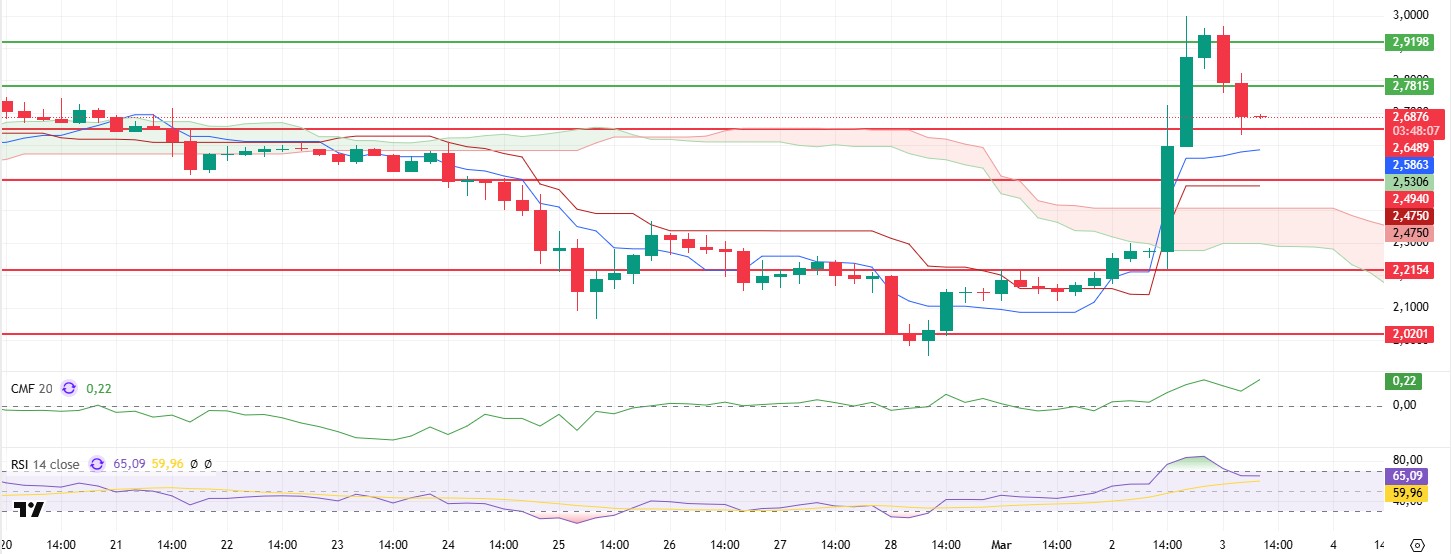
XRP experienced a sharp rise yesterday evening after President D. Trump announced the addition of XRP to the US strategic crypto reserve. Priced at $2.20, XRP, with the news After rising above the $2.91 level, it fell to 2.64 support, with a slight retreat with profit sales in the night hours.
Analyzing the technical indicators, the price rebounded above the kumo cloud and the tenkan level remained above the kijun level, strengthening the positive outlook. The Chaikin Money Flow (CMF) indicator is slightly down in the positive zone, indicating that the buying pressure has weakened but still persists. The Relative Strength Index (RSI), on the other hand, has broken out of the overbought zone and remains above the based MA line, which can be taken as a healthy sign of correction.
As a result, indicators reveal that the positive structure is maintained and that the rises may continue. XRP, which manages to hold above the $ 2.63 level, may rise to $ 2.91 again during the day. However, the loss of the $ 2.63 level may continue to decline to the $ 2.49 level.
Supports 2.6489 – 2.4940 – 2.2154
Resistances 2.7815 – 2.9198 – 3.1493
SOL/USDT
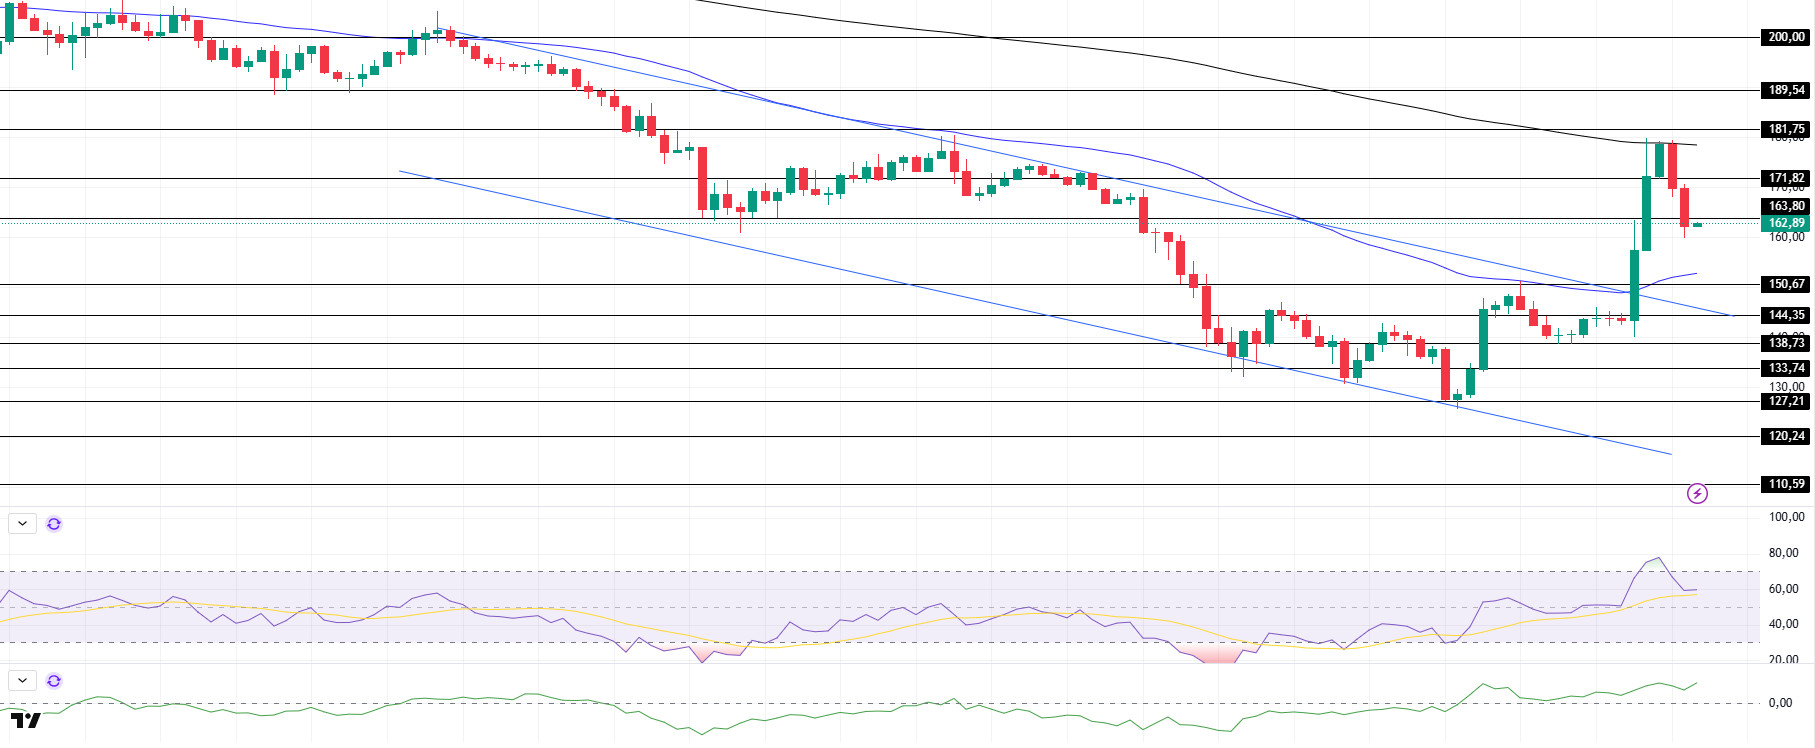
In a big surprise, US President Donald Trump announced that three US-based altcons, one of which is SOL, will be in the cryptocurrency strategic reserve for the US. SOL increased by about 18% with this news and rose up to $ 180. Wintermute revealed that Solana withdrew $38.2 million worth of SOL from a centralized exchange before the opening of the $2 billion token lock on March 1. On the other hand, CME Group announced on March 17 that it would launch Solana futures, strengthening ETF expectations. According to analysts, the Solana ETF has a 70% chance of approval in 2025. Onchainde alleviated the selling pressure by buying $14 million from a whale Solana before the unlocking of the $1.75 billion token.
SOL broke the resistance zone of the downtrend that started on February 14, rising by about 25% after US President Trump’s statements. It then hit resistance at the 200 EMA (Black Line) and started to retreat. This may enable it to test the ceiling of the downtrend that started on February 14. On the 4-hour timeframe, the 50 EMA (Blue Line) continues to be below the 200 EMA (Black Line). This could deepen the decline further in the medium term. At the same time, the price is pricing in the middle of two moving averages. The Chaikin Money Flow (CMF)20 indicator is in positive territory, but bullish volume may further increase the money increases. However, the Relative Strength Index (RSI)14 indicator is hovering at the mid-level of the positive zone, losing momentum from the overbought zone. The $ 181.75 level stands out as a very strong resistance point in the rises driven by both the upcoming macroeconomic data and the news in the Solana ecosystem. If it breaks here, the rise may continue. In case of retracements for the opposite reasons or due to profit sales, the support level of 150.67 dollars can be triggered. If the price comes to these support levels, a potential bullish opportunity may arise if momentum increases.
Supports 163.80 – 150.67 – 144.35
Resistances 171.82 – 181.75 – 189.54
DOGE/USDT
In Onchain, the increase in the number of active addresses during the price drop showed that many traders were actively selling, putting downward pressure on Dogecoin’s price. Dogecoin (DOGE), on the other hand, saw a surge in whale activity, with large investors accumulating more than 910 million DOGE in the last 48 hours.
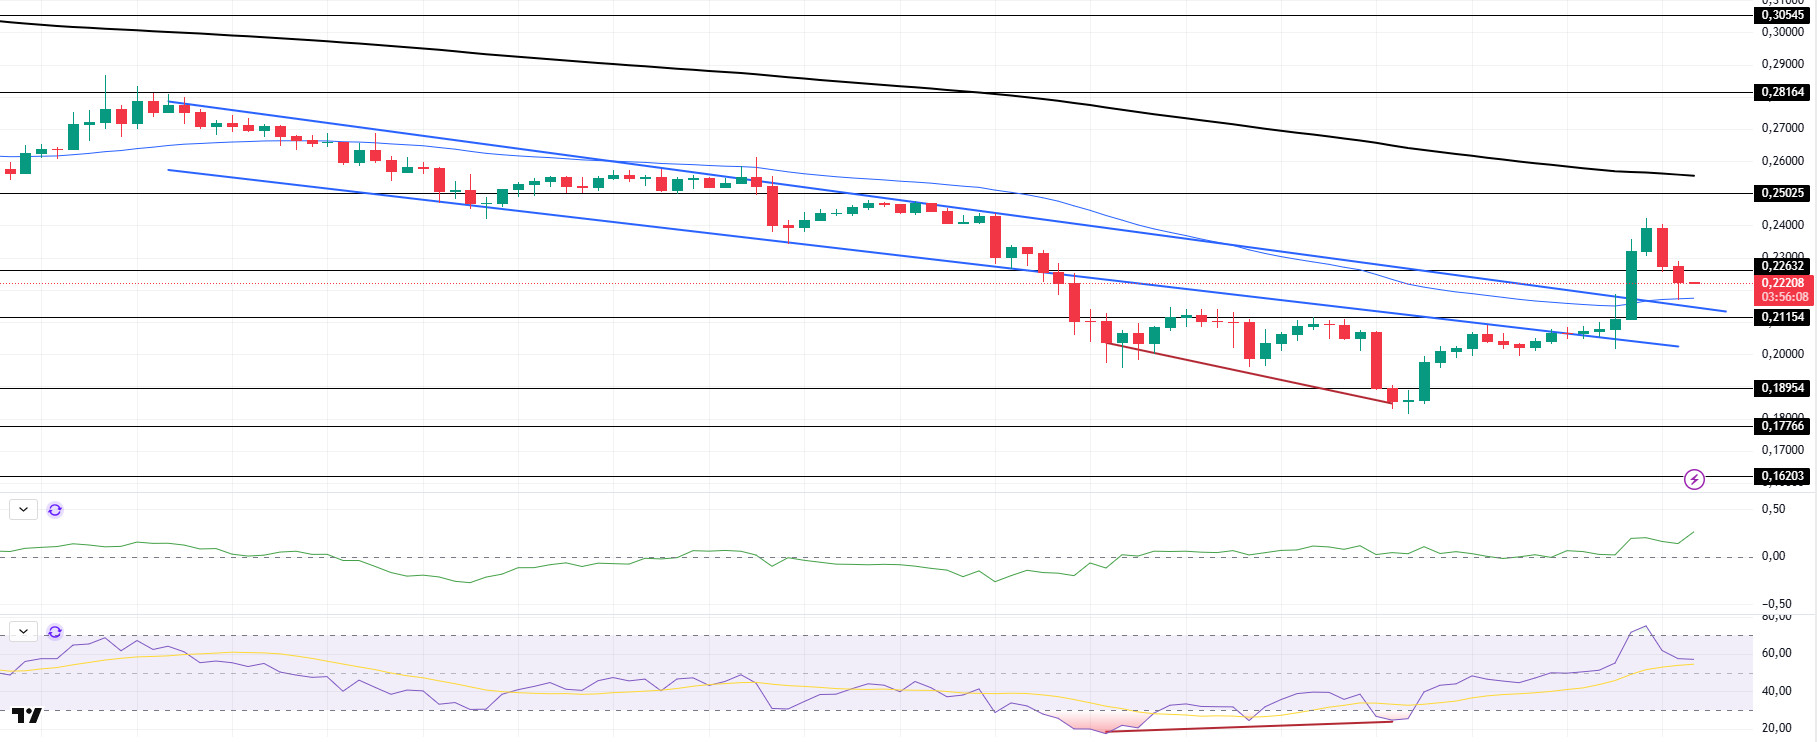
DOGE has risen, keeping pace with the overall market. Since February 15, the asset, which has been declining since February 15, has broken the downtrend downwards, but has broken the downtrend upwards with the market rally. The slightly retreating price is currently testing the 50 EMA (Blue Line). On the 4-hour timeframe, the 50 EMA (Blue Line) is below the 200 EMA (Black Line). This could mean that the decline could deepen further in the medium term. However, the price is hovering between two moving averages. But the difference between the two moving averages, as well as the difference between the price and the 50 EMA, increases the probability that DOGE will rise. The Chaikin Money Flow (CMF)20 indicator is in positive territory. However, the fact that the volume is on the plus side shows us the possibility that money inflows may increase further. On the other hand, the Relative Strength Index (RSI)14 is at the middle level of the positive zone, accelerating downward from the overbought level again. However, the bullish divergence worked. The $0.25025 level appears to be a very strong resistance place in the rises due to political reasons, macroeconomic data and innovations in the DOGE coin. In case of possible pullbacks due to political, macroeconomic reasons or negativities in the ecosystem, the $0.18954 level, which is the base level of the trend, is an important support. If the price reaches these support levels, a potential bullish opportunity may arise if momentum increases.
Supports 0.21154 – 0.18954 – 0.17766
Resistances 0.22632 – 0.25025 – 0.28164
LEGAL NOTICE
The investment information, comments and recommendations contained herein do not constitute investment advice. Investment advisory services are provided individually by authorized institutions taking into account the risk and return preferences of individuals. The comments and recommendations contained herein are of a general nature. These recommendations may not be suitable for your financial situation and risk and return preferences. Therefore, making an investment decision based solely on the information contained herein may not produce results in line with your expectations.

