
TECHNICAL ANALYSIS
BTC/USDT
Trade tensions and regulatory developments are at the forefront of crypto and global markets. US President Donald Trump reignited trade wars by announcing that he raised tariffs on imports from China from 10% to 20%. He also announced that reciprocal tariffs will take effect on April 2, while additional tariffs on Canada and Mexico will be implemented next week. On the other hand, the SEC Cryptocurrency Working Group will hold its first roundtable meeting on March 21 to discuss new regulations for the sector. The meeting is expected to prioritize the classification of some tokens as securities.
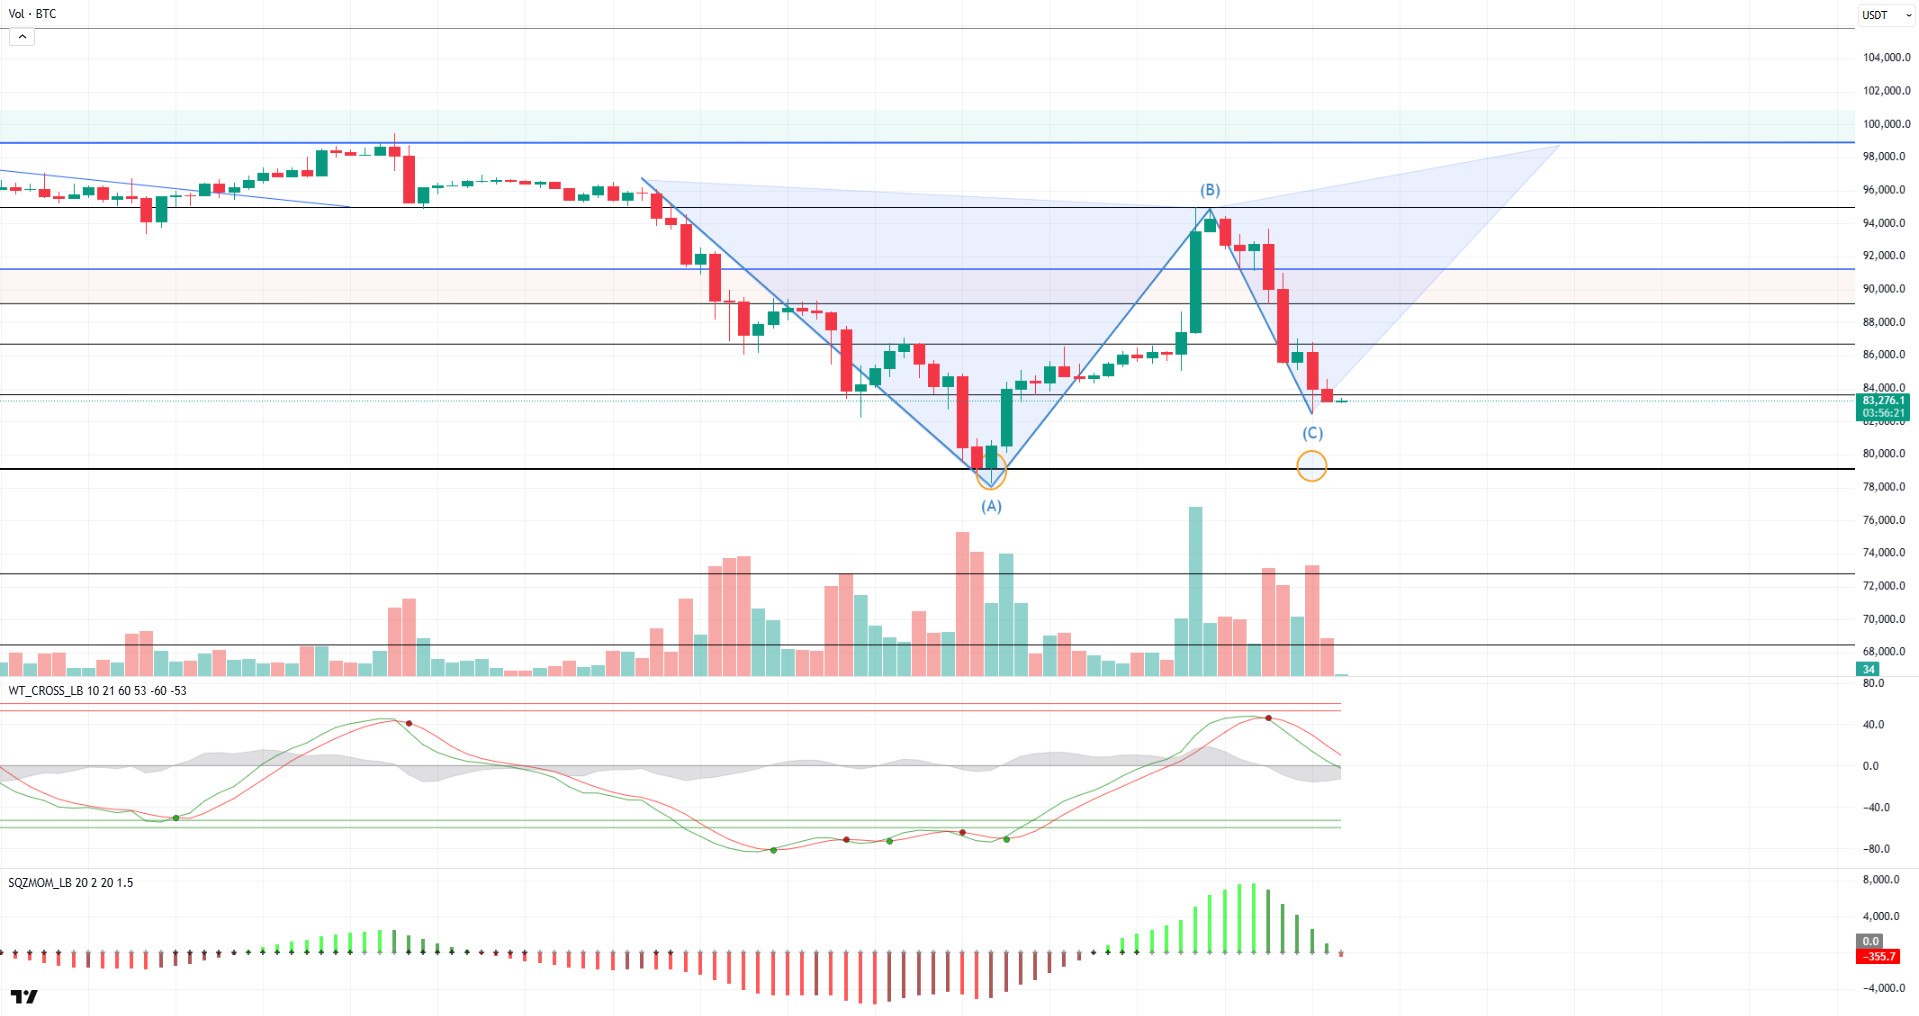
Looking at the technical outlook, BTC has once again experienced a sharp decline due to fundamental developments. Yesterday, the price, which pushed the 95,000 level, tested the 82,500 level again, giving back all the value gains it gained with Trump’s reserve strategies. At the 89,000 level, which we mentioned earlier, we stated that it could technically form a bowl pattern, but BTC broke this level and entered the gap zone, increasing selling pressure and causing this pattern to be invalid. It is noteworthy that the butterfly pattern, one of the harmonic patterns, has started to be seen in the current price action in BTC, which is currently trading at the 83,300 support level. When we look at the technical oscillators, it is observed that BTC, which continues to remain in the oversold zone, maintains the sell signal, while momentum indicators are weakening again. This suggests that the price is still under pressure and needs volume buying for a strong recovery. If the decline deepens, BTC’s previous low of 78,000 will be followed as critical support and a double bottom will be seen if tested. In a possible recovery scenario, the price can be expected to test the intermediate resistance levels of 86,500 and 89,000 with the butterfly pattern. These levels will be decisive on whether the recovery will continue.
Supports 83,500 – 80,000 – 78,000
Resistances 86,500 – 89,000 – 90,400
ETH/USDT
The impact of uncertainties in global markets continues to be felt in the cryptocurrency sector. US President Donald Trump’s signing of the law raising tariffs to 20% and his harsh statements during this process put pressure on the markets. With the wave of sales following these developments, there was a general decline in cryptocurrency markets. Many altcoins, especially ETH, fell back below their previous levels after the weekend rally. ETH gradually retreated to the $2,000 level and found support in this region.
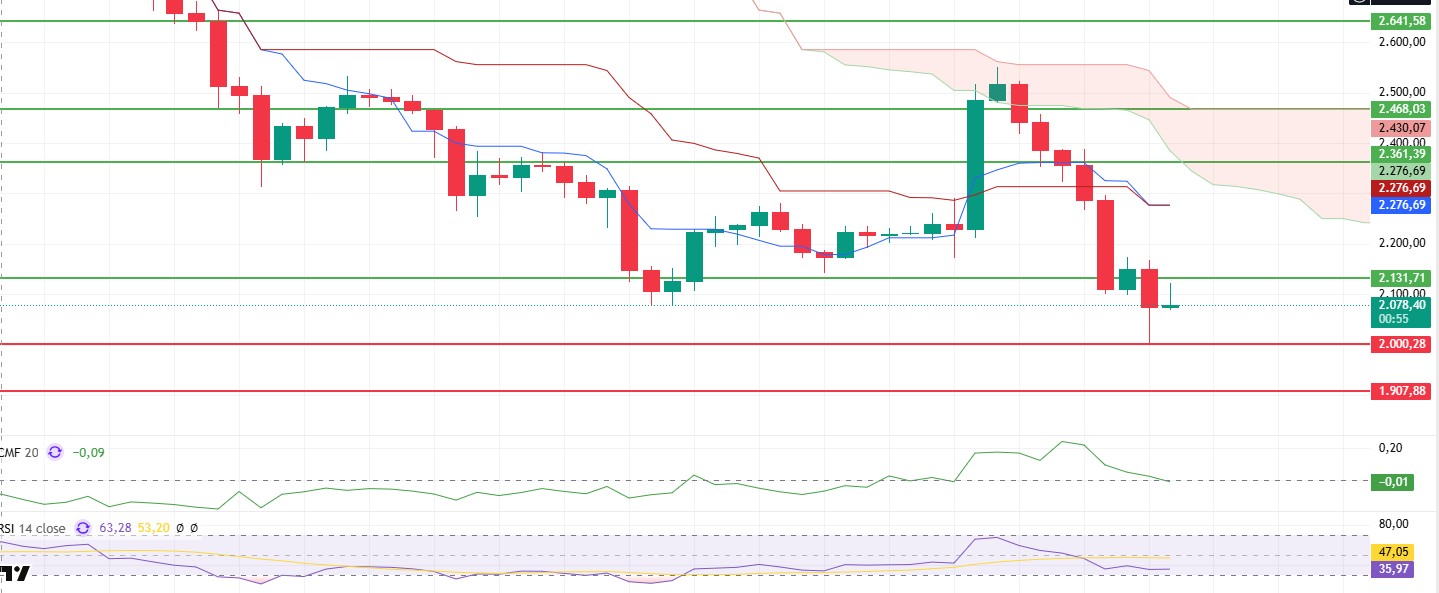
Technical indicators show that the previous negative divergence on Chaikin Money Flow (CMF) is working. CMF has retraced to the zero line and is currently showing positive divergence in this area. This suggests that current levels could be a potential bottom. However, the Relative Strength Index (RSI) continues to look weak, staying below the moving average (MA) baseline. The RSI, which indicates continued selling pressure, is notable for the double bottom formed at 35 levels, which may increase the likelihood of a limited recovery in the short term. The Ichimoku indicator shows that the tenkan and kijun levels are equal to each other, indicating that there is no significant weakness in the market, but there is no clear signal of strength.
Considering the current technical structure, Ethereum price has retreated to critical support levels. A loss of the $2,000-$2,130 support zone could increase selling pressure and bring deeper declines. On the other hand, closes above the $2,130 level could increase the price’s recovery potential by reducing short-term risks.
Supports 2,000 – 1,907 – 1,770
Resistances 2,131 – 2,361 – 2,468
XRP/USDT
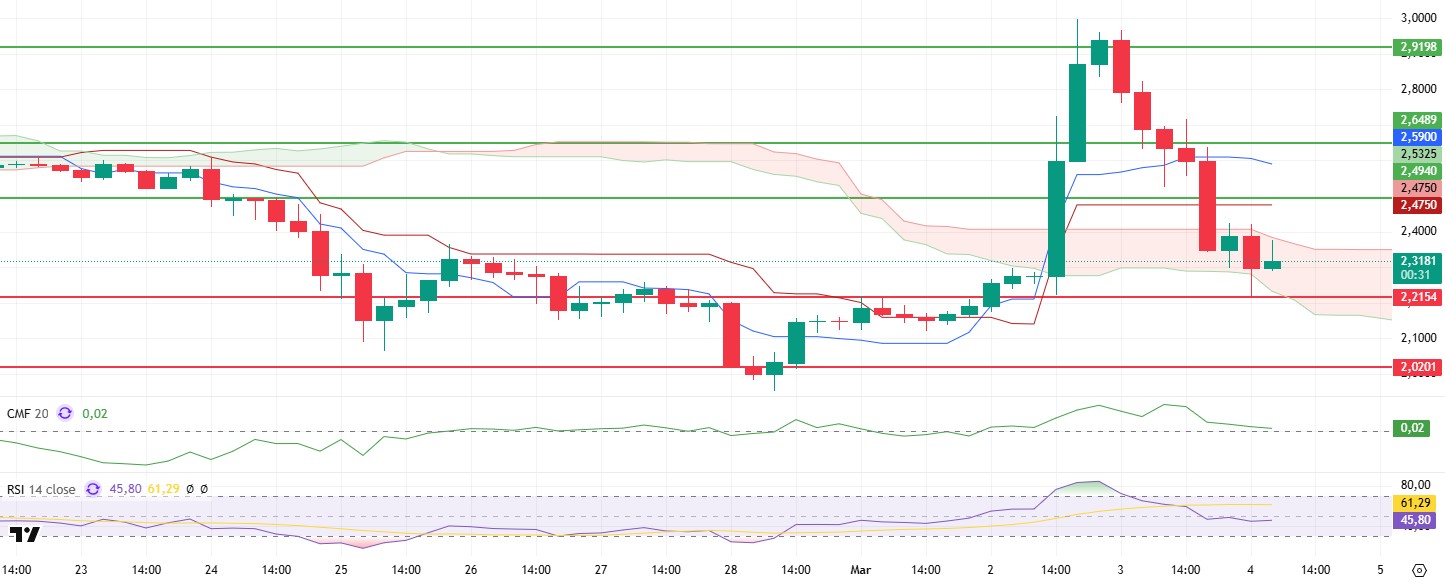
XRP was one of the assets negatively affected by yesterday’s developments. With President Trump’s signing of the law raising customs tariffs to 20% and his harsh statements in the process, XRP fell to the support level of $ 2.21. It can be said that uncertainties continue for XRP, which entered the borders of the kumo cloud again with the support it received from this region.
As the negative divergence in the Chaikin Money Flow (CMF) indicator worked, CMF fell to the zero line. Liquidity outflows are seen to continue. Relative Strength Index (RSI), on the other hand, has formed a positive divergence even though it has fallen to 45 levels, indicating the possibility of price recovery from these regions.
As a result, XRP, which received a reaction from an important support level, may continue its upward movements provided that it does not lose the $ 2.21 level. Loss of the $2.21 level may bring more severe corrections.
Supports 2.2154 – 2.0201 – 1.9890
Resistances 2.4940 – 2.6489 – 2.9198
SOL/USDT
For the fifth month in a row, Solana surpassed all other chains in the market with a decentralized exchange volume of $105 billion. On the other hand, more than $700 million in assets were transferred to Solana from other blockchains via cross-chain bridges in February. Onchainde, on the other hand, fell 21% to $4.2 billion when we look at Open Interest data.
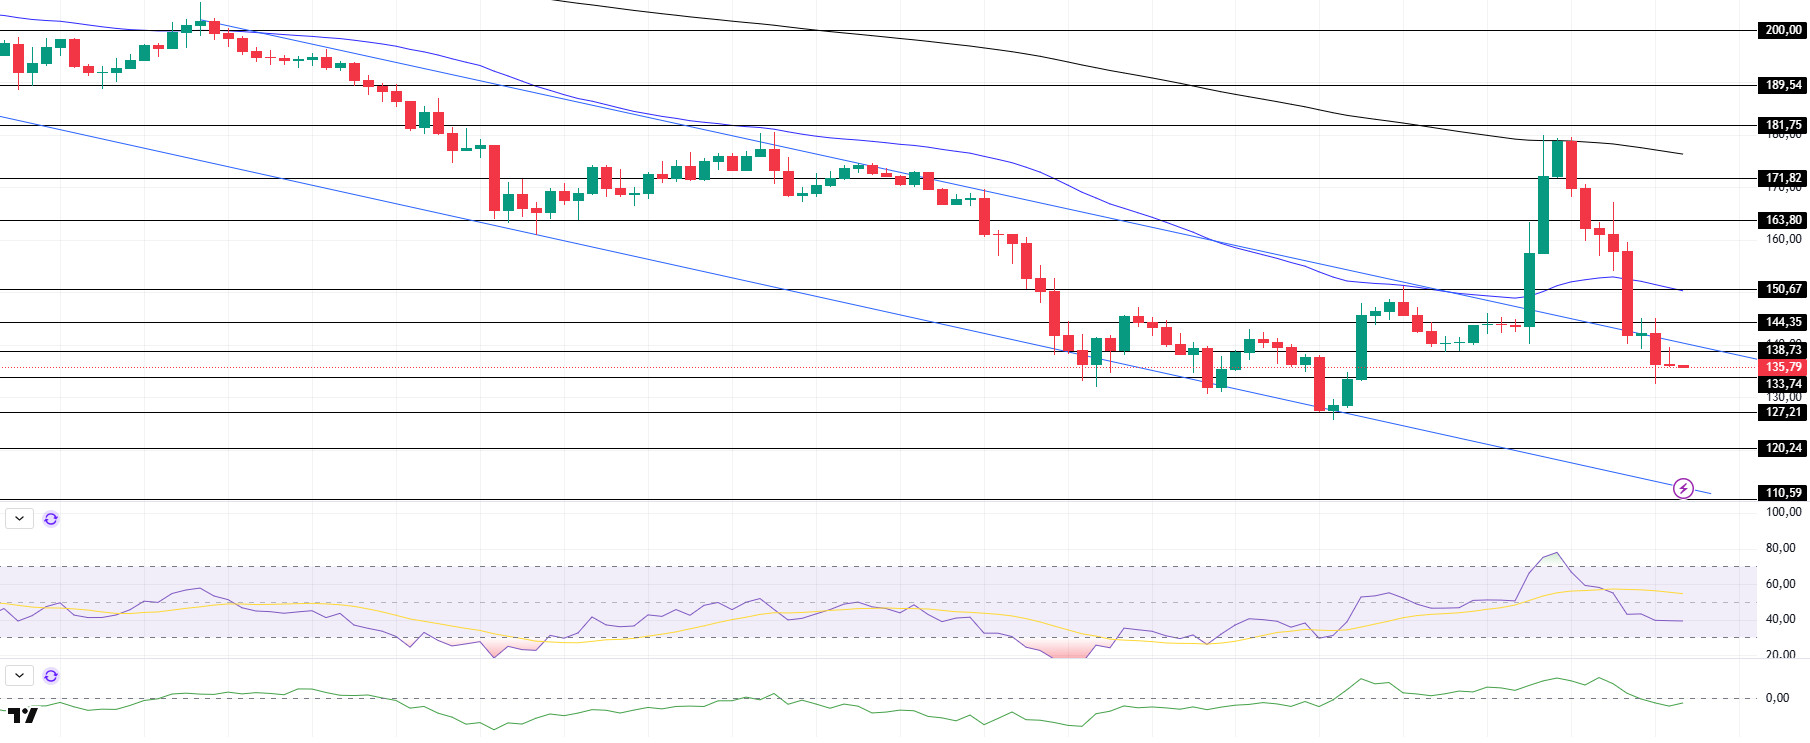
Since our analysis yesterday, SOL has continued to add deeper declines to its decline, which started by failing to break the resistance at the 200 EMA (Black Line). This allowed the asset to re-enter the downtrend. On the 4-hour timeframe, the 50 EMA (Blue Line) continues to be below the 200 EMA (Black Line). This could deepen the decline further in the medium term. At the same time, the price started moving below the two moving averages again. The Chaikin Money Flow (CMF)20 indicator moved into negative territory. As a matter of fact, the decline in volume may further increase money outflows. However, the Relative Strength Index (RSI)14 indicator lost momentum from the positive zone and reached the mid-level of the negative zone. The $150.67 level stands out as a very strong resistance point in the rises driven by both the upcoming macroeconomic data and the news in the Solana ecosystem. If it breaks here, the rise may continue. In case of retracements for the opposite reasons or due to profit sales, the support level of $ 127.21 can be triggered. If the price comes to these support levels, a potential bullish opportunity may arise if momentum increases.
Supports 133.74 – 127.21 – 120.24
Resistances 138.73 – 144.35 – 150.67
DOGE/USDT
NYSE Arca filed a 19b-4 application with the US Securities and Exchange Commission (SEC) to list and trade a Dogecoin (DOGE) exchange-traded fund (ETF) from Bitwise. According to the application, Coinbase Custody will act as custodian. Meanwhile, Bank of New York Mellon (BNY Mellon) will manage cash holdings, administration and record keeping.
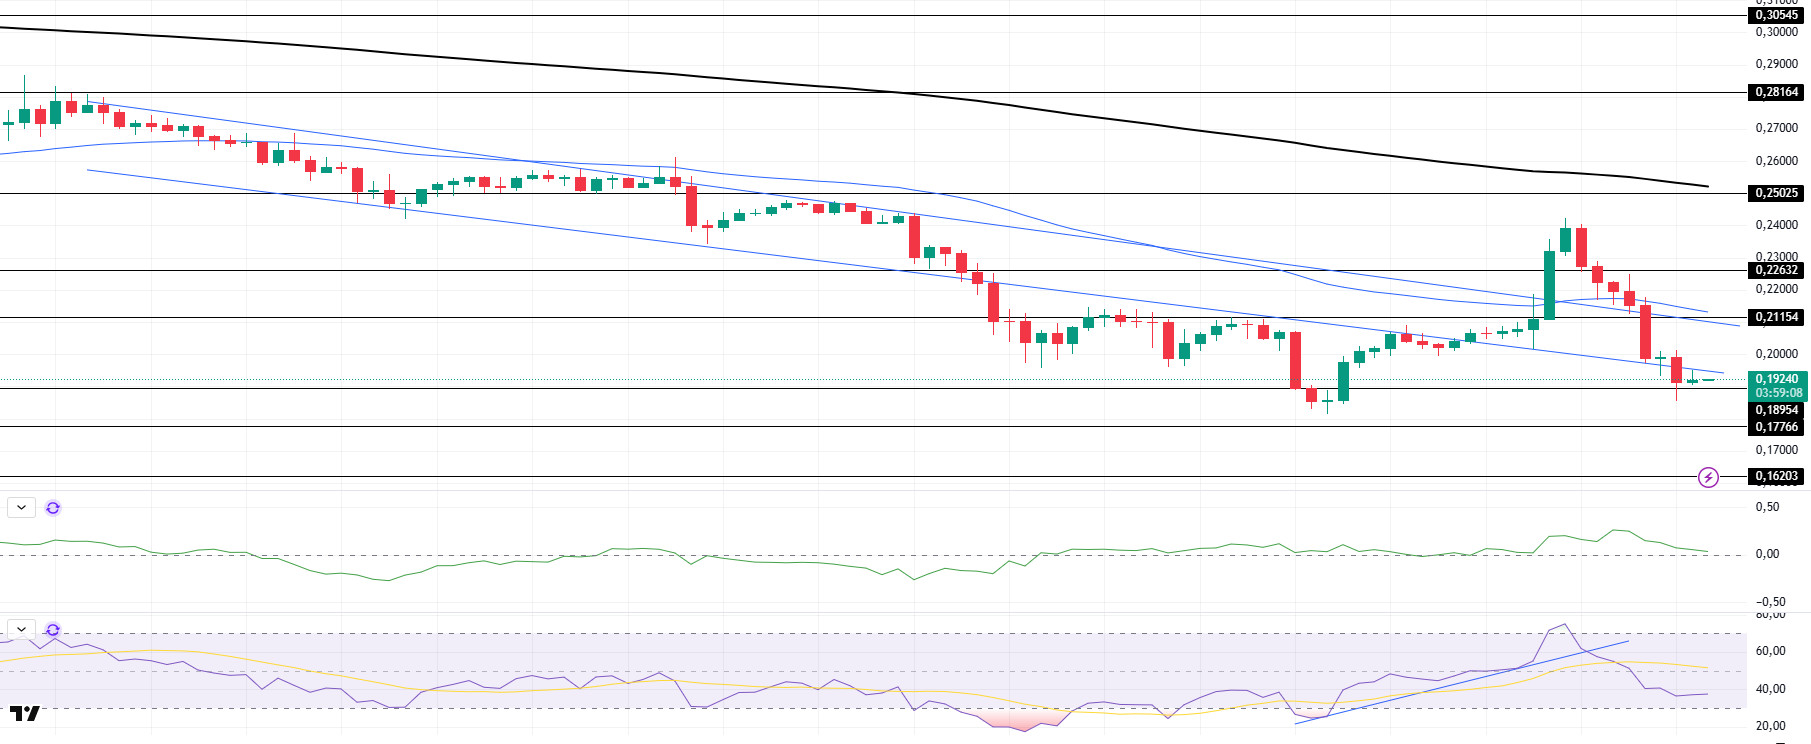
DOGE has dropped 13% since our analysis yesterday. As of now, the price tested the bottom of the downtrend as resistance and fell slightly. On the 4-hour timeframe, the 50 EMA (Blue Line) is below the 200 EMA (Black Line). This could mean that the decline could deepen further in the medium term. However, the price is below the two moving averages. However, the difference between the two moving averages as well as the difference between the price and the 50 EMA increases the probability that DOGE will rise. The Chaikin Money Flow (CMF)20 indicator is in positive territory. However, the negative daily volume may reduce money inflows. On the other hand, Relative Strength Index (RSI)14 accelerated downwards from the overbought level again and was found at the mid-level of the negative zone. However, the RSI has broken the downward uptrend that started on February 28. This downtrend may continue. The level of 0.21154 dollars appears as a very strong resistance level in the rises due to political reasons, macroeconomic data and innovations in the DOGE coin. In case of possible pullbacks due to political, macroeconomic reasons or negativities in the ecosystem, the $0.18954 level, which is the base level of the trend, is an important support. If the price reaches these support levels, a potential bullish opportunity may arise if momentum increases.
Supports 0.18954 – 0.17766 – 0.16203
Resistances 0.21154 – 0.22632 – 0.25025
 LEGAL NOTICE
The investment information, comments and recommendations contained herein do not constitute investment advice. Investment advisory services are provided individually by authorized institutions taking into account the risk and return preferences of individuals. The comments and recommendations contained herein are of a general nature. These recommendations may not be suitable for your financial situation and risk and return preferences. Therefore, making an investment decision based solely on the information contained herein may not produce results in line with your expectations.
