
Technical Analysis
BTC/USDT
While wage-inflation dynamics in Japan are proving persistent, the Bank of Japan is expected to continue its normalization process gradually. On the US side, the marked slowdown in the labor market indicates that the Fed has not completely closed the door on interest rate cuts, but that this process will not be rushed. Meanwhile, US airstrikes against ISIS in Nigeria have brought Washington’s military engagement in Africa back into the spotlight.
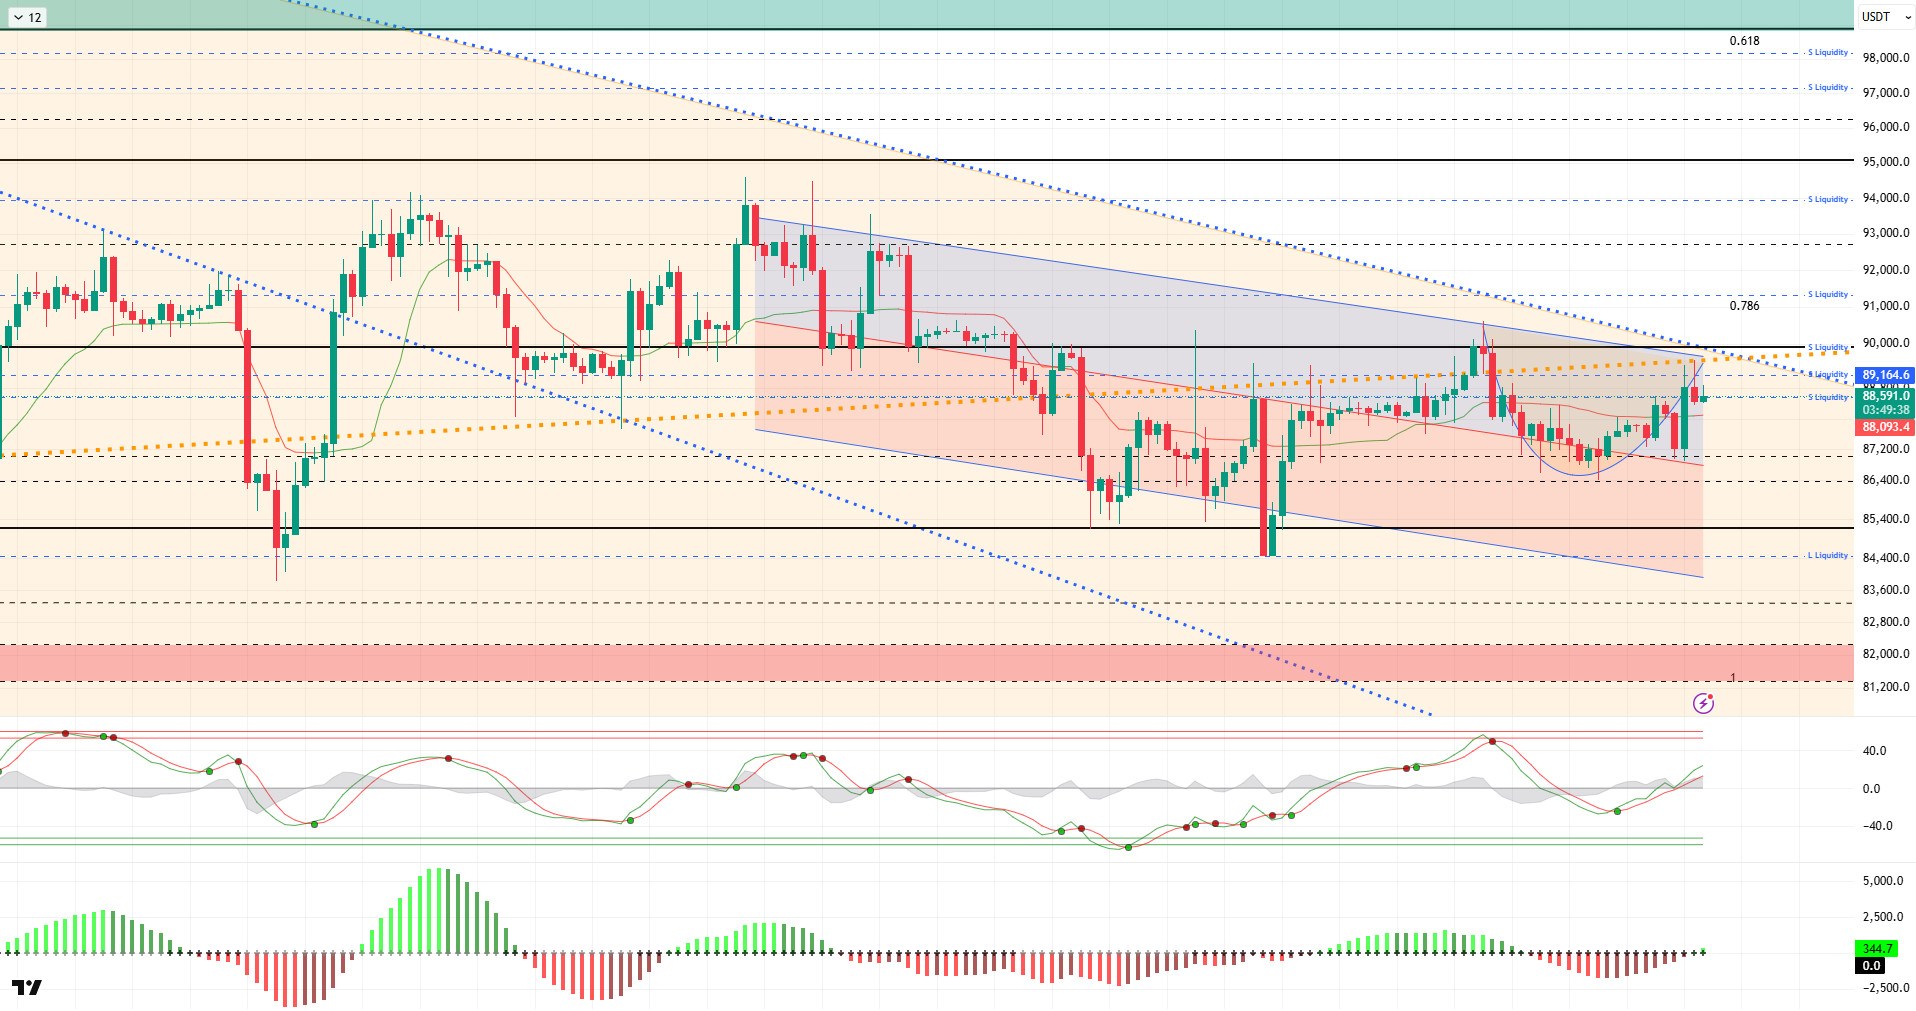
From a technical perspective, BTC continues to trade within a descending trend channel, occasionally testing the channel’s midline and upper trend line. Most recently, the price rebounded from the 87,000 support level, reversing its direction upward to reach 89,500. The price, which bought liquidity here, also reached the highest point of the major orange band of decline that started since the ATH level and the intersection of the major uptrend. If it passes this point, upward momentum may increase with closes above the 90,000 level.
Technical indicators show that the Wave Trend (WT) oscillator ended its sell signal in the overbought zone at the channel’s middle band and switched back to a buy signal. The histogram on the Squeeze Momentum (SM) indicator moved into positive territory, aligning with the oscillator. The Kaufman moving average (KAMA) is currently trading just below the price at $88,103.
When examining liquidation data, an increase in volume was observed in the buy-sell tiers for BTC. Although fragmented buy tiers formed at the 84,000 and then 86,000 levels, the 86,000 tier was liquidated with the recent decline. Conversely, the accumulation formed in the short term at the 88,000–89,000 sell levels also resulted in liquidation. In a broader time frame, the level above 91,000 stands out as a liquidity zone.
In summary, as we approach the end of the year, the market environment remains calm, while the BoJ indicates that interest rate hikes will continue next year. On the US side, while the Fed is expected to maintain its cautious stance, the US airstrike in Nigeria has become the focus of the market. Technically, BTC continues to price with indecisive structures, and no clear upward movement has yet formed.Looking at liquidity data, it appears that areas with concentrated short-term trading are being targeted, while long-term sell orders have not yet been tested. After this stage, the 89,000 level will be monitored as a critical point where the major uptrend passes through for the price to regain momentum. Closes and price action above this level are important indicators for regaining momentum. If selling pressure deepens, 86,000 emerges as a short-term liquidity area, while the 85,000 level is an important reference point.
Supports: 88,000 – 86,300 – 85,000
Resistances: 89,000 – 90,000 – 91,400
ETH/USDT
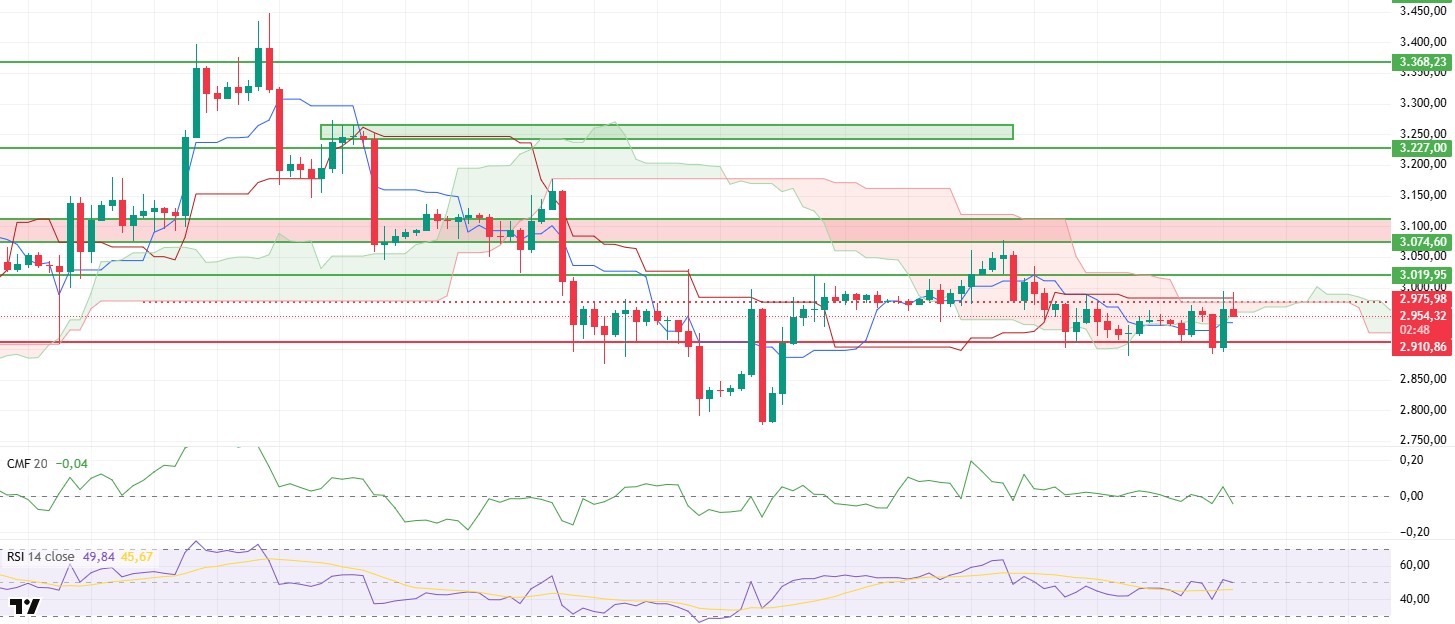
Although the ETH price briefly fell below $2,910 yesterday evening, it failed to hold in this region and quickly rebounded with buyers stepping in. With the incoming purchases, the price first rose above the $2,975 level, then retreated to around $2,960 with selling pressure from this region. The price movement during the day shows that downward attempts have not continued at this stage, but there has been no clear strengthening on the upside either.
There is no significant change in the money entering the market. Chaikin Money Flow (CMF) continues to move around the zero line. This picture shows neither a strong wave of buying nor a sharp exit. As weakness persists on the volume side, price movements are shaped more by short-term buy-sell balance.
A similar indecision prevails on the Relative Strength Index (RSI) front. The RSI is hovering around the 50 level, indicating that buyers have not yet taken control. For upward momentum to continue, a clearer strengthening on the RSI side is needed.
Looking at the Ichimoku indicator, the price remains within the kumo cloud. The thinning of the cloud indicates that the search for direction continues. The price moving between the Tenkan and Kijun levels also supports this indecisive structure. It would not be surprising if this consolidation continues for a while longer before a clear breakout occurs.
In the current scenario, the $2,910 level remains an important support level on the downside. If the price falls below this level again, selling could accelerate. On the upside, staying above $2,975 could pave the way for the price to regain strength. At this stage, there is neither a strong decline nor a clear rise in ETH. The market is still searching for direction and waiting at a decision point.
Below the Form
Supports: 2,910 – 2,727 – 2,625
Resistances: 3,019 – 3,074 – 3,227
XRP/USDT
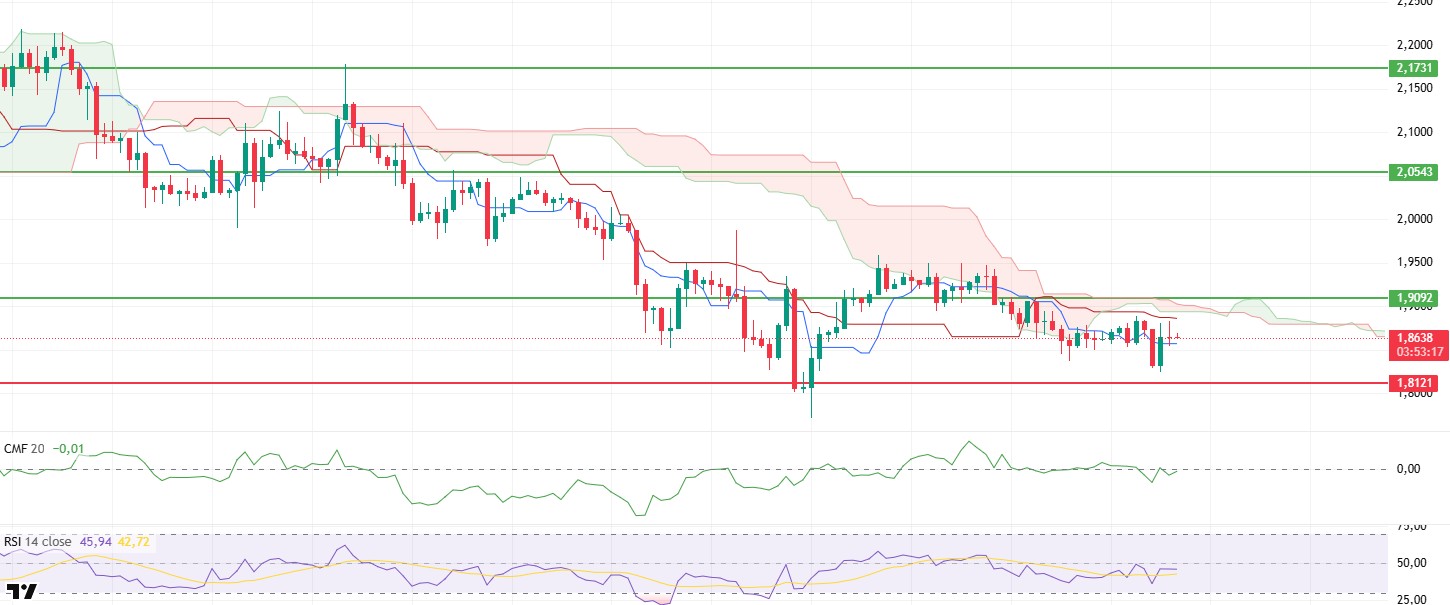
The price on the XRP side has remained within a limited range since yesterday evening. The price, which rose to the $1.88 level, could not remain in this region and returned to around $1.86 with light selling. The overall structure of the movement shows that there is neither strong buying demand nor aggressive selling pressure in the market. It is more of a calm flow shaped by short-term trading.
There is no significant change in the amount of money entering and leaving the market. Chaikin Money Flow (CMF) is moving sideways without taking a clear direction in either the positive or negative zone. This picture suggests that buyers have not completely withdrawn, but they are not eager enough to initiate a new rise. The low volume explains why the price is fluctuating within a narrow range.
A similar balance prevails on the Relative Strength Index (RSI) front. The RSI continues its horizontal movement and does not produce a clear signal in favor of buyers or sellers. This outlook suggests that current levels are being defended rather than a sharp directional change in the short term.
A small but important detail stands out on the Ichimoku side. The price has managed to rise above the Tenkan level again. This indicates that selling pressure has decreased in the short term. However, the Kijun line and kumo cloud are still above. Therefore, it is too early to talk about a clear trend change in technical terms. The current structure paints a picture of both a desire for recovery and a cautious stance.
The overall picture has not changed significantly compared to previous days. The $1.90 level remains the main threshold for upward movement. Until this level is crossed, the price is expected to move more horizontally and in a controlled manner. On the downside, the $1.81 level retains its importance. The current structure indicates that XRP is continuing a process of establishing equilibrium through waiting, rather than seeking a hasty direction.
Supports: 1.8121 – 1.6224 – 1.5146
Resistances: 1.9092 – 2.0543 – 2.1731
SOL/USDT
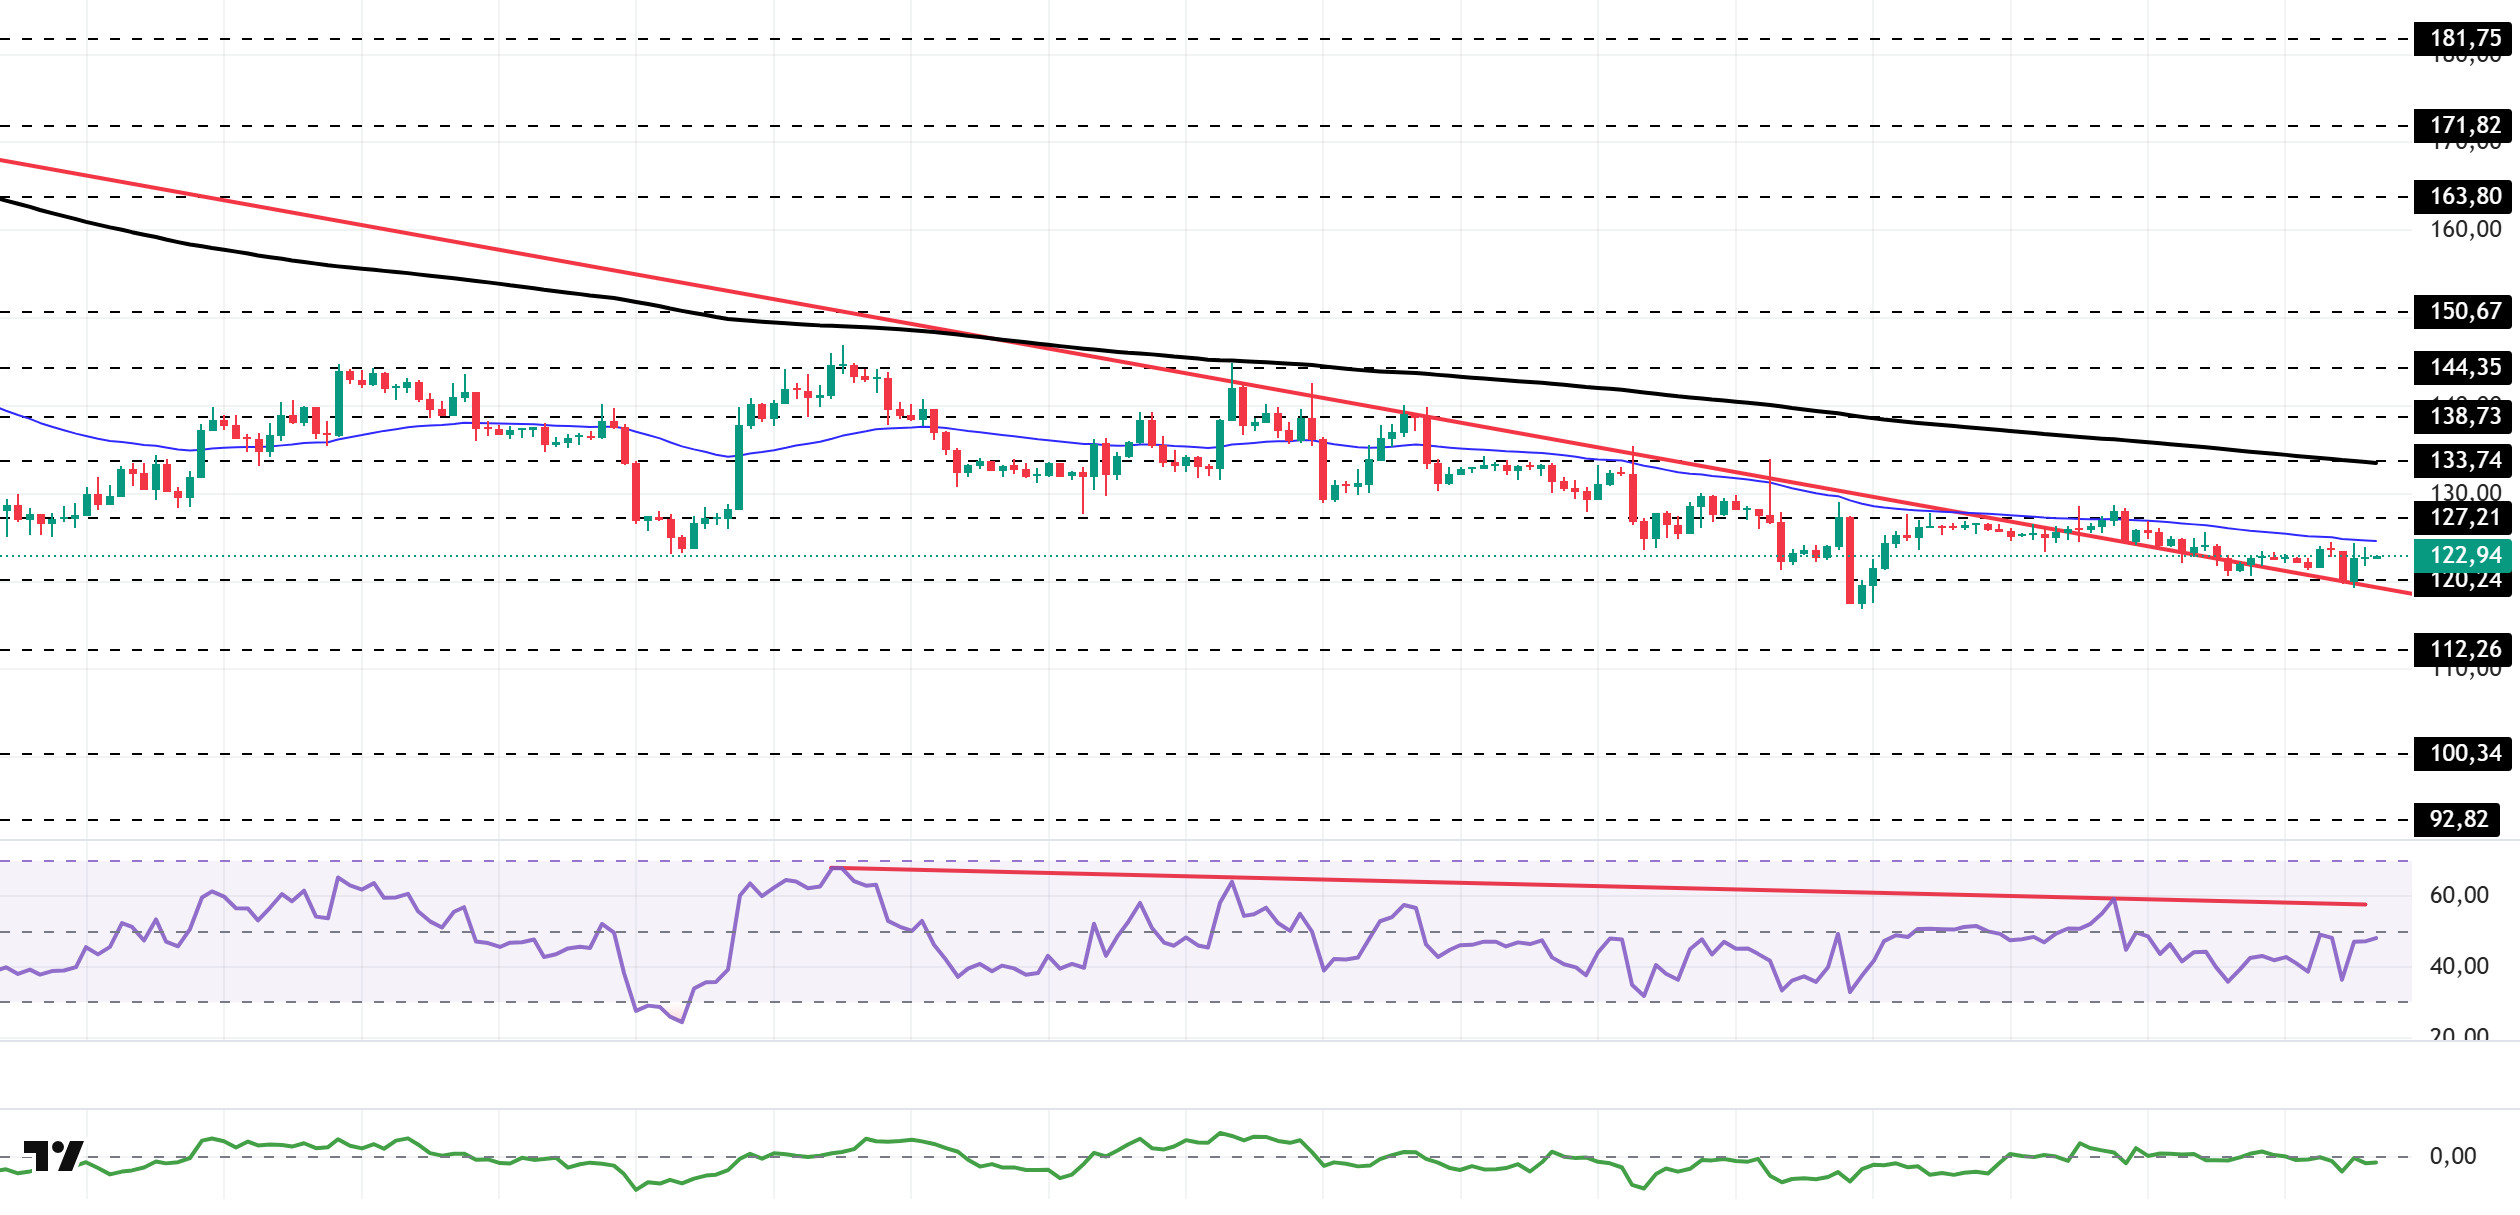
The SOL price showed an upward trend. The asset continued to trade in the upper region of the downtrend that began on October 8. Testing the strong support level of $120.24 and the downtrend as support and gaining momentum, the price is currently testing the 50 EMA (Blue Line) moving average as resistance. If it closes above the 50 EMA, it may test the 200 EMA (Black Line) moving average as resistance. In case of a pullback, the $120.24 level may act as support.
On the 4-hour chart, it continued to remain below the 50 EMA (Exponential Moving Average – Blue Line) and 200 EMA (Black Line). This indicates that the downtrend continues in the medium term. At the same time, the price being below both moving averages indicates that the asset is trending downward in the short term. The Chaikin Money Flow (CMF-20) remained at a neutral level. However, an increase in money inflows could push the CMF into positive territory. The Relative Strength Index (RSI-14) rose from the middle of the negative zone to a neutral level. However, it remained below the downward trend that began on December 3. This indicated that selling pressure continued. If there is an upturn due to macroeconomic data or positive news related to the Solana ecosystem, the $133.74 level stands out as a strong resistance point. If this level is broken upwards, the uptrend is expected to continue. In the event of pullbacks due to developments in the opposite direction or profit-taking, the $112.26 level could be tested. A decline to these support levels could increase buying momentum, presenting a potential upside opportunity.
Supports: 120.24 – 112.26 – 100.34
Resistances: 127.21 – 133.74 – 138.73
DOGE/USDT
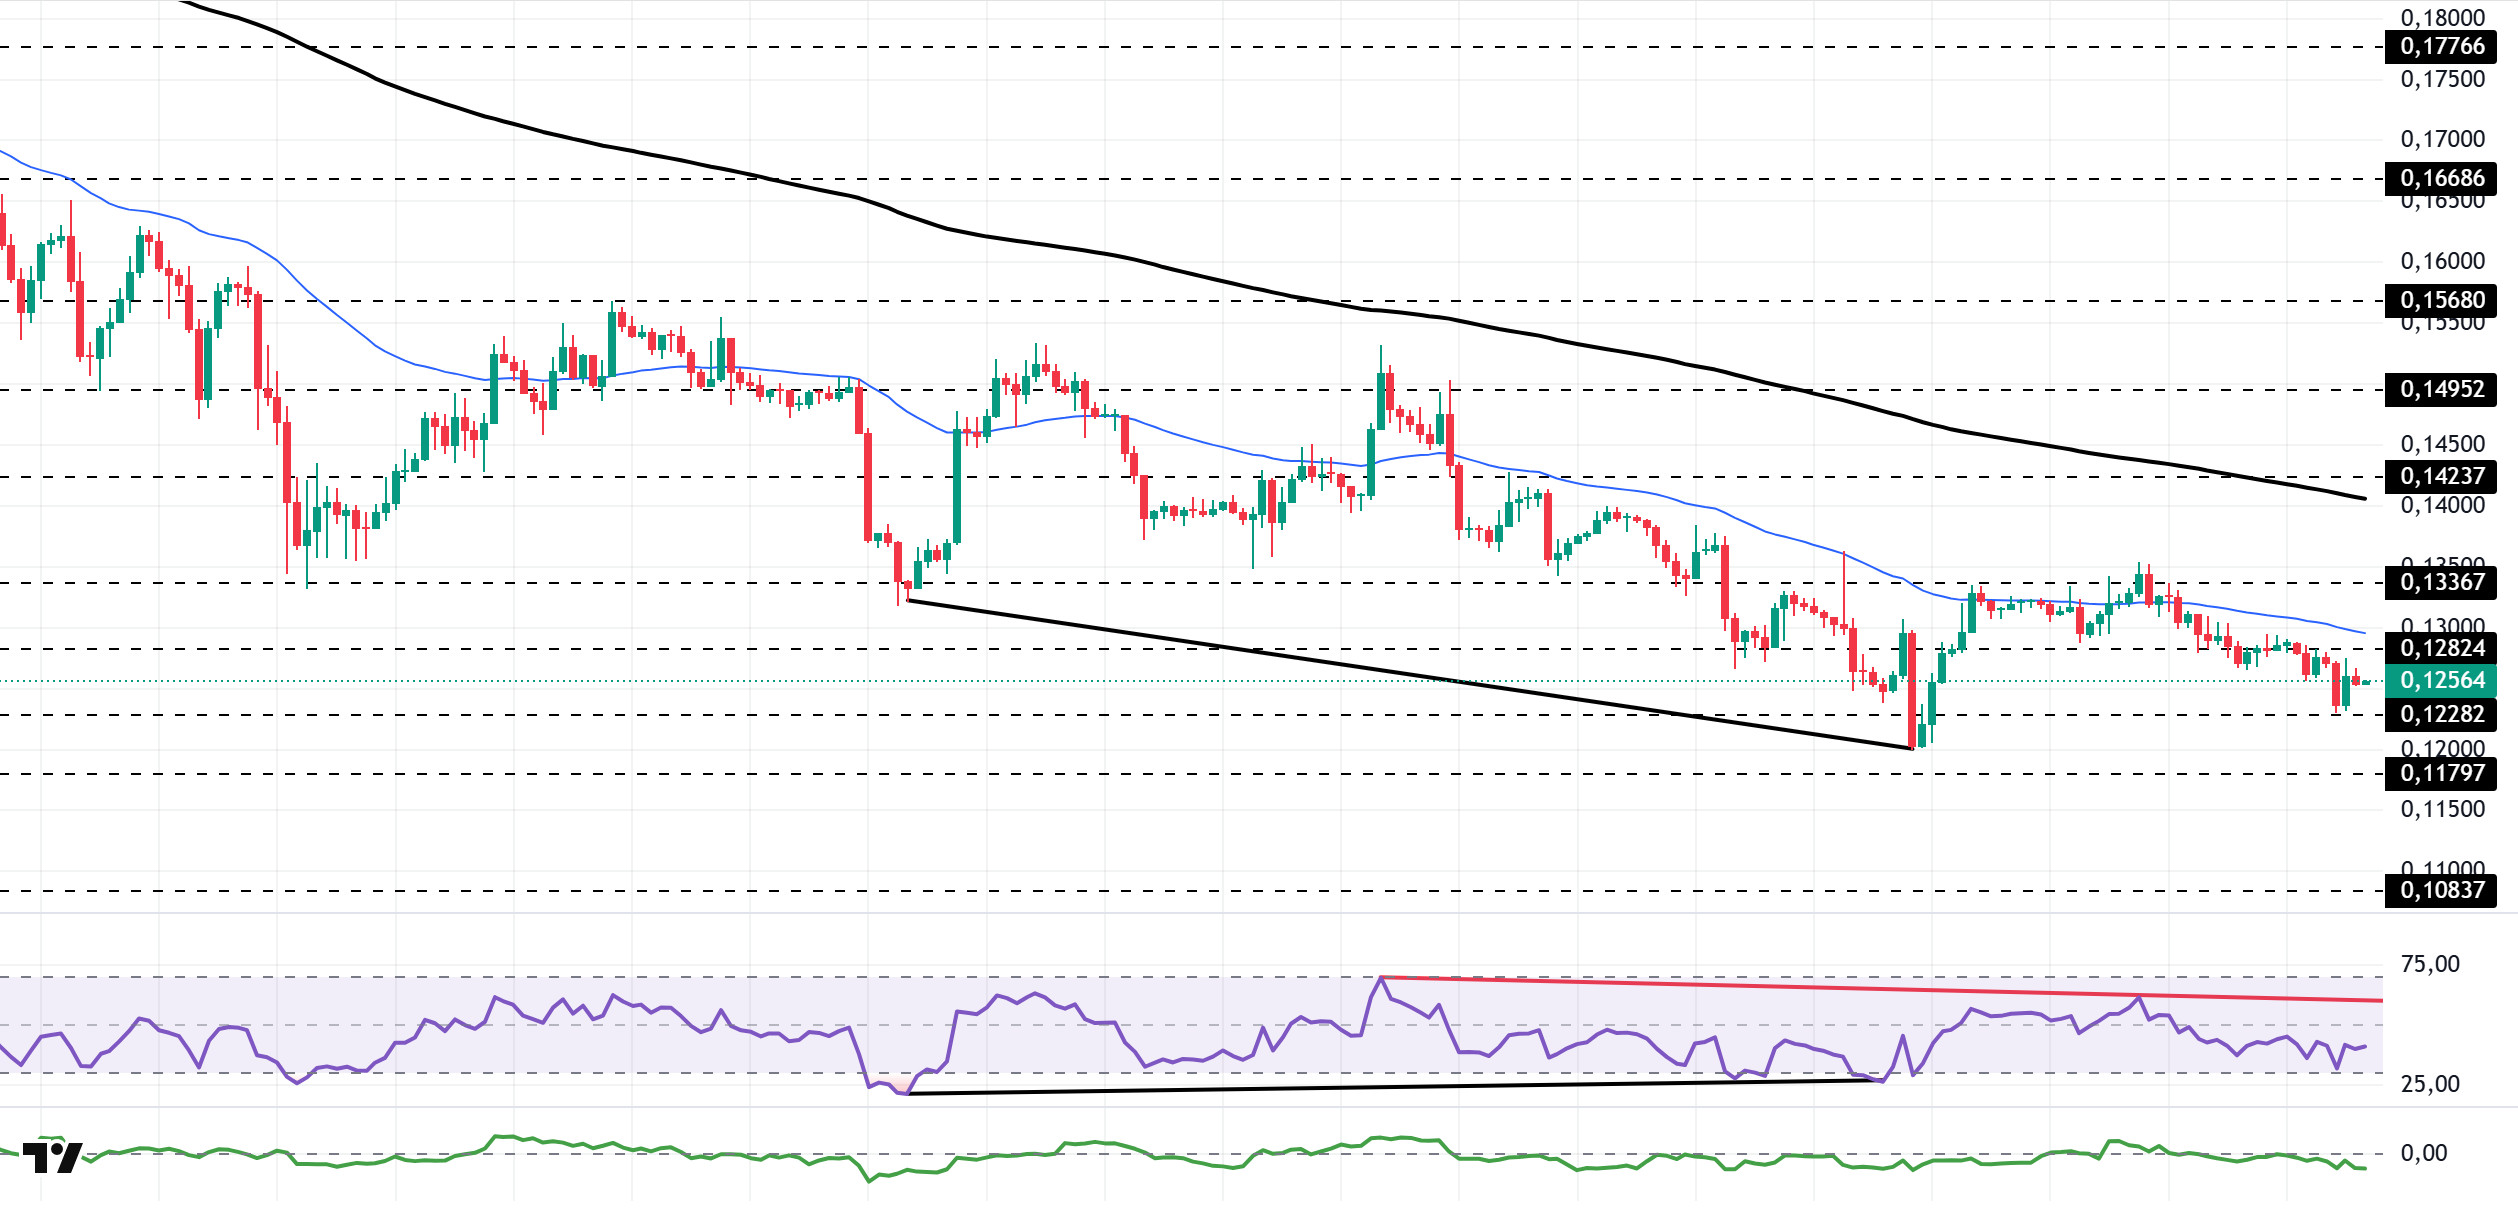
The DOGE price experienced a slight increase. The asset remained below the 50 EMA (Blue Line) moving average, signaling that the pullback pressure continues. Gaining momentum from the strong support level of $0.12282, the price is currently testing the 50 EMA moving average and the $0.12824 level as resistance. If it closes above this level, it may test the 200 EMA (Black Line) moving average as resistance. In the event of a pullback, the $0.12282 level could act as support again.
On the 4-hour chart, the 50 EMA (Exponential Moving Average – Blue Line) remained below the 200 EMA (Black Line). This indicates that the downtrend may continue in the medium term. The price being below both moving averages indicates a downward trend in the short term. The Chaikin Money Flow (CMF-20) remained in negative territory. Additionally, a decrease in money inflows could push the CMF deeper into negative territory. The Relative Strength Index (RSI-14) also remained in negative territory. At the same time, it continued to stay below the downward trend line that began on December 9. This signaled that selling pressure was continuing. On the other hand, the positive divergence remains valid. In the event of a rise due to political developments, macroeconomic data, or positive news flow in the DOGE ecosystem, the $0.14237 level stands out as a strong resistance zone. Conversely, in the event of negative news flow, the $0.11797 level could be triggered. A decline to these levels could increase momentum and start a new wave of growth.
Supports: 0.12282 – 0.11797 – 0.10837
Resistances: 0.12824 – 0.13367 – 0.14237
LTC/USDT
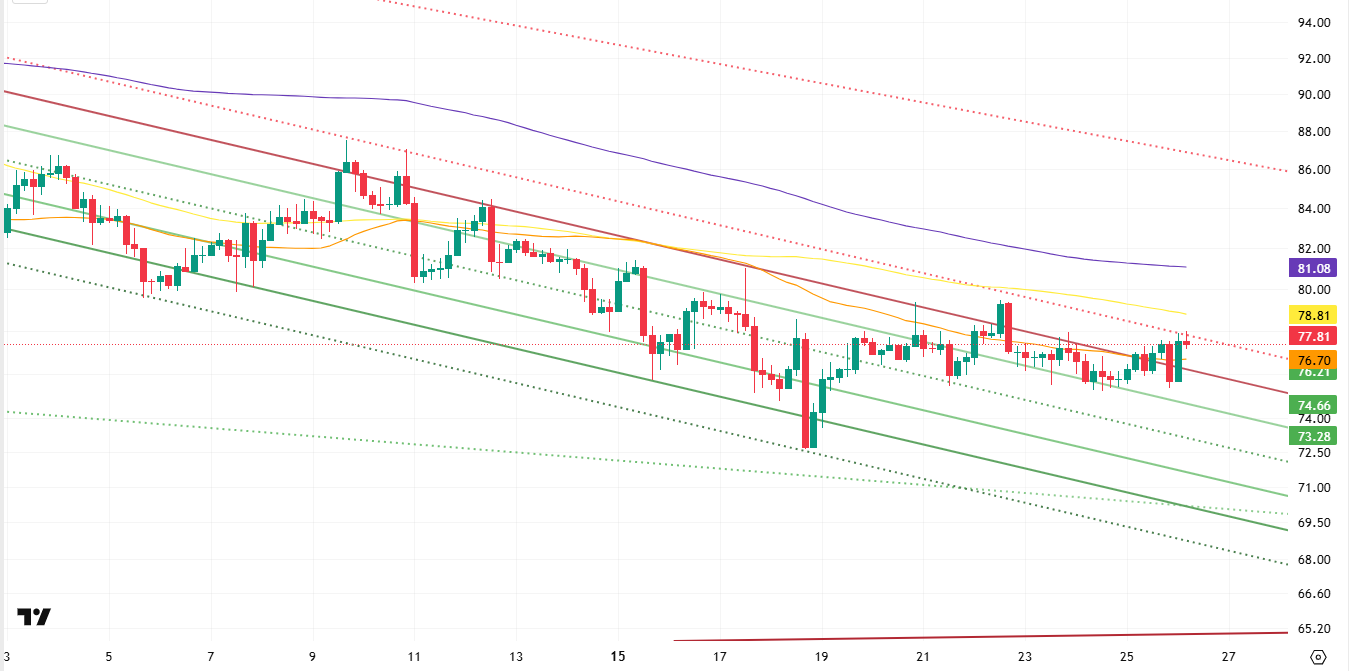
Price movements in the Litecoin (LTC) / USDT pair ended the previous day with a 0.11% loss in value. At the same time, LTC’s 0.46% increase compared to Bitcoin indicates that Litecoin performed strongly against Bitcoin within the general market movements and that the reason for the decline was Bitcoin’s downward movement. On the futures front, the long/short position ratio standing at 0.952 over the last 24 hours indicates that derivative market participants have stronger downward expectations for LTC.
A technical analysis of Litecoin’s 4-hour USDT pair shows that the price is below the 200 and 100-period moving averages (purple and yellow lines, respectively) and above the 50-period moving average (T orange line) above. This outlook aligns with the increase in short positions relative to long positions in the derivatives markets, confirming that the downward trend is approaching neutral but has not yet fully reversed.
However, the current price structure also holds the potential to shift to a positive direction if it transitions to a neutral outlook. In this scenario, the first strong resistance area that the upward movement may encounter is the upper line of the descending channel at the 77.81 level. This resistance zone stands out as an important critical step toward transitioning from a negative to a neutral outlook. If this level is exceeded, the 78.81 level will come into focus with the selling pressure created by the 100-period moving average, which should be monitored intraday. If the uptrend gains momentum and heads towards the 81.08 level, the uptrend is likely to remain limited due to the effect of the 200-period moving average.
In the event of a downward movement, the first important support level is observed at 76.21, which offers a strong structure in terms of support. However, if this level is broken downwards, selling pressure is expected to increase, bringing the support levels of 74.66 and 73.28 into focus. The 73.28 level, in particular, has strong reaction potential due to its position in the middle band of the channel structure.
Supports: 76.21 – 74.66 – 73.28
Resistances: 77.81 – 78.81 – 81.08
BNB/USDT
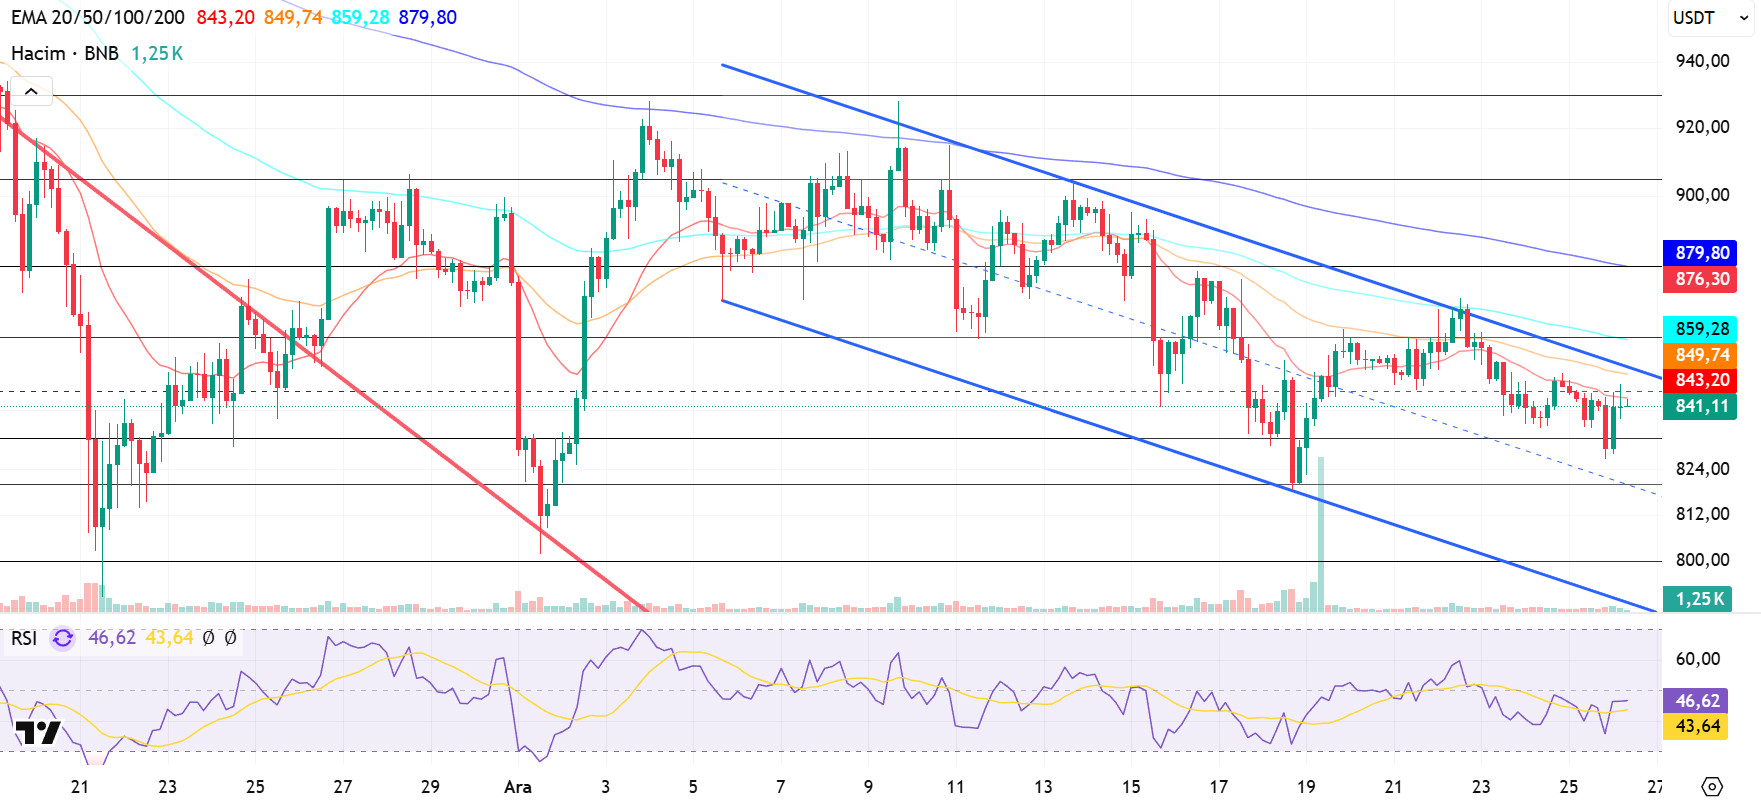
From a technical perspective, the BNB/USDT pair, which has been seeking support for some time, has ended its downward momentum with the candlestick formations that have formed and has turned its direction back upwards. With this recovery process, BNB has risen to the $930 level by testing the downward trend upwards with the support provided by the new candlesticks. While selling pressure has increased in this region depending on market conditions, the asset appears to be continuing its movement within a declining channel for some time.
Overall, the BNB/USDT pair presents a flat positive picture. In this context, the price fluctuating within a flat band indicates that the search for direction continues in the medium term. If upward price movements gain strength, the positive outlook is expected to be supported.
Currently trading in the $830–860 range, technical indicators for BNB reveal that low trading volume is limiting the upward momentum. Additionally, the RSI indicator is seen hovering at relatively low levels due to weak momentum.
Within the technical outlook, if buying appetite is maintained and market momentum strengthens, BNB is expected to retest the $860 resistance level in the first stage. Breaking above this level could potentially lead to a breakout above the downtrend line. If the trend breakout is confirmed and the price manages to hold above this level, a rise towards the $880 and $905 levels appears technically feasible.
On the other hand, if selling pressure increases, the price is expected to retest the $830 support level. If this level is broken downward, a pullback towards the $820 and $800 support zones will be on the agenda.
Supports: 830 – 820 – 800
Resistances: 860 – 880 – 905
Legal Notice
The investment information, comments, and recommendations contained herein do not constitute investment advice. Investment advisory services are provided individually by authorized institutions taking into account the risk and return preferences of individuals. The comments and recommendations contained herein are of a general nature. These recommendations may not be suitable for your financial situation and risk and return preferences. Therefore, making an investment decision based solely on the information contained herein may not produce results in line with your expectations.

