
Technical Analysis
BTC/USDT
While rhetoric remains harsh on the Japan-China front, Tokyo’s quiet retreat has created conditions for a de facto softening. Meanwhile, in the Russia-Ukraine file, a new round of talks under US mediation and Putin’s emphasis on “legal legitimacy” show that the process remains fragile but dynamic. In the markets, JPMorgan’s move into Bitcoin-linked products reignited manipulation debates, while the record high in BTC options open interest raised expectations for year-end volatility; the prolonged technical outage at CME and Bhutan’s potential OTC ETH sales also created a cautious backdrop regarding liquidity and supply.
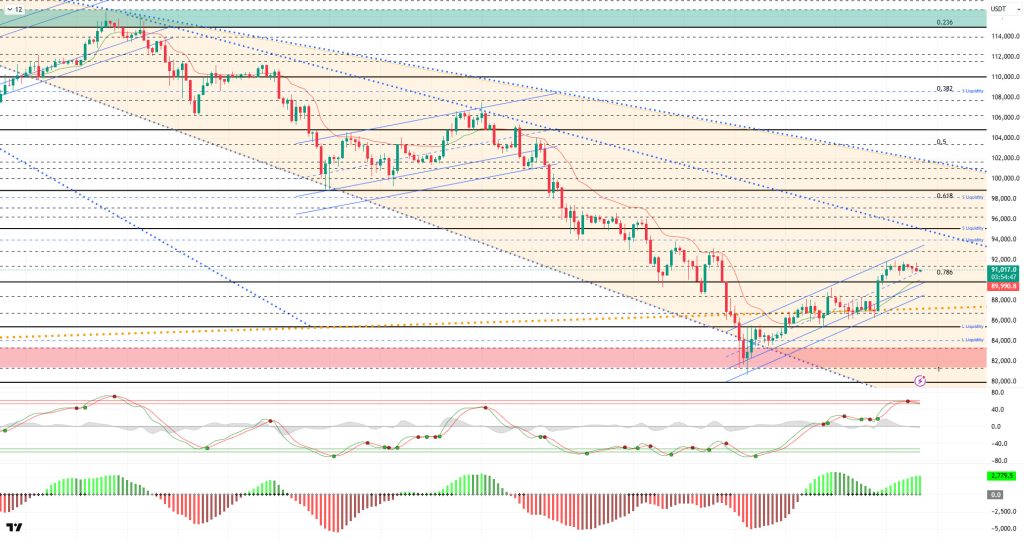
From a technical perspective, BTC continues to move within a minor ascending channel, while declining volatility and volume have confined price movements to a narrow band. Following the high-volume 87,000–91,400 candle, price movements began to weaken with shorter candles and a doji candle, indicating that this region acts as a strong resistance level. At the same time, the 90,000 reference level, which is the 0.786 Fibonacci level, is being monitored as a critical region.
Technical indicators are preparing for a trend reversal, with the Wave Trend (WT) oscillator giving a sell signal in the overbought zone, while the Squeeze Momentum (SM) indicator’s histogram is gaining momentum in positive territory, recording divergence. The Kaufman Moving Average (KAMA) is currently positioned below the price at the $89,900 level.
According to liquidation data, investors are repositioning themselves in the buy zone with the recent rise, with 88,900 emerging as the short-term congestion level, while 85,000 continues to maintain its congestion as the main liquidity zone.The partial short-term selling level is gaining intensity at the 92,300 level, while the next selling level maintains its accumulation at the 94,100 level.
In summary, following the rise driven by expectations of an interest rate cut in BTC, positive developments on the Russia-Ukraine front eased selling pressure, bringing the price into a consolidation phase and supporting it at current levels. Finally, the Beige Book’s background supporting interest rate cuts was a significant driving force in the price regaining momentum. Technically, the price successfully continued its attempt to form an upward channel with upward momentum, recovering from the 80,500 bottom and settling back above the 90,000 band. Liquidity data confirmed that target zones have regained importance and that a partial equilibrium has formed in the market. For the uptrend to become sustainable in the coming period, closes above the 90,000 level, which is being monitored as a reference point, are critical. Should demand regain strength and potential catalysts such as ETFs come into play, the 94,000 level emerges as an important liquidity zone, with 95,000 as the next reference zone. Conversely, if selling pressure increases, 90,000 remains a critical support level, while a break below this level would see the price tested at the 89,000 level.
Supports: 90,000 – 89,000 – 87,000
Resistances: 91,400 – 92,600 – 94,000
ETH/USDT
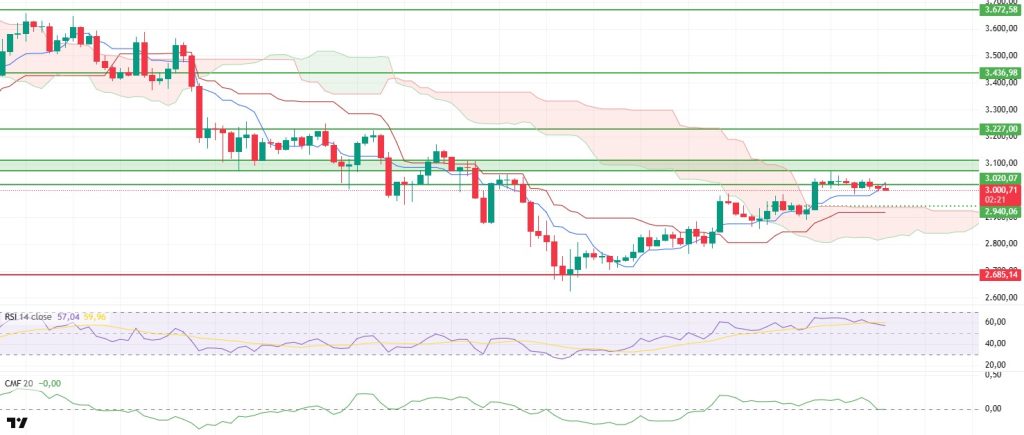
The Ethereum price continues its sideways movement at the $3,020 level throughout the day, maintaining the indecisive structure in the market. The battle of strength between buyers and sellers is concentrated in this area, which is a critical threshold in terms of determining the price direction.
The Chaikin Money Flow (CMF) indicator’s retreat toward the zero line in the morning hours indicates increasing weakness on the liquidity side. The low trading volume in the market due to the Thanksgiving holiday may have accelerated these liquidity outflows. If the CMF does not show signs of recovery, a downward scenario may be faced in the short term.
The Relative Strength Index (RSI) indicator continues to move sideways, showing no significant strengthening in momentum. The RSI’s downward trend may make it difficult to break through resistance levels, and volatile price movements may continue.
The technical structure of the Ichimoku indicator has not changed. The price managing to stay above the kumo cloud maintains the medium-term positive scenario. However, the failure to achieve a strong hold above the Tenkan line shows a weak outlook in the short term.
The $3,020 level will be closely monitored for the rest of the day. If this level is strongly surpassed, the price could gain new momentum towards the $3,070 and $3,100 regions. However, if it remains below this threshold, the risk of a pullback towards the $2,950 level should not be overlooked. In summary, cautious optimism prevails in the Ethereum market. If liquidity support strengthens on the spot side and the RSI indicator gains upward momentum, the upward movement could regain strength. However, it seems premature to say that buyers have established a clear dominance at this stage.
Below the Form
Supports: 3,870 – 2,685 – 2,550
Resistances: 3,020 – 3,227 – 3,436
XRP/USDT
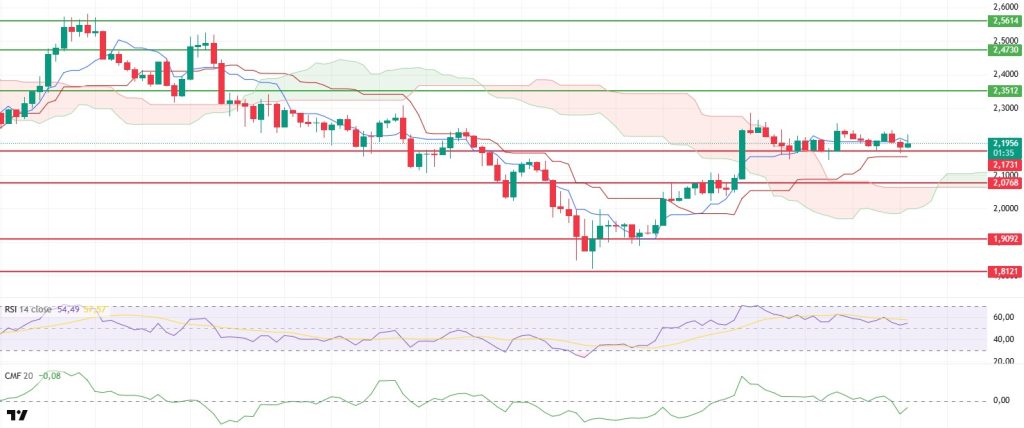
The XRP price tested the $2.17 support level twice yesterday and managed to bounce back on both attempts as buyers stepped in. Currently, the price consolidating just above this level indicates short-term consolidation efforts, but it is also evident that buyers have not gained significant strength.
The Chaikin Money Flow (CMF) indicator retreating into negative territory signals that liquidity outflows are accelerating again in the market. Continued weak buying appetite may cause upward attempts to struggle at resistance levels.
The Relative Strength Index (RSI) indicator maintaining its downward trend despite flat price action reveals continued momentum loss. However, the RSI easing to lower levels could also be interpreted as an effort to establish a healthy foundation for a potential new wave of gains.
The Ichimoku indicator maintains a generally positive structure. The price remaining above the Kumo cloud indicates that the medium-term technical outlook remains intact. However, for this position above the cloud to be sustained, more substantial upward movements are needed in the short term.
The $2.17 support zone remains the main reference point for the rest of the day. If prices remain above this level, the $2.21 and $2.25 resistance levels could be retested. However, if the $2.17 level is lost, selling pressure could accelerate, and prices could retreat towards the $2.10 level.
Supports: 2.1731 – 2.0768 – 1.9092
Resistances: 2.3512 – 2.4730 – 2.5614
SOL/USDT
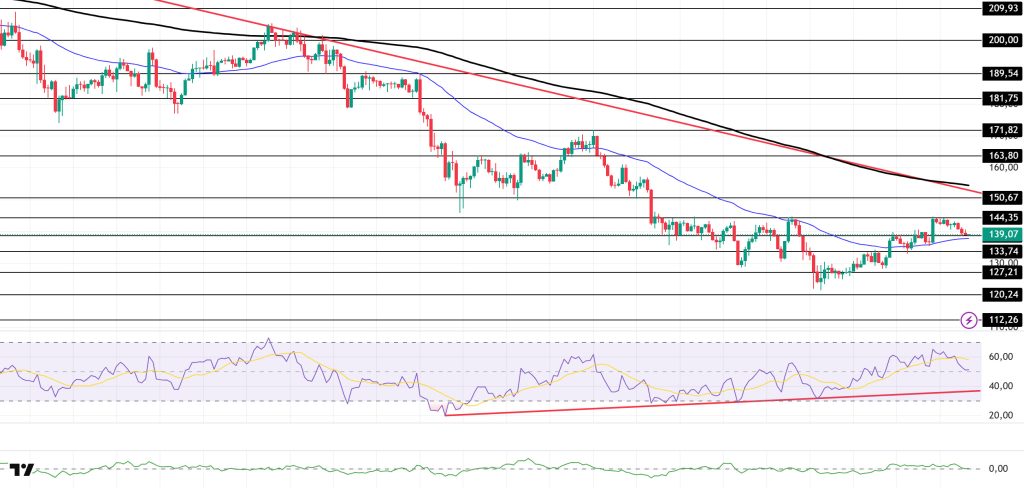
The SOL price experienced a slight pullback. The asset continued to trade in the lower region of the downtrend that began on October 6. Testing the strong resistance level of $144.35, the price failed to break through and experienced a slight pullback. Currently testing the 50 EMA (Blue Line) moving average as support, the price may test the $127.21 level if it closes below this level. If the uptrend continues, it may test the $150.67 level and the downward trend as resistance.
On the 4-hour chart, it remained below the 50 EMA (Exponential Moving Average – Blue Line) and 200 EMA (Black Line). This indicates a possible downtrend in the medium term. At the same time, the price being between the two moving averages shows us that the asset is in a decision phase in the short term. The Chaikin Money Flow (CMF-20) remained in positive territory. However, balanced cash inflows and outflows may keep the CMF in positive territory. The Relative Strength Index (RSI-14) began to settle near the neutral level of the positive zone. It also remained above the rising trend that began on November 4. In the event of an uptrend driven by macroeconomic data or positive news related to the Solana ecosystem, the $150.67 level stands out as a strong resistance point. If this level is broken upwards, the uptrend is expected to continue. In the event of pullbacks due to developments in the opposite direction or profit-taking, the $127.21 level could be tested. A decline to these support levels could increase buying momentum, presenting a potential opportunity for an upward move.
Supports: 138.73 – 133.74 – 127.21
Resistances: 144.35 – 150.67 – 163.80
DOGE/USDT
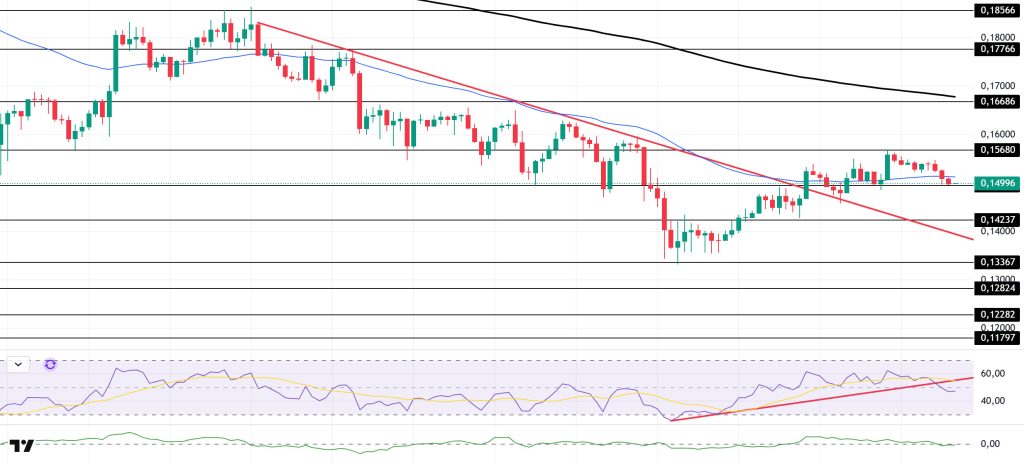
The DOGE price experienced a slight pullback. The asset remained in the upper region of the downward trend that began on November 11. The price, which remained above the $0.14952 level, tested the strong resistance level of $0.15680 and experienced a slight pullback. Currently testing the 50 EMA (Blue Line) moving average as resistance, the price may test the 200 EMA (Black Line) moving average in candle closes above this level. If the pullback continues, it may test the downward trend as support.
On the 4-hour chart, the 50 EMA (Exponential Moving Average – Blue Line) remained below the 200 EMA (Black Line). This indicates that a downtrend may begin in the medium term. The price being below both moving averages shows that the price is trending downward in the short term. The Chaikin Money Flow (CMF-20) has retreated to a neutral level. Additionally, a decline in money inflows could push the CMF into negative territory. The Relative Strength Index (RSI-14) has started to move into negative territory. At the same time, it has moved below the upward trend that began on November 21. This has increased selling pressure. In the event of potential increases due to political developments, macroeconomic data, or positive news flow in the DOGE ecosystem, the $0.16686 level stands out as a strong resistance zone. Conversely, in the event of negative news flow, the $0.14237 level could be triggered. A decline to these levels could increase momentum and initiate a new wave of growth.
Supports: 0.14952 – 0.14237 – 0.13367
Resistances: 0.15680 – 0.16686 – 0.17766
SHIB/USDT
The Shiba Inu team announced that it has prepared a comprehensive privacy upgrade for the Shibarium layer 2 network. According to posts by Lucie from the marketing team, this step aims to provide full on-chain privacy on the network by integrating Fully Homomorphic Encryption (FHE) technology developed by the cryptography company Zama into Shibarium. Thanks to this integration, transactions and smart contracts will be able to run without ever decrypting the data, preventing users’ sensitive information from being directly visible on block explorers. This is intended to make Shibarium a more attractive infrastructure, especially for teams looking to develop privacy-focused applications.
The shared technical roadmap indicates that Zama’s public testnet is already live, with Ethereum mainnet integration planned for the fourth quarter of 2025 and broader EVM chain support slated for the first half of 2026. Due to Shibarium’s EVM-compatible structure, it is expected to be naturally included in this expansion phase and to be able to support “private smart contracts” with full on-chain privacy by the second quarter of 2026 at the latest. In this context, Shibarium aims to attract more developers in the areas of DeFi, gaming, governance, and enterprise solutions, diversifying the ecosystem’s use cases.
The FHE approach stands out as a solution that directly addresses the problem of all data being visible in plain form on public blockchains; in this model, data remains encrypted while smart contracts perform computations. The Shiba Inu team emphasizes that the Zama integration complements the security and RPC infrastructure updates previously made on Shibarium, aiming to set a new standard, especially for corporate players and projects with high data privacy sensitivity. This step is seen as an important part of Shibarium’s claim to move beyond being a network centered around a meme ecosystem and strengthen its role as a privacy and security-focused infrastructure layer.
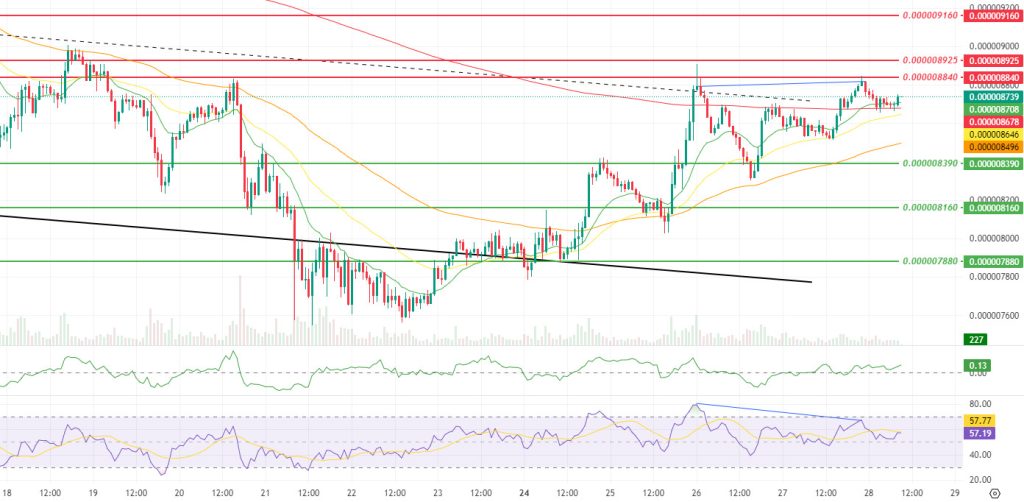
The technical chart shows that, following the dynamic reaction process highlighted in the previous report, the price pushed the middle band of the falling channel upward, breaking the previous resistance threshold at $0.000008690. Although slight declines in momentum, volume, and volatility indicate that the movement has slowed down, the fact that this pullback has remained limited for now suggests that buyers continue to take positions more selectively, rather than completely retreating, especially in the support and new intermediate support areas formed at . This structure points to a consolidation phase where the reaction movement is gradually expanding upward, accompanied by a digestion and repositioning process where volatility remains relatively controlled, rather than an aggressive trend reversal. The Chaikin Money Flow (CMF) indicator remaining in positive territory is a complementary signal pointing to a relative recovery in capital inflows compared to the previous period and that the current movement is progressing on a healthier liquidity base.
The positioning of the Smoothed Moving Average (SMMA) 9 and SMMA 21 periods above the SMMA 50 period indicates that the positive structure in favor of the short-term trend is maintained, while the price breaking above the SMMA 200 period carries the reaction process into a more medium-term recovery attempt. With the break above the $0.000008690 level, this area becomes an intermediate support threshold in the short term, while the $0.000008840, $0.000008925, and $0.000009160 levels stand out as the next technical targets for the rebound structure within the descending channel. However, the negative divergence (Blue Line) observed between the Relative Strength Index (RSI) and the price serves as a warning signal, reminding us that momentum did not fully accompany the price movement in the last leg of the rise and that the risk of profit-taking has increased, especially in new resistance zones. In the short term, maintaining sustainability above $0.000008690 and the Chaikin Money Flow (CMF) indicator continuing to hold in positive territory will strengthen the scenario of a more structured and gradual recovery within the descending channel. Conversely, a renewed break below $0.000008690, falling below the support band of $0.000008390 and $0.000008160 and deepening towards the $0.000007880 region, would reposition the current movement as a limited correction area formed around the SMMA 200. (SMMA9: Green Line, SMMA21: Yellow Line, SMMA50: Orange Line, SMMA 200: Red Line)
Supports: 0.000008390 – 0.000008160 – 0.000007880
Resistances: 0.000008840 – 0.000008925 – 0.000009160
Legal Notice
The investment information, comments, and recommendations contained herein do not constitute investment advice. Investment advisory services are provided individually by authorized institutions taking into account the risk and return preferences of individuals. The comments and recommendations contained herein are of a general nature. These recommendations may not be suitable for your financial situation and risk and return preferences. Therefore, making an investment decision based solely on the information contained herein may not produce results in line with your expectations.

