
Technical Analysis
BTC/USDT
The Fed ended its three-year loss period in November and returned to profit, which was attributed to the decline in interest rates reducing funding costs. Discussions continue regarding Strategy’s potential removal from the MSCI index, with a decision expected to be announced on January 15. In the US, ADP private sector employment fell by 32K in November, falling short of expectations. Markets priced in an over 89% probability of a 25 basis point rate cut in December, reflecting a significant increase in easing expectations.
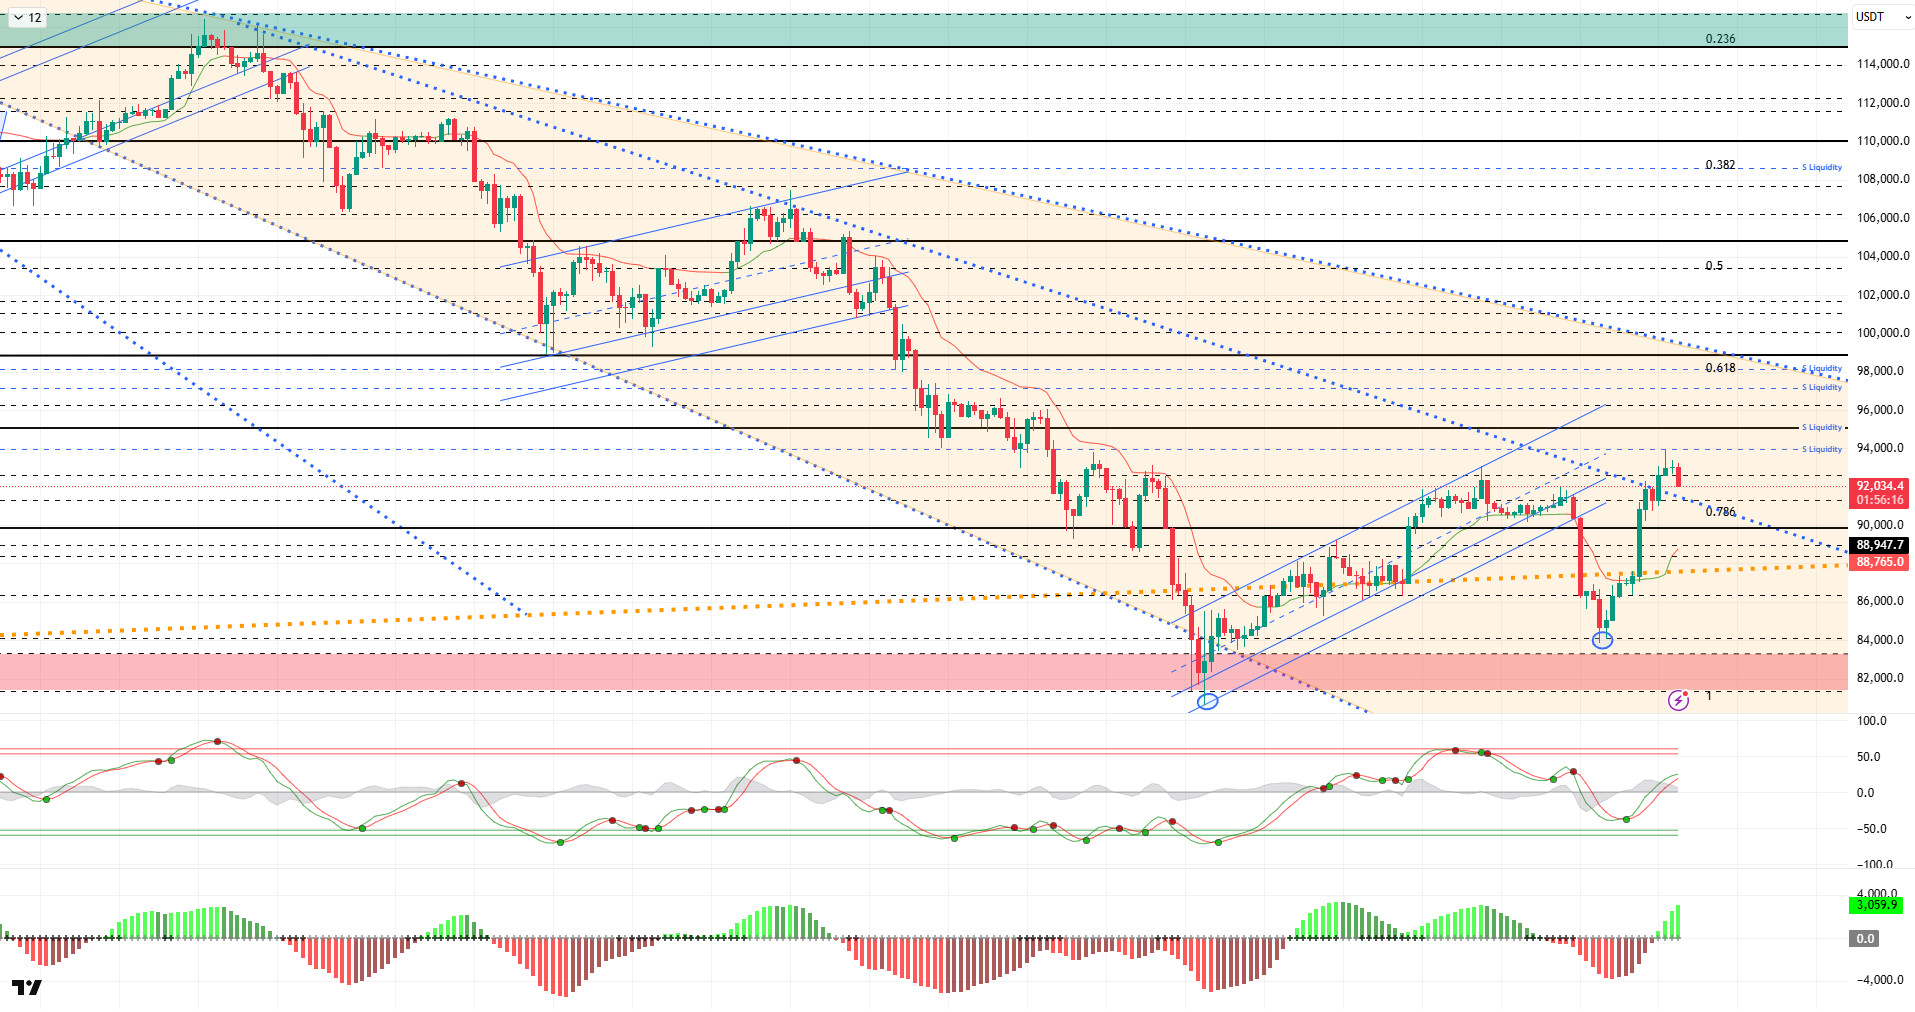
From a technical perspective, compared to the previous analysis, BTC maintained its gains for a long time but lost its attempt to hold above the 93,000 level. The price, which started a downtrend from the ATH level, tested the second bottom at 83,800 after the first bottom at 80,500, and caught a minor uptrend due to the high bottoms it formed. At the time of writing the analysis, it continues to trade at the 92,100 level above the second falling trend line.
Technical indicators show the Wave Trend (WT) oscillator crossing the channel midline while generating a buy signal just above the oversold zone. The histogram on the Squeeze Momentum (SM) indicator continues to gain momentum in positive territory. The Kaufman Moving Average (KAMA) is currently positioned below the price at the $89,150 level.
According to liquidation data, increased sell-side transactions above the 92,000 level were liquidated with the recent rise. In the monthly view, the 97,000–98,000 band continues to be an intense accumulation zone. The buying level gained some intensity in this region with the break above the 90,000 level, while 83,000 continues to be a heavy buying zone.
In summary, Vanguard’s announcement that it will offer ETF services to its customers had a significant impact on BTC’s momentum, while ADP private sector employment came in well below expectations, bringing December interest rate cut expectations to 90% ahead of the FOMC meeting. Technically, after losing the minor uptrend channel, the price recorded a “U”-shaped rise, surpassing the 90,000 reference level. Liquidity data indicates that target zones have regained importance and that the market continues to seek equilibrium. After this stage, 90,000 has become a critical point again for the price to maintain its momentum. Closings and pricing above this level have become an indicator for regaining momentum. In this context, 95,000 stands out as the next target area, and if it is exceeded, liquidity areas will be monitored again, with 90,000 re-emerging as the reference area in the event of a possible selling pressure.
Supports: 92,600 – 91,400 – 90,000
Resistances: 94,000 – 95,000 – 96,200
ETH/USDT
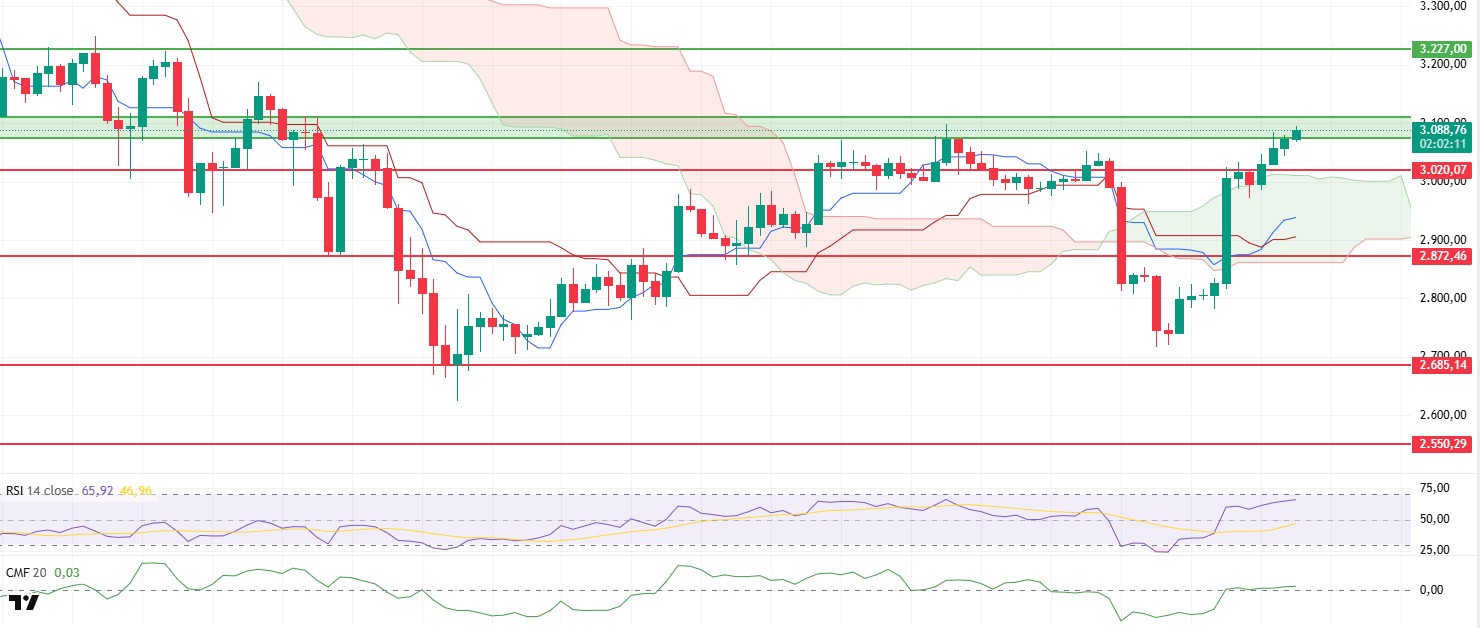
The ETH price continued its positive trend during the day, successfully maintaining the $3,020 support level and rising above $3,090 with the support of buyers. This movement is an indication that the upward momentum in the market remains strong.
The liquidity outlook remains positive. The Chaikin Money Flow (CMF) indicator staying in positive territory signals that capital inflows are continuing and that the rise is not just a short-term reaction but a buyer-driven acceleration.
On the momentum side, strength continues. The Relative Strength Index (RSI) continues to accompany the rise and indicates that buyers are increasing their activity in the market in the short term. However, the fact that the RSI is approaching the overbought zone serves as a warning that could trigger short-term profit-taking after the rapid rise.
The technical outlook is also strong. The price’s position above the Ichimoku kumo cloud and the Tenkan and Kijun lines’ continued upward movement confirm that the uptrend is technically intact.
Looking at the overall structure, Ethereum appears to be maintaining its upward trend in the evening hours. If the price continues to hold above the $3,020 level, it is likely to first test the $3,150 level, then break through the resistance area marked on the chart, with a high probability of the upward trend expanding more aggressively towards the $3,227 target. On the other hand, considering the signs of overheating from the RSI and the increase in volatility, possible corrections closing below $3,020 could reactivate selling pressure and cause the price to lose momentum in the short term. In summary, buyers remain in control on the Ethereum side. For the uptrend to continue, it is crucial that the price stays above the cloud support and maintains its strong momentum.
Supports: 3,020 – 2,872 – 2,685
Resistances: 3,112 – 3,227 – 3,436
XRP/USDT
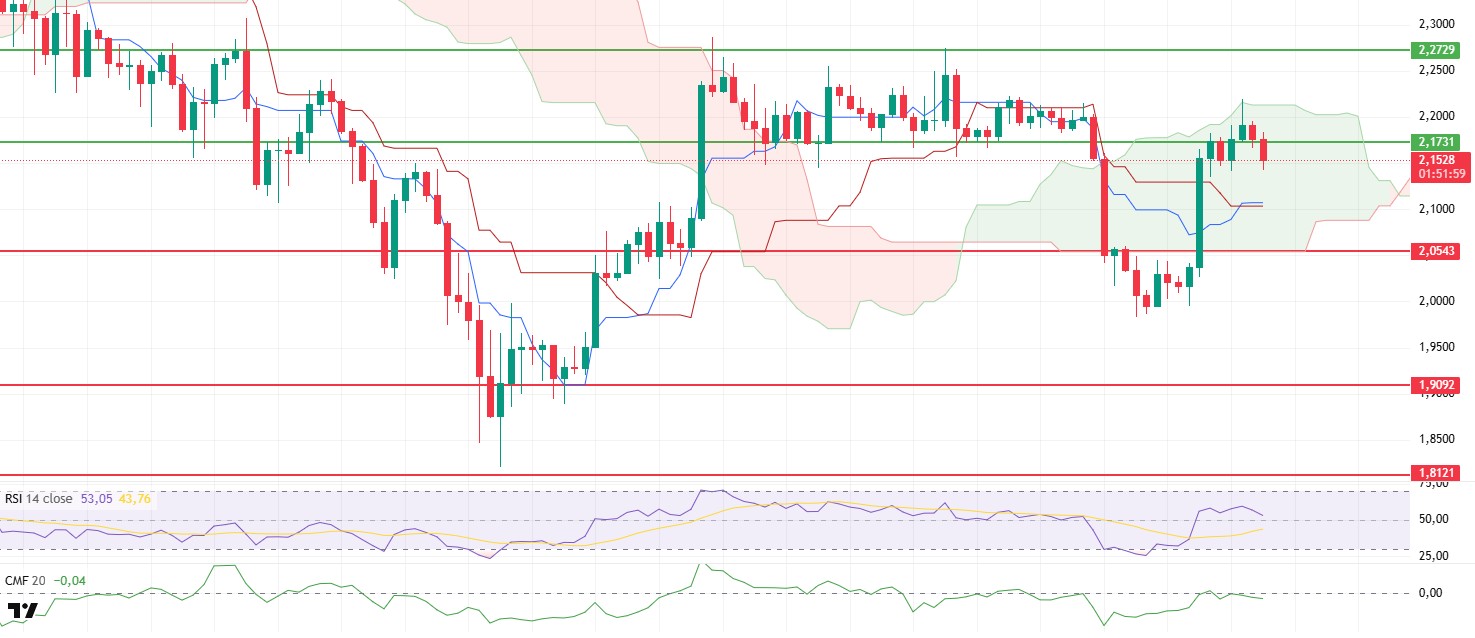
The XRP price broke below the $2.17 support level in the evening hours and continued its downward movement below this level, indicating that weakness is regaining strength. The loss of the support level maintained throughout the day clearly shows that buyers have not gained sufficient strength to carry the price.
The liquidity picture remains weak. The Chaikin Money Flow (CMF) continues to move below the zero line, indicating that outflows from the market are continuing. Unless liquidity inflows increase, the likelihood of sustained gains appears quite low.
On the momentum front, the Relative Strength Index (RSI) is still trying to stay in positive territory, but it has started to show a downward trend after the breakout. This weakening suggests that selling pressure could become effective again in the short term. The technical structure is also under pressure on the Ichimoku side. The price was rejected from the upper band of the kumo cloud.
Looking at the overall picture, the current breakout indicates that sellers are back on the scene. If the price cannot quickly regain the $2.17 level, it is highly likely that the decline will continue towards the $2.12–$2.10 zone. Losing this zone could lead to selling extending to the $2.05 support level. In the opposite scenario, if the price settles back above $2.17 and is supported by both the RSI and short-term buyer interest, a recovery towards the $2.21–$2.22 band could be seen. However, without sustainability, the likelihood of future rebound rallies remaining limited is high.
Supports: 2.0543 – 1.9092 – 1.8121
Resistances: 2.1731 – 2.2729 – 2.3512
SOL/USDT
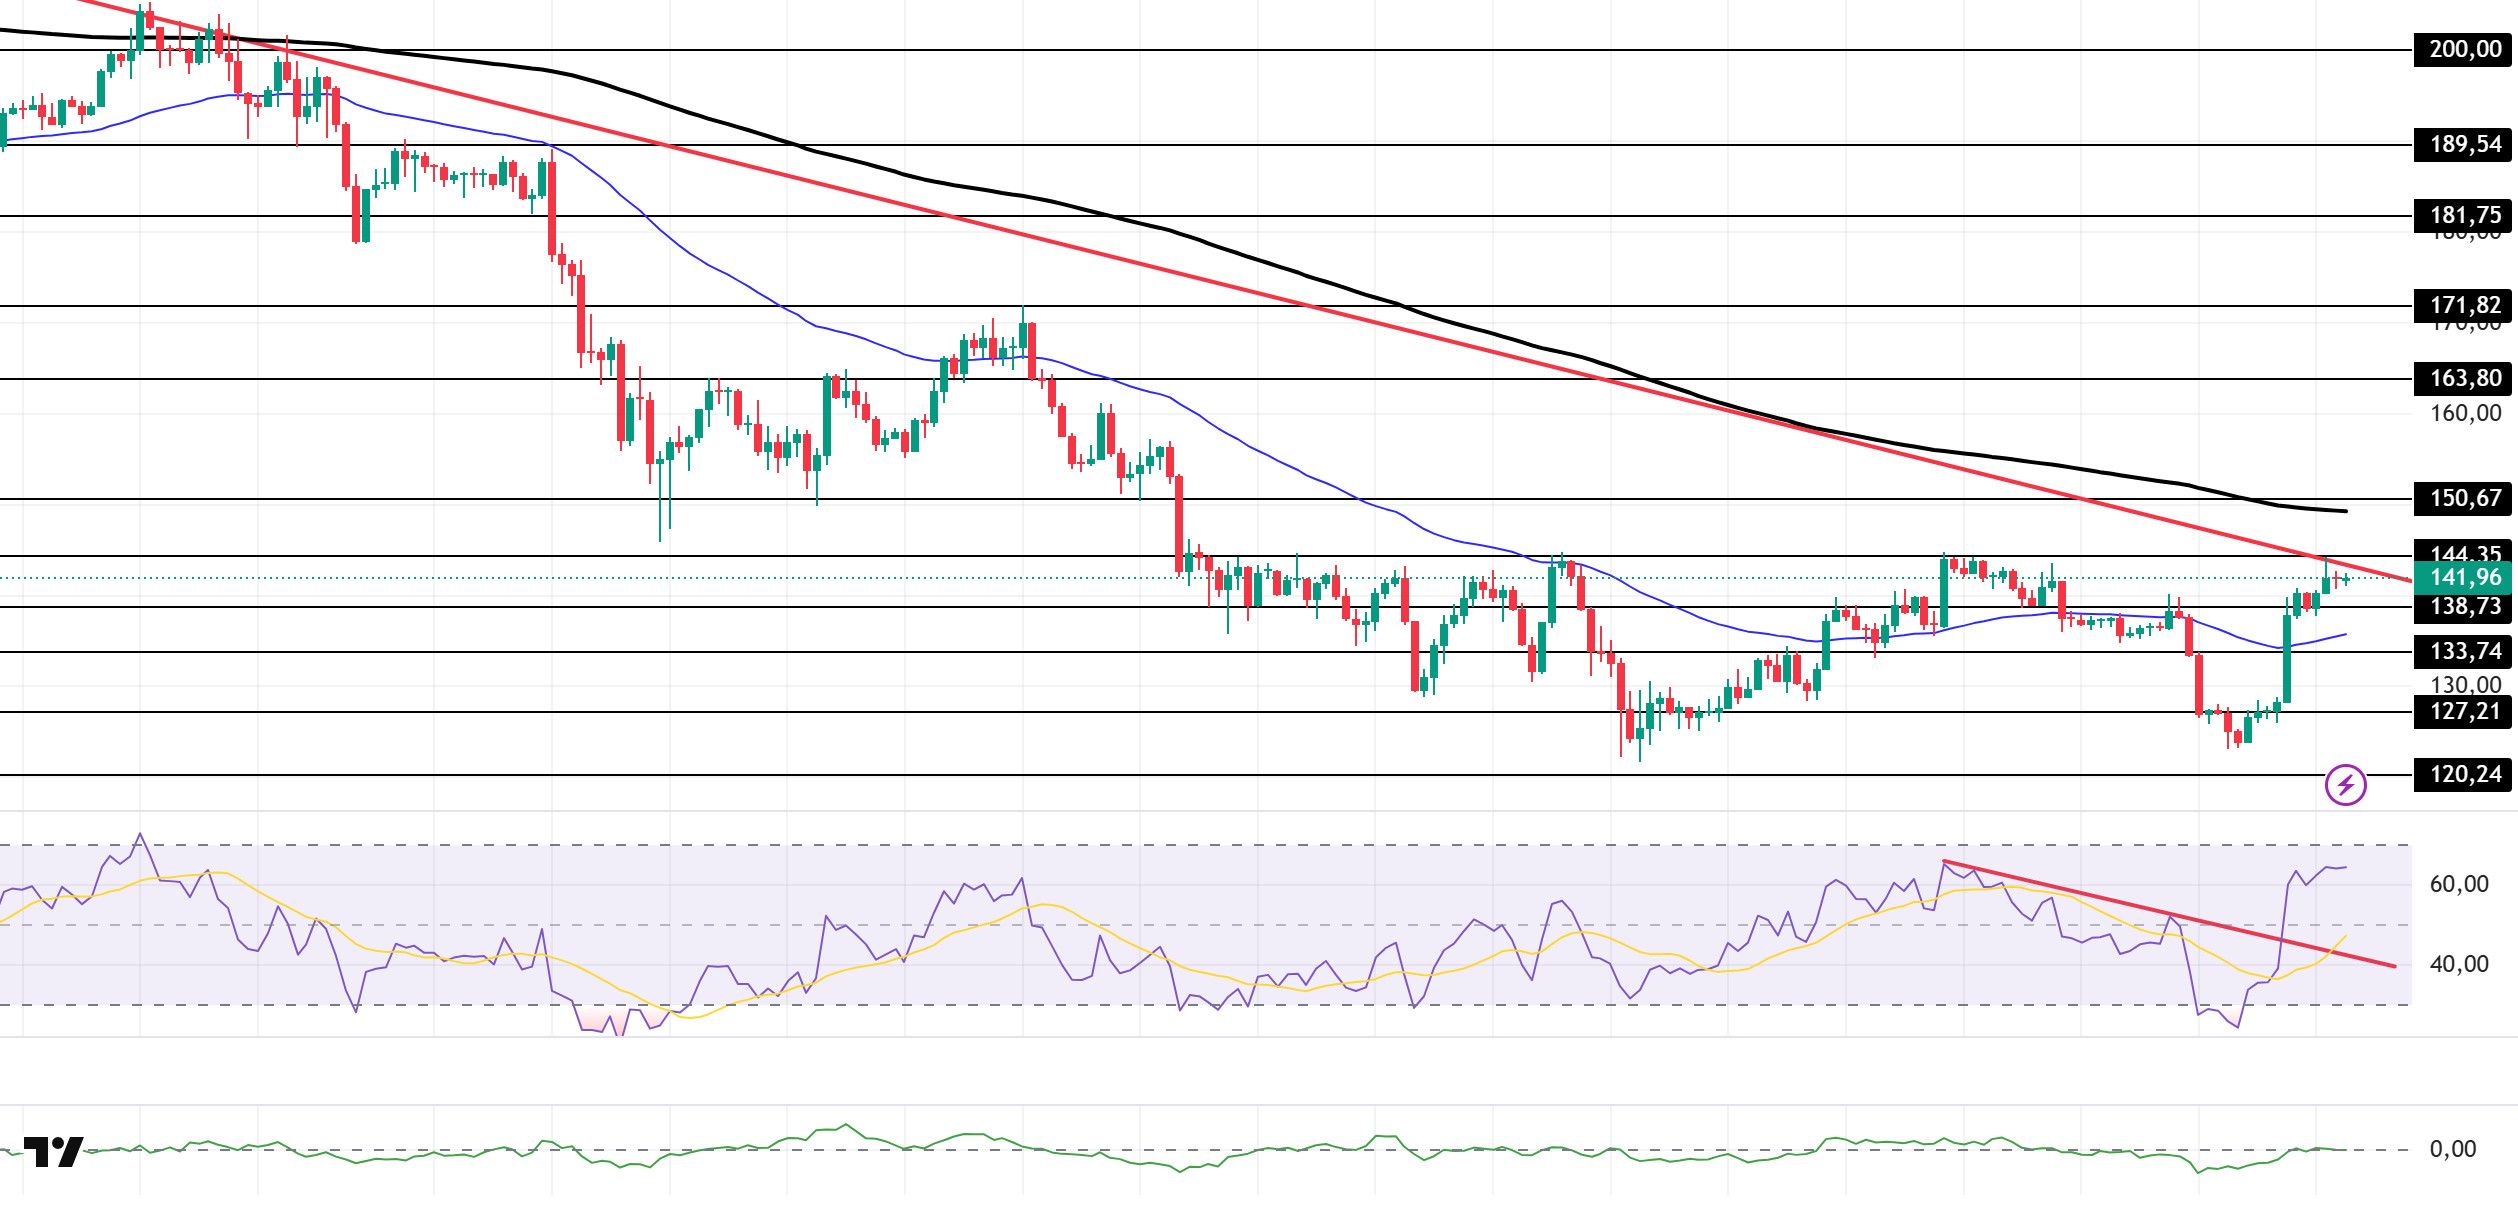
The SOL price traded sideways during the day. The asset remained in the lower region of the downtrend that began on October 6. Breaking above the 50 EMA (Blue Line) moving average, which is a strong resistance level, the price is currently testing the downtrend as resistance. If it closes above this line, it may test the 200 EMA (Black Line) moving average. In case of a pullback, the 50 EMA (Blue Line) moving average should be monitored.
On the 4-hour chart, it continues to remain below the 50 EMA (Exponential Moving Average – Blue Line) and 200 EMA (Black Line). This indicates that it may be in a downtrend in the medium term. At the same time, the price being between the two moving averages shows us that the asset is in a decision phase in the short term. The Chaikin Money Flow (CMF-20) is at a neutral level. However, an increase in money inflows could push the CMF into positive territory. The Relative Strength Index (RSI-14) rose towards the overbought zone, indicating a sharp increase in buying appetite. At the same time, it has continued to hold above the upper region of the downward trend that began on November 26. This could increase buying pressure. If there is an uptrend due to macroeconomic data or positive news related to the Solana ecosystem, the $163.80 level stands out as a strong resistance point. If this level is broken upwards, the uptrend is expected to continue. In the event of pullbacks due to developments in the opposite direction or profit-taking, the $127.21 level could be tested. A decline to these support levels could increase buying momentum, presenting a potential upside opportunity.
Supports: 138.73 – 133.74 – 127.21
Resistances: 144.35 – 150.67 – 163.80
DOGE/USDT
21Shares has updated its ETF application.
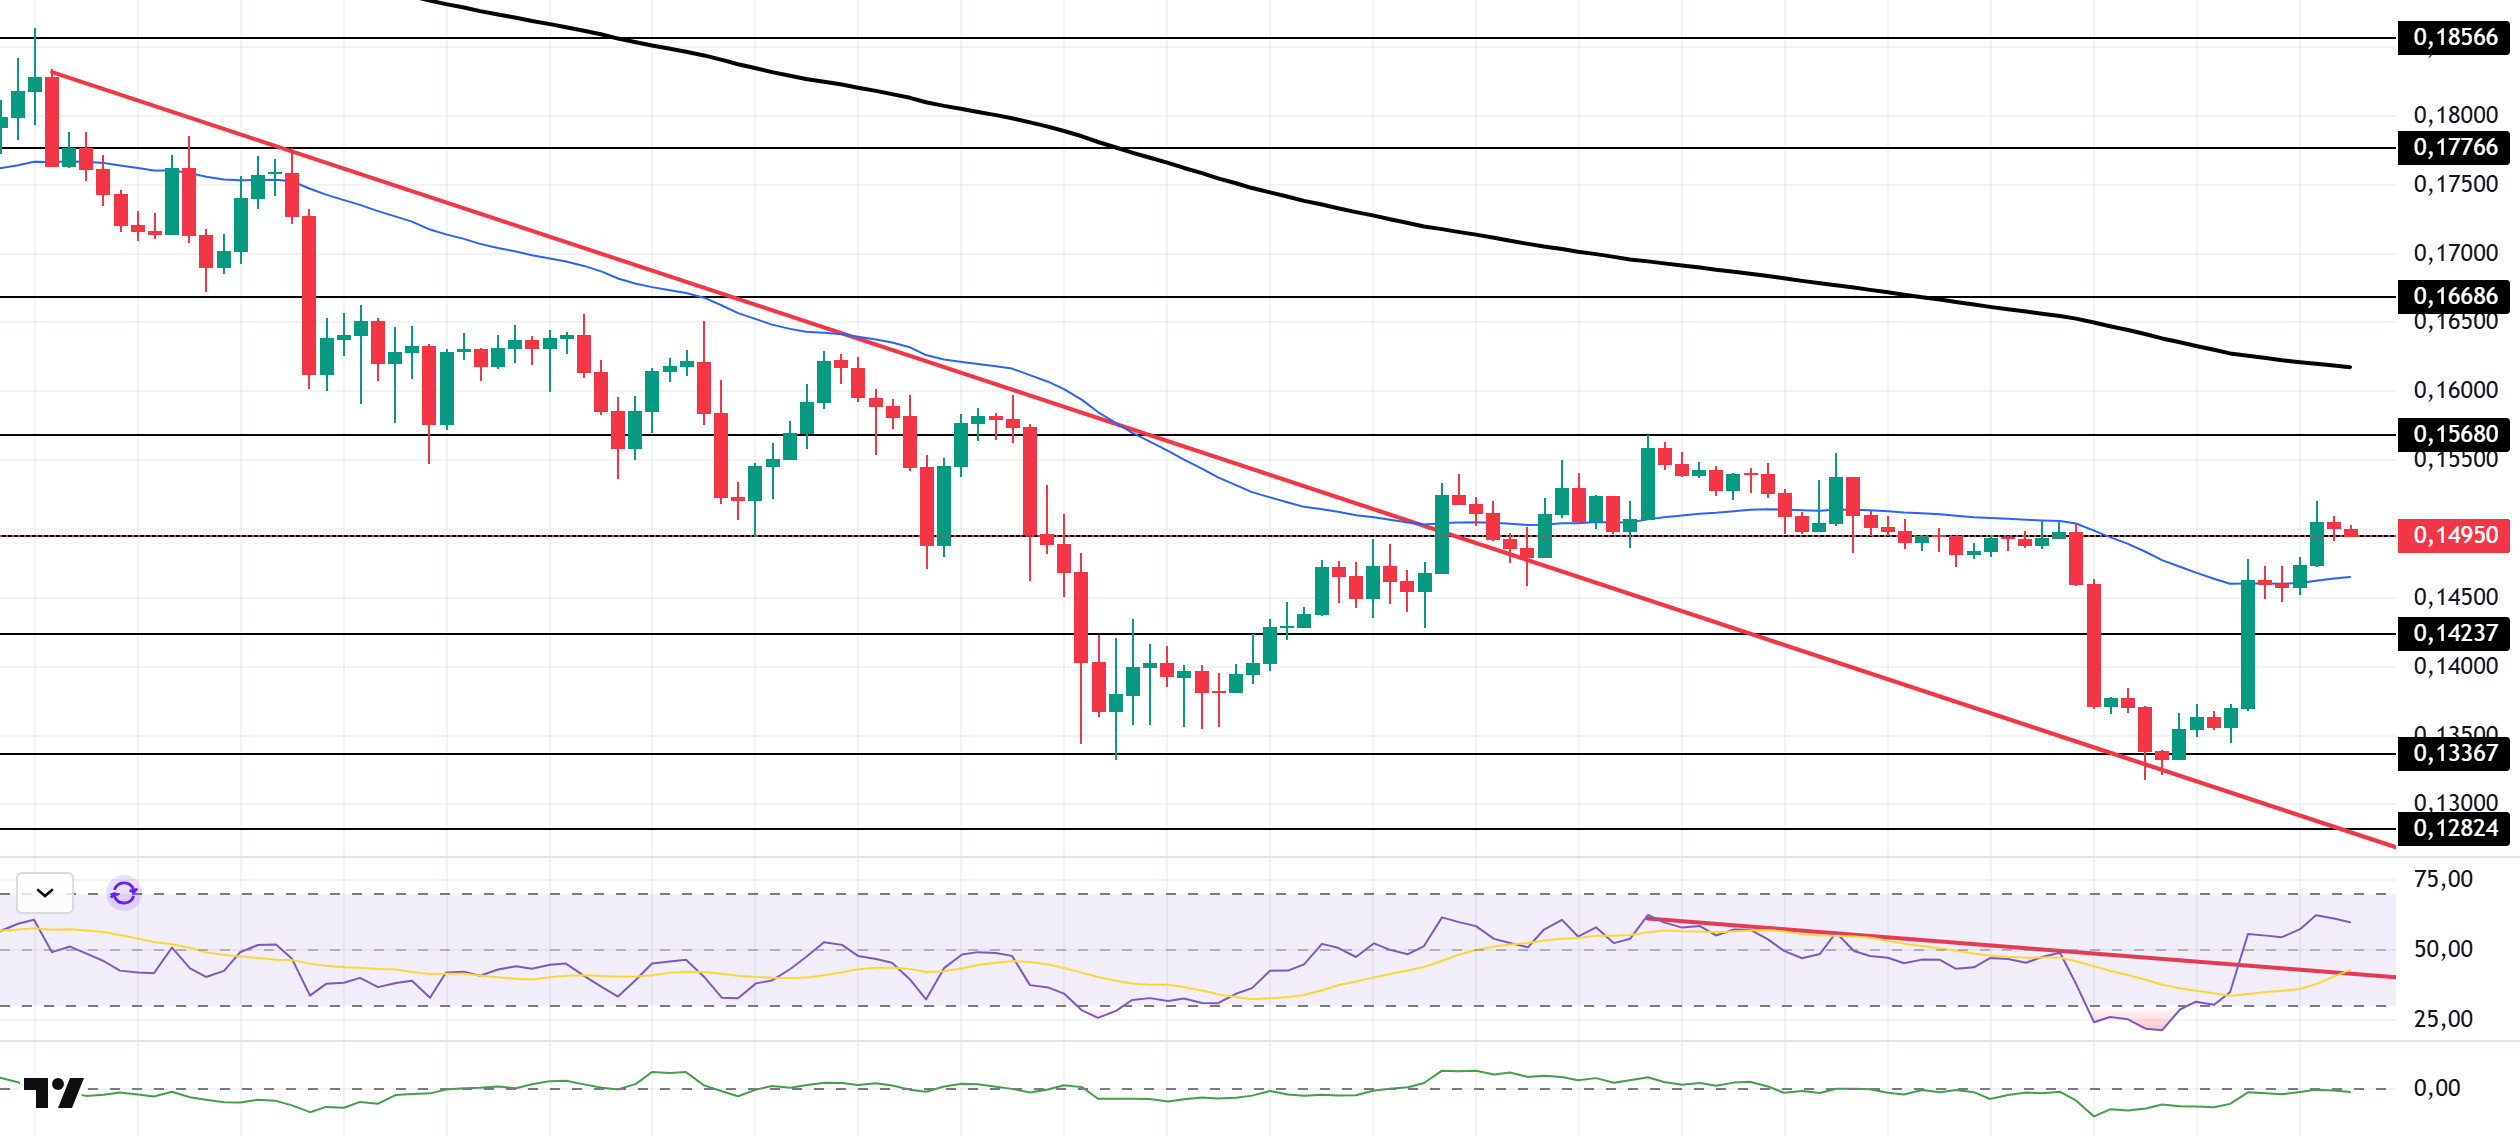
The DOGE price moved sideways during the day. The asset gained value by gaining downward momentum starting on November 11. As of now, the price, which has also broken above the 50 EMA (Blue Line) moving average, is testing the $0.14952 level as support. If the upward trend continues, it may test the 200 EMA (Black Line) moving average as resistance. In the event of a pullback, the 50 EMA (Blue Line) moving average may act as support again.
On the 4-hour chart, the 50 EMA (Exponential Moving Average – Blue Line) remained below the 200 EMA (Black Line). This indicates that a medium-term downtrend may begin. The price being between the two moving averages indicates that the price is in a decision phase in the short term. The Chaikin Money Flow (CMF-20) remained at a neutral level. Additionally, the balance of money inflows and outflows may keep the CMF at a neutral level. The Relative Strength Index (RSI-14) accelerated from the oversold zone to the middle of the positive zone. At the same time, it crossed above the upper zone of the downward trend that began on November 26. This signaled the formation of buying pressure. In the event of potential increases driven by political developments, macroeconomic data, or positive news flow within the DOGE ecosystem, the $0.16686 level stands out as a strong resistance zone. Conversely, in the event of negative news flow, the $0.13367 level could be triggered. A decline to these levels could increase momentum and initiate a new wave of growth.
Supports: 0.14952 – 0.14237 – 0.13367
Resistances: 0.15680 – 0.16686 – 0.17766
AVAX/USDT
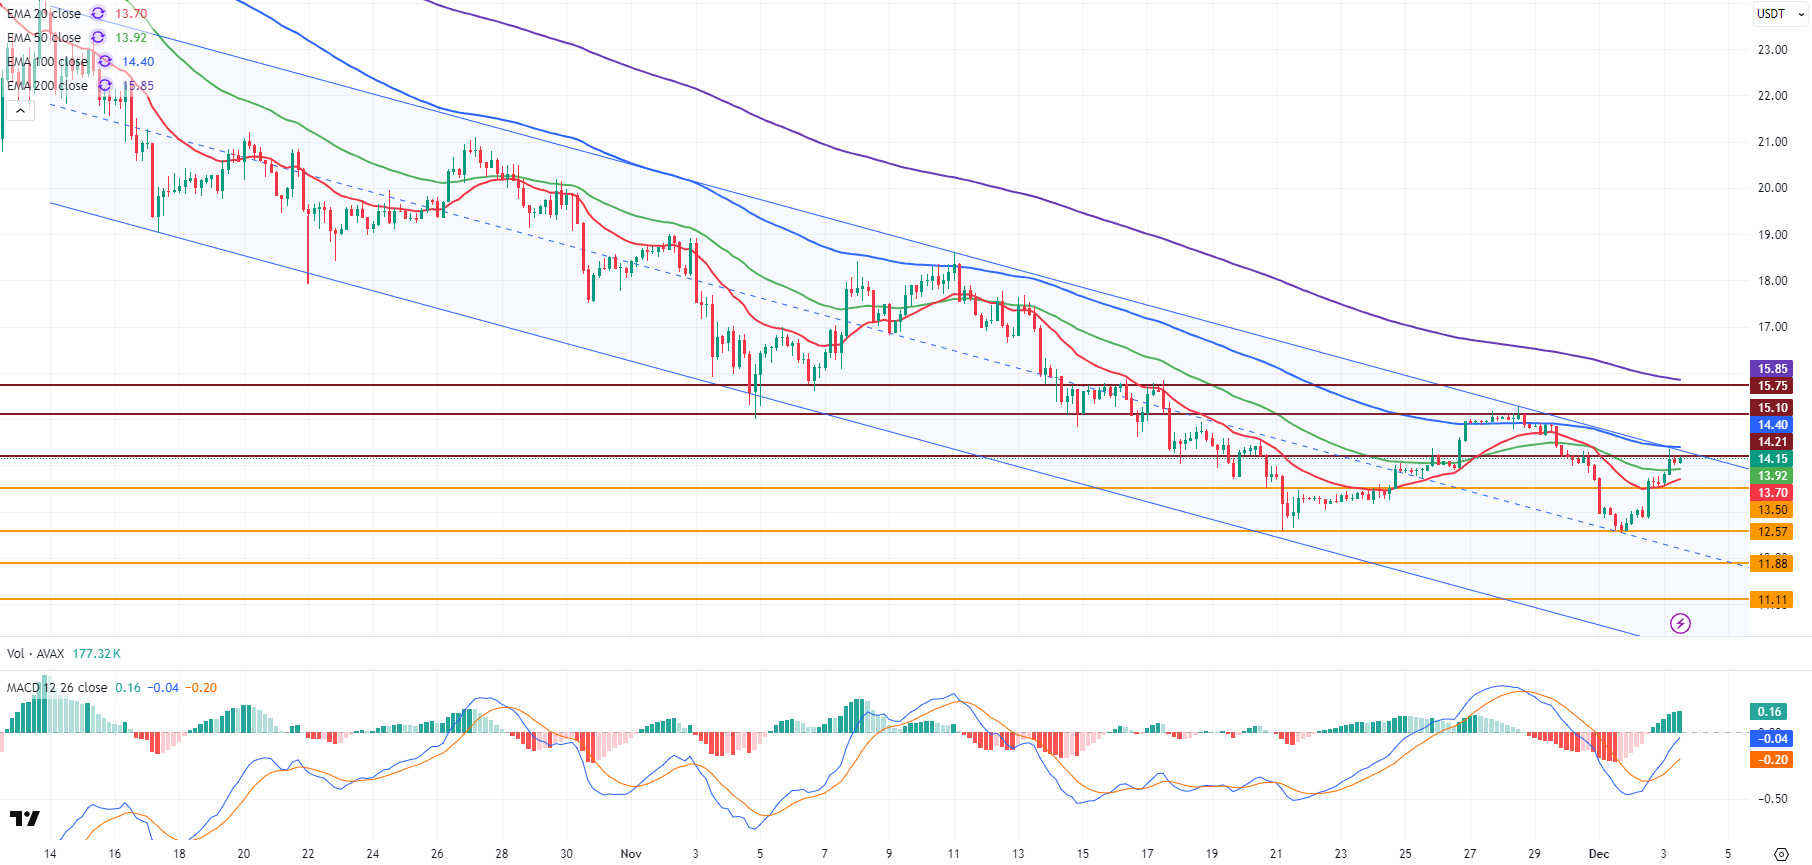
AVAX started the day at $13.62 and continued its upward movement, influenced by the general upward trend seen in the cryptocurrency market. During its intraday rise, AVAX climbed to the 100-period Exponential Moving Average (EMA100) level and the upper band of the bearish channel. However, after increased selling pressure in this region, it fell back below the $14.21 resistance level. Currently trading at $14.15, AVAX maintains its positive trajectory with an approximate 4% increase in value compared to the opening. On the fundamental side, positive expectations for the Avalanche ecosystem, institutional interest, and the optimistic market sentiment are among the factors supporting AVAX’s momentum. However, strong selling pressure is still seen at key resistance levels, and there is no strong momentum yet to break through these resistances.
On the 4-hour chart, the Moving Average Convergence/Divergence (MACD) line continues to trade above the signal line and is trending upward. This indicates that momentum is strengthening and buying pressure may continue in the short term. Although the MACD is in negative territory, it is very close to positive territory. If the MACD crosses into positive territory, the upward momentum could increase and the likelihood of breaking through the main resistance levels could strengthen. On the other hand, AVAX has risen above the EMA20 and EMA50 levels. These levels are now being monitored as short-term support. However, the truly critical zone is the EMA100 level. AVAX tested this level today but failed to break through. A retest and break of the EMA100 during the day could technically strengthen the uptrend. Furthermore, AVAX’s continued movement near the upper band of the bearish channel could enable a potential channel breakout, allowing AVAX to transition into a stronger uptrend.
From a technical perspective, the $14.21 resistance level and the EMA100 and upper band of the bearish channel stand out as important support zones for AVAX’s rise. If it manages to stay above these levels, AVAX could see a strong rise towards the $15.10 and $15.75 resistance levels. Particularly, if the EMA100 is broken and the upper band of the channel is exceeded, the possibility of a short-term trend reversal for AVAX may strengthen. In the opposite scenario, selling pressure encountered at resistance levels may limit the rise. In downward movements, the $13.50 level is the first important support position. A break and close below this level could cause AVAX to weaken again and retreat towards the $12.57 and $11.88 support zones.
(EMA20: Red Line, EMA50: Green Line, EMA100: Blue Line, EMA200: Purple Line)
Supports: 13.50 – 12.57 – 11.88
Resistances: 14.21 – 15.10 – 15.75
LINK/USDT
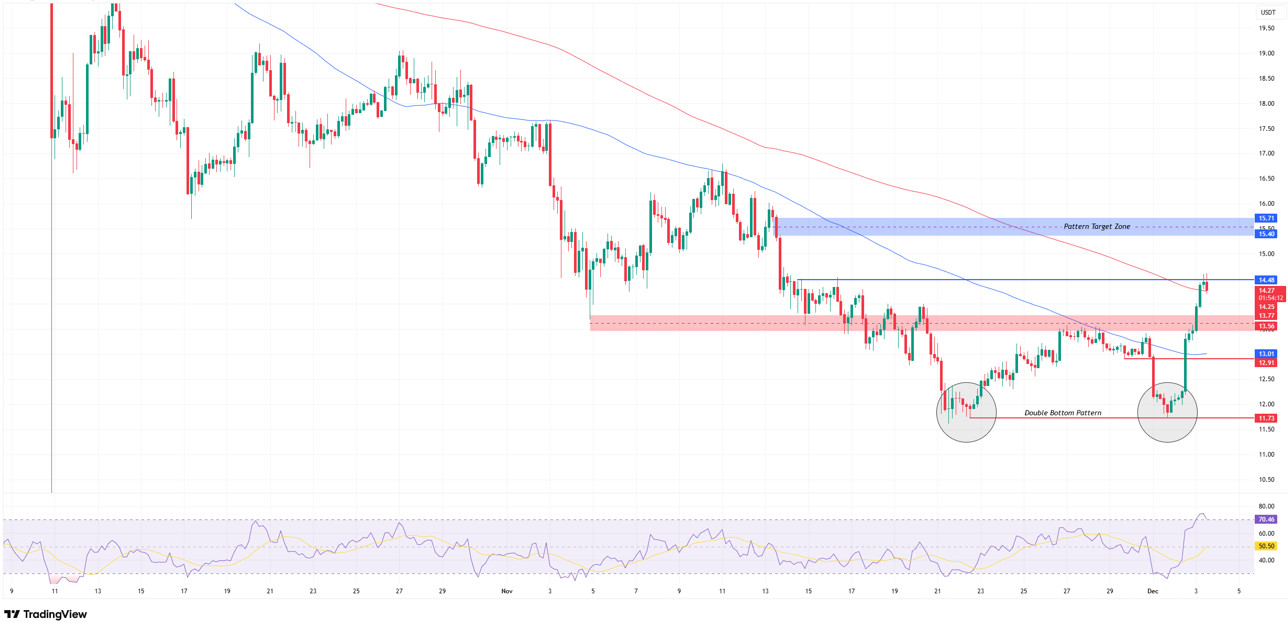
In our previous analysis, we stated that LINK formed a strong double bottom at the $11.73 level, and that the possibility of a trend reversal became apparent with the breakout of the $13.56 – $13.77 range, which was the neckline. During the day, the price followed this scenario exactly, accelerating its upward movement by breaking not only the neckline but also critical structural thresholds one after another.
After the breakout, the price is now in the middle of the 200-day moving average (MA200) and our first resistance level at $14.48. A close above $14.48 in the current 4-hour period could increase positive momentum. Otherwise, closing below this level after leaving a wick above $14.48 could trigger a rapid realization process.
If the uptrend continues, it will advance towards the formation target zone, i.e., the $15.40–$15.71 range. This area is not only the technical target of the formation but also an important major supply zone where intense selling pressure has formed in the past, making it highly likely that the price will struggle here. Therefore, it is highly probable that short-term profit-taking strategies will be most rationally implemented in this zone.
In downward price movements, the first critical level will be the neckline at $13.56–$13.77, which has now become a structural support. This zone acts as the main defense line where the trend reversal confirmation is maintained. Should this level be lost, it would not be surprising for the price to correct towards the $12.91 band. In deeper movements, the $11.73 bottom zone, which we highlighted in the morning report, will continue to be the final threshold for the formation’s validity.
Although the Relative Strength Index (RSI) has moved into the overbought zone with a sharp intraday rise, increasing the possibility of a short-term cooling off, considering the morning’s trend reversal pattern, it is technically normal for the price to stabilize at overbought levels for a while. Should a potential easing continue, remaining above the 45–50 band will be critical for the positive structure to continue healthily.
Supports: 13.56 – 12.91 – 11.73
Resistances: 14.48 – 15.40 – 15.71
Legal notice
The investment information, comments, and recommendations contained herein do not constitute investment advice. Investment advisory services are provided individually by authorized institutions taking into account the risk and return preferences of individuals. The comments and recommendations contained herein are of a general nature. These recommendations may not be suitable for your financial situation and risk and return preferences. Therefore, making an investment decision based solely on the information contained herein may not produce results in line with your expectations.

