
TECHNICAL ANALYSIS
BTC/USDT
Global markets continue to be shaped around US interest rate policies and economic growth plans. US Treasury Secretary Benson announced that they are committed to lowering interest rates in order to stimulate market growth. While these statements led investors to increase their expectations for Fed’s interest rate cuts, it is seen that at least three rate cuts are priced in the markets.
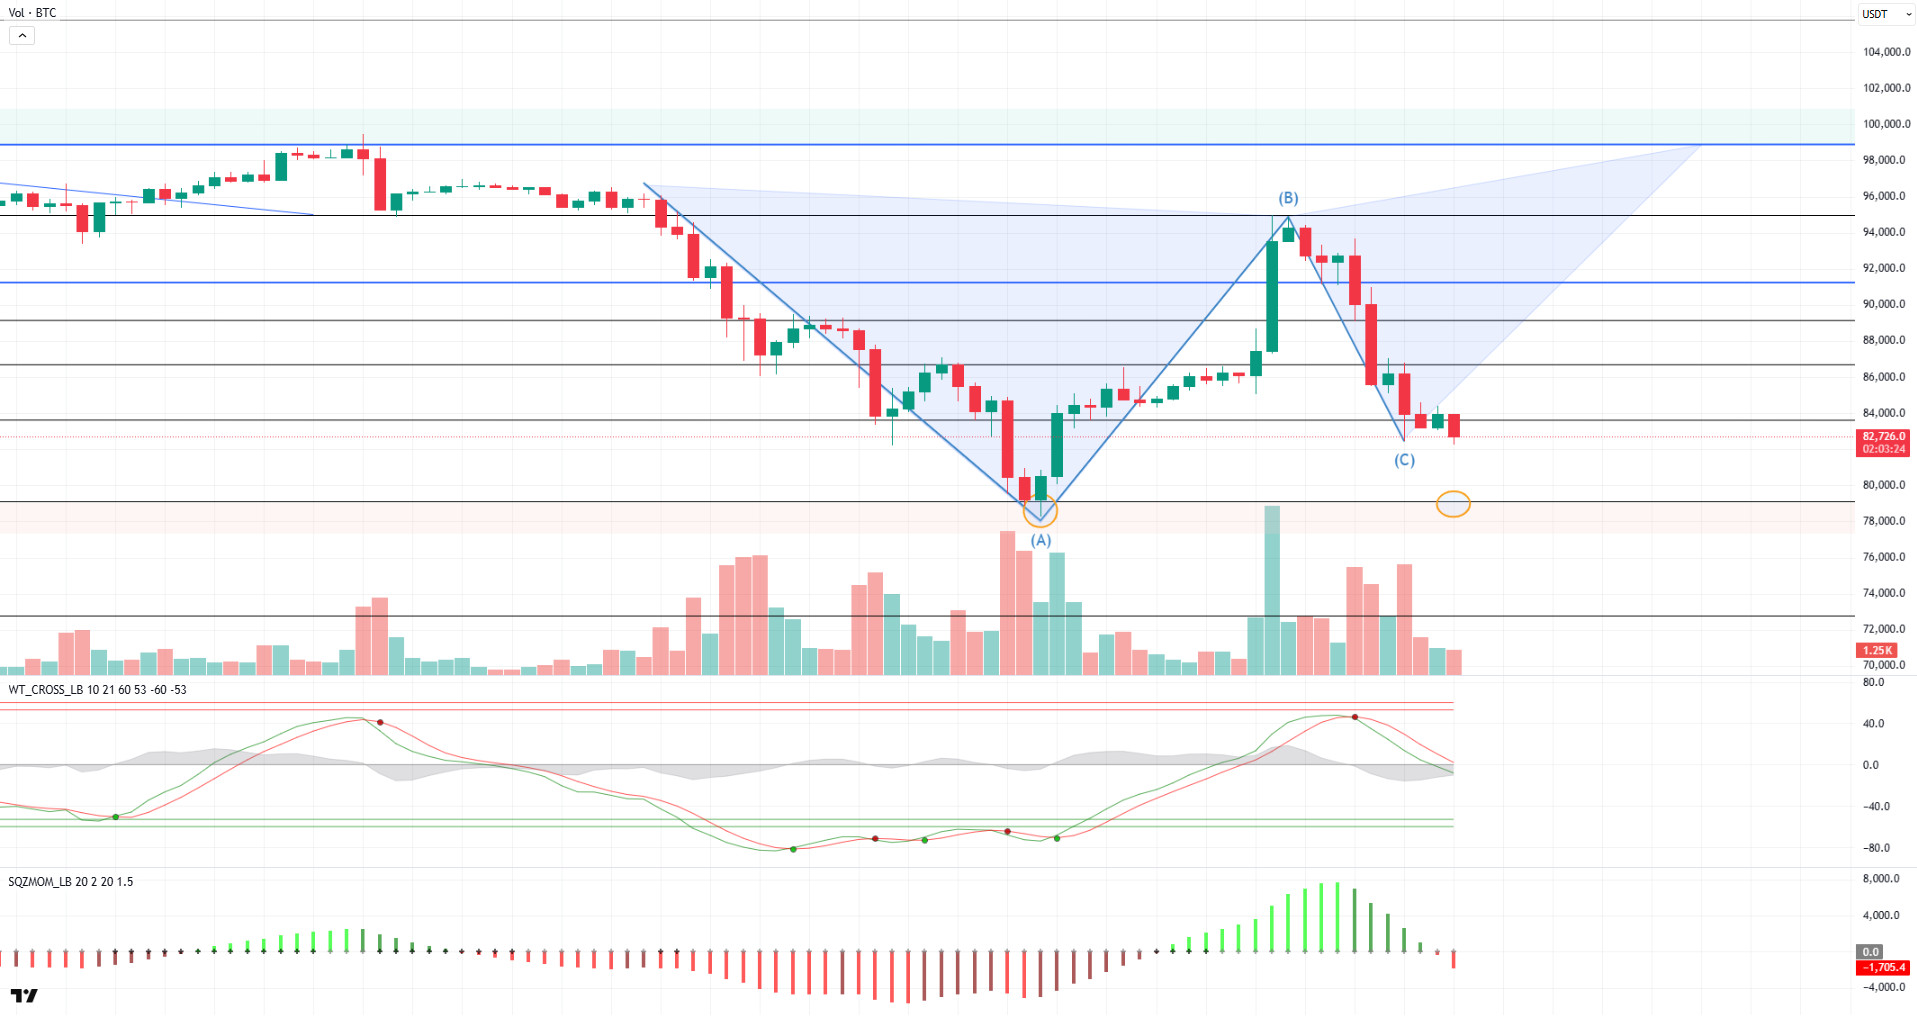
Looking at the technical outlook, BTC tried to hold above the 83,500-support level for a long time during the day but fell below this level and traded at 82,800. Analysing the technical oscillators, it is observed that the sell signal is maintained, and momentum indicators maintain their negative outlook. This suggests that BTC is still under selling pressure and has not signaled a clear recovery. In order for the butterfly pattern, we mentioned in the previous analysis to remain valid, the price needs to find support from these levels and display an upward movement. However, if this support level is broken, BTC may form a double bottom formation and make a retracement move towards the 80,000 support.
Supports 83,500 – 80,000 – 78,000
Resistances 86,500 – 89,000 – 90,400
ETH/USDT
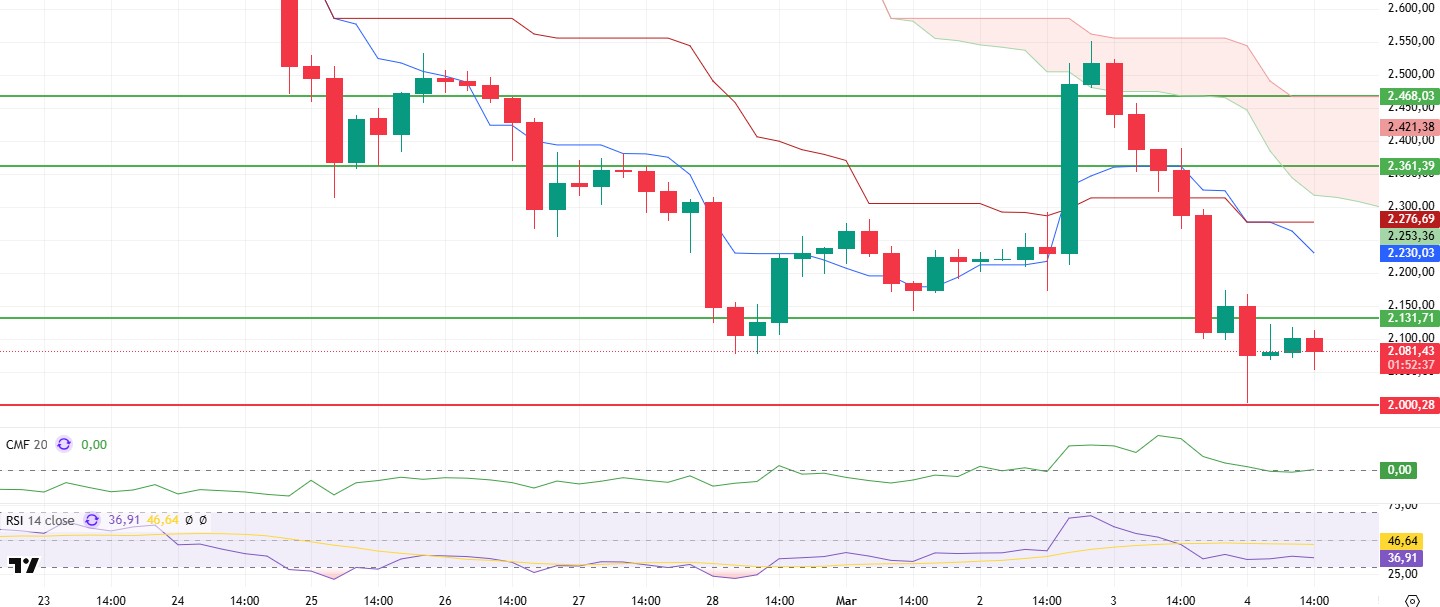
ETH, which fell as low as $ 2,000 after yesterday’s developments, continues to be priced at $ 2,100 with low volume and a horizontal course during the day. The price action in this narrow band reveals that there has been no significant change in technical indicators.
The Chaikin Money Flow (CMF) indicator remained flat after falling to the zero line, indicating that cash flow in the market remains weak. However, the continuation of the positive divergence on CMF can be considered as a sign that buyers may step in at this level. Looking at the Ichimoku indicator, a sell signal is seen as the tenkan level crosses the kijun level downwards. While this indicates a weakening in the short-term momentum of the market, it reveals a picture that price movements will find direction according to support and resistance levels.
In the current market conditions dominated by uncertainty, critical levels should be closely monitored in terms of trend following. Closes below the $2,000 support could deepen the downtrend and set the stage for testing lower levels. On the other hand, regaining the $2,131 level may indicate that buyers are gaining strength and with the increasing momentum, the price may start a move towards higher resistance levels.
Supports 2,000 – 1,907 – 1,770
Resistances 2,131 – 2,361 – 2,468
XRP/USDT
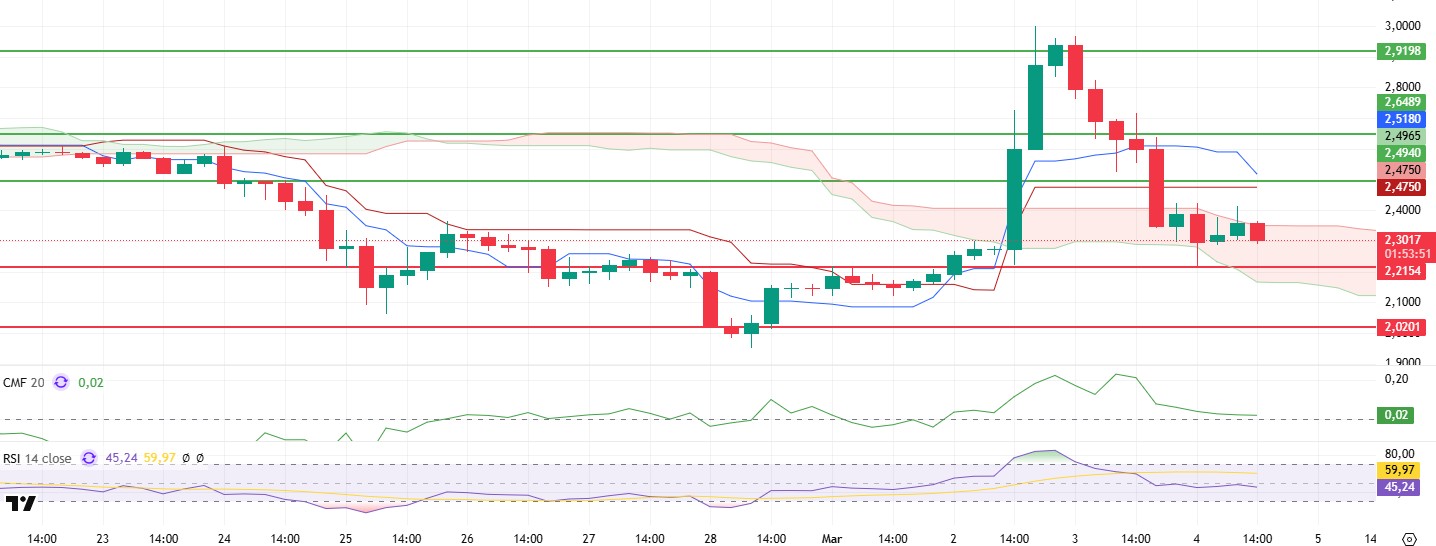
XRP, which found support at the level of $ 2.21 after yesterday’s decline, exhibited a limited price movement during the day and followed a horizontal course at the border of the Kumo cloud. The fact that the price is stuck between the Kumo cloud and the $2.21 support level shows that the breakouts in this region will be decisive in determining the future direction.
Analysing the technical indicators, the Chaikin Money Flow (CMF) indicator declined to the zero line and remained horizontal here, indicating that the cash flow in the market remains stagnant. This suggests that the balance between buyers and sellers is weak and volume remains low. On the other hand, the Relative Strength Index (RSI) indicator turned down again, suggesting that momentum has weakened and the sell-off may continue.
The rejections that the price received from the Kumo cloud and the weakness in the indicators suggest that XRP may continue its current downward trend. However, if the $2.21 level is maintained as a strong support zone, it is possible that the price may react upwards and make a recovery move towards the $2.49 resistance level.
Supports 2.2154 – 2.0201 – 1.9890
Resistances 2.4940 – 2.6489 – 2.9198
SOL/USDT
Over $279 million was moved to SOL CEXs by Galaxy Digital. On the other hand, Neptune Digital has joined Sol Strategies to develop Solana Staking. Through this agreement, Neptune will leverage Sol Strategies’ advanced blockchain infrastructure to optimize Solana staking. Onchain, according to on-chain analytics firm Coinglass, spot inflow/outflow data showed that over $180 million worth of SOL tokens have exited exchanges in the last 48 hours.
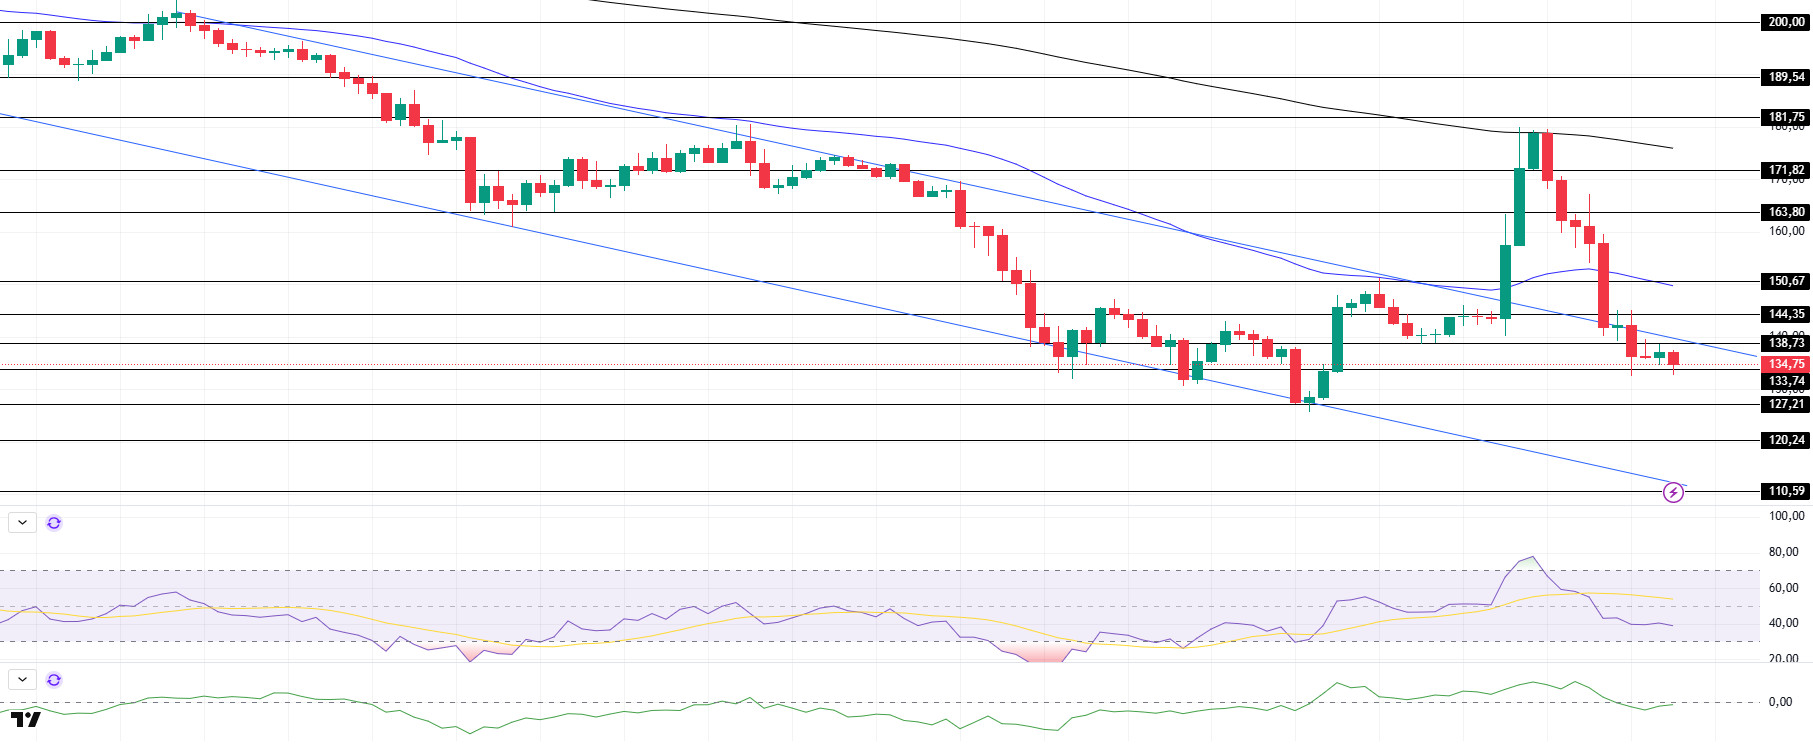
SOL has been slightly bearish since our morning analysis. On the 4-hour timeframe, the 50 EMA (Blue Line) continues to be below the 200 EMA (Black Line). This could deepen the decline further in the medium term. At the same time, the price started moving below the two moving averages again. When we examine the Chaikin Money Flow (CMF)20 indicator, it moved into negative territory. As a matter of fact, the decline in volume may further increase money outflows. However, the Relative Strength Index (RSI)14 indicator lost momentum from the positive zone and reached the middle level of the negative zone. The $150.67 level stands out as a very strong resistance point in the rises driven by both the upcoming macroeconomic data and the news in the Solana ecosystem. If it breaks here, the rise may continue. In case of retracements for the opposite reasons or due to profit sales, the support level of $ 127.21 can be triggered. If the price comes to these support levels, a potential bullish opportunity may arise if momentum increases.
Supports 133.74 – 127.21 – 120.24
Resistances 138.73 – 144.35 – 150.67
DOGE/USDT
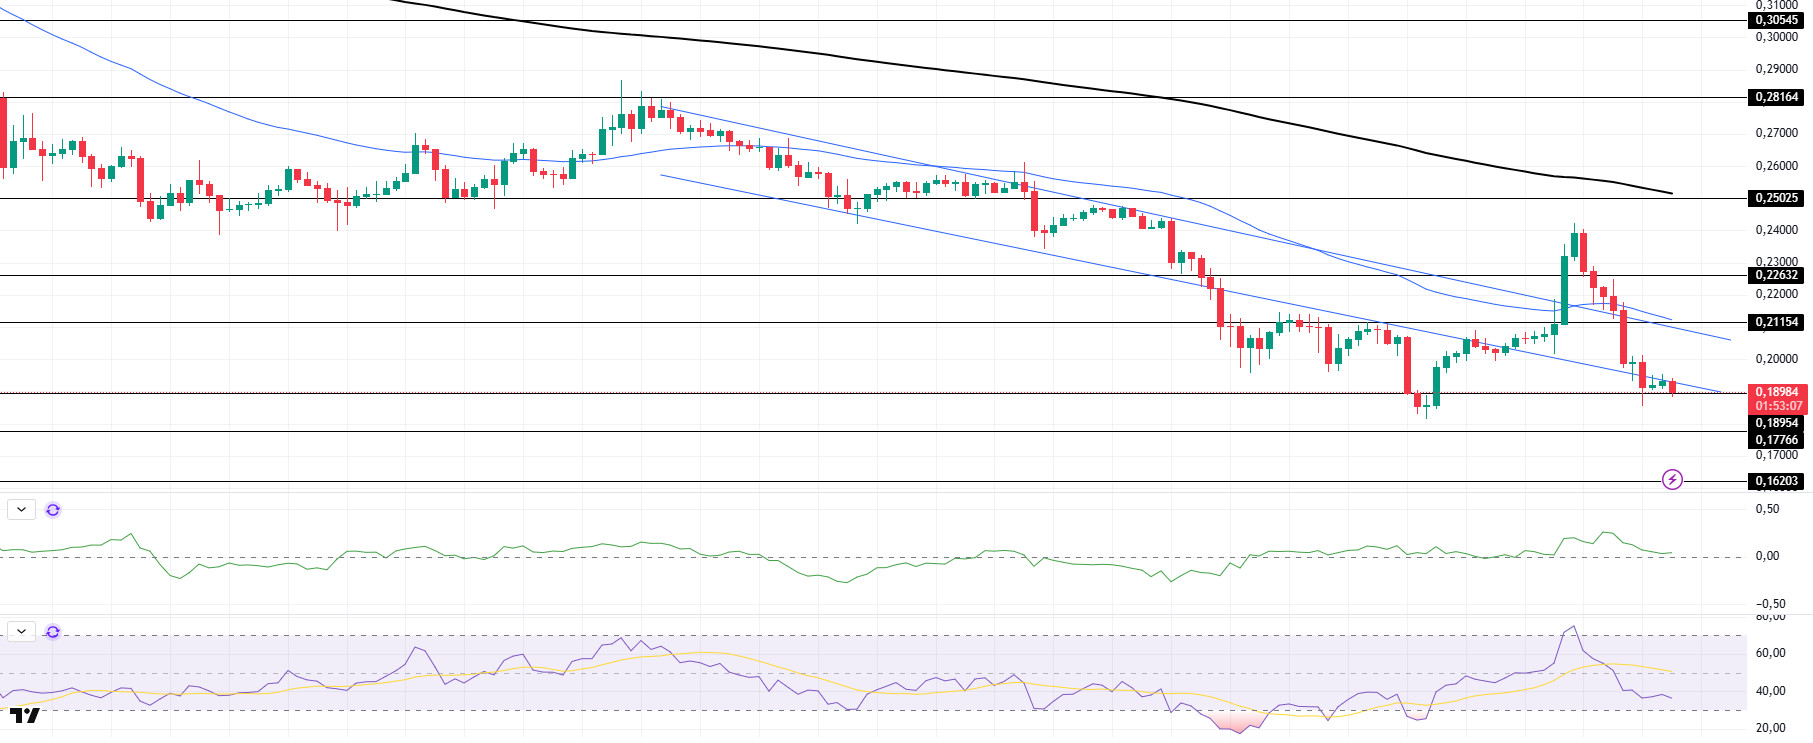
DOGE has moved sideways since our morning analysis. The price tested the bottom of the downtrend three times as resistance but failed to break it. On the 4-hour timeframe, the 50 EMA (Blue Line) is below the 200 EMA (Black Line). This could mean that the decline could deepen further in the medium term. However, the price is below two moving averages. However, the difference between the two moving averages as well as the difference between the price and the 50 EMA increases the probability that DOGE will rise. The Chaikin Money Flow (CMF)20 indicator is in positive territory. However, the negative daily volume may reduce money inflows. On the other hand, Relative Strength Index (RSI)14 accelerated downward from the overbought level again and was found at the mid-level of the negative zone. This may continue the downtrend. The $0.21154 level stands out as a very strong resistance point in the rises due to political reasons, macroeconomic data and innovations in the DOGE coin. In case of possible pullbacks due to political, macroeconomic reasons or negativities in the ecosystem, the $0.17766 level, which is the base level of the trend, is an important support. If the price reaches these support levels, a potential bullish opportunity may arise if momentum increases.
Supports 0.18954 – 0.17766 – 0.16203
Resistances 0.21154 – 0.22632 – 0.25025
LEGAL NOTICE
The investment information, comments and recommendations contained herein do not constitute investment advice. Investment advisory services are provided individually by authorized institutions taking into account the risk and return preferences of individuals. The comments and recommendations contained herein are of a general nature. These recommendations may not be suitable for your financial situation and risk and return preferences. Therefore, making an investment decision based solely on the information contained herein may not produce results in line with your expectations.

