
TECHNICAL ANALYSIS
BTC/USDT
Trump family-owned World Liberty Financial (WLFI) continues its growth strategy by transferring 25 million USDC to a new multi-signature wallet. On the other hand, El Salvador’s President Nayib Bukele announced that they will continue Bitcoin purchases despite the $1.4 billion deal with the IMF. Bukele emphasized his determination on Bitcoin and gave the message “We will not stop.”
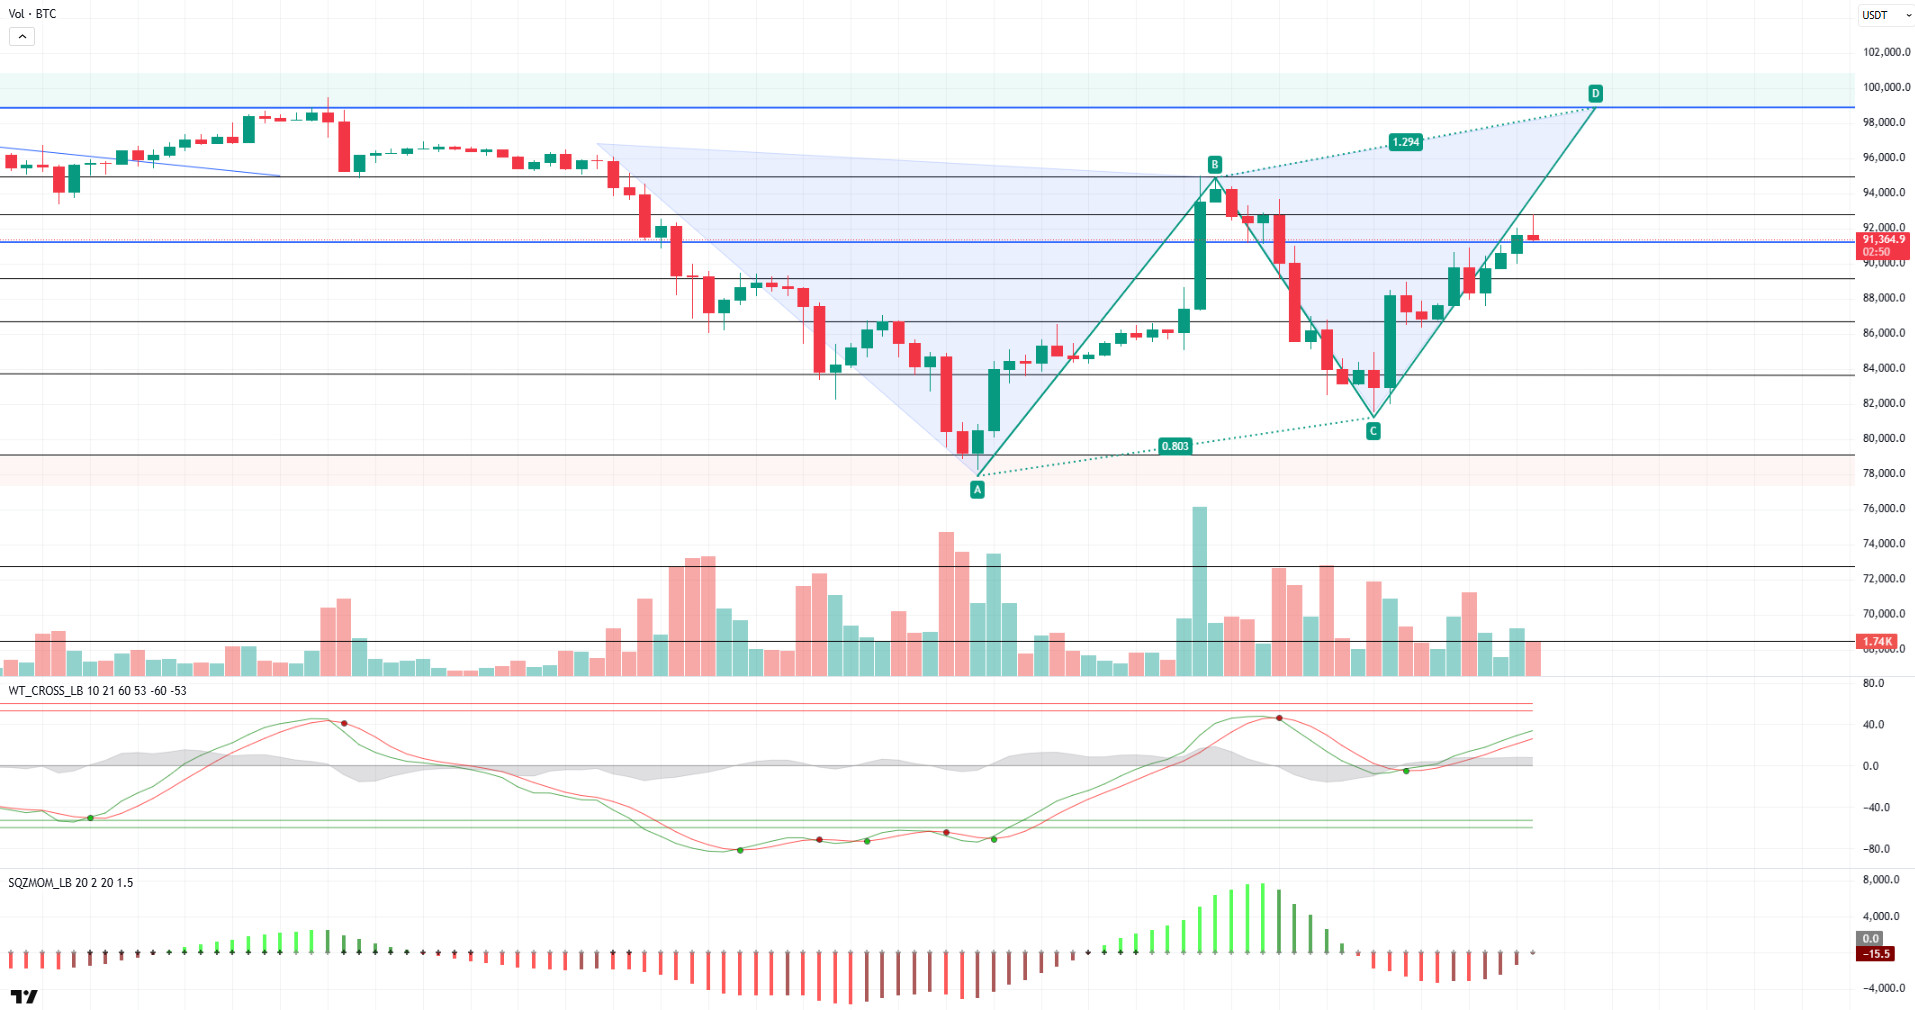
Looking at the technical outlook, BTC continues to move towards point D in line with the pattern. The price, which experienced a retest from the 90,000 level yesterday, managed to test this area once again in the evening hours and managed to rise above it. Currently trading at 91,400, BTC is trying to regain momentum by retreating a little after testing the 92,800-resistance level. When technical oscillators are analyzed, it is seen that the buy signal is maintained on the hourly and 4-hour charts, and momentum indicators may support this movement by moving into positive territory during the day. If the upward movement continues, exceeding the 92,800 level will be a critical threshold for BTC. Breaking above this level could bring the 95,000 level, which is a major resistance point, back on the agenda. It seems likely that the price will approach the D point, especially before the details of the reserve system are released. In case of a possible selling pressure, we will follow the 90,400 level as a reference point
Supports 89,000 – 90,400 – 86,500
Resistances 92,800 – 95,000 – 97,000
ETH/USDT
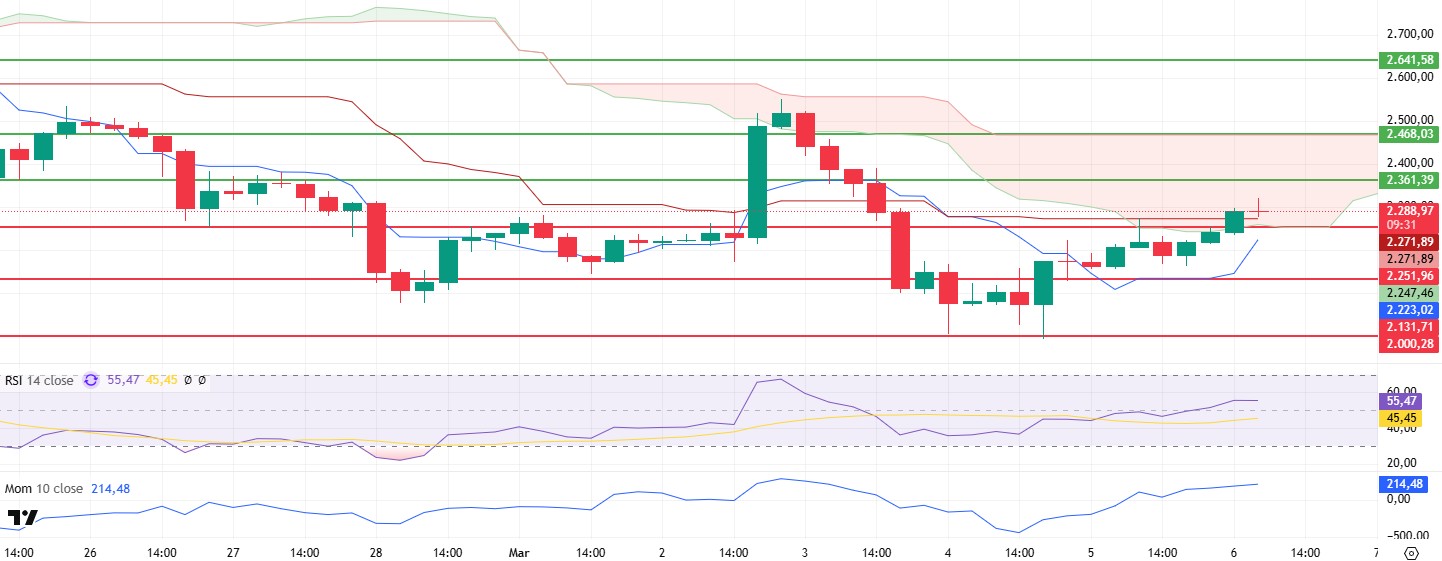
With the effect of the recovery in global markets, ETH managed to rise above the $ 2,300 level as a of the rise it experienced in the morning hours. With this rise, ETH, which is within the boundaries of the kumo cloud, one of the important components of the Ichimoku indicator, continues to give positive signals in terms of technical outlook.
When technical indicators are analyzed, the price closing above the kijun level of the Ichimoku indicator and entering the kumo cloud indicates that the buy signal has been realized. The trend in the Ichimoku indicator is a strong indication that the price may maintain its upward trend, while at the same time revealing that the market supports the upward movement. The bullish move in the Tenkan level also stands out as an additional factor that reinforces the current positive outlook. However, the bullish Relative Strength Index (RSI) and momentum indicators are not showing any negative mismatches, which is an important confirmation that the price may continue its upward movement. The fact that the RSI is not approaching the overbought zone, and the momentum is in line with the price action supports the sustainability of the uptrend.
In light of all these technical indicators, it seems likely that if ETH holds above the $2,271 support level during the day, the upward movement will continue and the price may reach $2,361 and $2,468, respectively. However, a downside breaks of the $2,271 level and closes below this level could weaken the positive technical outlook and cause the price to retreat towards lower support levels. Therefore, the $2,271 level should be followed as a critical threshold for the short-term outlook.
Supports 2,271 – 2,131 – 2,000
Resistances 2,361 – 2,468 – 2,641
XRP/USDT
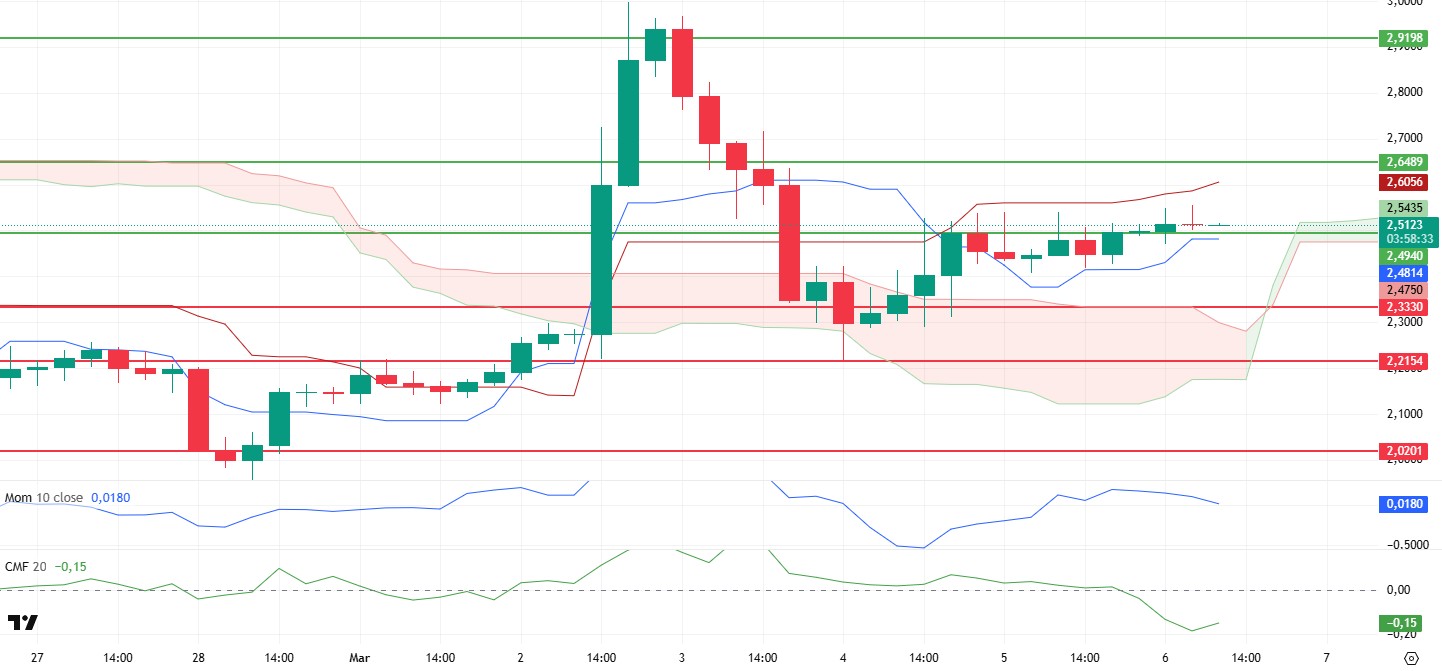
XRP broke through the $2.49 resistance level, which it has been trying to overcome for a long time, and managed to close above this level. However, technical indicators point to significant weaknesses.
First of all, the fact that momentum continues to move downward without supporting the rise and Chaikn Money Flow (CMF) enters the negative area and moves downward independent of the price movement indicates that the upward movement is limited and far from spot support. When the Ichimoku indicator is analyzed, the price is still between the tenkan and kijun levels, indicating that the trend remains uncertain.
As a result, with the weaknesses in technical indicators, the price breaching the $2.49 level again and breaking the tenkan level may bring sharp declines. The break of the $2.64 level may allow the negative outlook to disappear and the uptrend to continue.
Supports 2.4940 – 2.3307 – 2.2154
Resistances 2.6489 – 2.9198 – 3.1493
SOL/USDT
Foundation Capital has raised $600 million for Fund 11 to continue supporting early-stage startups. The new fund of Solana’s first backer will target crypto, fintech and corporate AI investments. On the other hand, according to new data provided by Dune Analytics, Solana experienced a massive 88% drop in token growth.
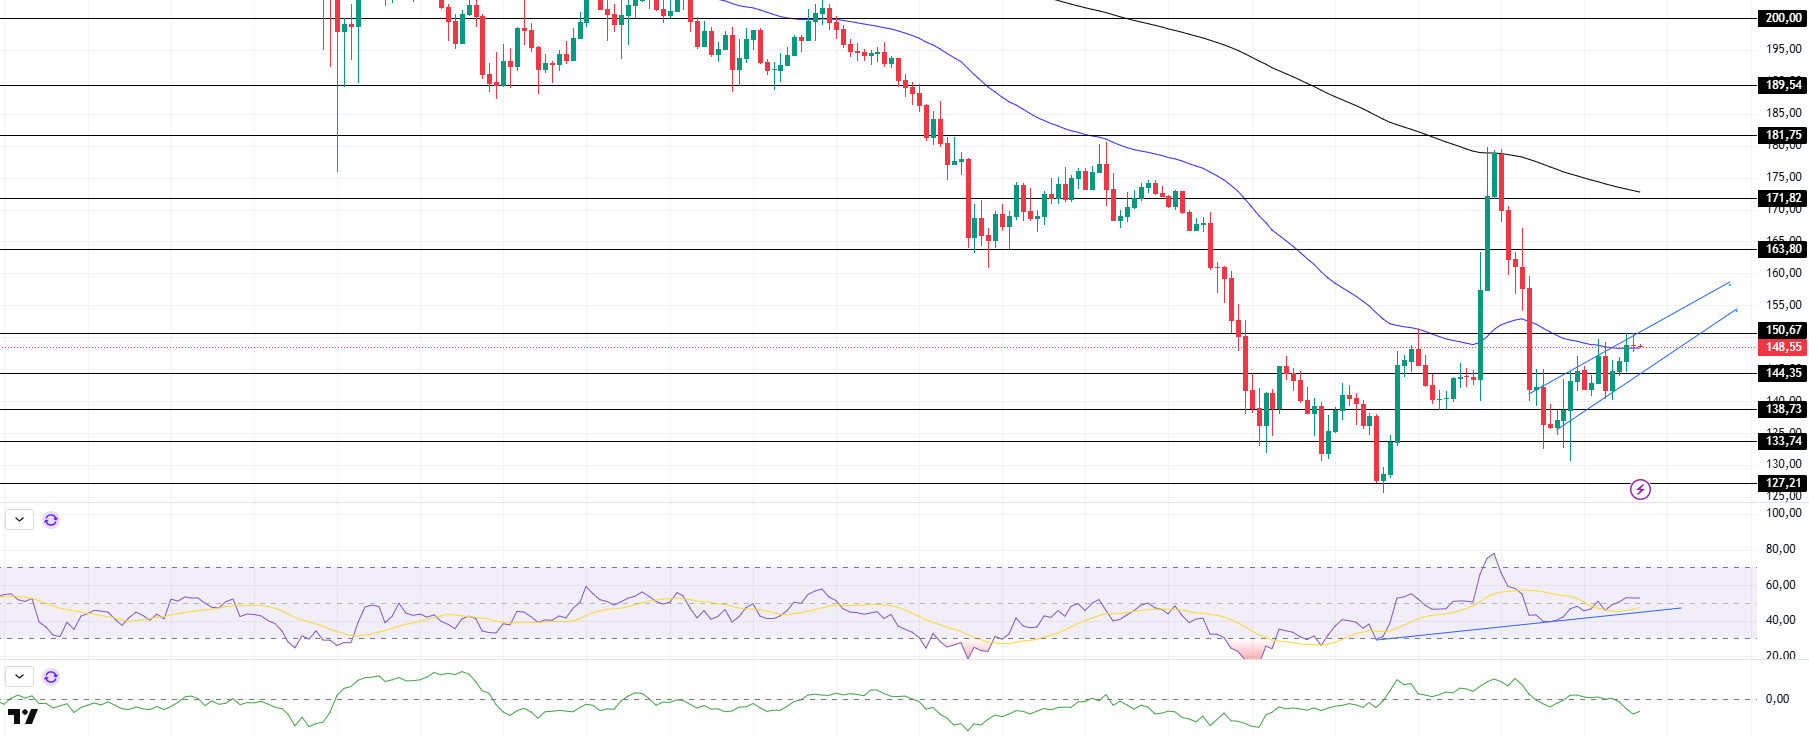
SOL was slightly bullish on the optimism in the market. This enabled the asset to break the 50 EMA (Blue Line) to the upside. However, the wedge pattern should be taken into consideration. If it works, a decline may occur. On the 4-hour timeframe, the 50 EMA (Blue Line) continues to be below the 200 EMA (Black Line). This could deepen the decline further in the medium term. At the same time, the price started moving between two moving averages. The Chaikin Money Flow (CMF)20 indicator moved into negative territory. However, the decline in volume may increase money outflows. However, the Relative Strength Index (RSI)14 indicator has accelerated to the middle levels of the positive zone. At the same time, RSI maintains its uptrend from February 28. The $ 163.80 level is a very strong resistance point in the rises driven by both the upcoming macroeconomic data and the news in the Solana ecosystem. If it breaks here, the rise may continue. In case of retracements for the opposite reasons or due to profit sales, the support level of $ 138.73 can be triggered. If the price comes to these support levels, a potential bullish opportunity may arise if momentum increases.
Supports 144.35 – 138.73 – 133.74
Resistances 150.67 – 163.80 – 171.82
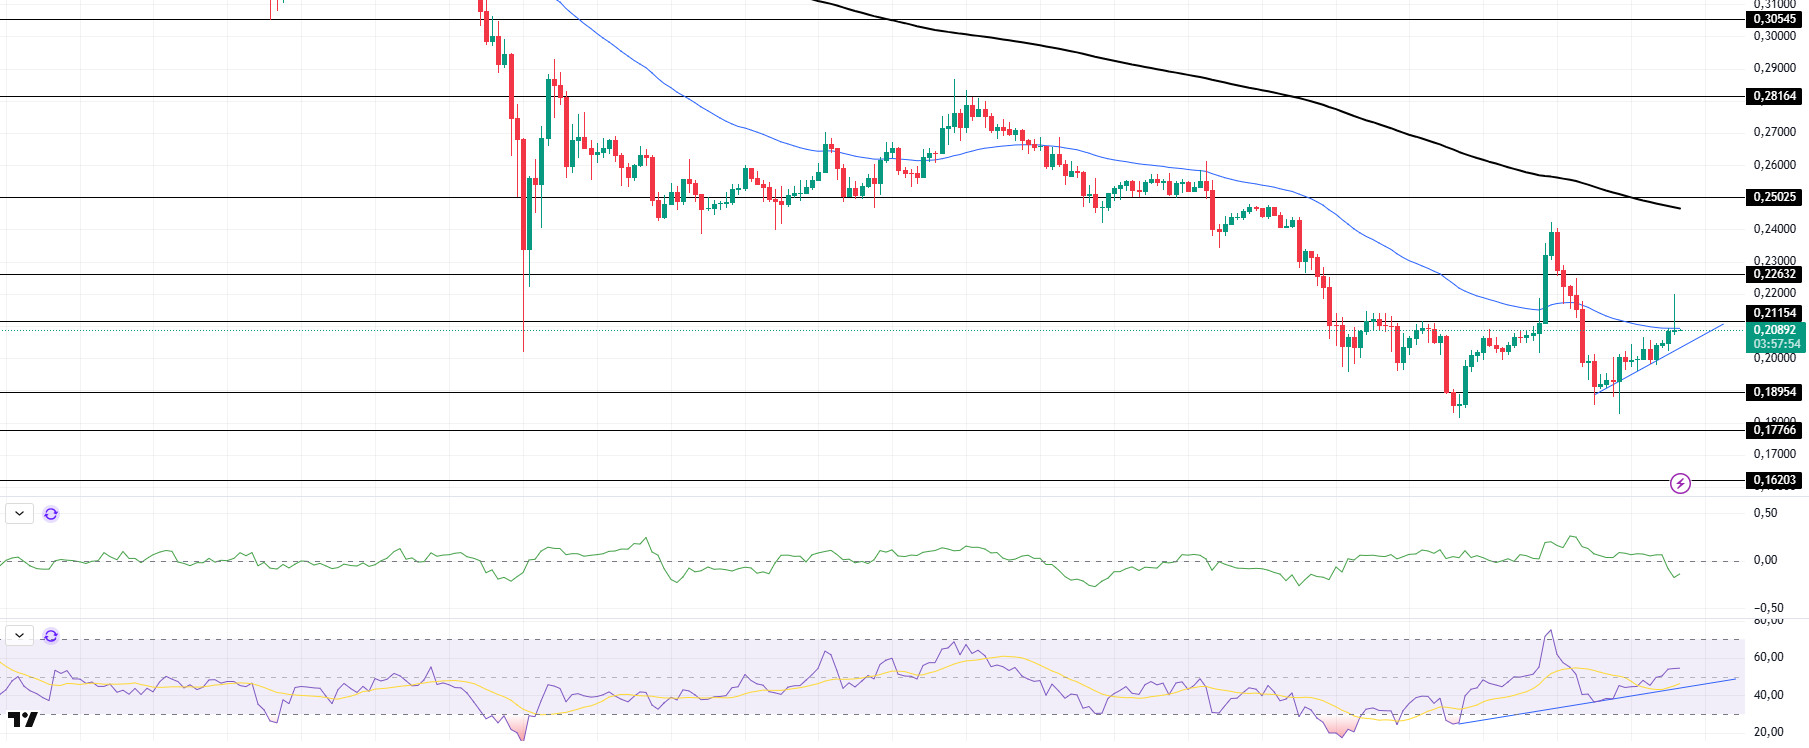
DOGE/USDT
On March 4, the number of Dogecoin addresses reached an all-time high of 83.48 million, indicating strong ecosystem activity.
DOGE turned bullish after a period of stagnation. The price continued to hover above the uptrend that started on March 4. It is currently testing the strong resistance at 0.21154 and the 50 EMA (Blue Line). On the 4-hour timeframe, the 50 EMA (Blue Line) is below the 200 EMA (Black Line). This could mean that the decline could deepen in the medium term. However, the price has started to hover between two moving averages. The larger gap between the two moving averages increases the probability of DOGE moving higher. When we analyze the Chaikin Money Flow (CMF)20 indicator, it is in the negative zone. At the same time, the negative daily volume may further reduce money inflows. On the other hand, Relative Strength Index (RSI)14 is at the upper level of the negative zone. At the same time, the uptrend in RSI, which started on February 28, continues. The $0.21154 level stands out as a very strong resistance point in the rises due to political reasons, macroeconomic data and innovations in the DOGE coin. In case of possible pullbacks due to political, macroeconomic reasons or negativities in the ecosystem, the base level of the trend, the $ 0.18954 level, is an important support. If the price reaches these support levels, a potential bullish opportunity may arise if momentum increases.
Supports 0.18954 – 0.17766 – 0.16203
Resistances 0.21154 – 0.22632 – 0.25025
LEGAL NOTICE
The investment information, comments and recommendations contained herein do not constitute investment advice. Investment advisory services are provided individually by authorized institutions taking into account the risk and return preferences of individuals. The comments and recommendations contained herein are of a general nature. These recommendations may not be suitable for your financial situation and risk and return preferences. Therefore, making an investment decision based solely on the information contained herein may not produce results in line with your expectations.
