
BTC/USDT
Last week, the crypto market witnessed historic developments. Trump’s tariffs on Canada, Mexico and Europe created uncertainty in the markets, while sentiment data fell to extreme fear levels after a long time. This shook investor confidence, causing Bitcoin to fall to the $78,000 level, and the market faced severe selling pressure. However, over the weekend, Trump’s strategic crypto reserve move, which he emphasized in his election promises and reiterated that he would make the US the global crypto capital again, created a strong recovery in the market. With this development, Bitcoin rose sharply from $85,000 to $95,000, increasing volatility in the markets.
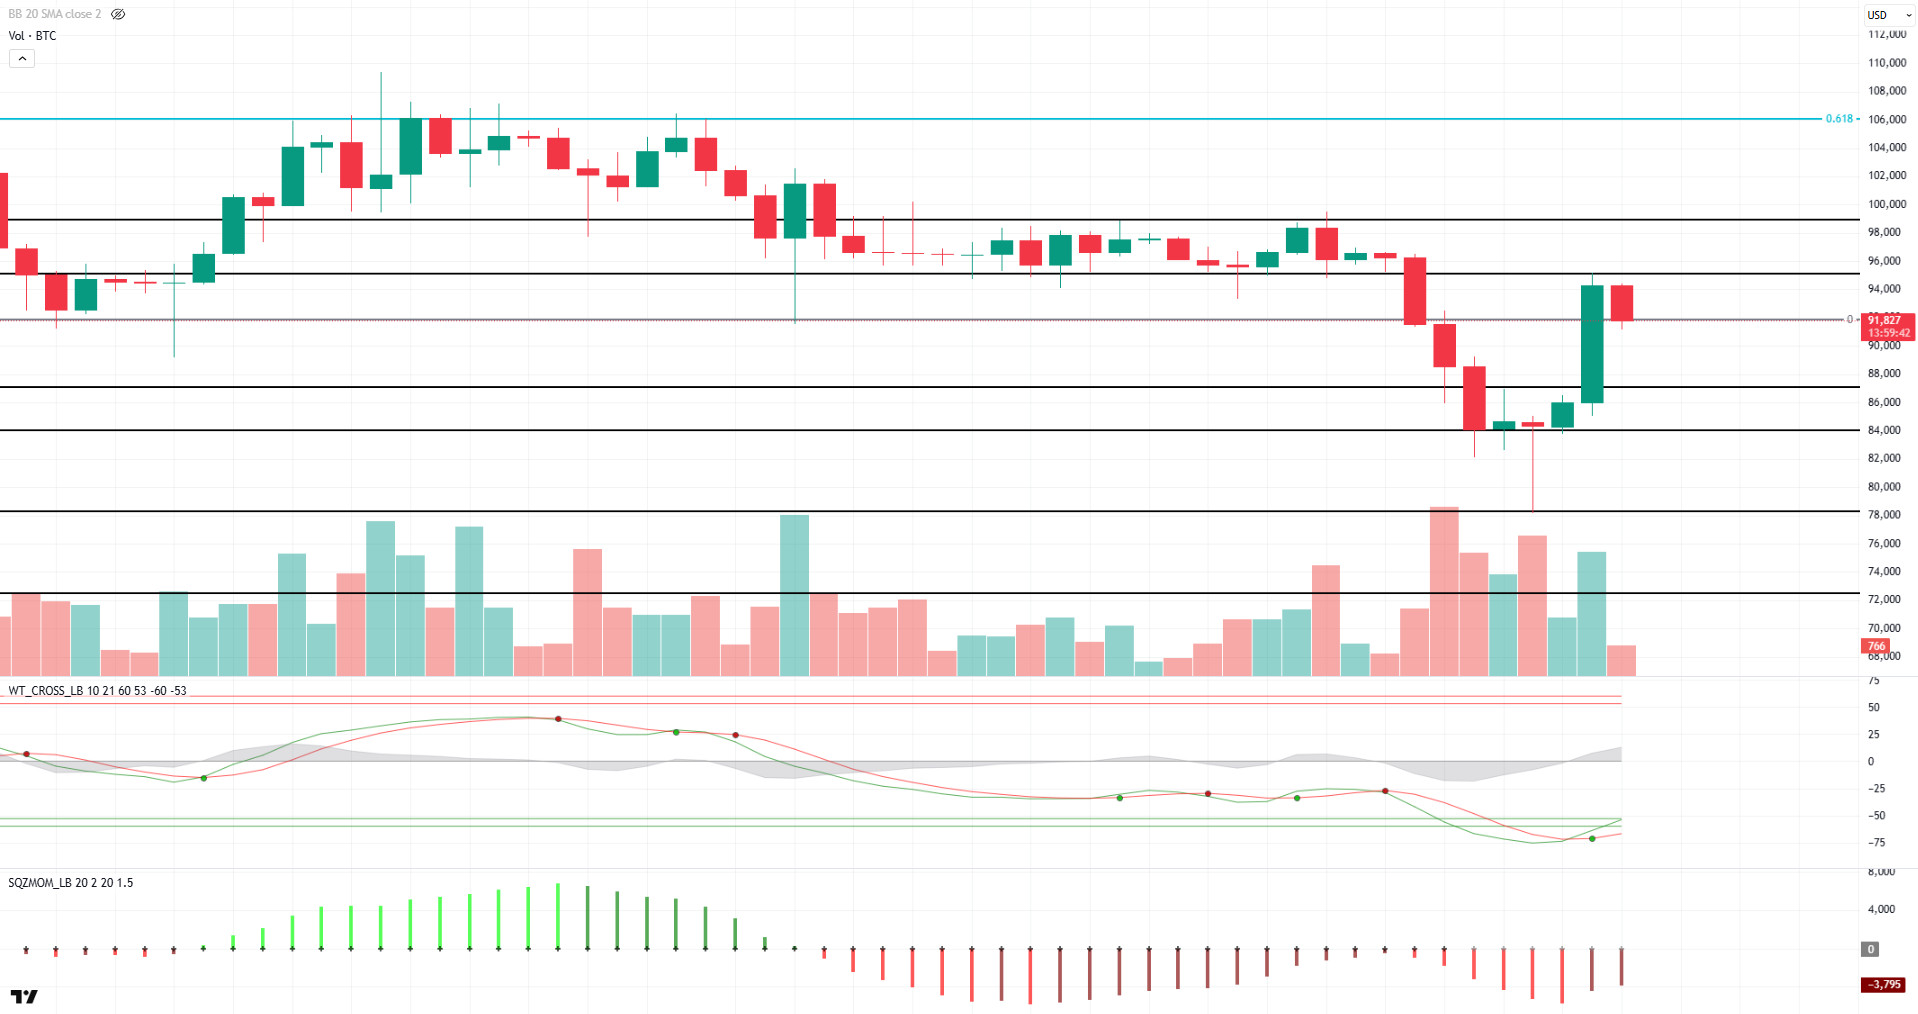
Looking at the technical outlook, BTC fluctuated throughout the week in tandem with fundamental developments. BTC, which started the week at 91,000, lost this area and suffered a sharp pullback to 78,000. Although there has been a 4.4% drop on a weekly basis for the moment, we have witnessed a 17% retracement of the price from the lowest level. BTC, which recovered its losses at the end of the week, continues to trade at 92,000. When the technical oscillators are analyzed, it is observed that it produces a buy signal in the oversold area on the daily chart, while momentum indicators are slowly starting to turn their negative momentum into positive. This suggests that BTC may create a favorable backdrop for BTC to continue its bullish move. If the upward movement continues, the 95,000 level appears as a critical resistance point. Exceeding and closing above this level could bring six-digit levels back to the agenda and contribute to the price entering a stronger uptrend. In a possible pullback scenario, the 90,000 level will be followed as an important support point. A pullback below this level could weaken BTC’s chances of staying in positive territory and lead to a new wave of selling.
Supports 90,000 – 87,000 – 84,000
Resistances 92,800 – 95,000 – 99,100
ETH/USDT
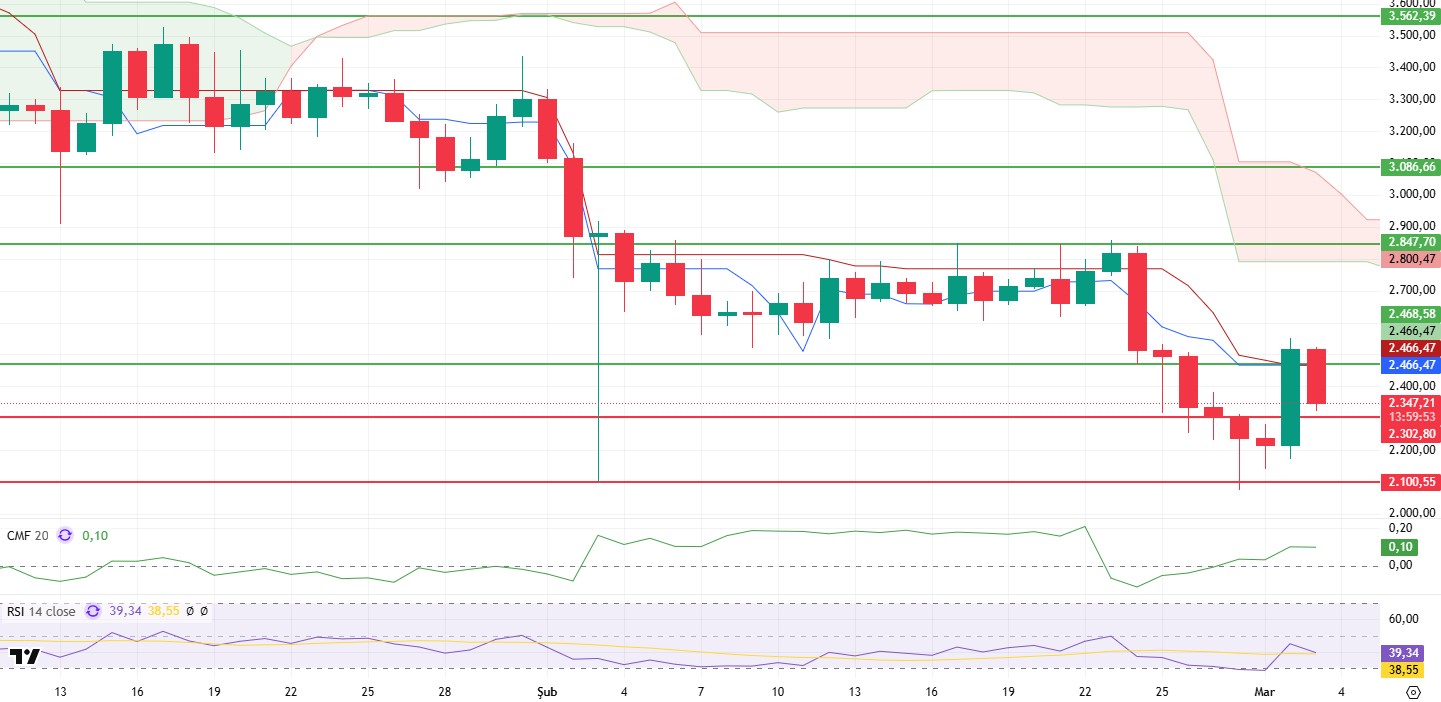
Ethereum entered a sharp correction last week after losing its support at $2,598 and retreated to around $2,100. ETH, which found support from this region, managed to hold above $ 2,200 and started to give signs of recovery. Yesterday evening, US President Donald Trump’s order to create a US strategic crypto reserve caused a strong rise in the crypto market. Following this, when it was announced that Ethereum would also be included in the reserve system, ETH rose above the $2,500 level in a sudden bullish move. These price movements also had an impact on ETH derivatives markets, causing betas to rise. Total Value Locked (TVL) increases, especially in Layer-2 networks, attracted attention, while important signals were given that confidence in the ecosystem was regaining strength.
Analyzing technical indicators and on-chain data, Cumulative Volume Delta (CVD) data suggest that buying has regained momentum in the spot market. The bullish trend, especially on the futures side, stands out as an important catalyst that may support the price action. The rise in the Chaikin Money Flow (CMF) indicator in the positive territory reveals that market liquidity has started to increase, and the buy side is gaining strength. Relative Strength Index (RSI), on the other hand, entered a short-term correction after rising to 44 with the support from the oversold zone. However, the fact that this correction occurred above the moving averages can be considered as a positive signal for the overall trend. When the Ichimoku indicator is analyzed, the fact that ETH has not yet gained the Tenkan and Kijun levels shows that it has not achieved a strong momentum. This indicates that price movements may remain fragile unless they exceed certain resistance levels.
Overall, both technical indicators and fundamental developments suggest that the necessary infrastructure is starting to form for Ethereum to start an uptrend in the short to medium term. Daily closes above $2,469 could reinforce this bullish outlook. However, a break above the major resistance at $2,847 could trigger more aggressive rallies. On the other hand, the $2,100 level stands out as a critical support. A downside break of this level could strengthen the bearish momentum and ETH could enter a deeper correction.
Supports 2,302 – 2,100 – 1,921
Resistances 2,469 – 2,847 – 3,086
XRP/USDT
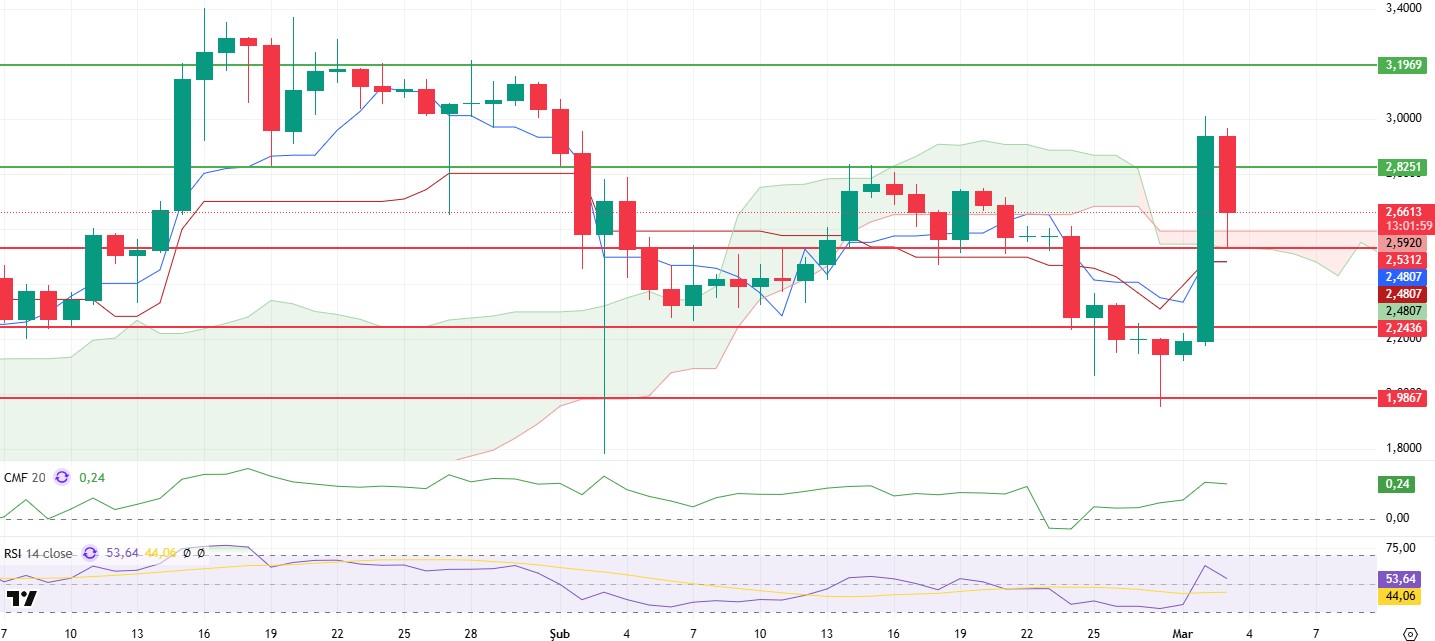
XRP was affected by the uncertainties in global markets and selling pressure in the crypto market last week, retreating to the main support at the $1.98 level. With the reaction buying from this level, it recovered slightly over the weekend and rose as high as $2.20. However, the real momentum started yesterday when US President Donald Trump announced the order to create a US strategic crypto reserve. When it was stated in this statement that XRP would also be considered within the scope of the reserve, a strong wave of buying occurred in the markets and the price of XRP rose to the level of $ 3.00 in a short time. However, with the profit sales in the night hours, the price retreated to the level of $ 2.53, the support of the kumo cloud.
Along with these price movements, positive signals were also evident in technical indicators. The Chaikin Money Flow (CMF) indicator rose strongly in the positive territory, reaching 0.23. The fact that this rise did not create any negative divergence supports the bullish outlook by showing that the liquidity flow in the market is healthy and sustainable. On the other hand, the Relative Strength Index (RSI) indicator entered a slight correction after reaching the 63 level and managed to stay above the based MA. This suggests that momentum is still strong and the market remains bullish. As for the Ichimoku indicator, the price rose above the kumo cloud and the tenkan level rose as high as the kijun level, confirming that the market is forming an uptrend.
In general, both technical analysis indicators and fundamental developments indicate that XRP maintains its bullish potential in the short and medium term. In particular, daily closes above the Kumo cloud at the $2.53 level can be considered as a critical threshold for the upward movement to continue. If it sags below this level and daily closes are realized here, it may cause a weakening of the bullish momentum and a deepening sales wave. Therefore, investors should carefully monitor price movements above the $2.53 level.
Supports 2.5312 – 2.2436 – 1.9867
Resistances 2.8251 – 3.1969 – 3.7151
SOL/USDT
Last week in the Solana ecosystem;
- Solana integrates $YLDS, an SEC-approved yielding stablecoin offering 3.85% APR without asset lockups.
- Franklin Templeton has filed an S-1 with the SEC to launch its spot Solana ETF following growing institutional interest in digital assets.
- A central exchange has launched CFTC-regulated Solana futures contracts, an important step towards potential Solana ETF approvals.
- Volatility Shares has launched its first Solana futures ETFs, marking an important step in the increasing integration of cryptocurrency into regulated financial markets. The two ETFs, Volatility Shares 2x Solana ETF (SOLT) and Solana ETF (SOLZ), are now listed on the Depository Trust & Clearing Corporation (DTCC).
On the onchain side;
- New addresses on the Solana network fell to a 3-month low, signaling waning investor interest and weakening macro momentum. From 18.5 million active addresses to just 7.3 million today, network activity has dropped by 60%.
- Solana’s TVL is down to $6.85 billion at the time of writing.
- It continues with daily active addresses falling to a three-month low of 3.4 million.
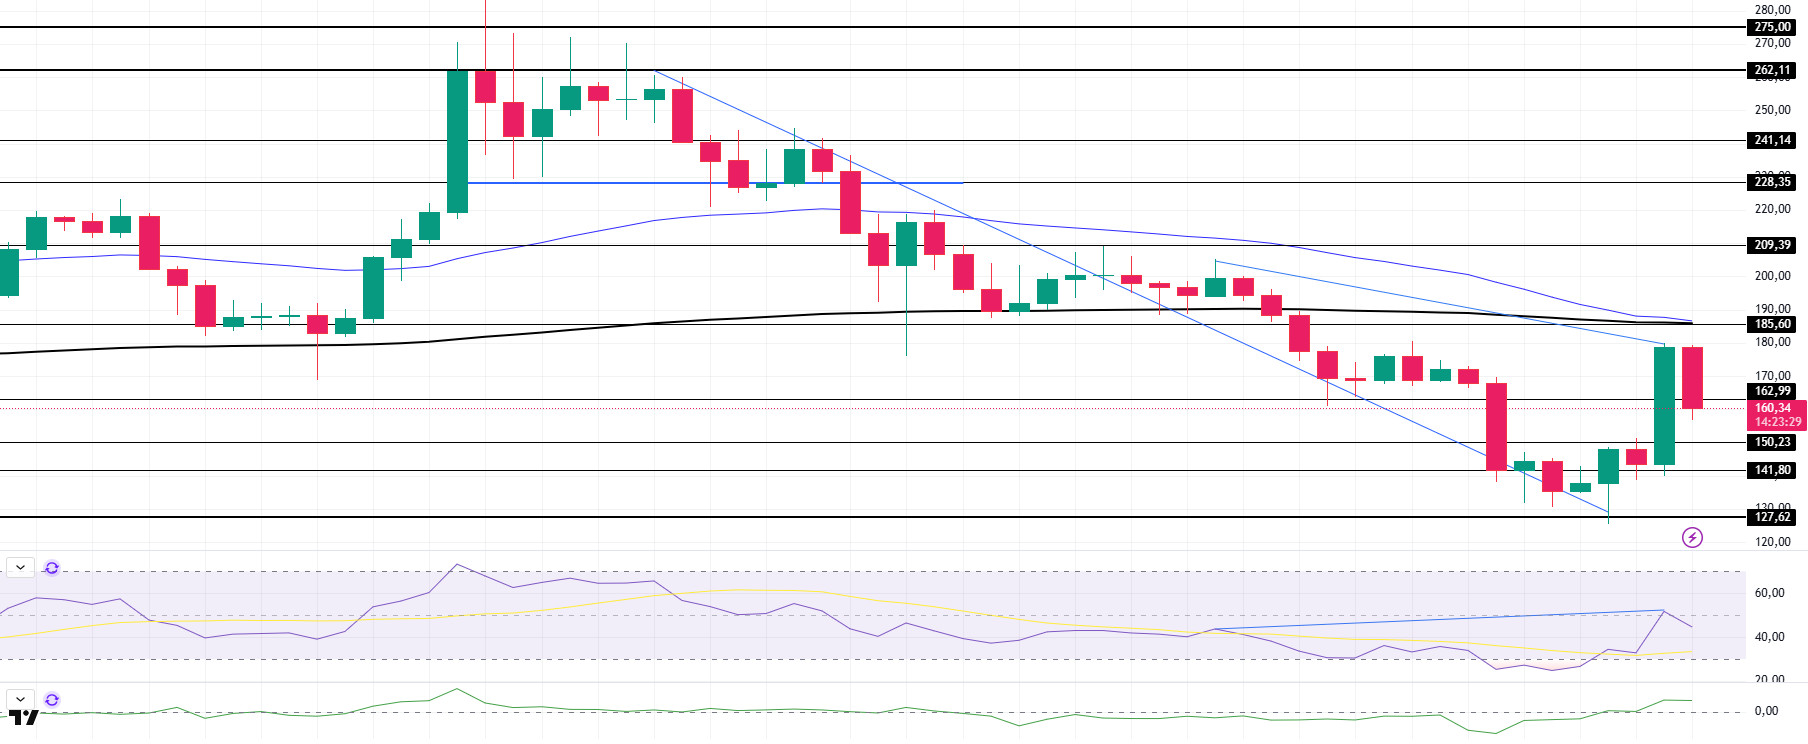
With these developments, when we look technically at SOL, the network’s native token, it has been declining since last week, but after US President Trump’s statements, it continued to retreat after a rise of about 40%, using the downtrend that started on January 26 as support. The price is below the 50 EMA (Blue Line) and the 200 EMA. On our daily chart, the 50 EMA (Blue Line) remains above the 200 EMA (Black Line). However, the pattern named death cross, that is, when the 50 EMA moving average crosses below the 200 EMA, may form. This could put the tandem into a bearish phase in the medium term. Relative Strength Index (RSI) 14 is in the negative zone. At the same time, bearish discrepancy is noteworthy. When we examine the Chaikin Money Flow (CMF)20 indicator, it is close to the middle level of the positive zone, but the increase in volume may strongly increase money inflows. If the positive results in macroeconomic data and positive developments in the ecosystem continue, it may test the first major resistance level of $ 185.60. In case of negative macroeconomic data or negative news in the Solana ecosystem, the $150.23 level can be followed and a buying point can be determined.
Supports 162.99 – 150.23 – 141.80
Resistances 185.60 – 209.39 – 228.35
DOGE/USDT
Last week in the DOGE ecosystem;
- After being given a chainsaw labeled DOGE by Argentine president Javier Millei, Musk posted a very funny photo of himself on the X platform with “The Dogefather” in the background.
- The official account of the Dogecoin team quoted a tweet from Timothy Stebbing, director of the Dogecoin Foundation, in which he talked about plans to make global adoption of Dogecoin a reality in the future. Stebbing also stated that some major partnerships are on the way.
On the onchain side;
- Since January 20, 160,000 new users have created wallets on the Dogecoin network. At the same time, there was a 34% increase in active addresses.
- Due to whale inactivity, DOGE’s transactions fell by 88%.
- In 2025, the highest single-day spot outflows observed by Coinglass was $166.99 million on January 19.
- Whale transactions dropped to 66, while daily active addresses remained below 60 000. This is the lowest number recorded on this network since October 2024.
- DOGE’s total futures volume fell to $992 million from $58.2 billion in November.
- Open Interest data fell from $5.25 billion to $1.79 billion.
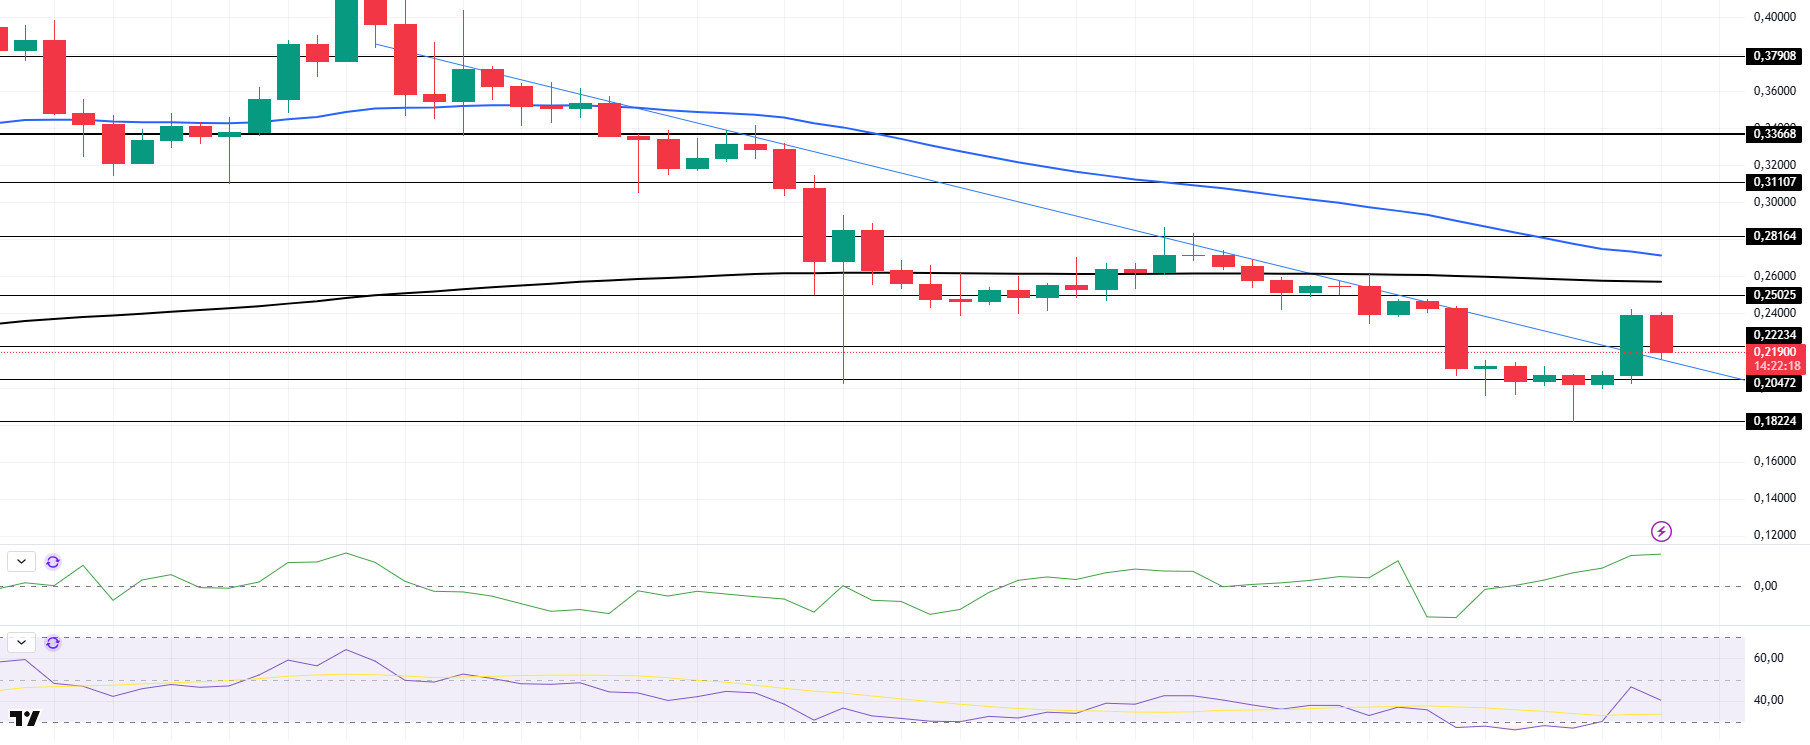
If we examine DOGE technically in the focus of all these developments, when we look at the daily chart, the asset, which has been in a downtrend since January 17, continued its decline until the last day and fell to the level of $ 0.18224. However, the asset, which kept pace with the general market after the market’s rise yesterday, is currently testing the resistance of the falling trend as support. Although the 50 EMA (Blue Line) continues to remain above the 200 EMA (Black Line), indicating that the bull continues for the asset, the low difference between the two averages may increase the likelihood of continuing to fall. When we look at the Chaikin Money Flow (CMF)20 indicator, the fact that it is in the positive zone, the high inflows and the increase in volume indicate that there may be a price increase. Relative Strength Index (RSI)14 was in the middle of the negative zone. In case of possible macroeconomic conditions and negative developments in the ecosystem and retracements, the $0.20472 level can be followed as a strong support. In case the retracement ends, and the rises begin, the 0.25025-dollar level should be followed as a strong resistance.
Supports: 0.22234 – 0.20472 – 0.18224
Resistances 0.25025 0.28164 – 0.31107
TRX/USDT
This week, Tron’s announcement that it will launch the Gas Free feature, which will support gas payments with USDT, created excitement in the ecosystem and with this excitement, it experienced a rise towards the end of last week. In addition, Tron’s founder Justin Sun has signaled that the cryptocurrency strategy of US President Trump will be steadfastly supported and will remain loyal to this support.
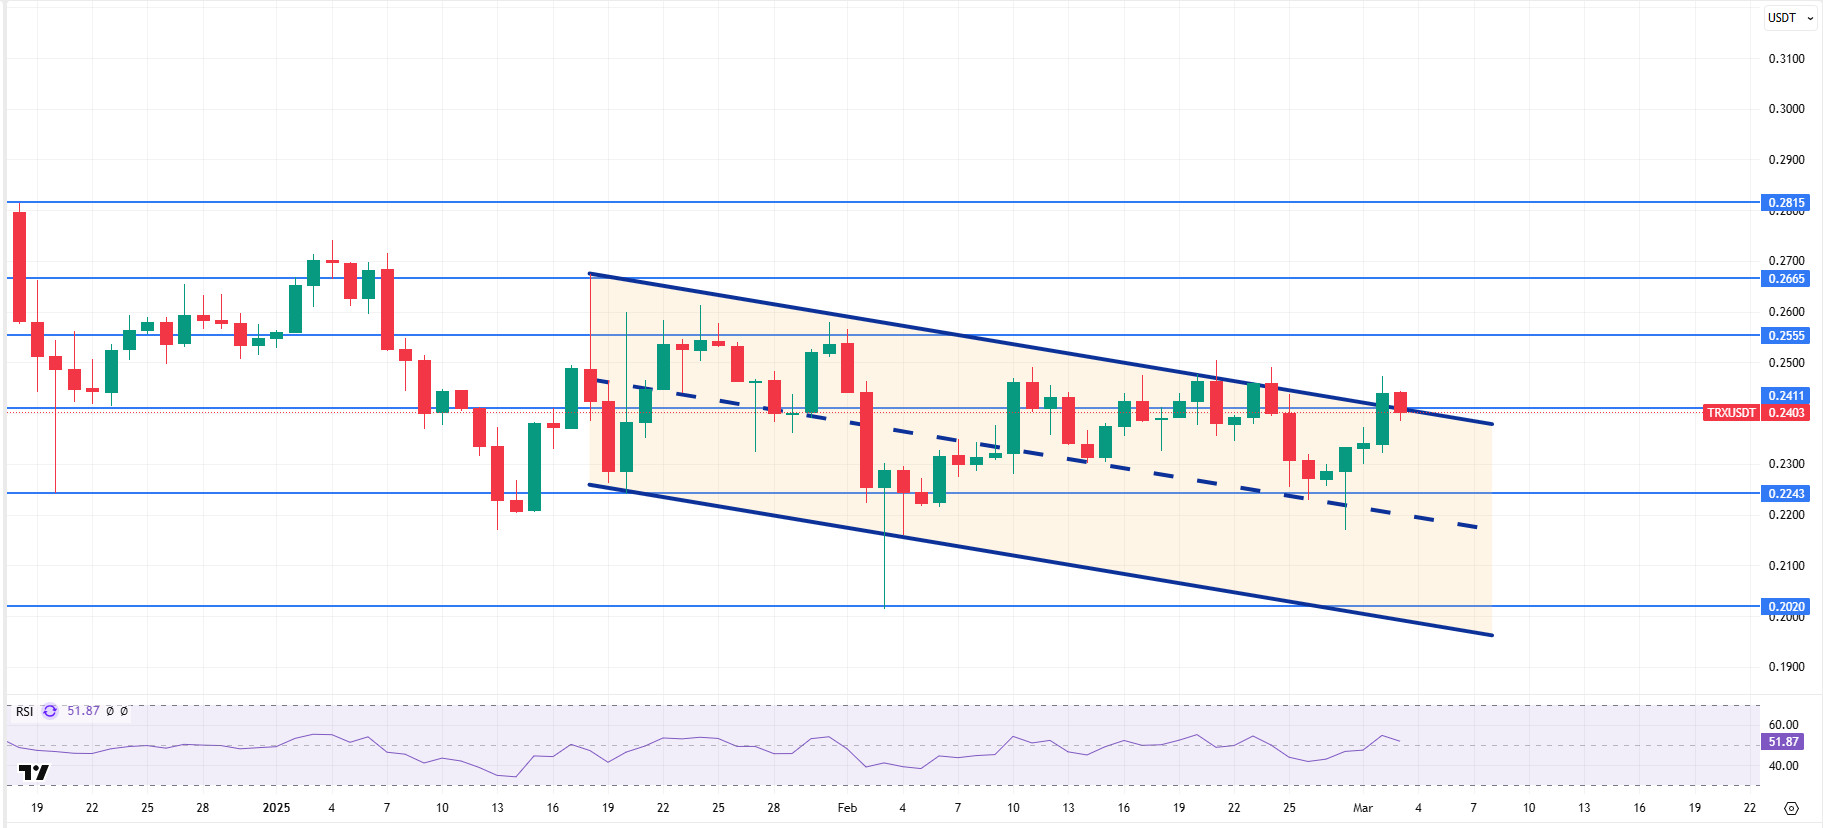
TRX, which started last week at 0.2459, fell about 1% during the week and closed the week at 0.2440. TRX, currently trading at 0.2403, is in the upper band of the bearish channel on the daily chart. With a Relative Strength Index value of 51, it can be expected to move towards the bearish channel middle band by falling slightly from its current level. In such a case, it may test the 0.2243 support. If it cannot close daily below 0.2243 support, it may increase with the possible buying reaction and may try to break the upper band of the channel again. In such a case, it may test 0.2555 resistance. As long as it stays above 0.2020 support on the daily chart, the bullish demand may continue. If this support is broken, selling pressure may increase.
Supports 0.2411 – 0.2243 – 0.2020
Resistances 0.2555- 0.2665 – 0.2815
AVAX/USDT
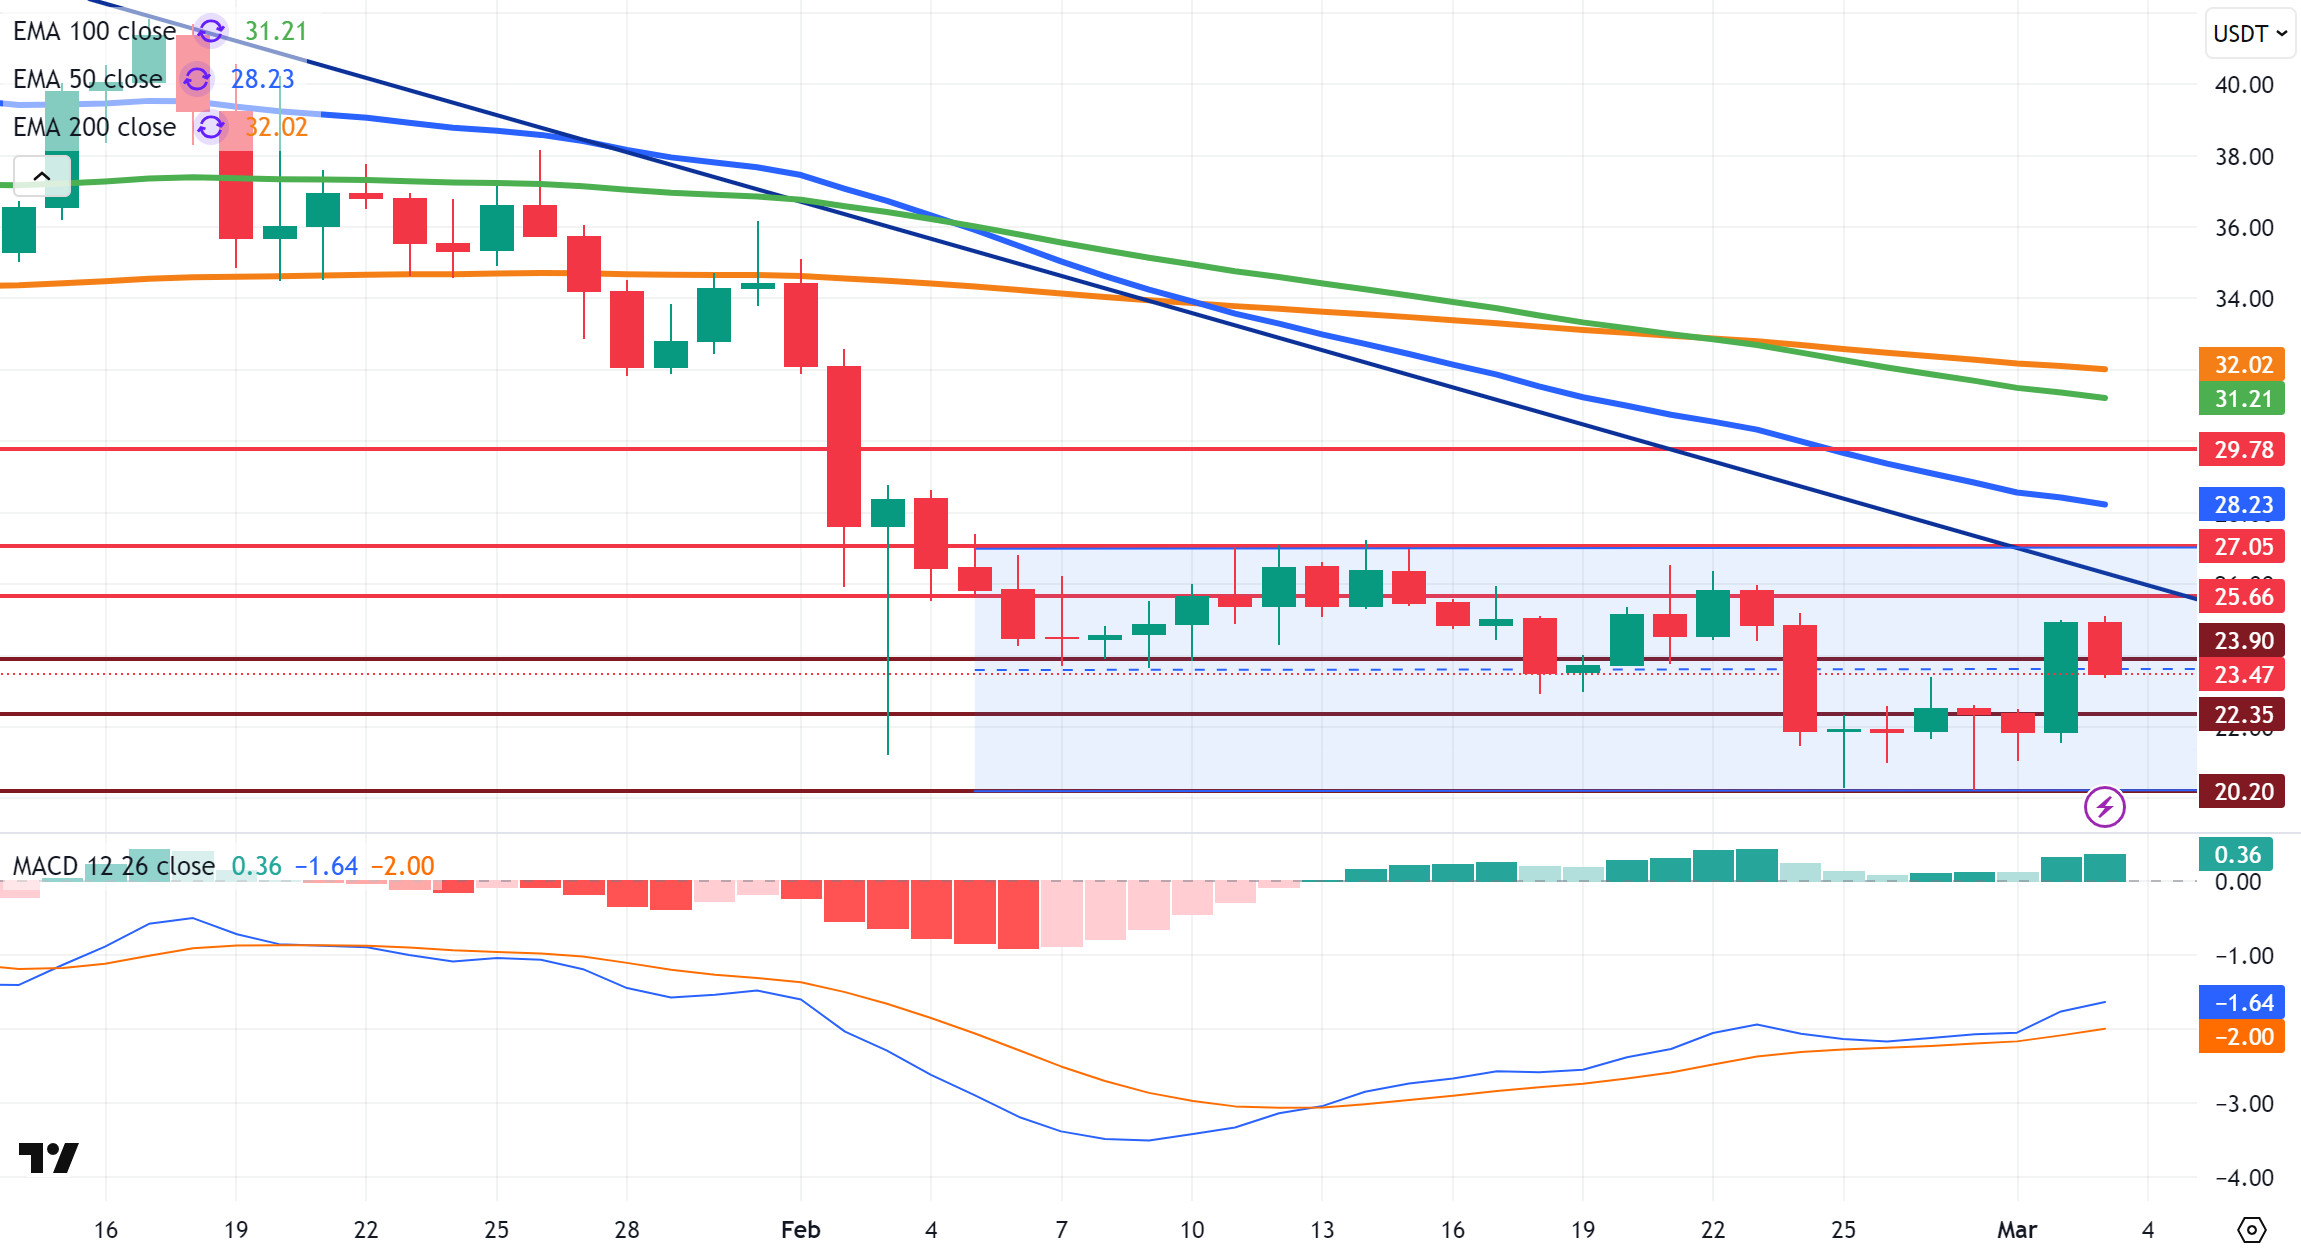
After starting trading at $ 24.83 at the opening of last week, AVAX continued its fluctuating movement within a horizontal band between $ 25.00 and $ 20.20. AVAX, which fell to $ 20.20 with selling pressure after Trump’s tariff announcements, rose to $ 25.16 with the general recovery of the crypto market after Trump’s statements on the strategic crypto reserve order. The weekly closing was realized at $ 24.94.
On the daily chart, the Moving Average Convergence/Divergence (MACD) indicator is in negative territory, moving above the signal line. This suggests that the selling pressure is starting to subside, and the negative momentum is weakening, but the price is yet to gain strong upside momentum. AVAX continues to trade well below the critical Exponential Moving Average (EMA) levels. This suggests that the downtrend is still dominant, and that upside moves may encounter strong resistance. Especially below the EMA50, the price’s recovery may be limited in the short term.
AVAX is testing the $23.90 support level on the opening day of the week. In case of a daily close below this level and the MACD indicator continues to remain in the negative territory, selling pressure may increase and the price may retreat to $22.35 and then $20.20 levels respectively. If the MACD indicator rebounds and approaches the zero line and stays above the signal line, AVAX may test the $25.66 resistance level. If this level is broken, the price can be expected to continue its uptrend towards $27.05 and then $29.78.
(EMA50: Blue Line, EMA100: Green Line, EMA200: Orange Line)
Supports 23.90 – 22.35 – 20.20
Resistances 25.66 – 27.05 – 29.78
SHIB/USDT
Last week, the Shiba Inu community burned 14,372,556 SHIBs in a single transaction, demonstrating the community’s commitment to deflationary strategies. While regular burns are taking place to reduce supply, Shiba Eternity’s Duel Mode is notable for its potential to burn 10 billion SHIBs per day. Dual Mode allows players to contribute to token burning while competing, increasing the interaction of the ecosystem and contributing to its sustainability. The gradual tightening of supply through this mechanism could have a positive impact on token value in the long run.
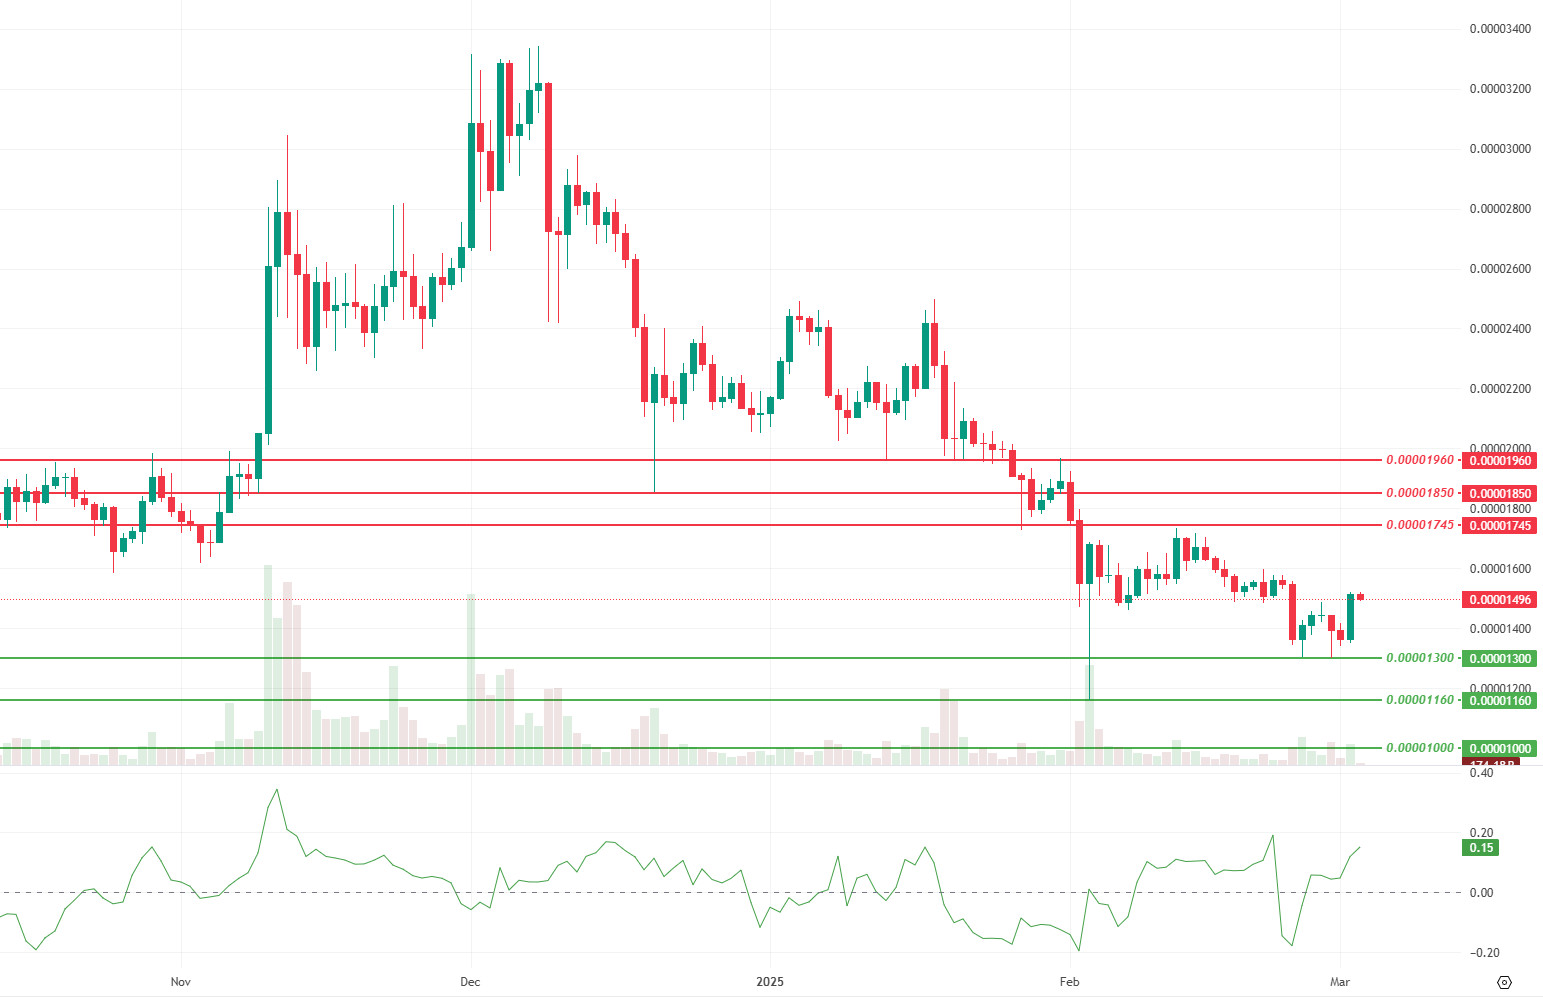
In the current technical outlook, while a significant decrease in momentum, trading volume and volatility was observed last week, there have been significant changes in market dynamics this week. The increase in momentum and trading volume indicates that trading activity has regained momentum, while the decrease in volatility indicates that price movements have become more balanced. When the CMF (Chaikin Money Flow) oscillator is analyzed, it is observed that selling pressure dominated last week, while buyers gained strength this week. In this direction, the price may be likely to rise towards $0.00001745 with the support it received from the $0.00001300 level. On the other hand, if the selling pressure increases again, the 0.00001300-dollar level can be closely monitored as a critical support point.
Supports 0.00001300 – 0.00001160 – 0.00001000
Resistances 0.00001745 – 0.00001850 – 0.00001960
LTC/USDT
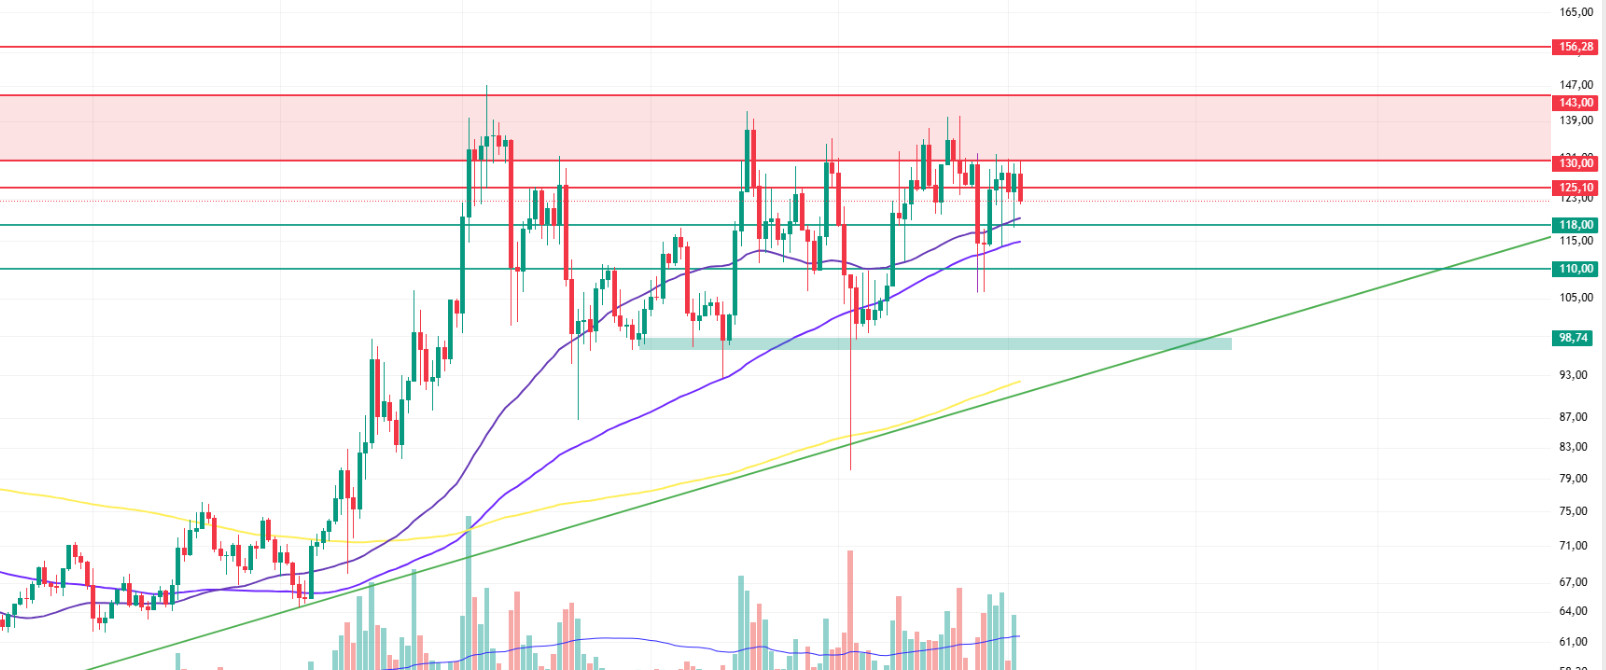
Litecoin, which fell 1.51% last week, ended its two-week positive closing streak. Litecoin, which declined less than the market despite retreating to 106.08 during this decline, managed to hold on to the 16th place in the market rankings with this movement and a market capitalization of $ 9.25 billion, while closing the week with about 1% more value against bitcoin. According to Arkham data, the amount of open positions in futures increased from $300 million to $378 million, while funding rates remain positive as in the previous week.
On Litecoin’s daily chart, the price remains above the 50 (purple line), 100 (orange line) and 200 (yellow line) period moving averages. However, it made a negative start to the week, breaking the 125.10 level, which it managed to stay above for the last four days. The intermediate support at 118.00, which was also tested last week, can be considered as an important support point for this week. If the decline hardens and Bitcoin’s pullbacks continue, Litecoin could extend to the intermediate support at 110.00. In a more unfavorable scenario, the major support level at 98.74 could come to the fore.
On the other hand, if the recovery in Bitcoin continues and the developments on the ETF side remain positive, the first resistance level for Litecoin can be considered as 125.10, followed by the 130.00 – 143.00 band. Although we have seen this band working as a strong resistance level before, this level is likely to be a more surmountable obstacle in the coming period as the market size and volume increase.
Resistances 125.10 – 130.00 – 143.00
Supports 118.00 – 110.00 – 98.74
LINK/USDT
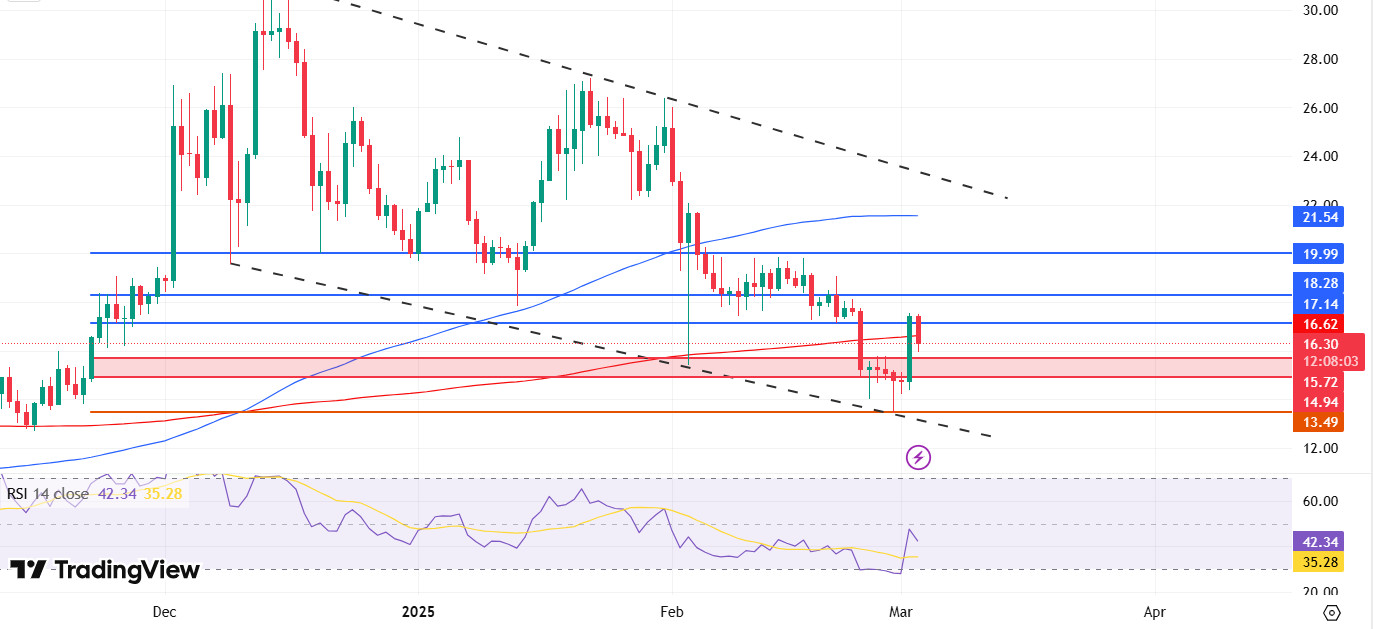
LINK is stuck between recent price action and a critical support level. On the daily chart, the price is looking for support around the 200-day moving average (SMA200) at $16.86. If it fails to hold at this level, the price is likely to fall towards the $15.72 and $14.94 levels. If the downward pressure continues, the $ 13.49 level stands out as a critical support point both technically and psychologically.
On the technical indicators side, the RSI is at 42.34, signaling a slight recovery from oversold territory. However, without a strong breakout above this level, the pressure on the price is likely to continue. On the other hand, the 100-day moving average (SMA100) is above the current price levels, suggesting that upside movements may remain limited.
When we look at the resistance levels, the range of $17.14 – $18.28 stands out as the first strong resistance zone in the short term. In terms of the price’s ability to continue its upward movement, breaking the $ 21.54 level with strong volume may be a critical threshold in terms of trend reversal. However, if this level cannot be exceeded, it seems likely that selling pressure will come back into play and direct the price towards support zones.
(SMA200: Red Line, SMA100: Blue Line)
Supports 15.72 – 14.94 – 13.49
Resistances 17.14 – 18.28 – 19.99
BNB/USDT
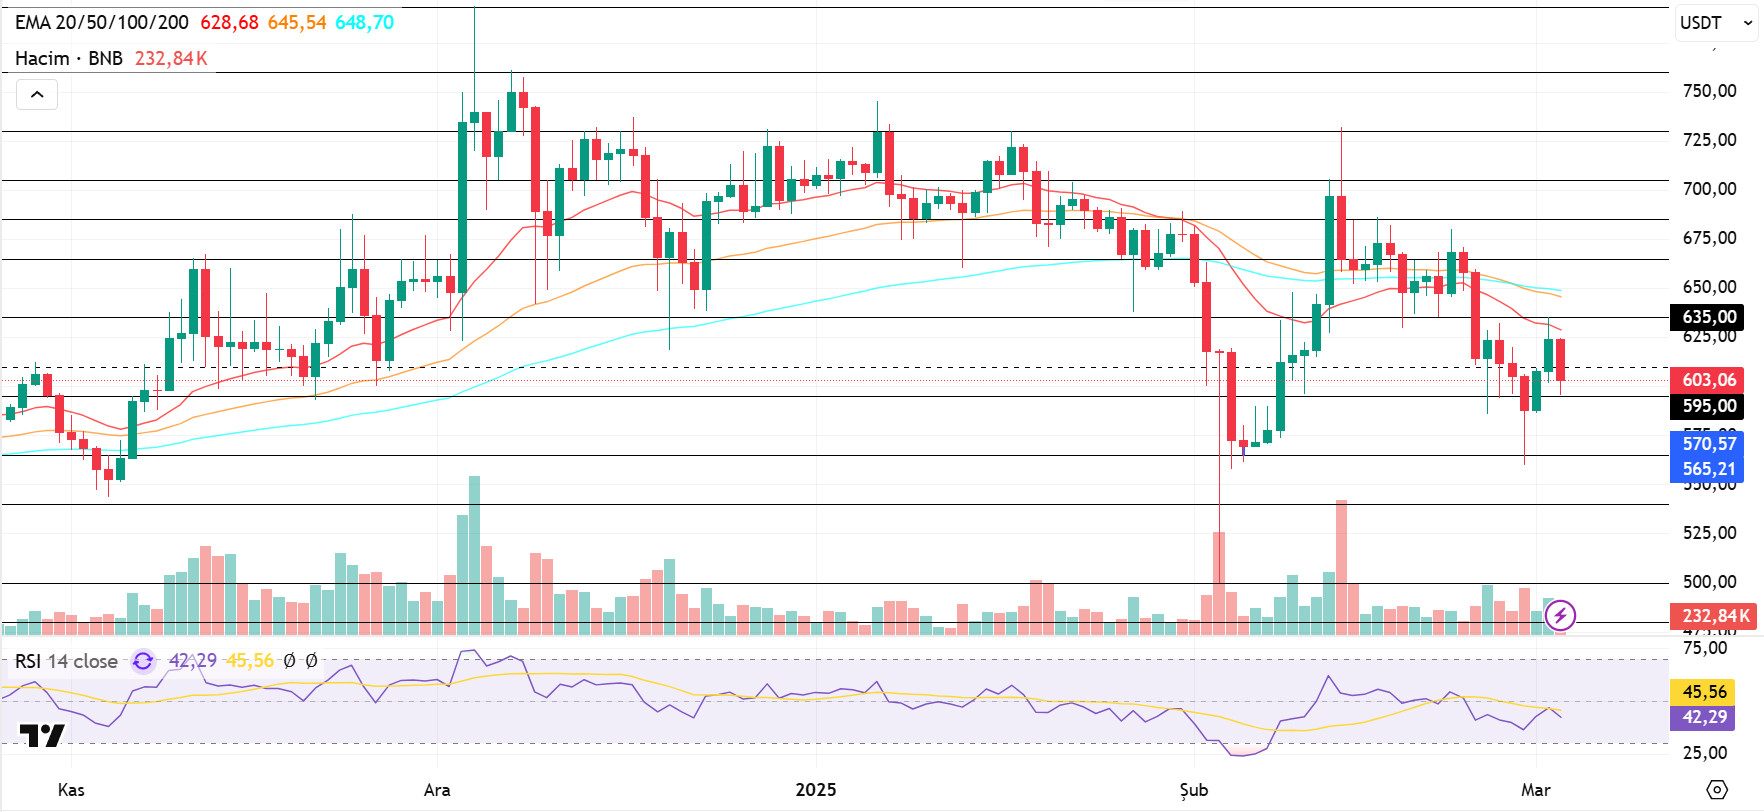
At the beginning of last week (Monday, February 24), BNB/USDT, which was slightly pressured by the resistance at $ 670, closed the week below $ 665. Continuing its negative momentum in the following days, the asset fell towards the $565 level. However, it saw some support at this level, limiting its retreat momentum.
The asset, which showed a limited decline at the start of the new week, is moving in the range of $595 – $635. Moreover, BNB/USDT is trading below the
(EMA 20: Red line, EMA 50: Orange line and EMA 100: Blue line) levels, maintaining its short-term negative outlook.
Volume indicators have been low over the past week, which has been a negative factor in the direction of the asset. In this case, positive strong trading volume is needed for the price to gain bullish momentum as of the new week. The RSI indicator moved below the 50 level in line with the price movements. The fact that the RSI remains below this level indicates that sell-side movements may continue.
If the negative momentum observed at the beginning of the new week continues, the price is expected to fall to 595 dollars. If the $ 595 level is broken down, there is a possibility that it may fall towards $ 565 and $ 540, respectively. On the other hand, if support is encountered at the $ 595 level, the price is likely to rise to $ 635 again. If the $ 685 level is broken upwards, the $ 665 and $ 685 levels will be monitored as new resistance zones.
Supports 595 – 565 – 540
Resistances 635 – 665 – 685
ADA/USDT
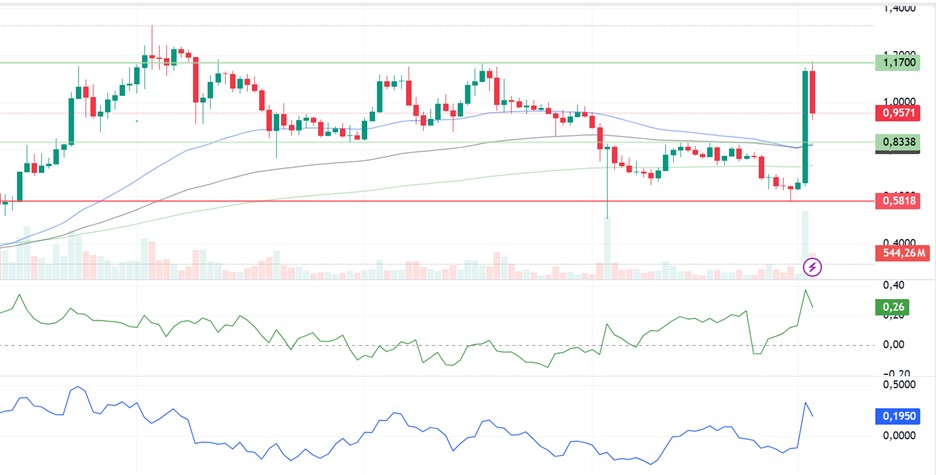
The price of ADA surged by over 60% after Donald Trump hinted that crypto would-be part of his strategic reserves. This means that the US government could spend millions of dollars to acquire the coins. ADA has risen 30% since last week to 0.9644. With ADA’s ETF approvals coming, it is expected to strengthen the overall ecosystem structure, positively impacting community trust and investor interest in the long run.
In the technical analysis of ADA, data from the CMF (Chaikin Money Flow) oscillator reveals that compared to the previous week, the buying pressure was replaced by selling pressure. As of March 2, the selling pressure created by market conditions was replaced by bullishness. Momentum suggests that this uptrend may weaken and give way to a downtrend in the short term. Currently, the price is below the 50 EMA (Blue Line) and 100 EMA (Black Line). This suggests that the market is likely to remain sideways for some time. If the price stays above the $1.1700 level, it could change the trend direction and approach bullish. In this case, it may test the $1.3186 resistance level with the rise of the ADA. In a possible volatility scenario, in case ADA’s price falls, the
200 EMA (Green Line) may retest the $0.7333 support level and the $0.6444 support level. In case these support levels are broken, the fall may deepen.
Supports: 0.7333 – 0.6444 – 0.5902
Resistances: 1.1700 – 1.3186 – 1.3286
LEGAL NOTICE
The investment information, comments and recommendations contained in this document do not constitute investment advisory services. Investment advisory services are provided by authorized institutions on a personal basis, taking into account the risk and return preferences of individuals. The comments and recommendations contained in this document are of a general type. These recommendations may not be suitable for your financial situation and risk and return preferences. Therefore, making an investment decision based solely on the information contained in this document may not result in results that are in line with your expectations.

