
TECHNICAL ANALYSIS
BTC/USDT
The Trump administration’s determination on tariff policies draws attention. While US President Donald Trump stated that he will not step back on tariffs imposed on Canada and Mexico, US Secretary of Commerce Howard Lutnick stated that a compromise could be found between the parties. In the crypto markets, Japan-based Metaplanet announced that it purchased 497 BTC, bringing its total assets to 2,888 BTC. On the other hand, US Bitcoin spot ETFs saw a net outflow of $ 143 million.
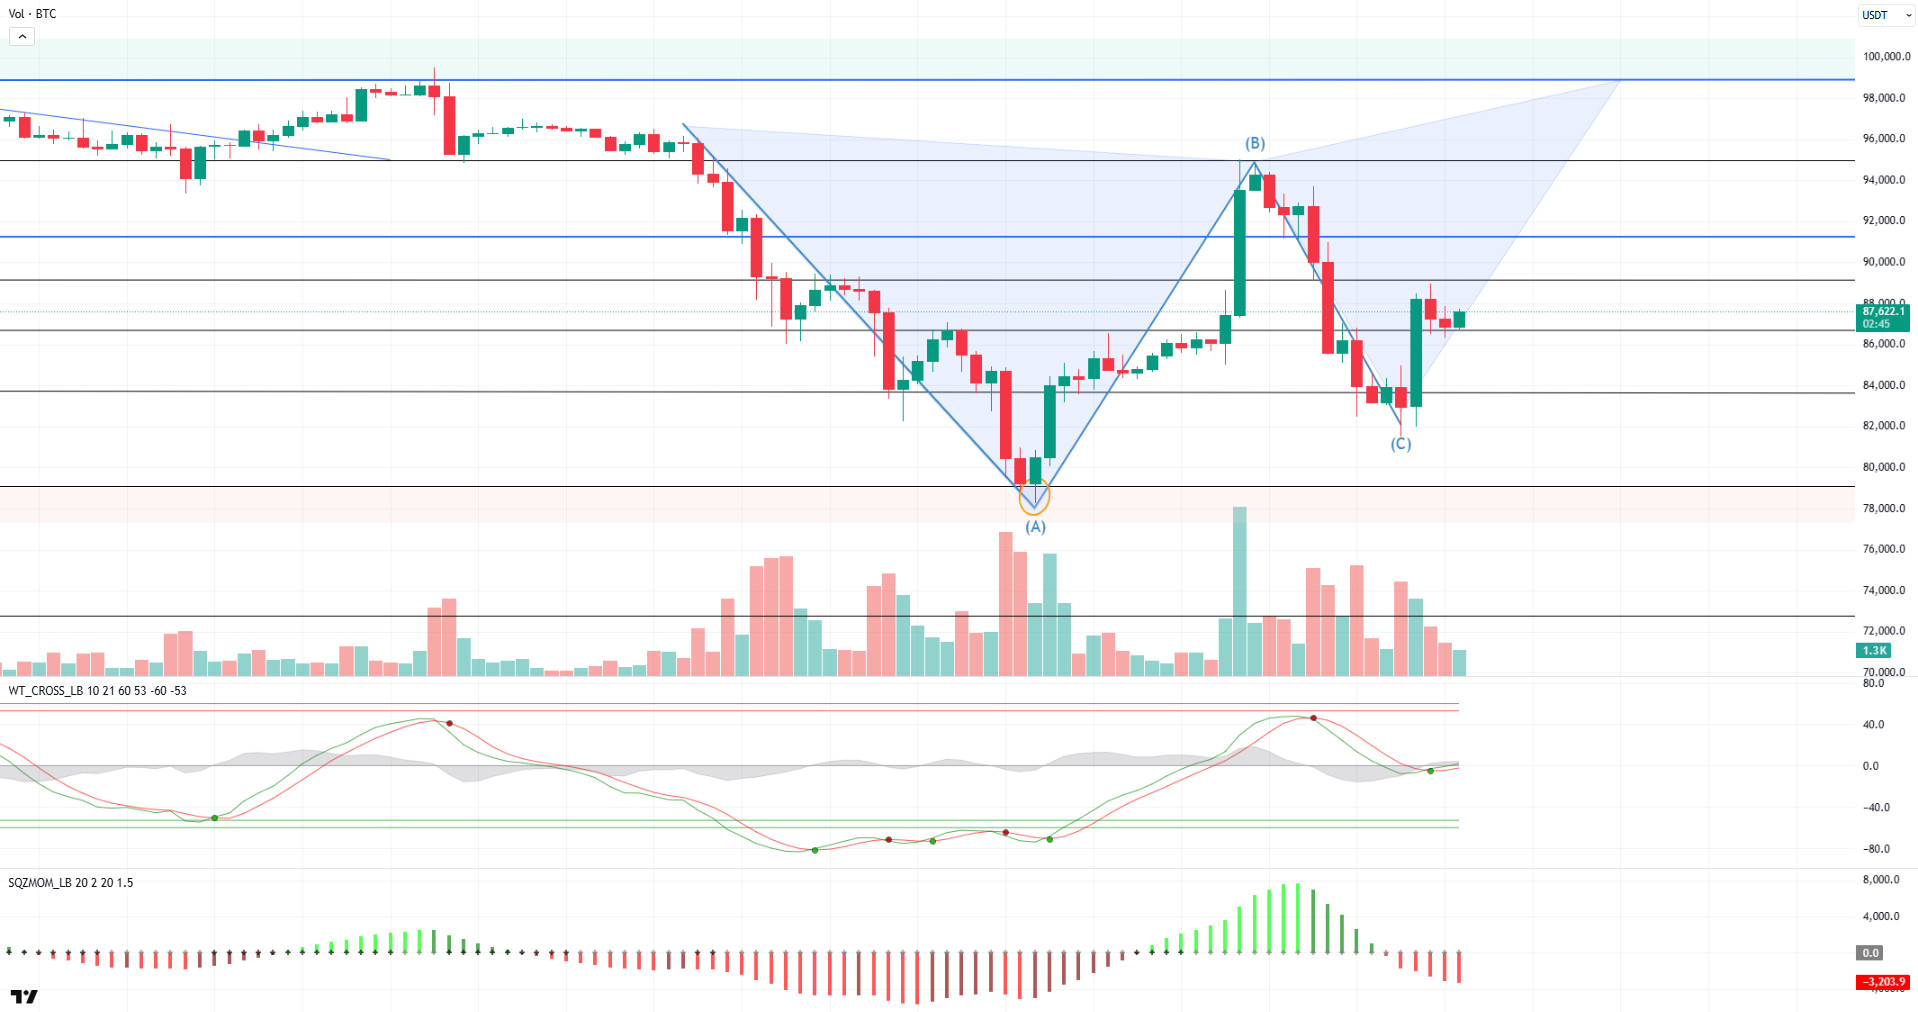
Looking at the technical outlook, BTC occasionally dipped below the 83,500 support and tested the 82,000 levels yesterday but then made a strong recovery. In previous analyses, we noted that if the price reaches the 80,000 level, we will follow a double bottom pattern, while pricing above 83,500 will follow a butterfly pattern. Accordingly, BTC’s test of the 88,000 level from the 82,000 level on a single 4-hour candle provided confirmation of the butterfly pattern. Currently trading at 87,500, BTC’s technical oscillators started generating buy signals before reaching the oversold zone. This indicates that the risk appetite in the market has increased slightly, while momentum indicators are still weak. In order for the upward movement to continue, closes above the 87,000 level are important. In case of persistence above this level, the 89,000-resistance level may come to the fore and allow BTC to continue its uptrend. In a possible pullback scenario, the 86,500 level will be followed as a support point.
Supports 86,500 – 83,500 – 80,000
Resistances 89,000 – 90,400 – 92,800
ETH/USDT
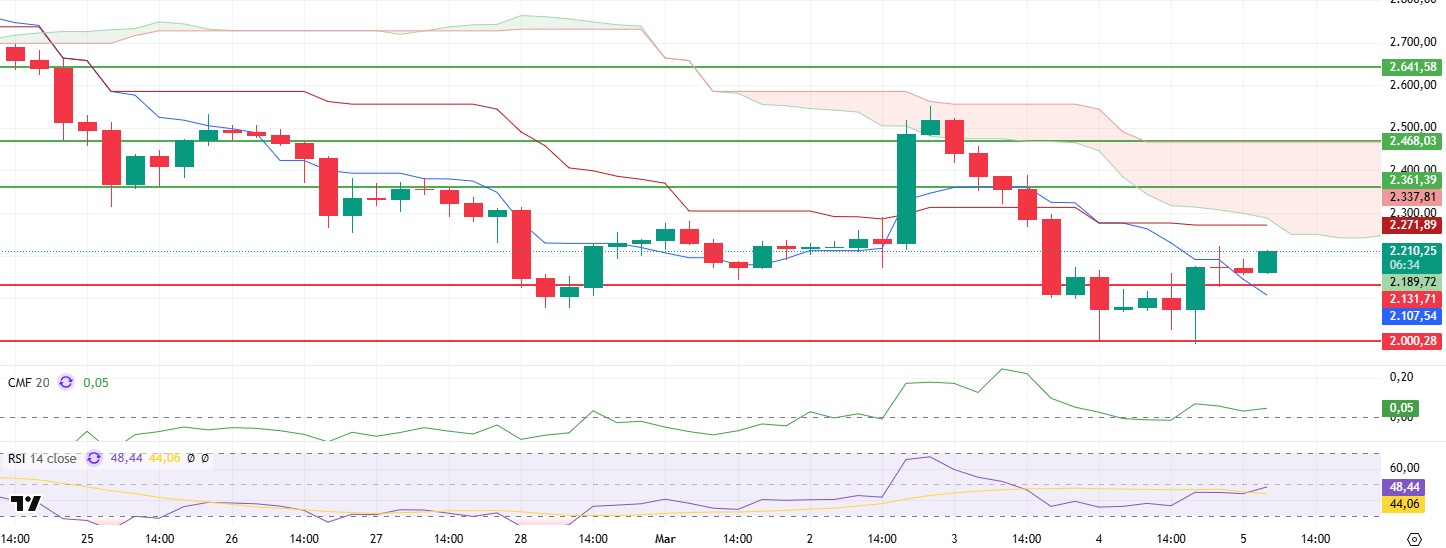
Yesterday evening, ETH dipped below the $2,000 level. However, thanks to the strong volume of purchases from this region, it quickly recovered and managed to rise above the support level again. ETH, which exceeded the $ 2,131 level with the effect of a slight rise in global markets, is currently pricing above the $ 2,200 level.
Technical indicators are giving positive signals that the uptrend may continue. The Relative Strength Index (RSI) gained upside momentum by moving above the based MA line. This suggests that buying appetite is increasing and the positive outlook is strengthening. The price exceeding the tenkan level on the Ichimoku indicator also stands out as another factor supporting the bullish trend. The Chaikin Money Flow (CMF) indicator, on the other hand, continues its upward movement with the support from the zero line, signaling an increase in liquidity entering the market.
In sum, the regain of the $2,131 level and the positive outlook on the indicators suggest that the uptrend may continue. Notably, a breach of the kumo cloud resistance at $2,241 could push the price higher towards the $2,361 and $2,468 levels respectively. However, a loss of the $2,131 support could lead the price to retrace back towards the $2,000 levels.
Supports 2,131 – 2,000 – 1,907
Resistances 2,361 – 2,468 – 2,641
XRP/USDT
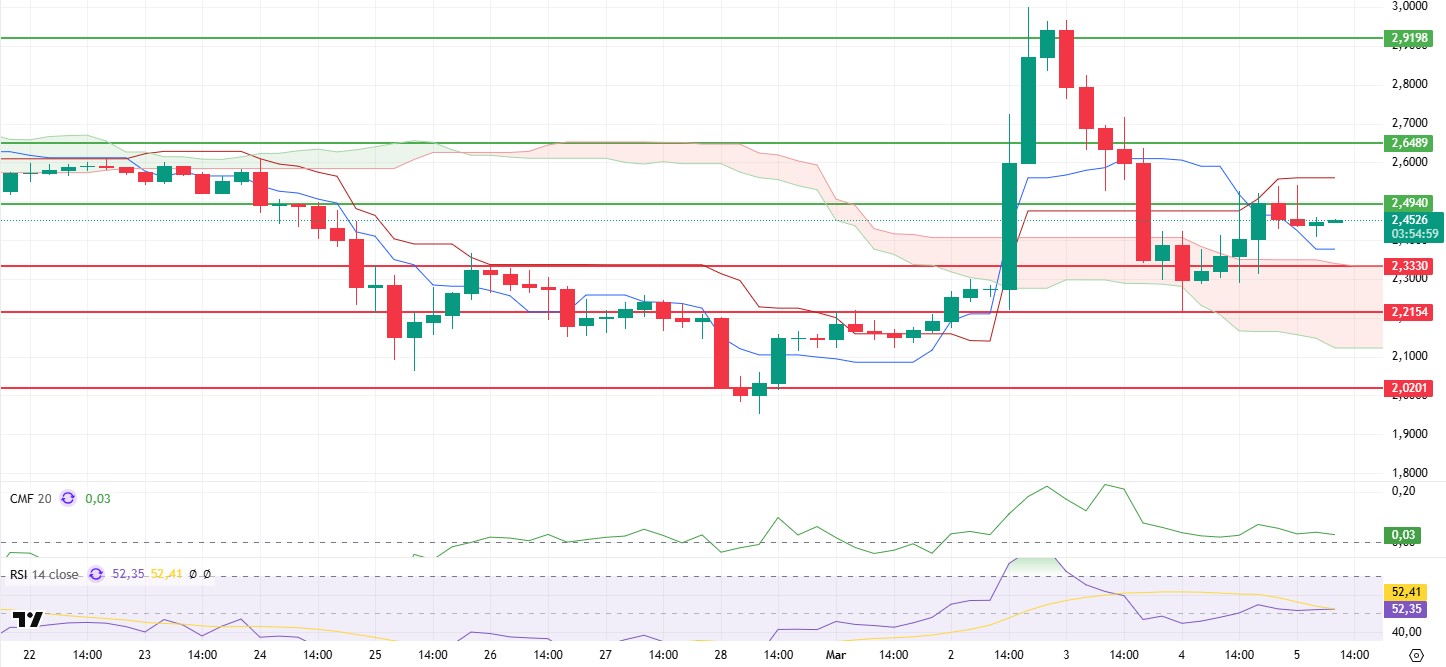
XRP managed to rise as high as $2.49 yesterday evening with the recovery in the crypto markets. However, serious sell orders from this region caused the rise to slow down.
When technical indicators are analyzed, XRP, which managed to rise above the tenkan level again, maintains its positive outlook with the rise of the kumo cloud. The horizontal movements of the Chaikin Money Flow (CMF) indicator in the positive area indicate that the buyer-seller balance has started to form.
As a result, provided that the XRP price does not violate the zone between the tenkan level of $ 2.37 and the kumo cloud resistance of $ 2.33, the rises can be expected to continue. Violation of this zone may bring pullbacks to the $2.21 level again.
Supports 2.3307 – 2.2154 – 2.0201
Resistances 2.4940 – 2.6489 – 2.9198
SOL/USDT
Sol Global completed the strategic reorganization of non-Solana assets and removed all mortgaged debt. On the other hand, the bankruptcy court limited FTX’s weekly SOL liquidation to $50 million and later increased it to $100 million. However, FTX/Alameda investment wallets received a significant transfer of $430 million in Solana.
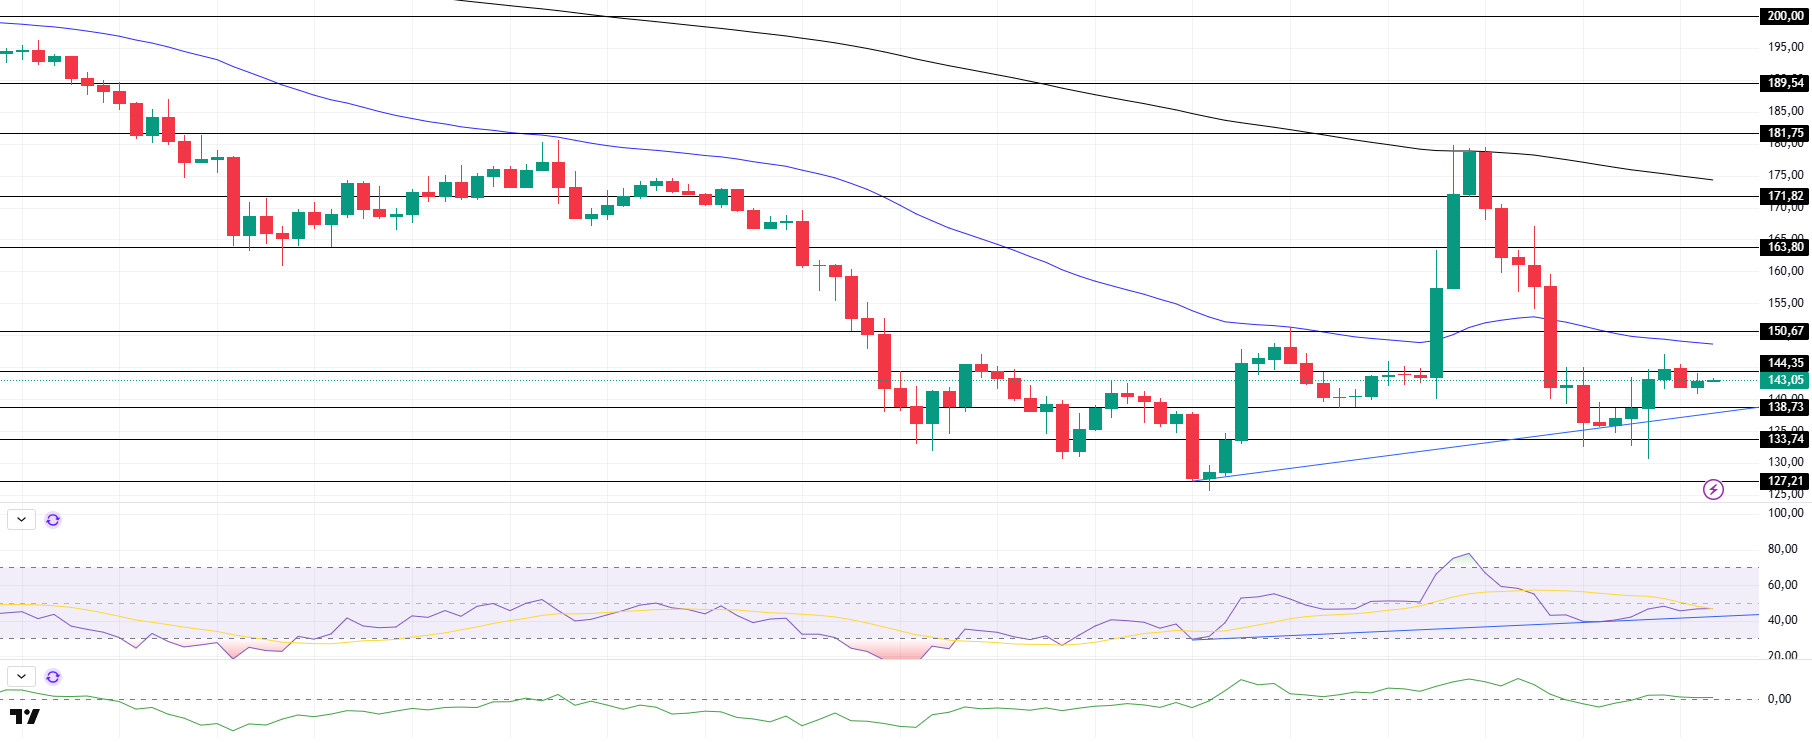
SOL was slightly up on the optimistic mood in the market. The asset rose about 5.5%, accelerating from the support of the uptrend that started on February 28. On the 4-hour timeframe, the 50 EMA (Blue Line) continues to be below the 200 EMA (Black Line). This could deepen the decline further in the medium term. At the same time, the price started moving below the two moving averages again. The Chaikin Money Flow (CMF)20 indicator moved into positive territory. However, the decline in volume may further increase money outflows. However, the Relative Strength Index (RSI)14 indicator rose and accelerated from the mid-level of the negative zone to the neutral zone. At the same time, RSI maintains its uptrend from February 28. The $150.67 level stands out as a very strong resistance point in the rises driven by both the upcoming macroeconomic data and the news in the Solana ecosystem. If it breaks here, the rise may continue. In case of retracements for the opposite reasons or due to profit sales, the support level of $ 133.74 can be triggered. If the price comes to these support levels, a potential bullish opportunity may arise if momentum increases.
Supports 138.73 – 133.74 – 127.21
Resistances 144.35 – 150.67 – 163.80
DOGE/USDT
According to a new Bloomberg report, the SEC is offering its employees a $50,000 incentive to resign or retire. The regulator’s offer to employees comes at a time when the DOGE’s mass layoff of federal employees in an effort to cut government spending is on the agenda.
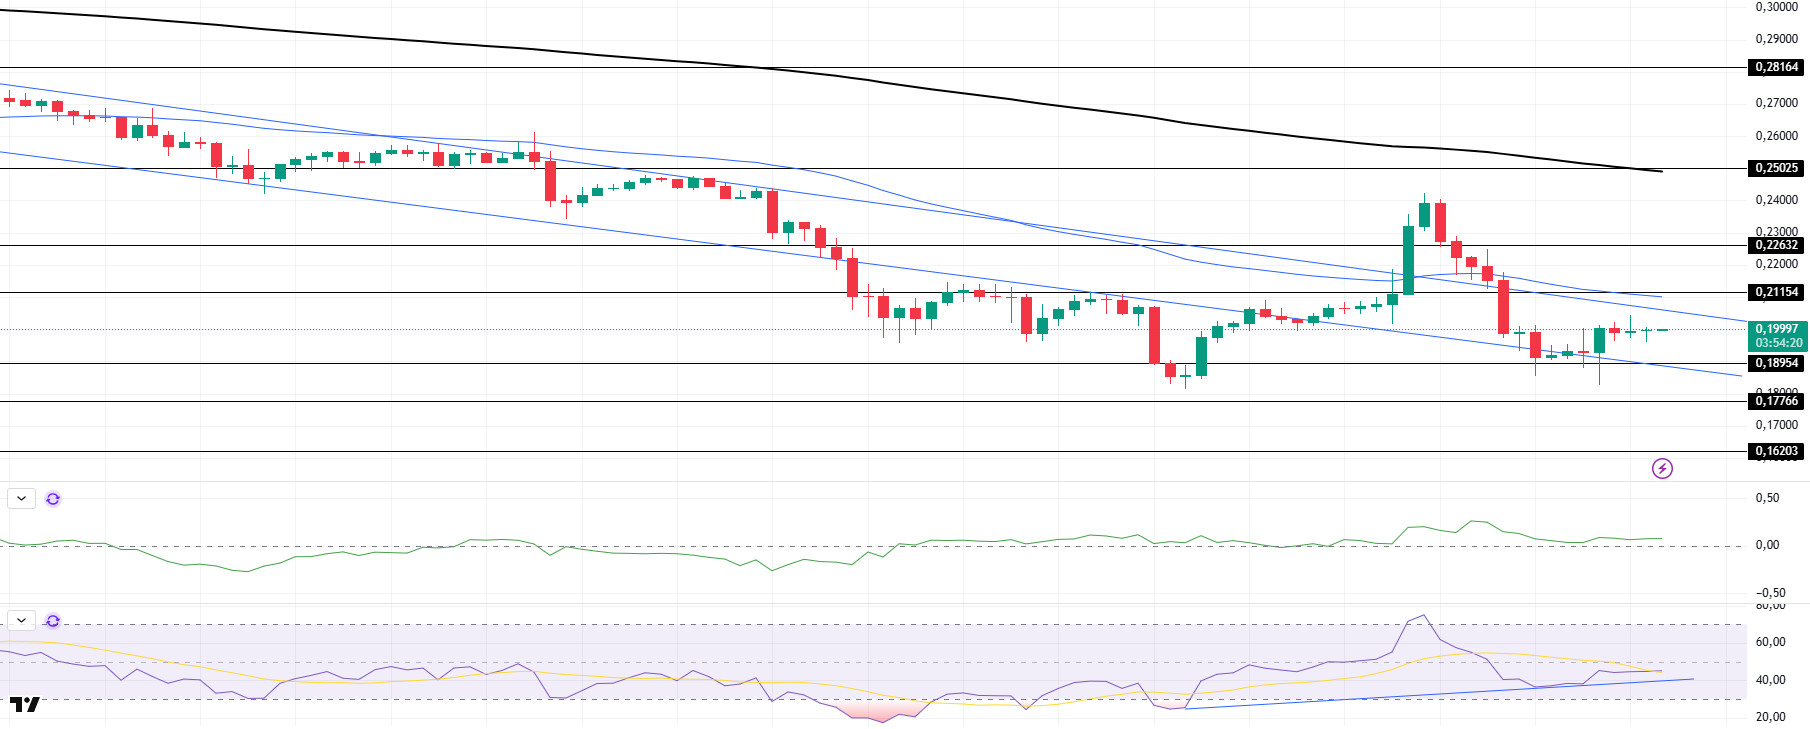
DOGE has kept pace with the market and has risen slightly. The price broke the bottom of the downtrend three times, testing it as resistance, and started pricing back inside the downtrend that started on February 15. On the 4-hour timeframe, the 50 EMA (Blue Line) is below the 200 EMA (Black Line). This could mean that the decline could deepen in the medium term. However, the price is below two moving averages. However, the difference between the two moving averages is large, which increases the probability that DOGE will rise. The Chaikin Money Flow (CMF)20 indicator is in positive territory. However, the negative daily volume may reduce money inflows. On the other hand, Relative Strength Index (RSI)14 is at the middle level of the negative zone. At the same time, the uptrend in RSI, which started on February 28, continues. The $0.21154 level stands out as a very strong resistance point in the rises due to political reasons, macroeconomic data and innovations in the DOGE coin. In case of possible pullbacks due to political, macroeconomic reasons or negativities in the ecosystem, the base level of the trend, the $ 0.18954 level, is an important support. If the price reaches these support levels, a potential bullish opportunity may arise if momentum increases.
Supports 0.18954 – 0.17766 – 0.16203
Resistances 0.21154 – 0.22632 – 0.25025
LEGAL NOTICE
The investment information, comments and recommendations contained herein do not constitute investment advice. Investment advisory services are provided individually by authorized institutions taking into account the risk and return preferences of individuals. The comments and recommendations contained herein are of a general nature. These recommendations may not be suitable for your financial situation and risk and return preferences. Therefore, making an investment decision based solely on the information contained herein may not produce results in line with your expectations.

