
Technical Analysis
BTC/USDT
The Trump administration’s Bitcoin reserve strategy continues to set the agenda in the crypto markets. White House Chief Cryptocurrency Officer David Sacks announced that President Donald Trump signed an executive order to create a strategic Bitcoin reserve. This reserve will be funded with Bitcoins seized through civil and criminal asset forfeiture, and the government will not sell these BTC. Furthermore, the Secretaries of Treasury and Commerce will be authorized to develop strategies to acquire more Bitcoins through budget-neutral means. On the other hand, the Texas Senate passed the SB 21 bill, approving a portion of public funds to be invested in Bitcoin. Today, eyes will be on the crypto committee meeting reserve system details and Trump’s statements.
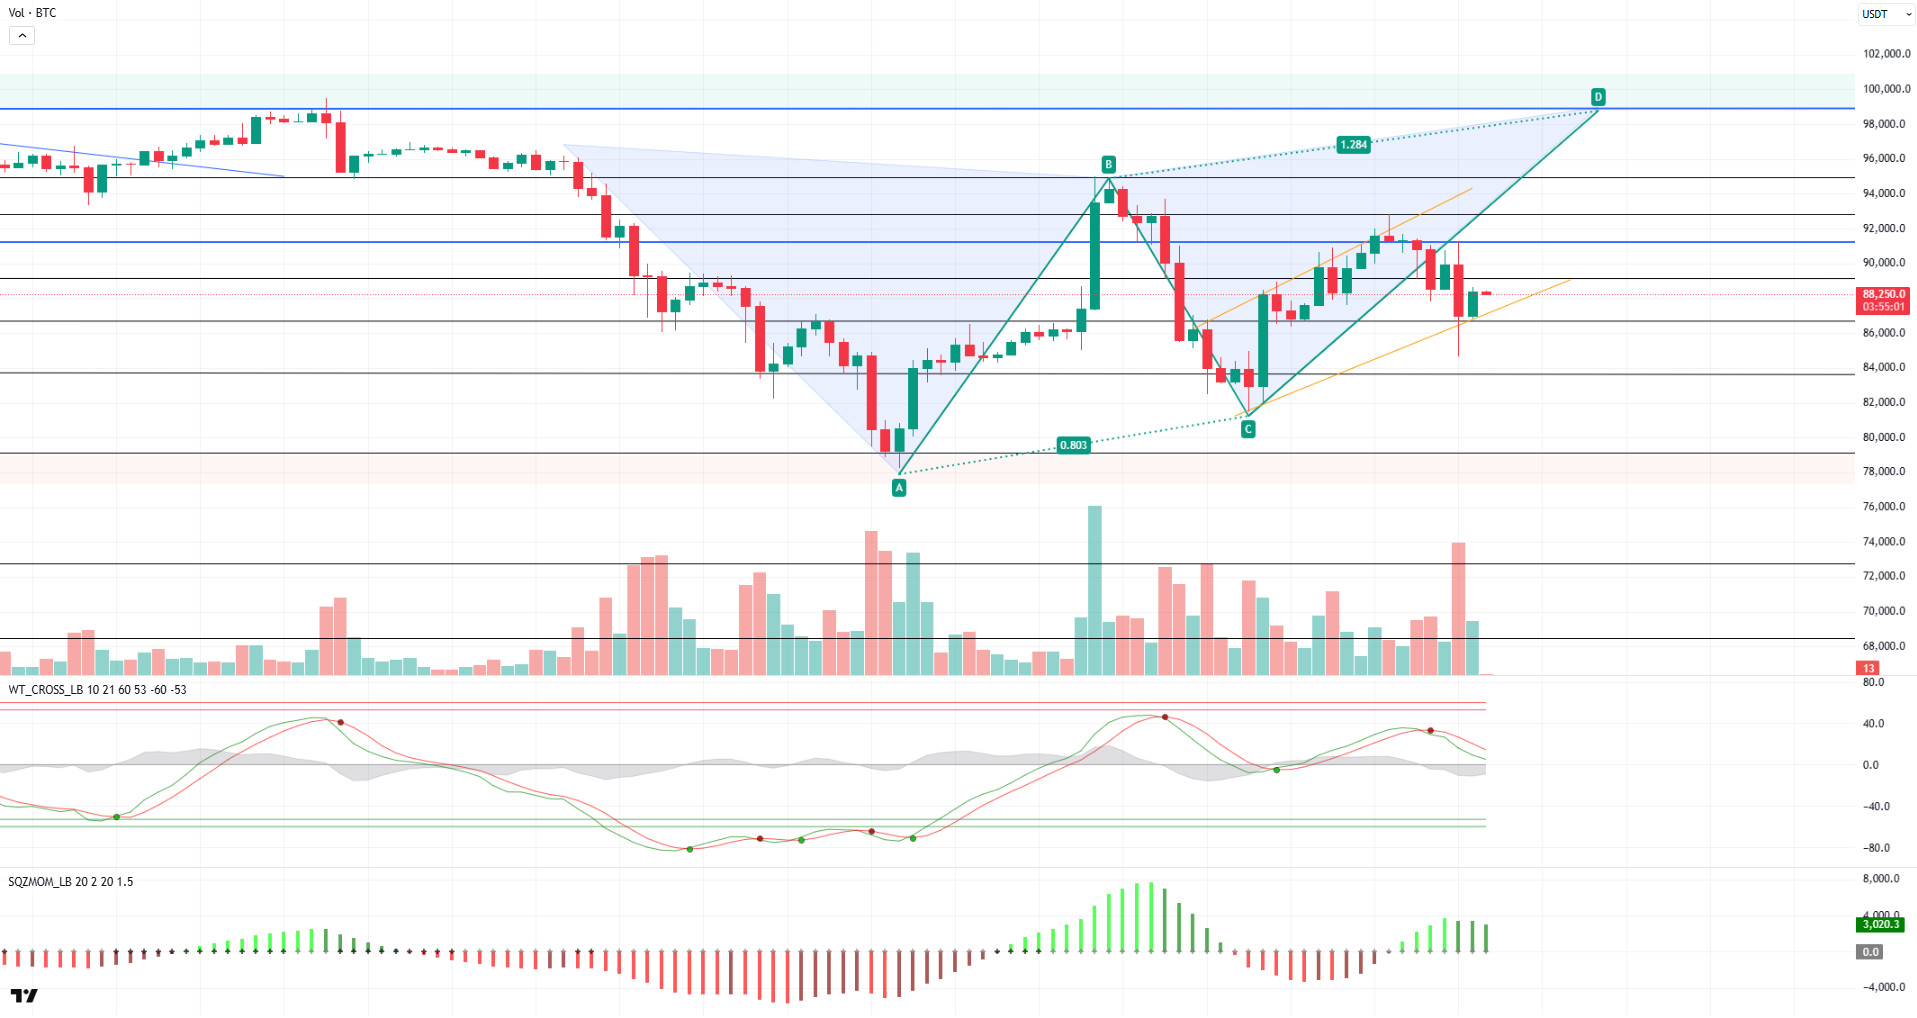
Looking at the technical outlook, BTC, which forms an ascending trend channel, experienced a sharp retracement after losing the 89,000 level yesterday and fell below the 85,000 level. However, with strong buying from this level, BTC quickly recovered and managed to stay within the rising trend channel. Currently trading at 88,300, BTC is trying to maintain its uptrend structure. When we look at the technical indicators, oscillators are neutral on the hourly charts while maintaining a sell signal on the 4-hour and daily charts. It is noteworthy that momentum indicators, which gained momentum yesterday, weakened again, which may cause the upward movement of the price to remain limited. If the price continues to hold within the uptrend channel, it can be expected to close above 89,000 and then 90,400. If this scenario materializes, point D in the pattern will remain the main target. In case the decline deepens, the 86,500 level will be followed as a critical support point. A downside break of this level may cause the uptrend structure to break down and the selling pressure to deepen further.
Supports: 86,500 -89,000 – 90,400
Resistances 89,000 – 90,400 – 92,800
ETH/USDT
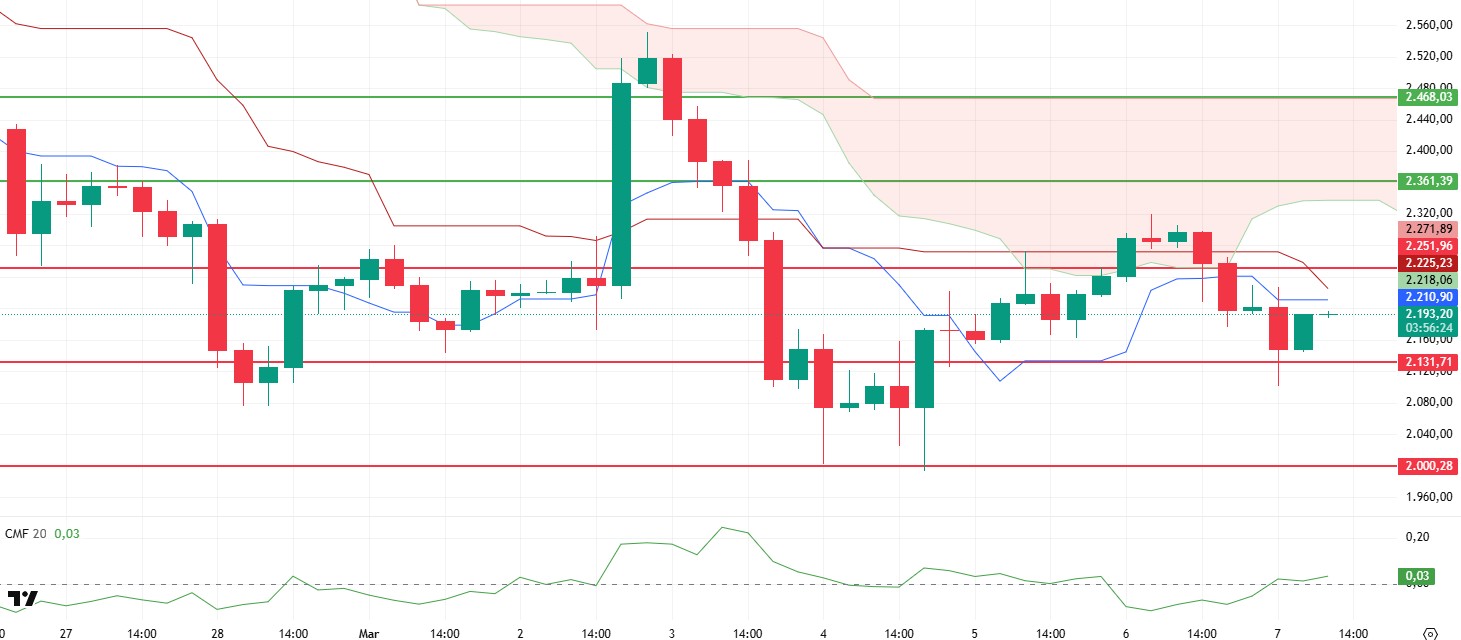
ETH caused volatility in the markets yesterday evening when US President Donald Trump signed an executive order to create a strategic Bitcoin reserve based on seized Bitcoin assets but announced that no additional purchases would be made. With this development, ETH momentarily violated the critical $ 2,131 support level and fell as low as $ 2,100. However, with the purchases from this region, it managed to recover and rise above the $ 2,131 level again. Technical indicators show that price movements are in a positive plane.
The Ichimoku indicator shows that the price has lost the kijun and tankan levels as well as the kumo cloud. However, the widening gap between the tankan and kijun levels may indicate a continuation of the positive trend in the current outlook. This suggests that although the market is searching for direction, the possibility of a recovery is on the table. In addition, the Chaikin Money Flow (CMF) indicator shifted into positive territory during the price decline, indicating that liquidity inflows to the market have increased and this can be considered as a positive development.
Current price action and technical indicators suggest that ETH may continue its upward movement. In particular, it should be noted that the non-farm payrolls data to be released in the evening hours today and the speeches at the White House Digital Asset Summit have the potential to increase volatility in the markets. While ETH’s holding above the $2,131 level could support continued upward movements, daily closes below this level could pave the way for the price to retest the $2,000 level.
Supports 2,131 – 2,000 – 1,910
Resistances 2,251 – 2,361 – 2,468
XRP/USDT
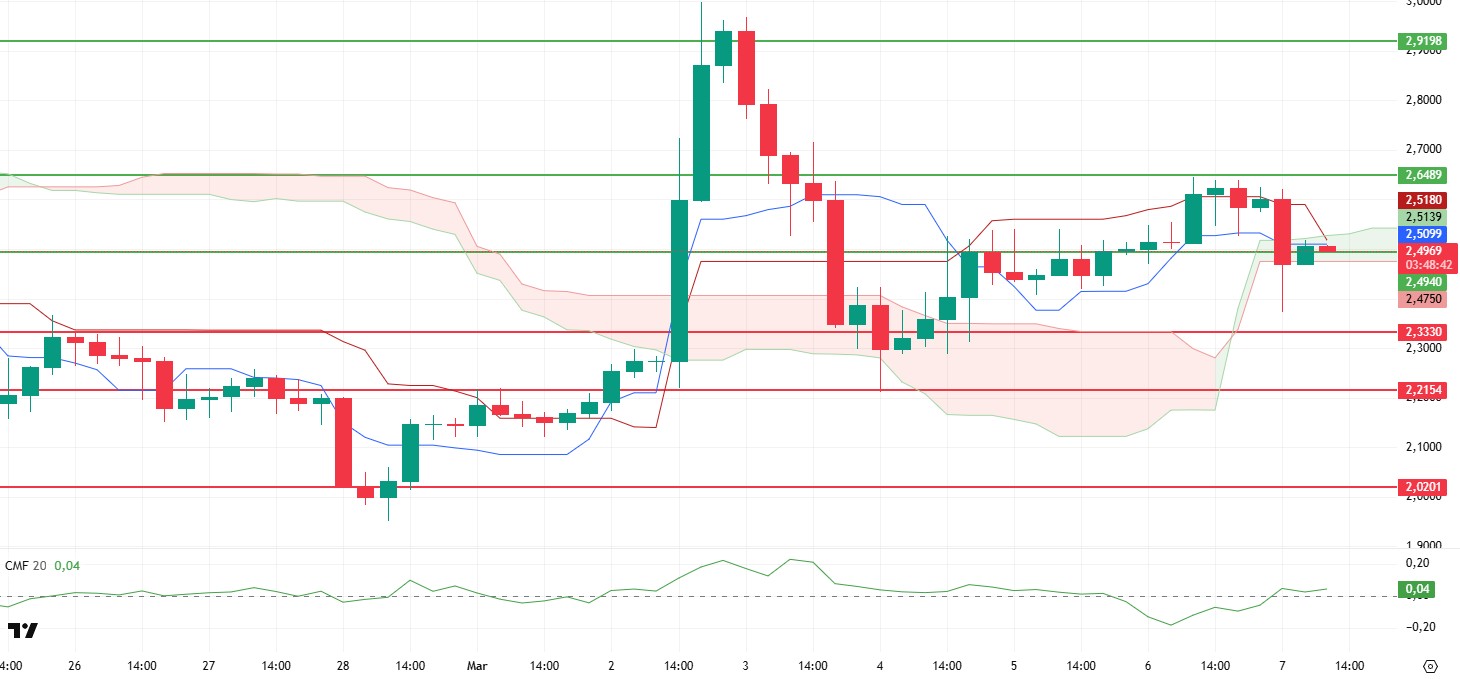
XRP With yesterday’s developments, fell sharply from the $ 2.61 level, violated the $ 2.49 support and fell to $ 2.38. There is no change in the technical outlook for XRP, which managed to rise above the $ 2.49 level again with the support it received from this level.
With this price action, the fact that the kumo cloud was not lost and the tenkan and kijun levels converged indicates that the positive outlook continues. The Chaikin Money Flow (CMF) indicator entering the positive area and continuing its upward movement also supports the positive outlook.
It can be expected that the price may continue its upward movement provided that it does not violate the $ 2.49 level during the day. Closures below the $2.49 level, on the other hand, may affect the positive outlook and bring pullbacks to the $2.33 level.
Supports 2.4940 – 2.3307 – 2.2154
Resistances 2.6489 – 2.9198 – 3.1493
SOL/USDT
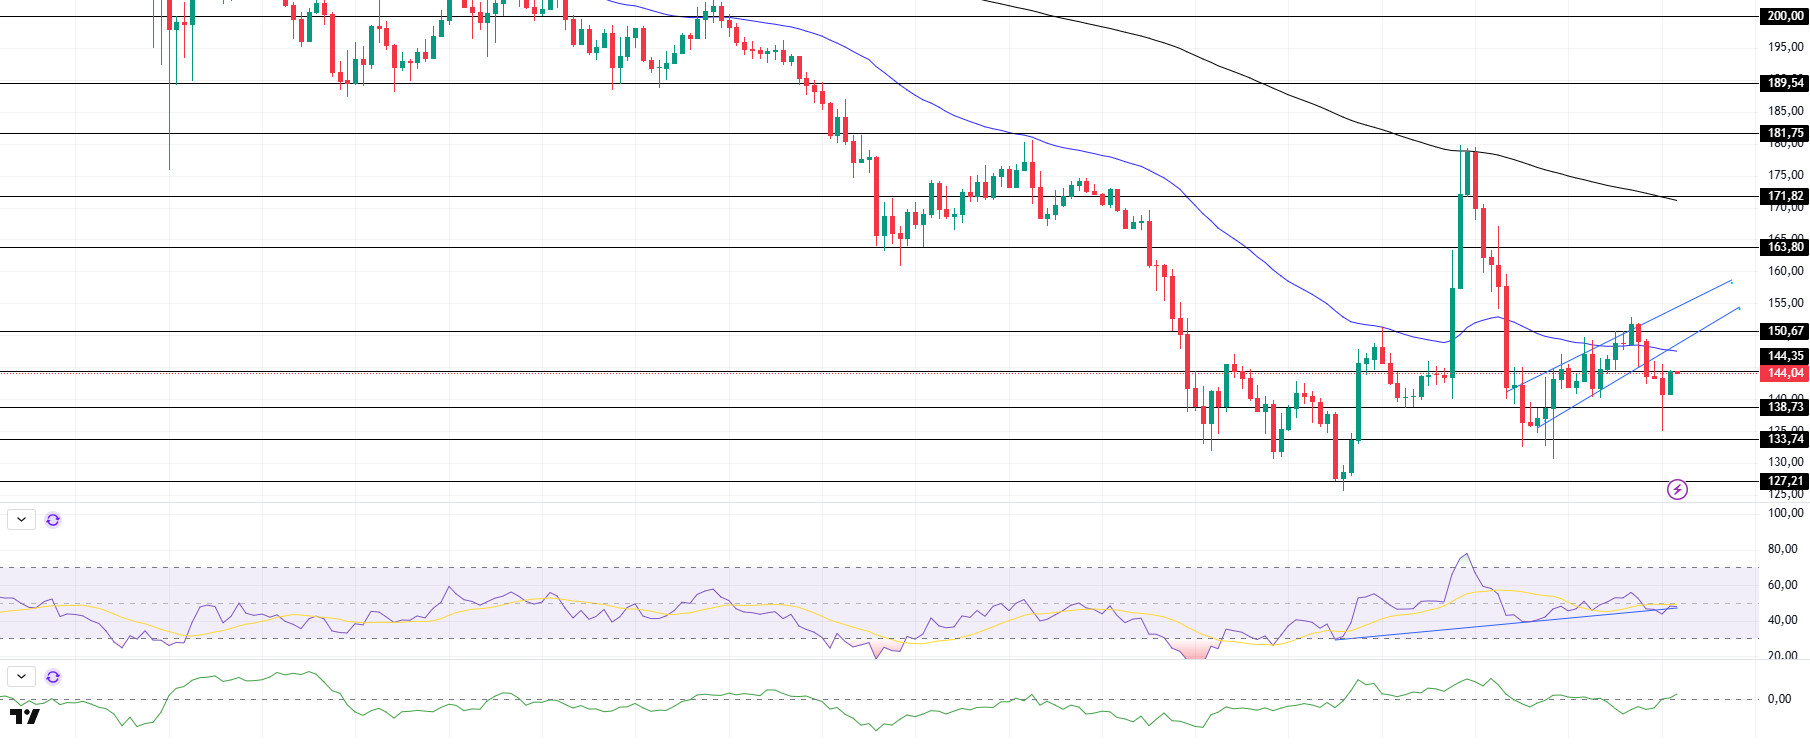
SOL fell, keeping pace with the cryptocurrency market. It broke the wedge formation to the downside and executed the pattern. On the 4-hour timeframe, the 50 EMA (Blue Line) continues to be below the 200 EMA (Black Line). This could deepen the decline further in the medium term. At the same time, the price started moving below the two moving averages. The Chaikin Money Flow (CMF)20 indicator moved into the neutral zone. An increase in volume may increase money inflows. However, the Relative Strength Index (RSI)14 indicator approached the neutral zone. At the same time, although the RSI broke the uptrend on February 28, it managed to position above it again. The $150.67 level stands out as a very strong resistance point in the rises driven by both the upcoming macroeconomic data and the news in the Solana ecosystem. If it breaks here, the rise may continue. In case of retracements for the opposite reasons or due to profit sales, the support level of $ 138.73 can be triggered. If the price reaches these support levels, a potential bullish opportunity may arise if momentum increases.
Supports 138.73 – 133.74 – 127.21
Resistances 144.35 – 150.67 – 163.80
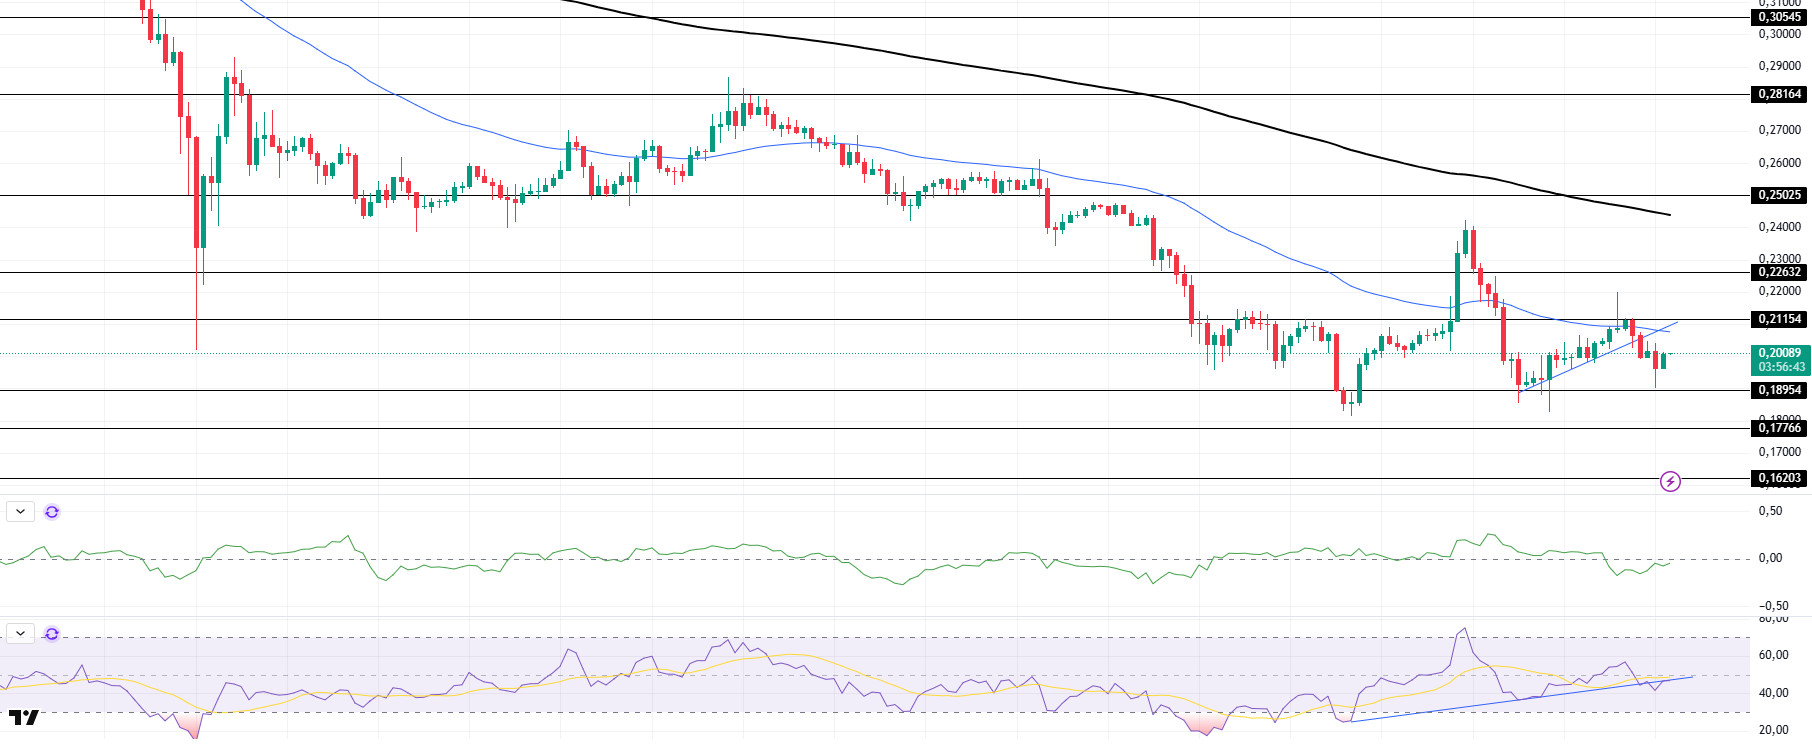
DOGE/USDT
DOGE failed to maintain yesterday’s sideways trend and started to decline. The price failed to stay above the uptrend that started on March 4. On the 4-hour timeframe, the 50 EMA (Blue Line) is below the 200 EMA (Black Line). This could mean that the decline could deepen in the medium term. However, the price started to hover below the two moving averages again. The larger gap between the two moving averages increases the probability that DOGE will rise. The Chaikin Money Flow (CMF)20 indicator is in negative territory. However, the increase in daily volume may increase money inflows and cause CMF to rise. On the other hand, Relative Strength Index (RSI)14 is in negative territory and the RSI is currently testing this as resistance by breaking down the uptrend that started on February 28. The $0.21154 level stands out as a very strong resistance in the uptrend due to political reasons, macroeconomic data and innovations in the DOGE coin. In case of possible pullbacks due to political, macroeconomic reasons or negativities in the ecosystem, the $0.18954 level, which is the base level of the trend, is an important support. If the price reaches these support levels, a potential bullish opportunity may arise if momentum increases.
Supports 0.18954 – 0.17766 – 0.16203
Resistances 0.21154 – 0.22632 – 0.25025
Legal Notice
The investment information, comments and recommendations contained herein do not constitute investment advice. Investment advisory services are provided individually by authorized institutions taking into account the risk and return preferences of individuals. The comments and recommendations contained herein are of a general nature. These recommendations may not be suitable for your financial situation and risk and return preferences. Therefore, making an investment decision based solely on the information contained herein may not produce results in line with your expectations.

