
TECHNICAL ANALYSIS
BTC/USDT
Crypto markets continue to be shaped by macroeconomic data, Trump’s Bitcoin reserve decision and activity in the options market. US Non-Farm Payrolls remained below expectations with 151K, while the unemployment rate came in above expectations at 4.1%. These mixed signals in the labor market are closely monitored for their impact on the Fed’s interest rate policies. On the other hand, Trump’s decision to create a strategic Bitcoin reserve is considered a major move that has the potential to reshape institutional crypto investments. Today evening, eyes will be on the roadmap to be followed at the crypto committee meeting and we can expect increased volatility.
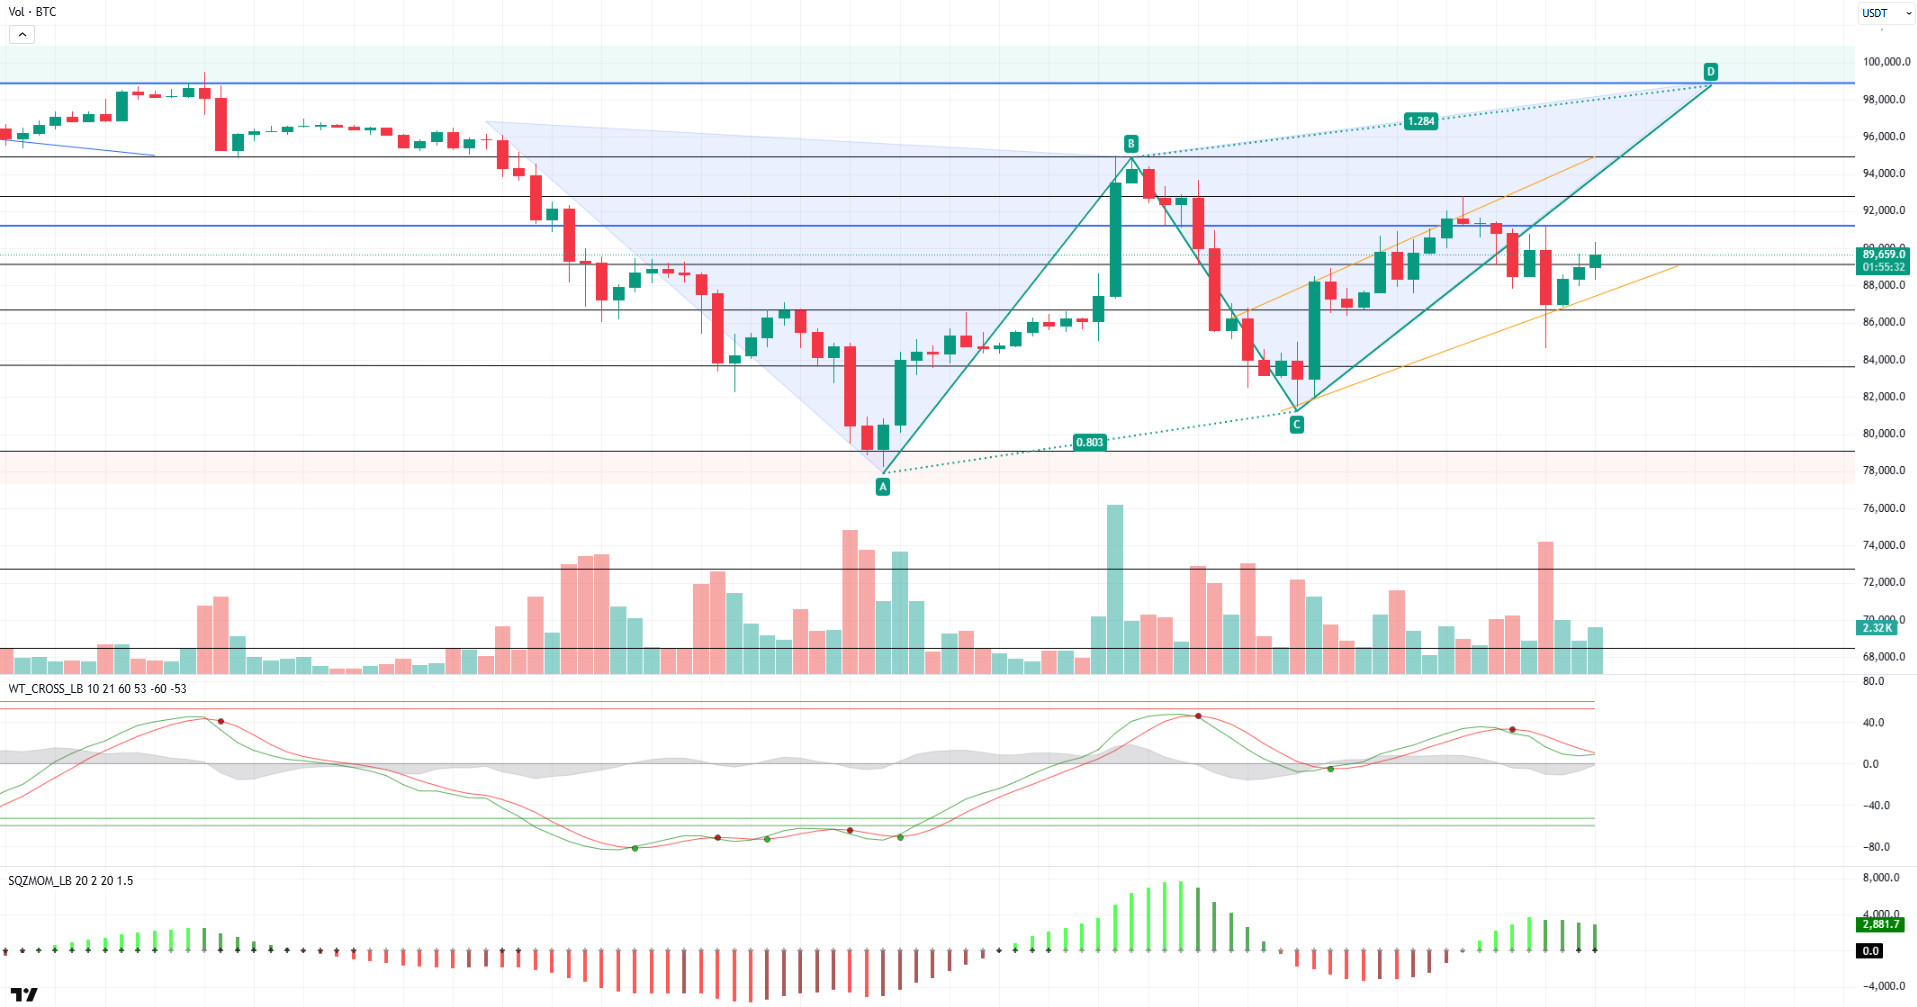
Looking at the technical outlook, BTC continues to move in an uptrend following the macro data. Currently trading at 89,700, technical oscillators are showing a weakening sell signal on the 4-hour charts, but momentum indicators have yet to gain clear momentum. On the weekly liquidation heatmap, the 95,000 level stands out as a major resistance point and there is a heavy accumulation of short positions in this area. If the price continues its upward movement, the first target for BTC will be the 95,000 level. On the other hand, if the expectations for the Trump reserve system are not met or the market prices this development negatively, a break of the lower line of the rising trend channel may put BTC under selling pressure. In this scenario, the first support level would be 86,500. A test below this level could cause BTC to lose its bullish momentum and increase selling pressure.
Supports: 89,000 – 86,500 -89,000
Resistances 90,400 – 92,800 – 95,000
ETH/USDT
ETH followed a horizontal course during the day. The messages at the White House Digital Asset Summit, which will be held this evening, are of critical importance for ETH, which managed to rise above the $ 2,200 level with the recovery in the market after the US Non-Farm Payrolls data came below expectations.
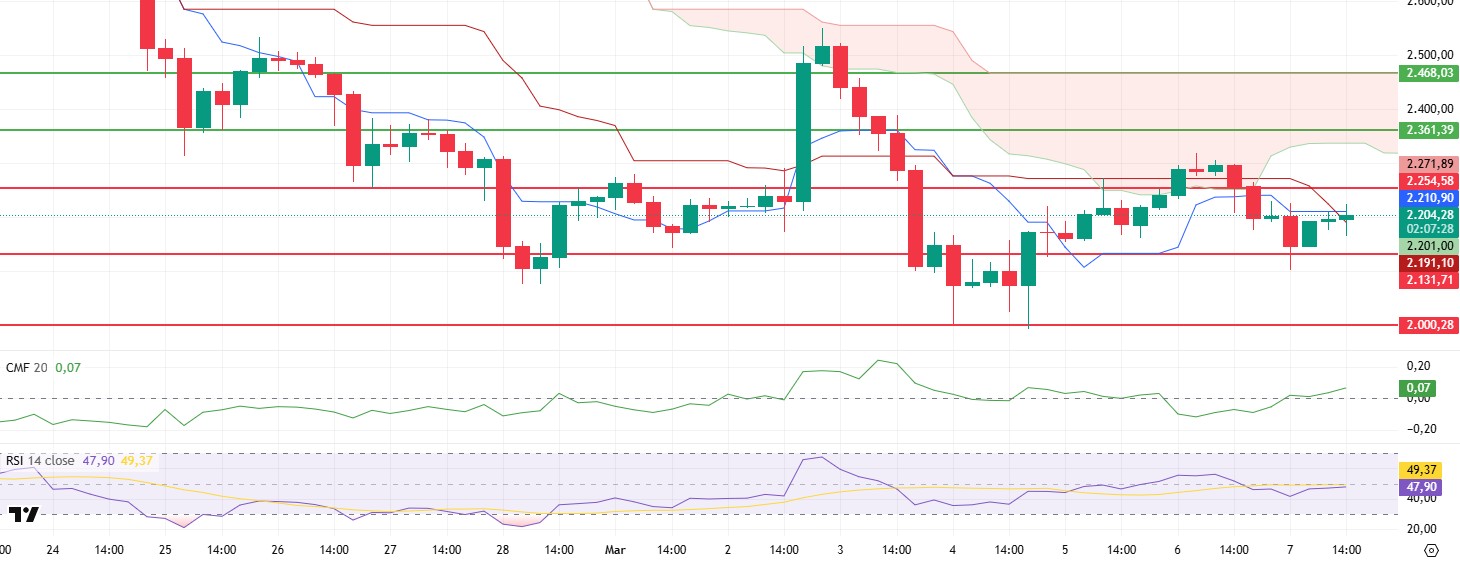
When the Chaikin Money Flow (CMF) indicator continues its upward movement in the positive area and the Cumulative Volume Delta (CVD) data is analyzed, the fact that the sales movement comes mostly from the futures side and the spot side remains strong indicates that the liquidity flow is rising and buyers are dominant over sellers. In the Ichimoku indicator, it is seen that a negative picture prevails with the intersection of tenkan and kijun. However, the fact that the price has exceeded the tenkan and kijun levels can be said that the outlook may become positive again as it exceeds the kumo cloud limit of $ 2,340. The Relative Strength Index (RSI), on the other hand, has risen up to the based MA line and supports the positive outlook by indicating that momentum is increasing.
As a result, it can be said that an intensely positive outlook prevails in technical indicators, remembering that the biggest factor in the price is the messages at the White House Digital Asset Summit. The price’s gain of $ 2,251 and kumo cloud resistance levels of $ 2,340 can be considered as important signals that the rise may continue. The $ 2,131 intermediate support level is an important support level to follow, but the violation of this region may bring bearish movements.
Supports 2,131 – 2,000 – 1,910
Resistances 2,251 – 2,361 – 2,468
XRP/USDT
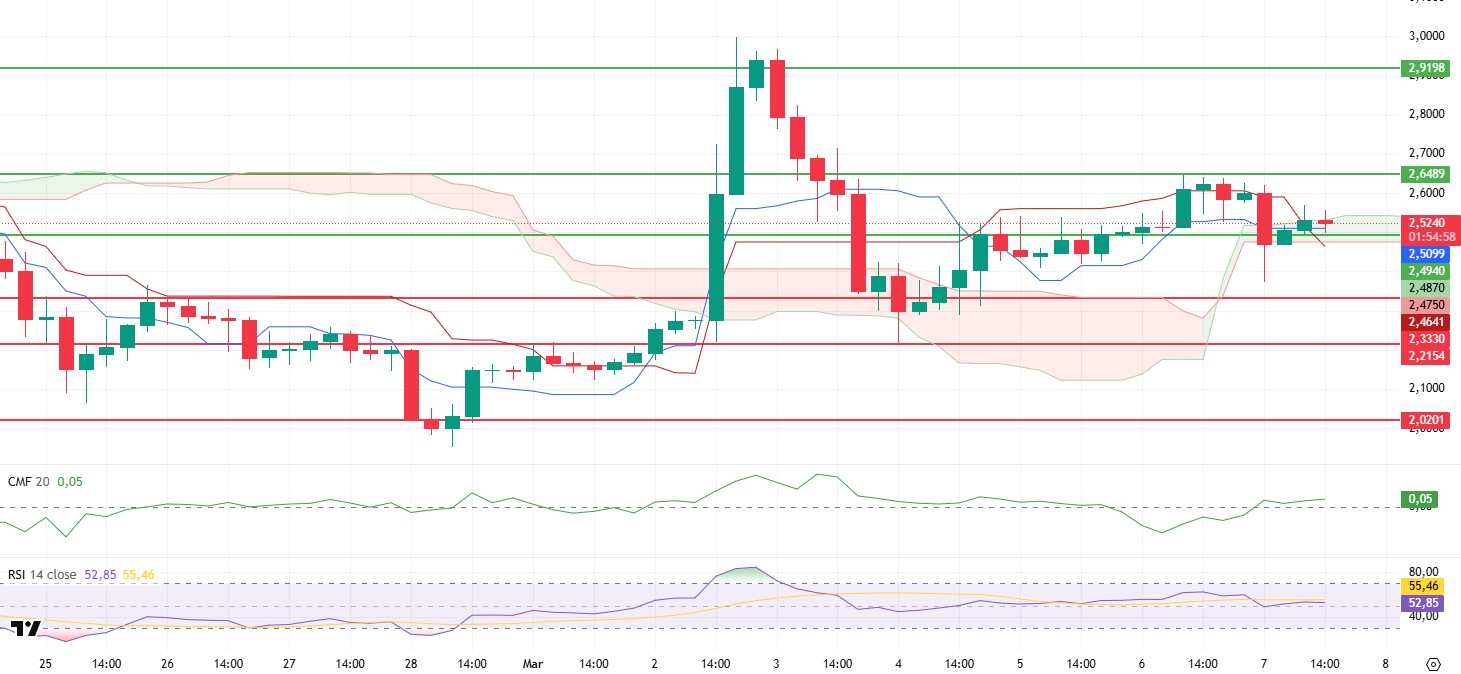
Although XRP tried to rise outside the kumo cloud boundaries during the day, it was rejected from these regions and priced within the cloud boundaries again. Despite these price movements, the persistence above the $ 2.49 level shows that the positive structure for XRP continues.
Chaikin Money Flow (CMF) continues its upward movement in the positive zone, showing that buyers maintain their dominance. In the Ichimoku indicator, it is seen that a buy signal is realized as the tenkan level cuts the kijun level upwards. Closures above the Kumo cloud may make the outlook more bullish.
As a result, high volatility may be seen on the price with Powell’s speech and the crypto summit in the evening. Provided that the price does not close below the $2.49 level, it can be said that the technical outlook supports upward movements. Closes below $2.49 may weaken the momentum and cause the start of a downward trend.
Supports 2.4940 – 2.3307 – 2.2154
Resistances 2.6489 – 2.9198 – 3.1493
SOL/USDT
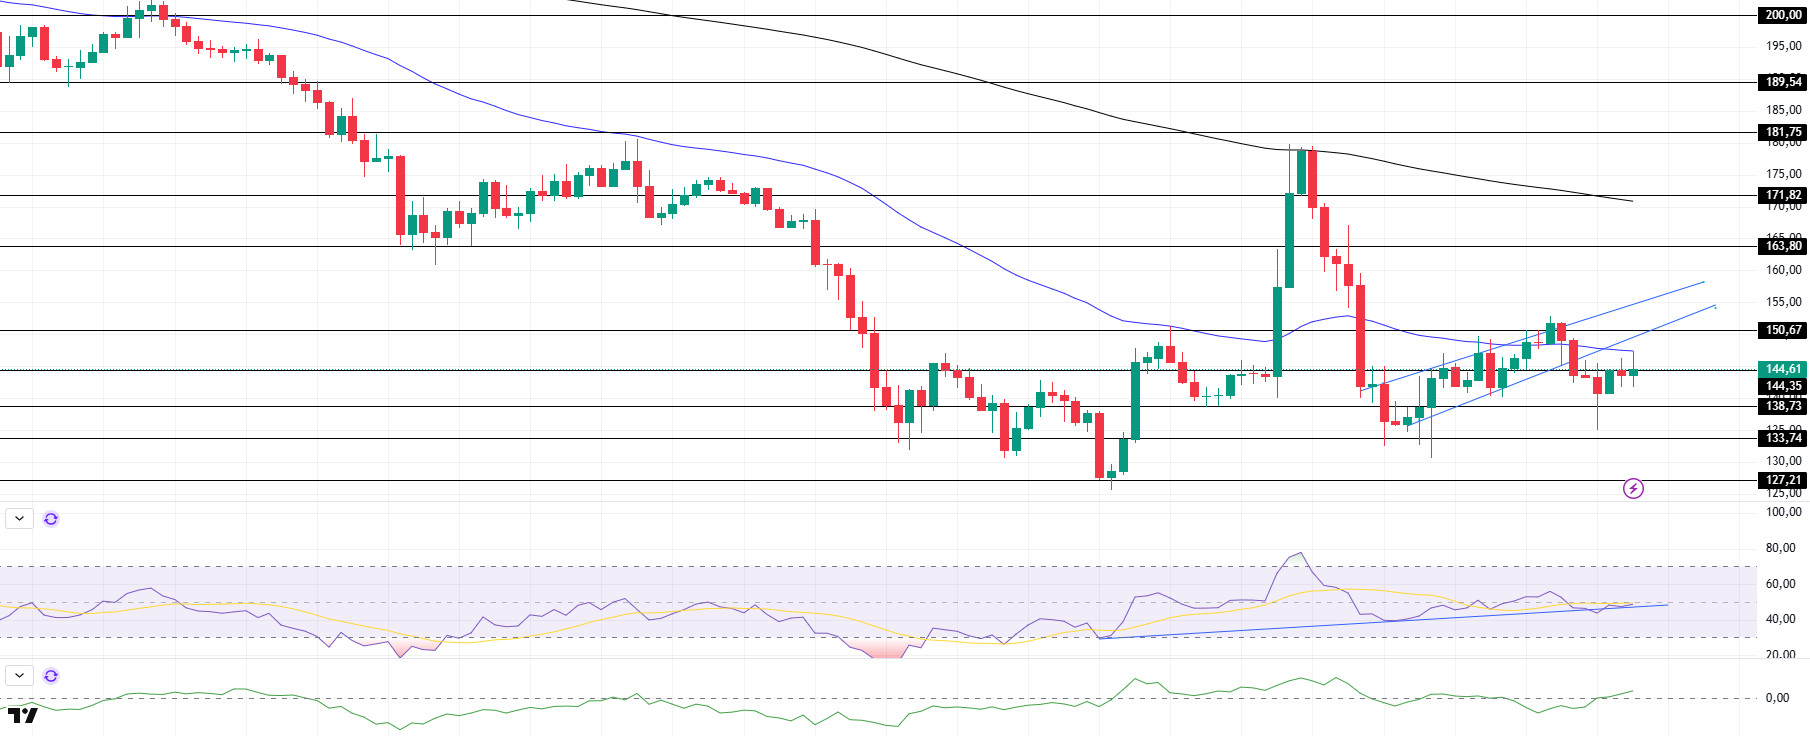
SOL has moved sideways since our analysis in the morning. It broke the wedge formation to the downside and executed the pattern. On the 4-hour timeframe, the 50 EMA (Blue Line) continues to be below the 200 EMA (Black Line). This could deepen the decline further in the medium term. At the same time, the price started moving below the two moving averages. As of now, the asset that tested the 50 EMA as resistance has retreated. When we examine the Chaikin Money Flow (CMF)20 indicator, it moved into positive territory. An increase in volume may increase money inflows. However, the Relative Strength Index (RSI)14 indicator approached the neutral zone. At the same time, although the RSI broke the downward uptrend on February 28, it managed to position above it again. The $150.67 level stands out as a very strong resistance point in the rises driven by both the upcoming macroeconomic data and the news in the Solana ecosystem. If it breaks here, the rise may continue. In case of retracements for the opposite reasons or due to profit sales, the support level of $ 138.73 can be triggered. If the price reaches these support levels, a potential bullish opportunity may arise if momentum increases.
Supports 138.73 – 133.74 – 127.21
Resistances 144.35 – 150.67 – 163.80
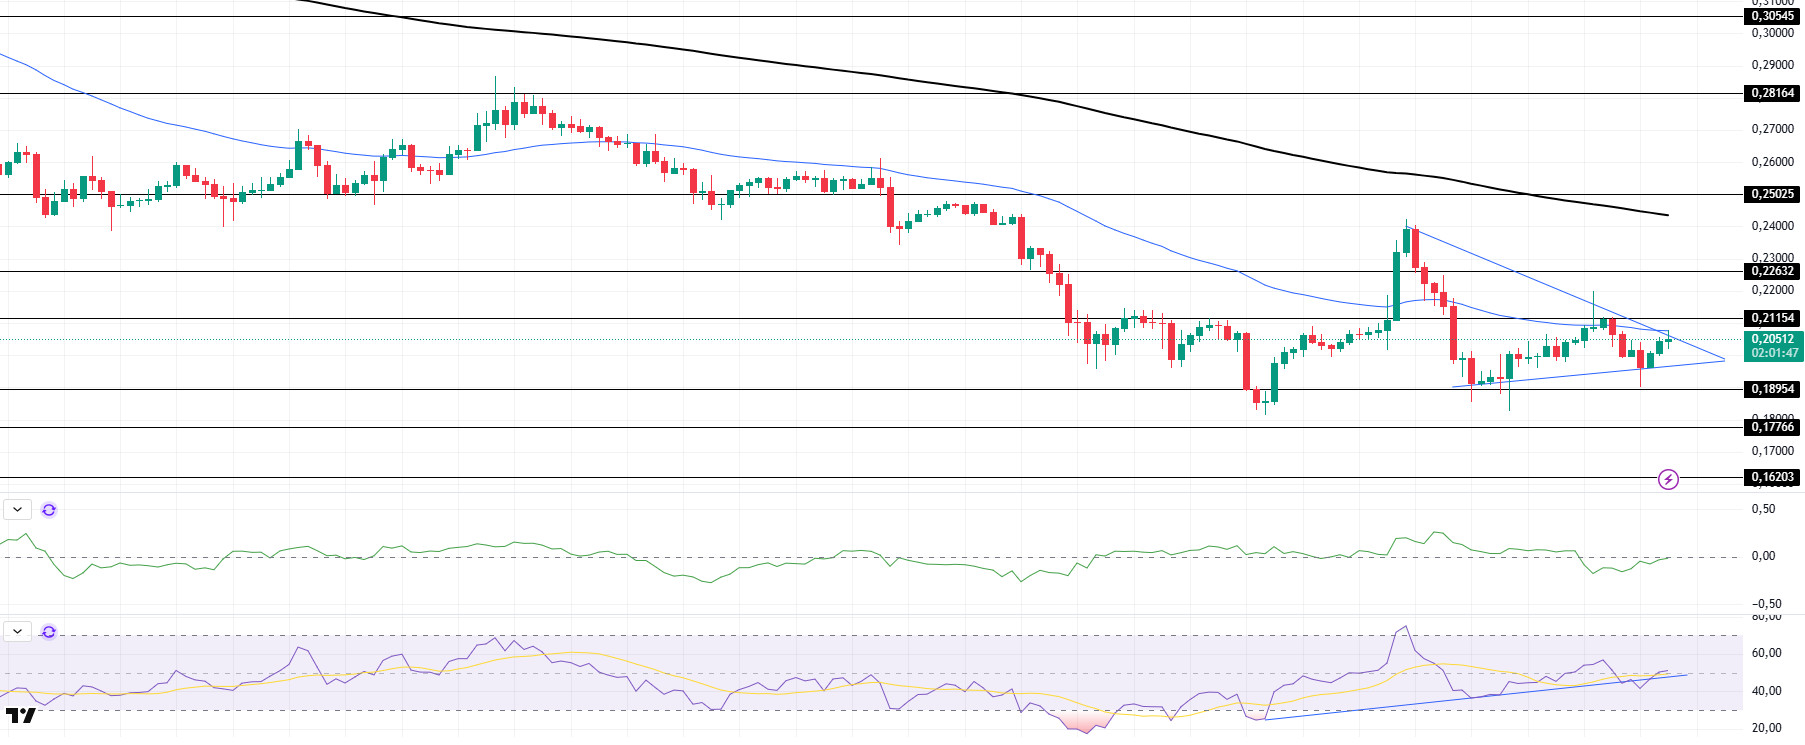
DOGE/USDT
DOGE has been bullish since our morning analysis. The price continues to remain inside the symmetrical triangle pattern. It is currently testing the high of the symmetrical triangle pattern and the 50 EMA (Blue Line) moving average. On the 4-hour timeframe, the 50 EMA (Blue Line) is below the 200 EMA (Black Line). This could mean that the decline could deepen in the medium term. However, the price has started to hover below two moving averages. The larger gap between the two moving averages increases the probability that DOGE will rise. The Chaikin Money Flow (CMF)20 indicator is in the neutral zone. However, the negative daily volume may reduce money outflows and cause CMF to decrease. On the other hand, Relative Strength Index (RSI)14 is in positive territory and although it broke the uptrend that started on February 28, it managed to be above the trend again. The $0.21154 level stands out as a very strong resistance point in the rises due to political reasons, macroeconomic data and innovations in the DOGE coin. In case of possible pullbacks due to political, macroeconomic reasons or negativities in the ecosystem, the $0.18954 level, which is the base level of the trend, is an important support. If the price reaches these support levels, a potential bullish opportunity may arise if momentum increases.
Supports 0.18954 – 0.17766 – 0.16203
Resistances 0.21154 – 0.22632 – 0.25025
LEGAL NOTICE
The investment information, comments and recommendations contained herein do not constitute investment advice. Investment advisory services are provided individually by authorized institutions taking into account the risk and return preferences of individuals. The comments and recommendations contained herein are of a general nature. These recommendations may not be suitable for your financial situation and risk and return preferences. Therefore, making an investment decision based solely on the information contained herein may not produce results in line with your expectations.
