
Weekly Fundamental Analysis Report – September 05
Fear & Greed Index
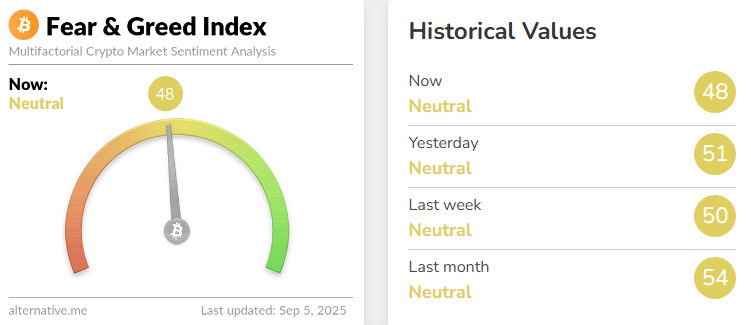
Source: Alternative
Change in Fear and Greed Value: -2
Last Week’s Level: 50
This Week’s Level: 48
When crypto-specific headlines and softening signals from US employment indicators are evaluated together throughout the week, it is seen that sentiment is balanced in the direction of caution. On the on-chain side, reports of BTC to ETH rotation from a major wallet showed that risk appetite has not completely faded, while the $8.4mn exploit in Bunny XYZ and the reported loss of $13.5-27mn in Venus increased the security risk premium. Divergence was evident in spot flows, with net inflows into Bitcoin ETFs and net outflows from Ethereum ETFs on the same day, shifting short-term positioning in favor of BTC while reinforcing caution on the altcoin front. A movement of 479 BTC from a long dormant wallet was seen as a factor weakening liquidity sentiment. On the macro front, JOLTS job openings fell to a 10-month low and the number of unemployed exceeded the number of job openings, while the accompanying ADP’s 54K and weekly applications of 237K confirmed the softening in employment, while the expectations of an interest rate cut before the non-farm payrolls expected to be announced on September 5 offered only a measured support to risky assets. The sum of these components dampened greed and emphasized caution, causing the index to fall from 50 to 48.
Fund Flows
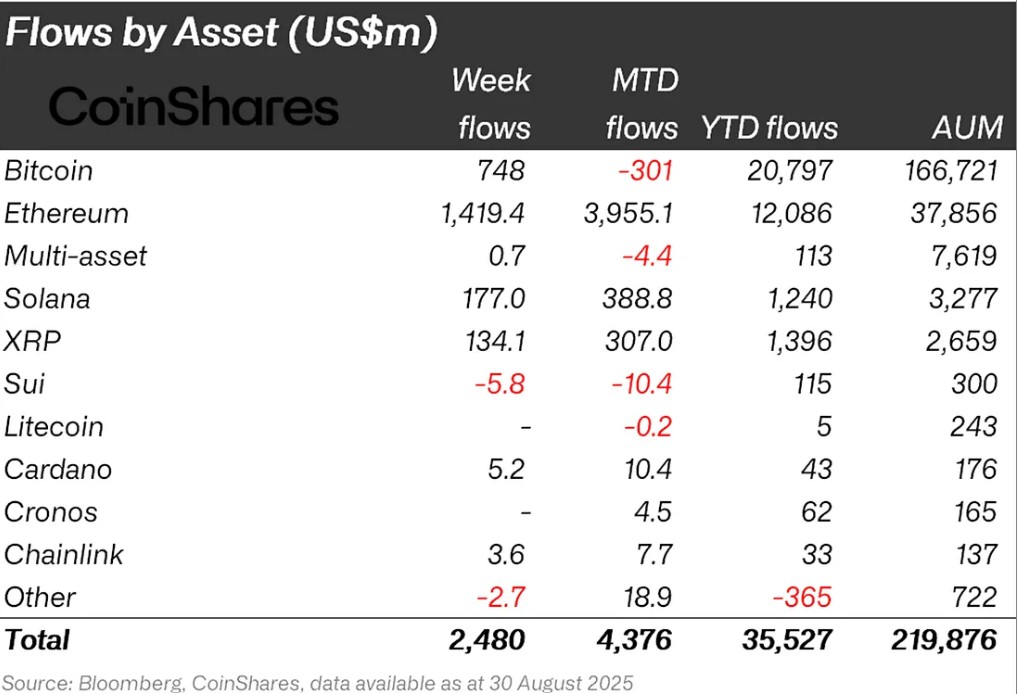
Source: Coin Shares
Overview The cryptocurrency market has been flat amid rising macroeconomic uncertainties and unfavorable changes in tariffs. In particular, US President Donald Trump’s harsh and ever-changing rhetoric on tariff disputes between countries has led to a loss of confidence in the markets. In addition, the prolongation of the Russia-Ukraine war and President Putin’s escalation of military pressure escalated geopolitical risks, causing investors to take a selling position. As a result of all these developments, Bitcoin lost around 8%.
Bitcoin (BTC): Bitcoin is trying to enter a period of renewed investor confidence this week. Expectations of interest rate cuts and reduced inflation pressures in global markets may increase interest in risky assets. The positive attitude of institutional investors is particularly noteworthy. Bitcoin-focused funds received $748 million in inflows this week alone. This shows that the market is showing signs of recovery and that long-term confidence in Bitcoin continues.
Ethereum (ETH): This week, Ethereum saw inflows of $1,419.4 million as spot ETH weakened.
Ripple (XRP): Xrp saw fund inflows of $134.0 million this week.
Solana (SOL): DeFi Development Corp. Increased Solana Treasury to $400 Million. Solana saw inflows of $177.0 million.
Cardano (ADA): The Cardano Foundation continues to launch enterprise-grade auditable products. This week Cardano saw $5.2 million in inflows.
Chainlink (LINK): Chainlink continues its collaborations with Swift, JPMorgan, Euroclear and other major financial institutions. These collaborations strengthen its potential to provide reliable data to the tokenization and DeFi space. At the time of reporting these updates, Link has seen $3.6 million in inflows this week.
Multi-asset: Inflows were observed in the multi-asset group despite ETF data.
Fund Outflows:
Other: Although sectoral and project-based increases were seen in altcoins. In the general market impression, it brought an outflow of 2.7 million dollars in fund flow data.
SUI: The general depreciation in the market has also affected the Sui coin. Approximately $5.8 million exited Sui this week.
Total MarketCap
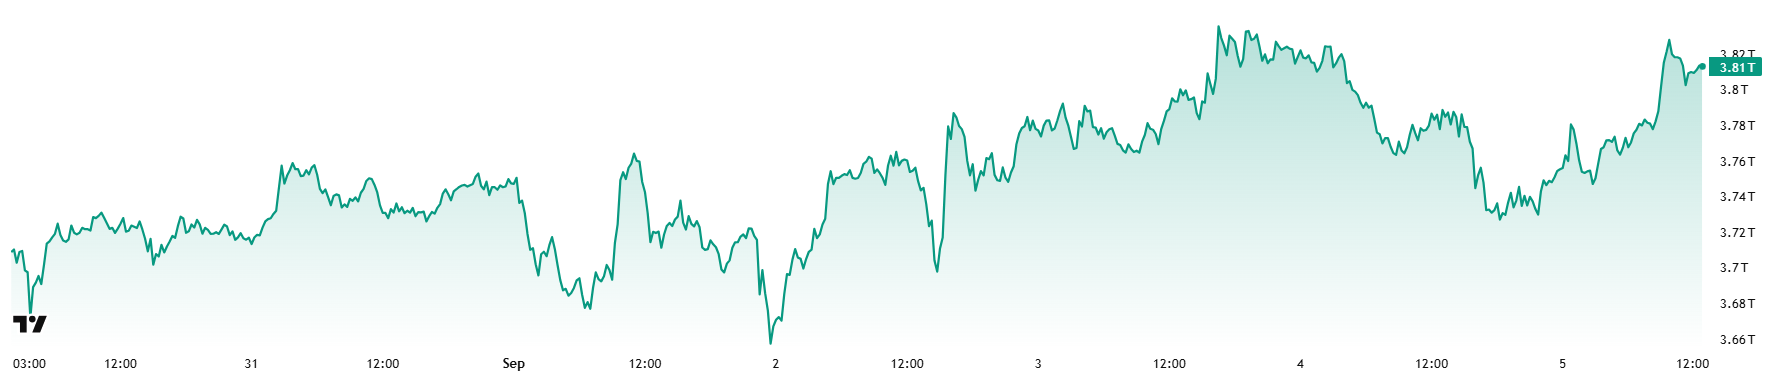
Source: Tradingview
- Last Week Market Capitalization: 71 trillion Dollars
- Market Capitalization This Week: 81 trillion Dollars
The cryptocurrency market grew by nearly $100 billion this week, with a 2.75% increase in total market capitalization to $3.81 trillion. During the week, the market capitalization peaked at $ 3.84 trillion, while the lowest point was recorded as $ 3.64 trillion. Thus, it was seen that the market moved within a band of approximately 200 billion dollars. This outlook suggests that although volatility continues, the market maintains its upside potential and investors have started to reposition cautiously.
Total 2
The Total 2 index, which started the week with a market capitalization of $1.56 trillion, rose by 1.33% during the week, reaching $1.58 trillion with an increase of approximately $20 billion. Although it rose up to $1.6 trillion during the week, it could not be sustained at this level. Although the index came close to its all-time high of $1.71 trillion, it failed to test its peak. However, with the potential for an approximate 8.5% increase in value from current levels, the possibility of regaining momentum for a peak attempt remains.
Total 3
The Total 3 index started the week with a market capitalization of USD 1.02 trillion and rose by 1.61% during the week, gaining approximately USD 16.46 billion, reaching USD 1.04 trillion. The index, which had a 6% gap between the lowest and highest values during the week (market capitalization of 1.06-1.00 trillion dollars), was the most volatile index of the week.
While a positive picture was observed across the market, it was noteworthy that the strongest performance was seen in the Total index. This situation reveals that the activity on Bitcoin, rather than the altcoin market, has come to the fore again and the market has exhibited a more resilient and strong structure compared to other segments. Looking at the comparative performances, it can be said that the decline in Ethereum’s total market share continued this week.
Altcoin Season Index
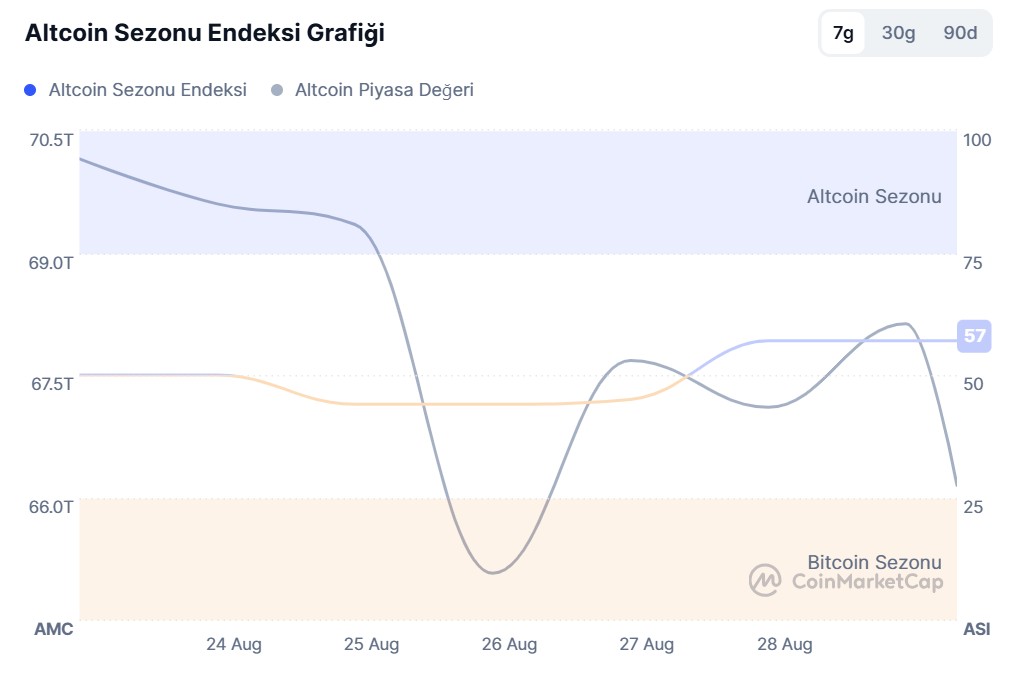
Source: Coin market cap
- Last Week Index Value: 57/100
- Index Value This Week: 50/100
Between August 29 and September 5, 2025, the correlation between the market capitalization of altcoins (Altcoin Market Cap) and the Altcoin Season Index has been on the rise. The chart shows that this week, the index peaked at 50 on September 5 , with the Altcoin Market Cap reaching 1.64T. This signals a rise in the market dominance of altcoins. When the index started to rise this week, the top 5 coins leading the rise were M, OKB, Pengu, Cro, Aero. On September 01, the index rose from 48 to 50, indicating that the altcoin season has the potential for a short-term revival and that the total market capitalization of altcoins has experienced a relative progress compared to Bitcoin.
Bitcoin Dominance
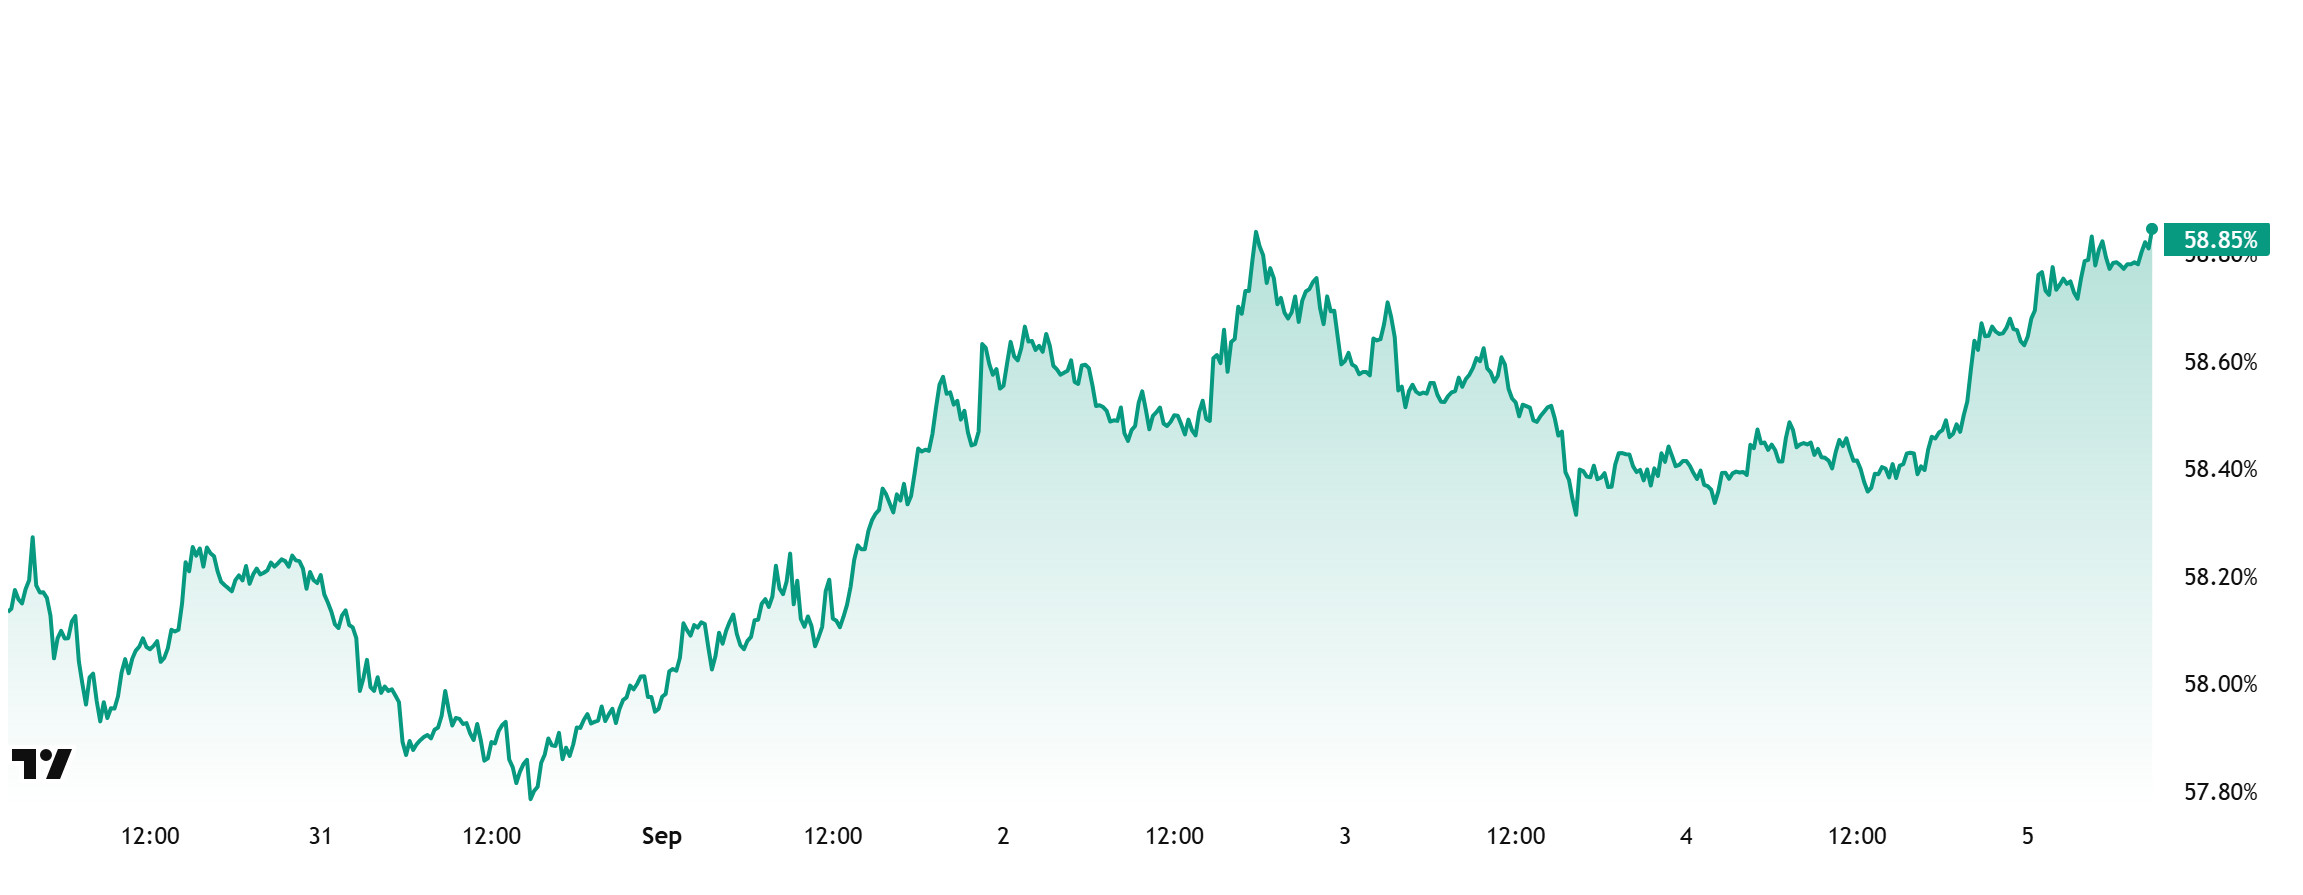
Bitcoin Dominance
Bitcoin dominance, which started the week at 58.09%, fell to 58.02% during the week, but then rose slightly and is currently at 58.85%.
This week, Strategy bought 4,049 Bitcoin, Metaplanet bought 1,009 Bitcoin and H100 Group bought 47 Bitcoin.
Data on Bitcoin spot ETFs shows a total net inflow of $406.6 million to date.
The likelihood that the FED will cut interest rates in September continues to increase. In the statements of FED officials, the emphasis on the need for a rate cut at the September meeting has begun to be seen. These developments in the US have increased the risk appetite of retail investors and paved the way for buying in spot ETFs. In addition, institutional investors also continued to make inflows.
As a result of the recent positive developments, Bitcoin-oriented capital inflows have increased. Moreover, Bitcoin outperformed Ethereum and other altcoins during this period. This creates an expectation of an increase in Bitcoin’s market dominance, with Bitcoin dominance expected to hover between 58% – 61% in the coming week.
Ethereum Dominance
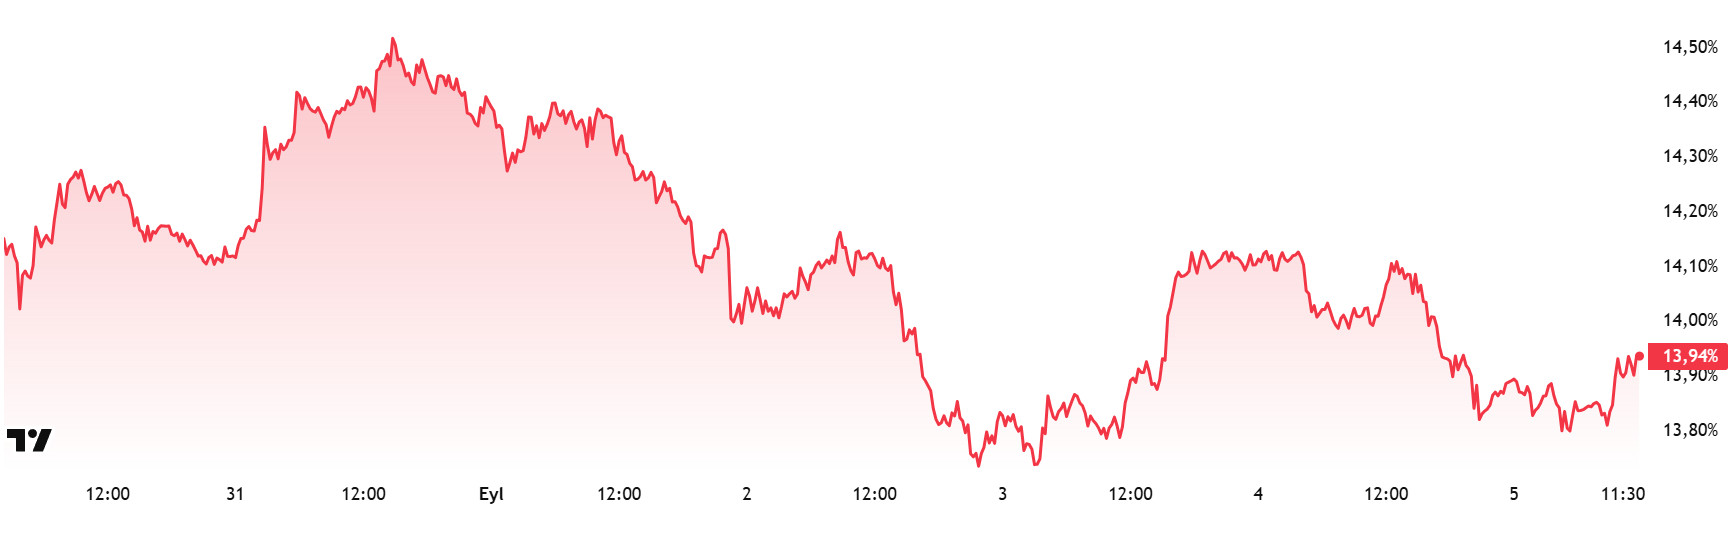
Source: Tradingview
Weekly Change
- Last Week’s Level: 14.29%
- This Week’s Level: 13.94%
Ethereum dominance, which retreated to 11.39% in the last week of August, regained a positive momentum in the next three weeks and exhibited a steady upward trend and rose to 14.98%. However, the pullback in Ethereum price in the past two weeks brought selling pressure and a limited decline in the dominance was observed.
Accordingly, Ethereum dominance ended last week at 14.29%, while it is trading at around 13.94% as of current data. In the same period, unlike Ethereum, Bitcoin dominance followed a positive trend and showed an upward trend.
Looking at the fundamental developments affecting Ethereum dominance, there has been activity on the institutional buying side. SharpLink recently announced that it purchased 39,008 ETH. While the average purchase price was realized at $4,531, the company’s total assets reached 837,230 ETH and were valued at approximately $3.6 billion. In addition, according to Reuters, Ether Machine raised 150,000 ETH (approximately $654 million) through private sales. In this regard, with the interest of institutional investors, the Ethereum staking queue has reached its highest level since September 2023. According to on-chain data, approximately 860,369 ETH (worth $3.7 billion) are waiting to be staked.
On the other hand, the Ethereum Community Foundation launched the Proof-of-Burn token BETH. Each BETH token represents an on-chain proof of ETH being removed from circulation. According to CoinDesk, the Ethereum Foundation plans to sell 10,000 ETH in the coming weeks. The proceeds from the sales will be directed to research and development, grants and donations, and it is envisaged that the sales will be realized in small batches.
Bitcoin Spot ETF
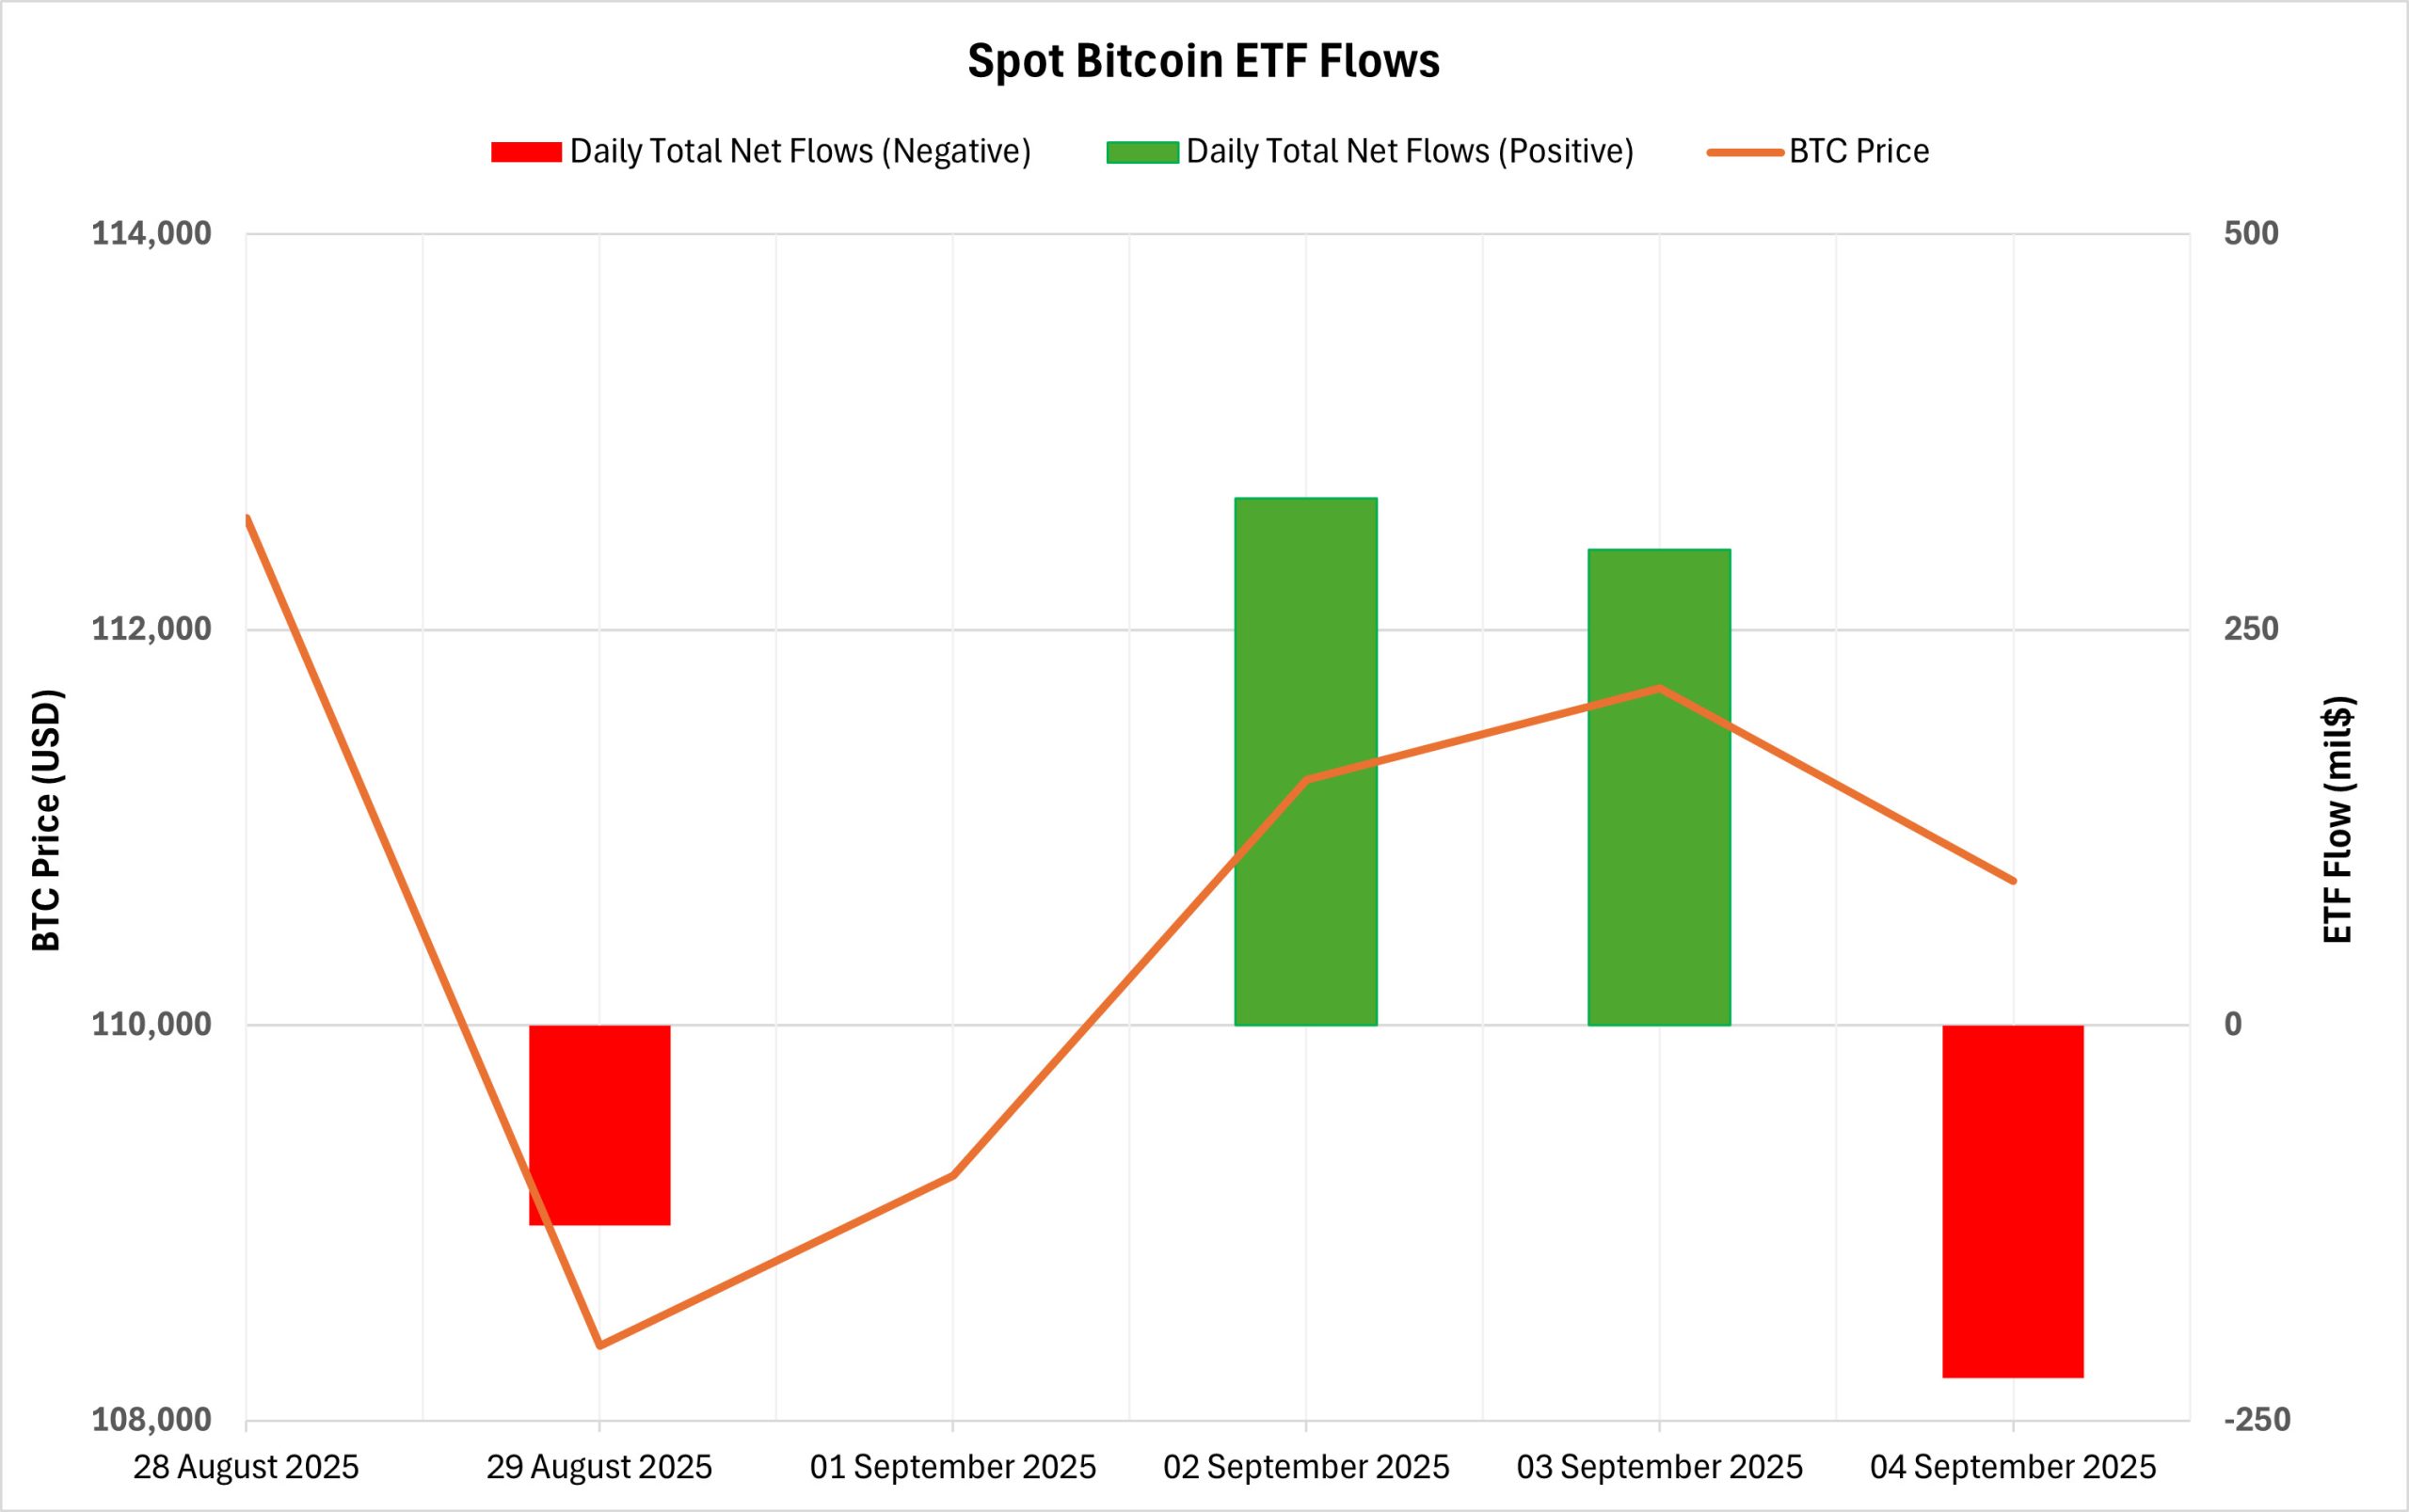
NetFlow Status: Between August 29 and September 4, 2025, Spot Bitcoin ETFs received a total net inflow of $283.7 million. The strongest daily inflow occurred on September 2 with $332.8 million. During this period, BlackRock IBIT stood out with a net inflow of $522.1 million. The four-day positive streak ended on September 29, 2025.
Bitcoin Price: Opening at $112,566 on August 29, Bitcoin closed at $110,730 on September 4. It completed this period with a 1.63% decline. Despite the rises, the outflows on the opening and closing days suppressed the price.
Cumulative Net Inflows: Spot Bitcoin ETFs’ total cumulative net inflows rose to $54.63 billion as of the 413th trading day.
| DATE | COIN | Open | Close | Change % | ETF Flow (mil$) |
|---|---|---|---|---|---|
| 29-Aug-25 | BTC | 112,566 | 108,377 | -3.72% | -126.7 |
| 01-Sep-25 | BTC | 108,246 | 109,237 | 0.92% | 0 |
| 02-Sep-25 | BTC | 109,237 | 111,240 | 1.83% | 332.8 |
| 03-Sep-25 | BTC | 111,240 | 111,705 | 0.42% | 300.5 |
| 04-Sep-25 | BTC | 111,705 | 110,730 | -0.87% | -222.9 |
| Total for August 29 – September 04, 25 | -1.63% | 283.7 | |||
August 29-September 4, 2025 was a mixed bag with strong IBIT-driven buying offset by outflows on the ARKB/FBTC/GBTC side. Although heavy inflows had a positive impact on BTC price, outflows on the first and last day of this period broke the positive streak and left a weak outlook at the close. If this institutional demand continues in the coming period, new inflows from the Spot Bitcoin ETF wing are likely to create an upward support on BTC price in the medium term. This could provide a positive backdrop for both the technical outlook and market psychology.
Ethereum spot ETF
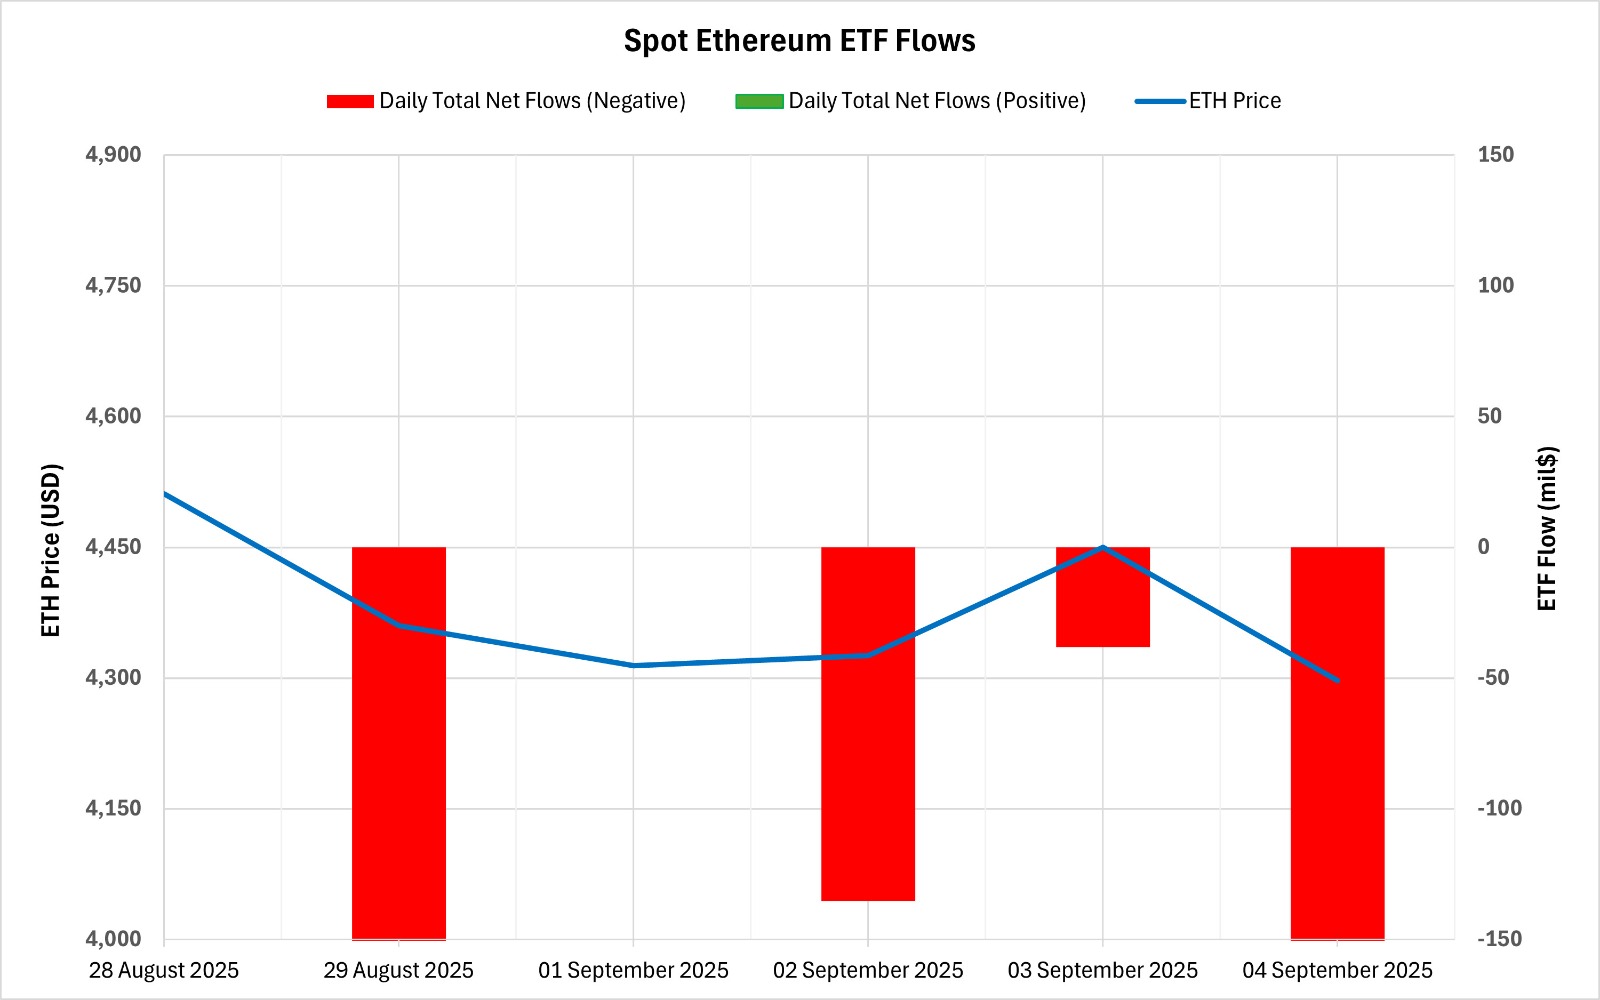
Between August 29 and September 4, 2025, Spot Ethereum ETFs saw a total net outflow of $505.4 million. The strongest outflow on a daily basis was recorded as $ 167.3 million on September 4. In this process, Fidelity FETH led the outflows with $ 301.1 million and outflows were seen from all ETH ETFs in the said date range. Thus, the 6-day positive streak ended and a 4-day negative flow period began. Spot Ethereum ETFs saw cumulative net inflows fall to $13.19 billion at the end of the 281st trading day.
| DATE | COIN | Open | Close | Change % | ETF Flow (mil$) |
|---|---|---|---|---|---|
| 29-Aug-25 | ETH | 4,511 | 4,360 | -3.35% | -164.6 |
| 01-Sep-25 | ETH | 4,391 | 4,314 | -1.75% | 0 |
| 02-Sep-25 | ETH | 4,314 | 4,326 | 0.28% | -135.3 |
| 03-Sep-25 | ETH | 4,326 | 4,450 | 2.87% | -38.2 |
| 04-Sep-25 | ETH | 4,450 | 4,297 | -3.44% | -167.3 |
| Total for August 29 – September 04, 25 | -4.74% | -505.4 | |||
Ethereum price started at $4,511 on August 29 and closed at $4,297 on September 4. There was a total decline of 4.74% in this process. The 2.87% recovery on September 3 was short-lived. In general, profit realization and fund outflows dominated the price. If flows rebalance, the easing of weakness on the ETF side could ease price pressure.
Bitcoin Options Distribution
Source: Laevitas
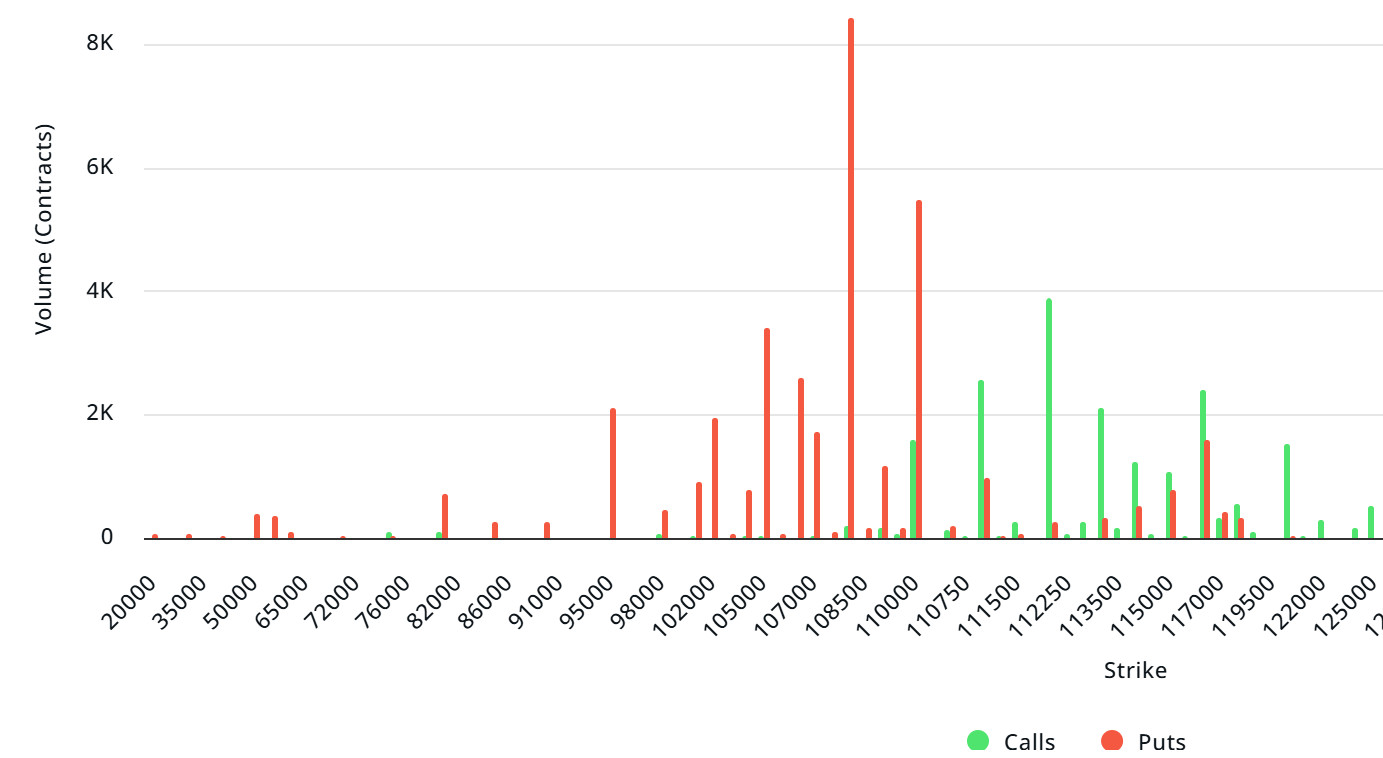
BTC: Notional: $3.28B | Put/Call: 1.38 | Max Pain: $112K
Deribit Data: Deribit data shows that BTC options contracts with a notional value of approximately $3.28 billion expired today. At the same time, according to the data in the last 24 hours, if we look at the risk conversion in the next 1 week, put options are the dominant side in hedging more than call options. This makes put options expensive. When we examine the expected volatility, it is above the realized volatility. On the other hand, the fact that the spread metric is positive and the IV – RV indicators are very close to each other gives a clue that there will be a violent movement in the market. Skew values are highly bearish today and next week.
Laevitas Data: When we examine the chart, it is seen that put options are concentrated in the band of 102,000 – 110,000 dollars. Call options are concentrated between 110,000 – 116,000 dollars and the concentration decreases towards the upper levels. At the same time, the level of approximately 108,000 dollars is seen as support and 112,000 dollars as resistance. On the other hand, there are 8.42K put options at the $108,000 level, where there is a peak and there is a decrease in put volume after this level. However, it is seen that 3.89K call option contracts peaked at the $112,000 level. When we look at the options market, we see that put contracts are dominant on a daily and weekly basis.
Option Maturity:
Put/Call Ratio and Maximum Pain Point: If we look at the options in the last 7 days data from Laevitas, the number of call options decreased by about 9% compared to last week and amounted to 102.89K. In contrast, the number of put options moved in line with last week and stood at 96.71K. The put/call ratio for options was set at 1.38. This indicates that put options are much more in demand among investors than call options. Bitcoin’s maximum pain point is seen at $112,000. BTC is priced at $111,700 and if it does not break the pain point of $112,000 on the upside, it can be predicted that the declines will continue.
Legal Notice
The investment information, comments and recommendations contained in this document do not constitute investment advisory services. Investment advisory services are provided by authorized institutions on a personal basis, taking into account the risk and return preferences of individuals. The comments and recommendations contained in this document are of a general type. These recommendations may not be suitable for your financial situation and risk and return preferences. Therefore, making an investment decision based solely on the information contained in this document may not result in results that are in line with your expectations.