Weekly Bitcoin Onchain Report
Active Addresses
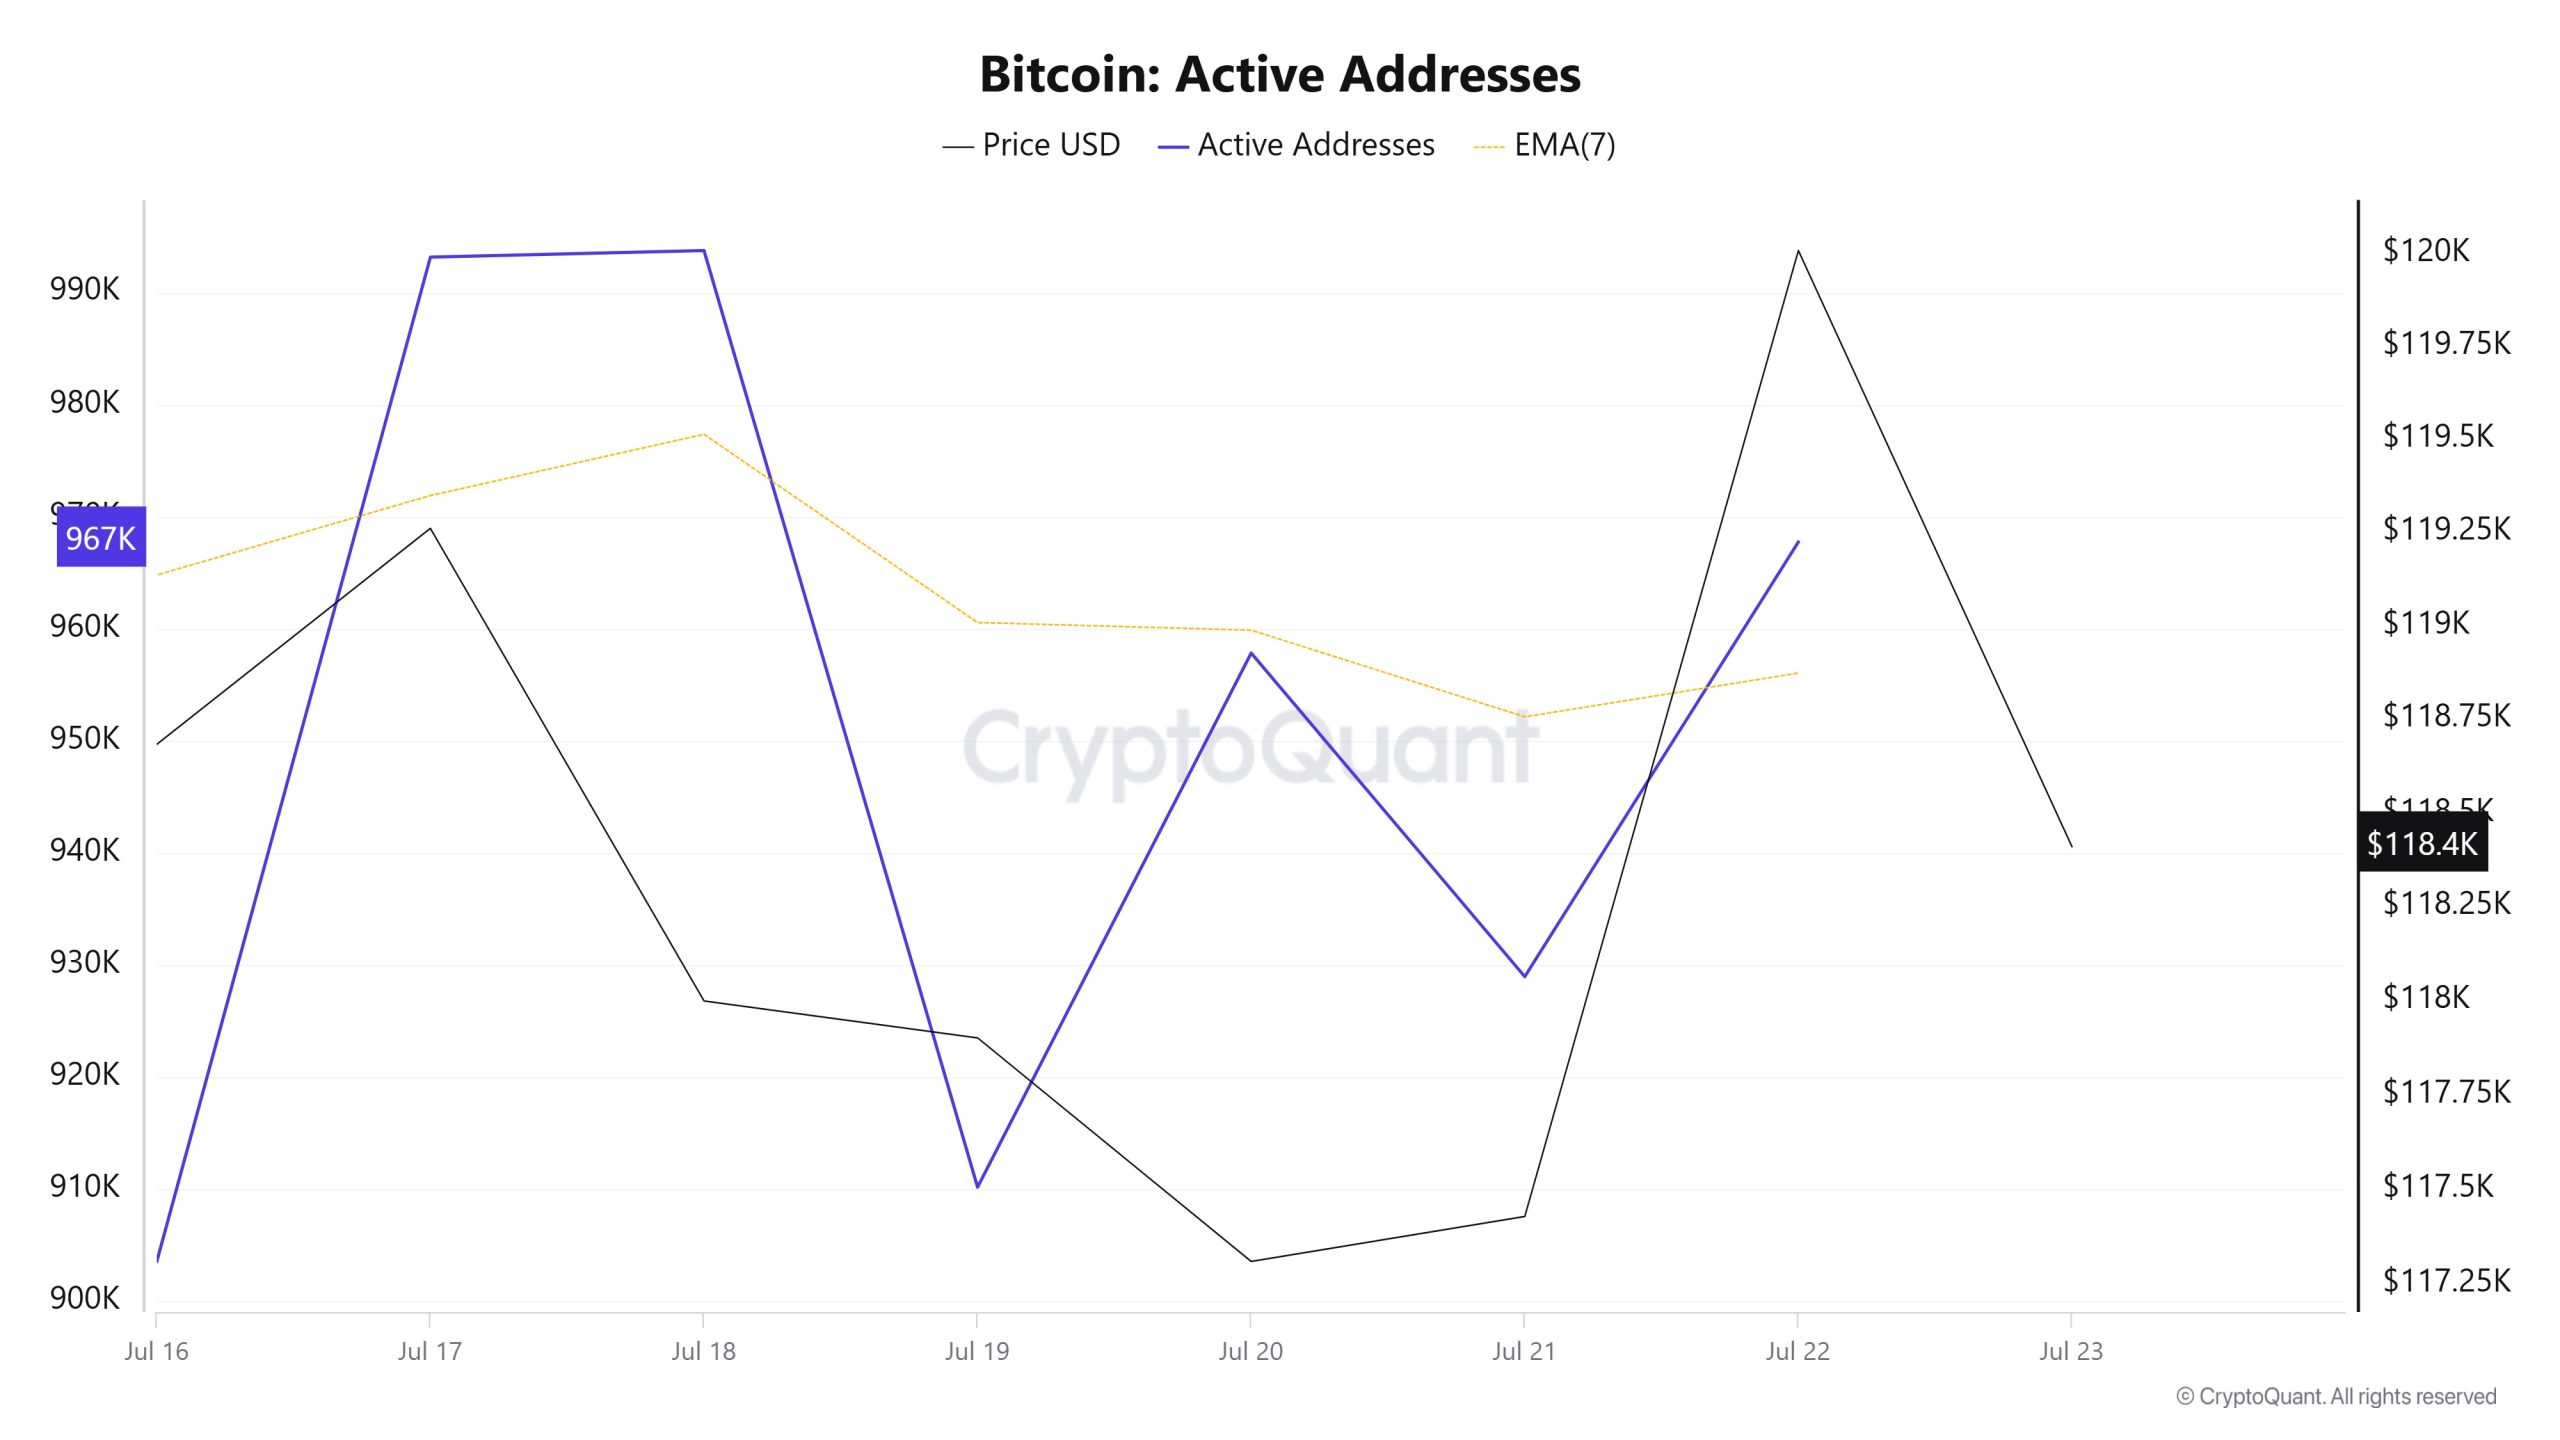
Between 16-23 July, 967,750 active addresses entered the Bitcoin network. In this process, the Bitcoin price rose to the level of $ 120,000. Especially on 20 July, the increase in the number of active addresses was observed to move the price towards $ 120,000. From a technical point of view, it is noteworthy that there are upward movements at the point where the 7-day simple moving average (SMA) intersects the price on 21 July. This technical signal indicates that there is buying pressure on the market.
Active Sending Addresses
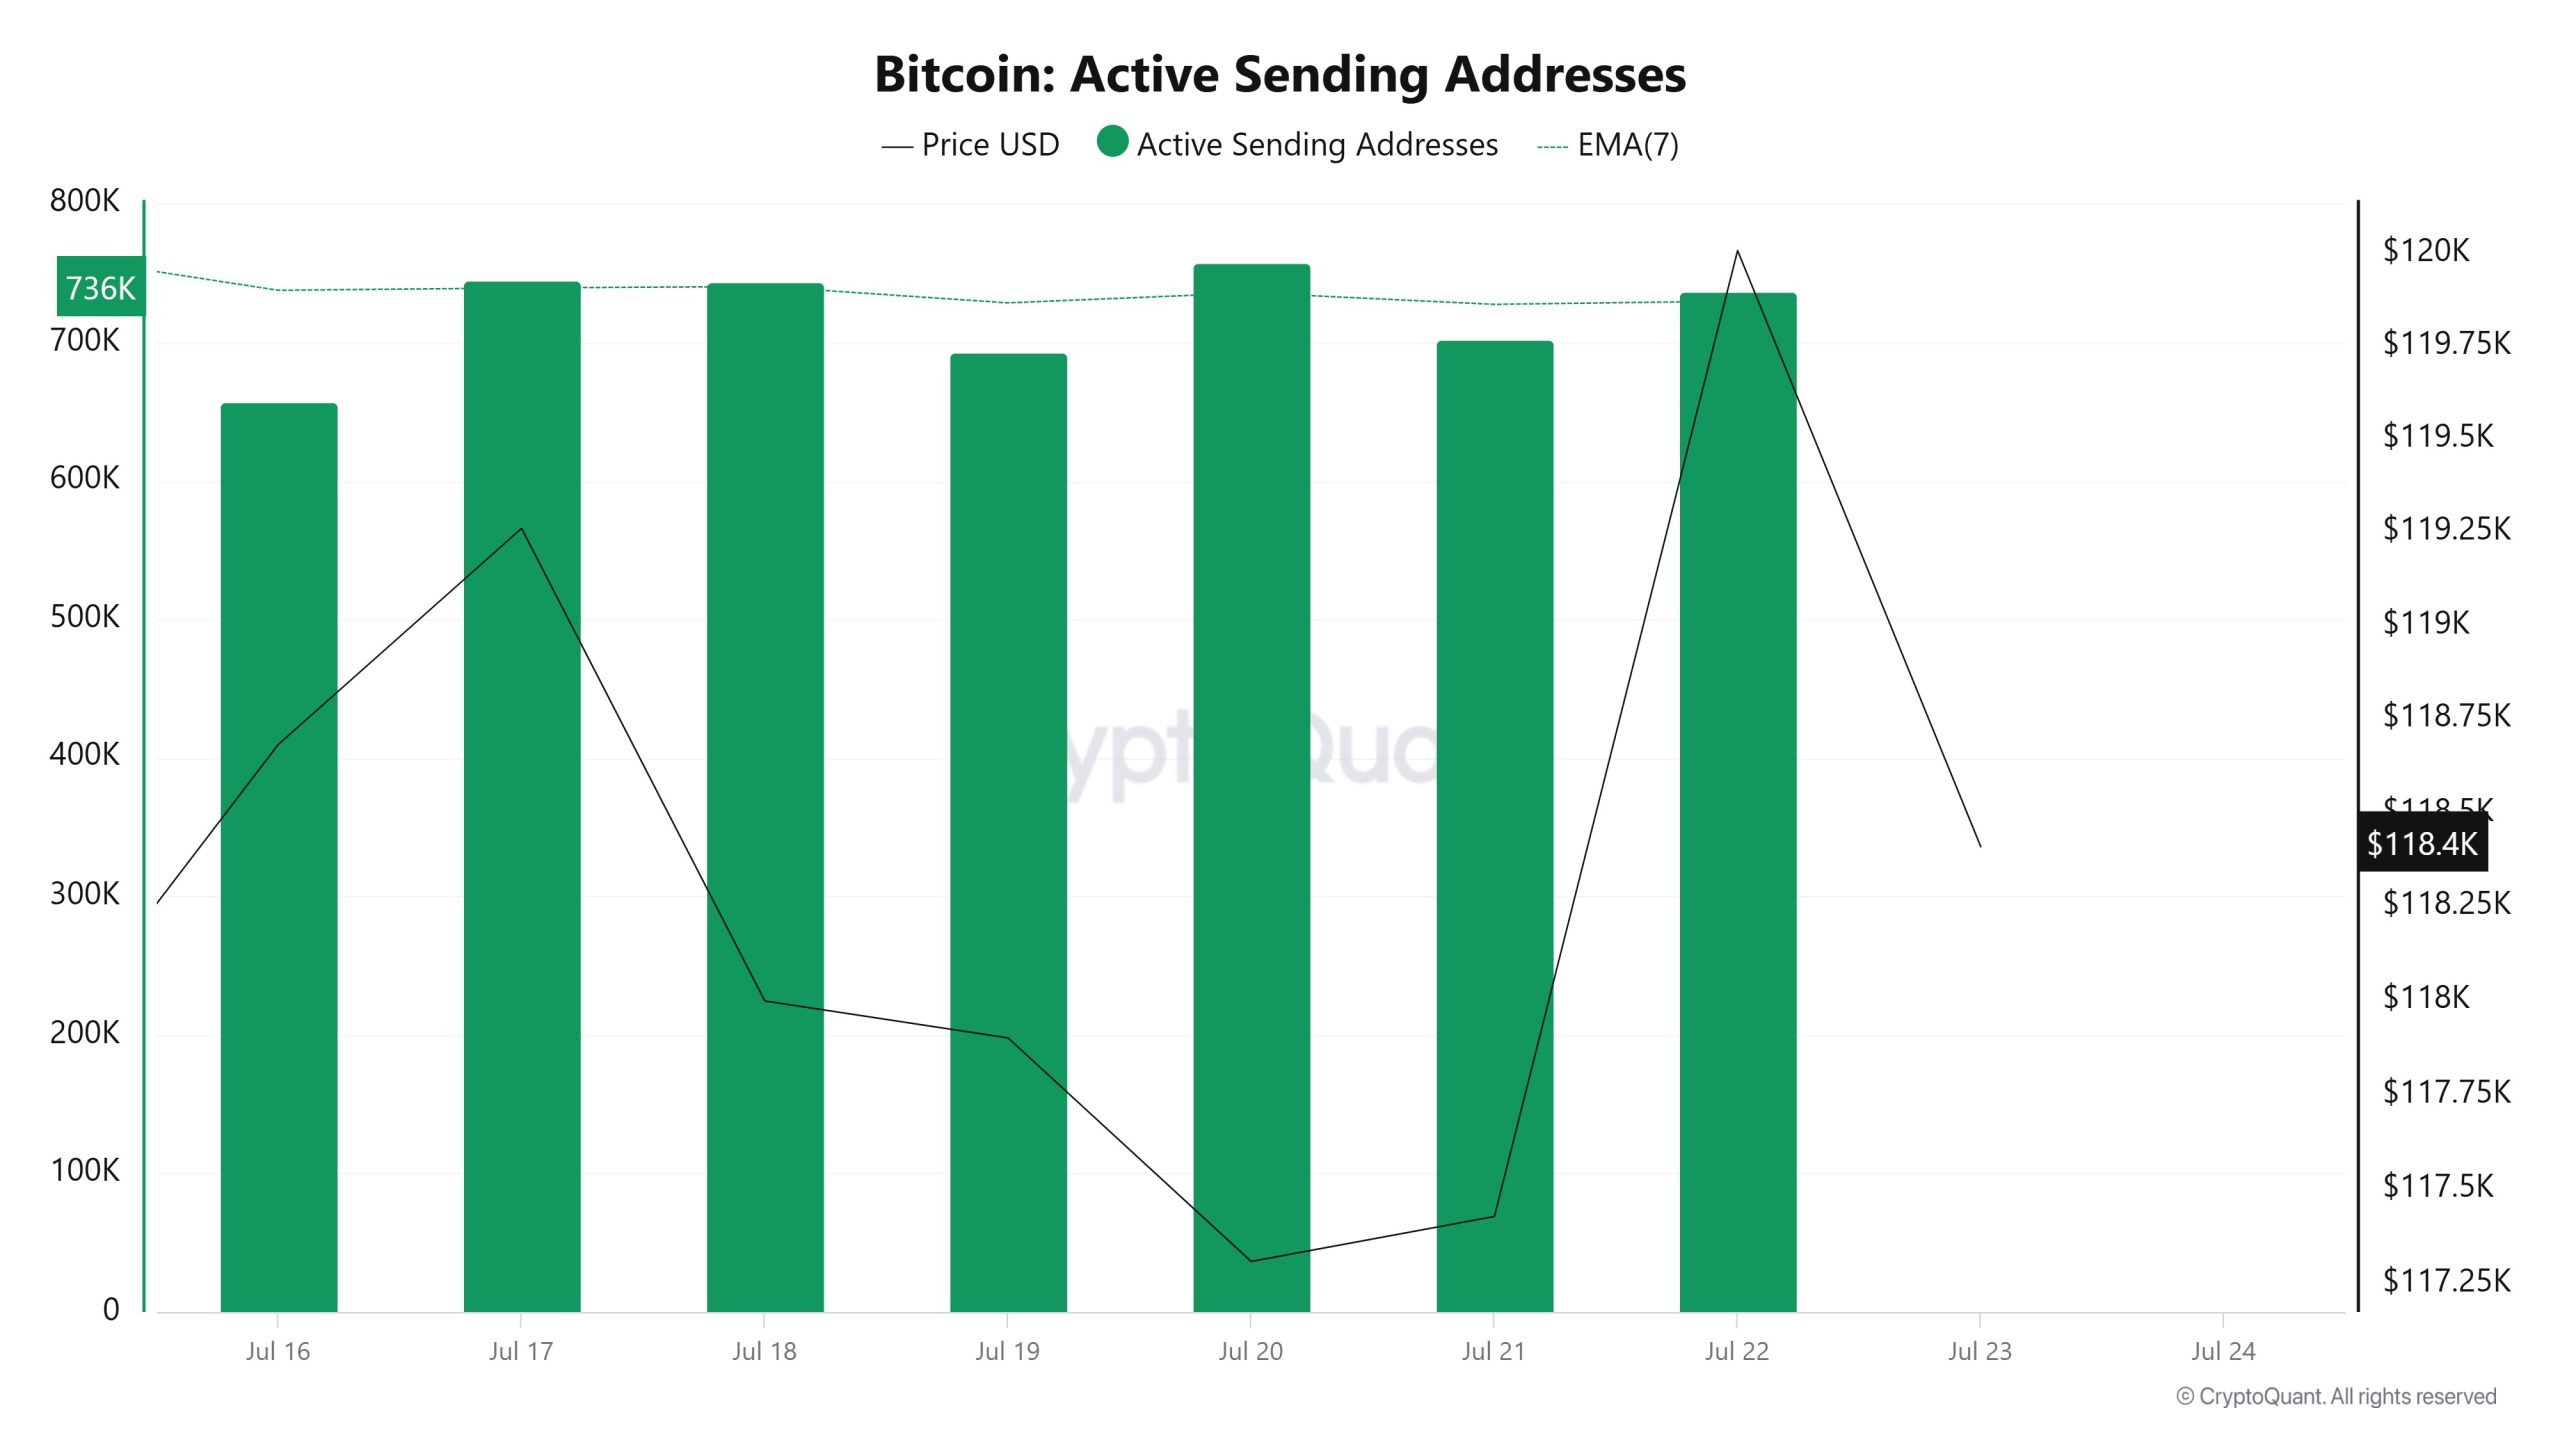
An upward trend was observed in the “Active Sending Addresses” metric between 16-23 July. On the day when the price reached its highest level, this metric rose to 736,670, indicating that user activity on the Bitcoin network increased in parallel with the price.
This data suggests that the $120,000 peak is supported not only by price but also by on-chain address activity. Overall, the Active Sending Addresses metric trended upwards during this period.
Active Receiving Addresses
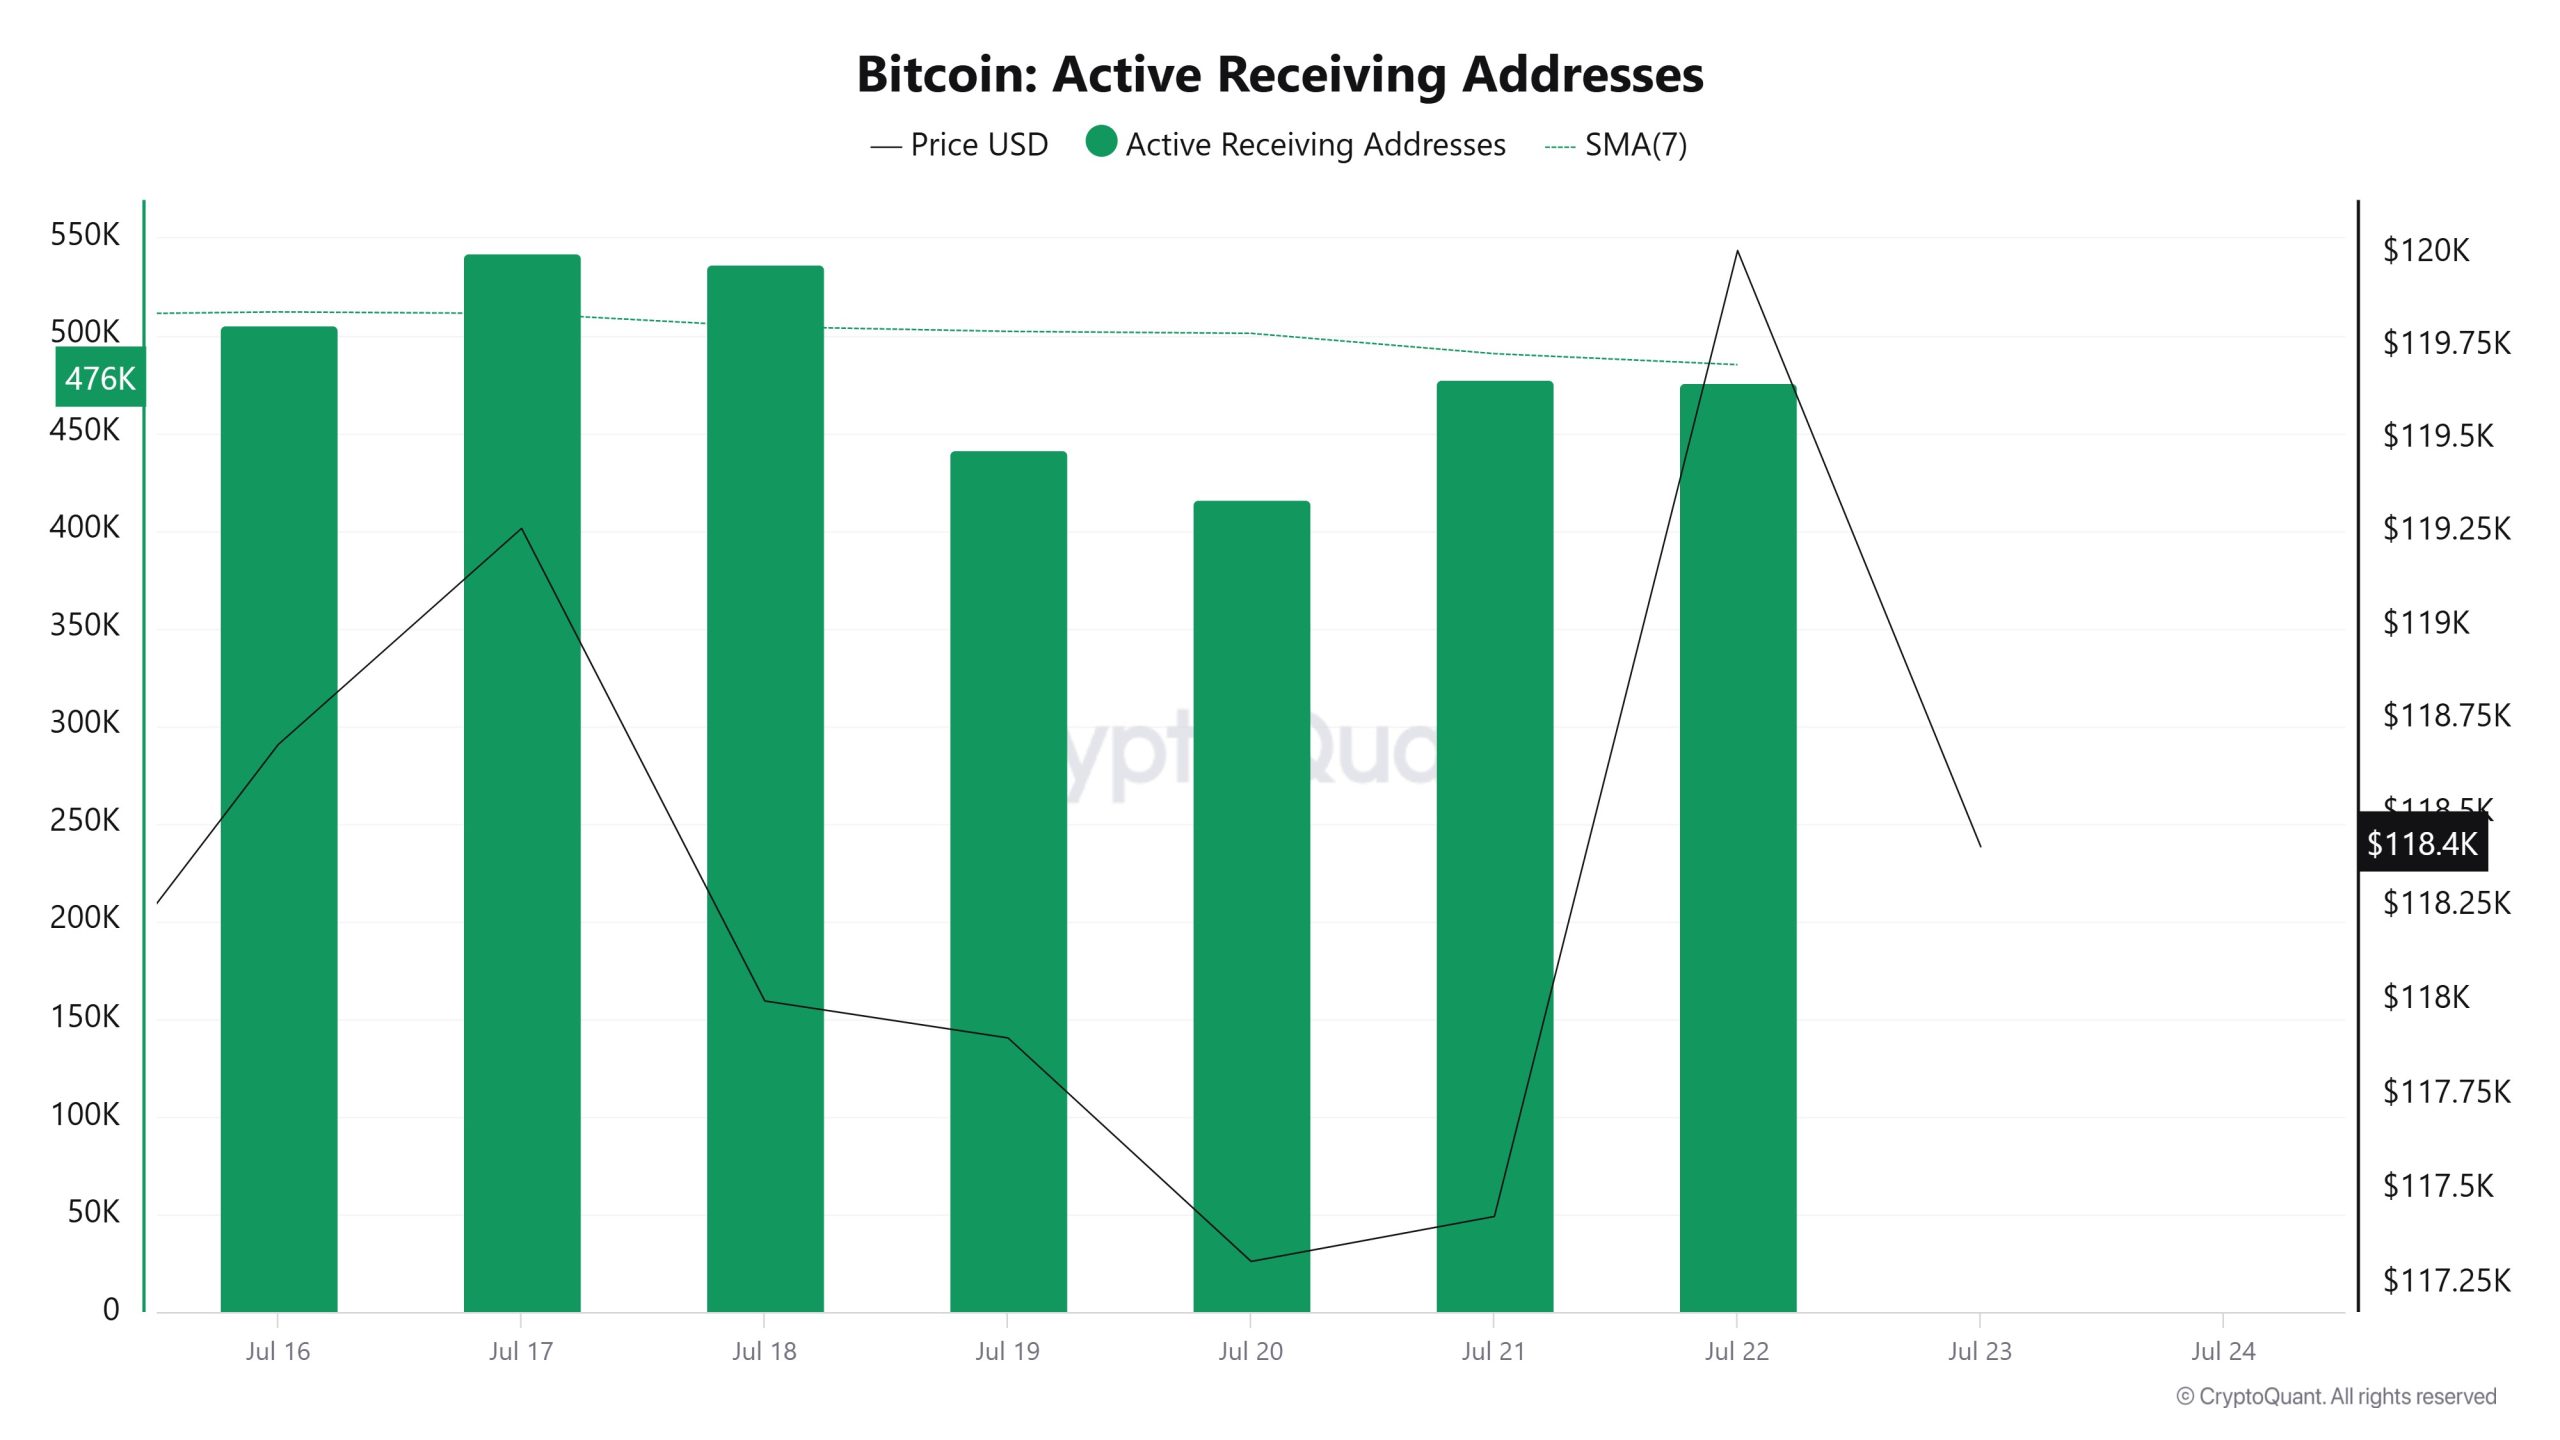
Between 16 July and 23 July, there was a regular rise in active buying addresses with a Black Line (price line). On the day the price reached a high level, active buying addresses rose to 476,092 levels; It shows that buyers bought Bitcoin at $ 120,000 levels.
Breakdowns
MRVR
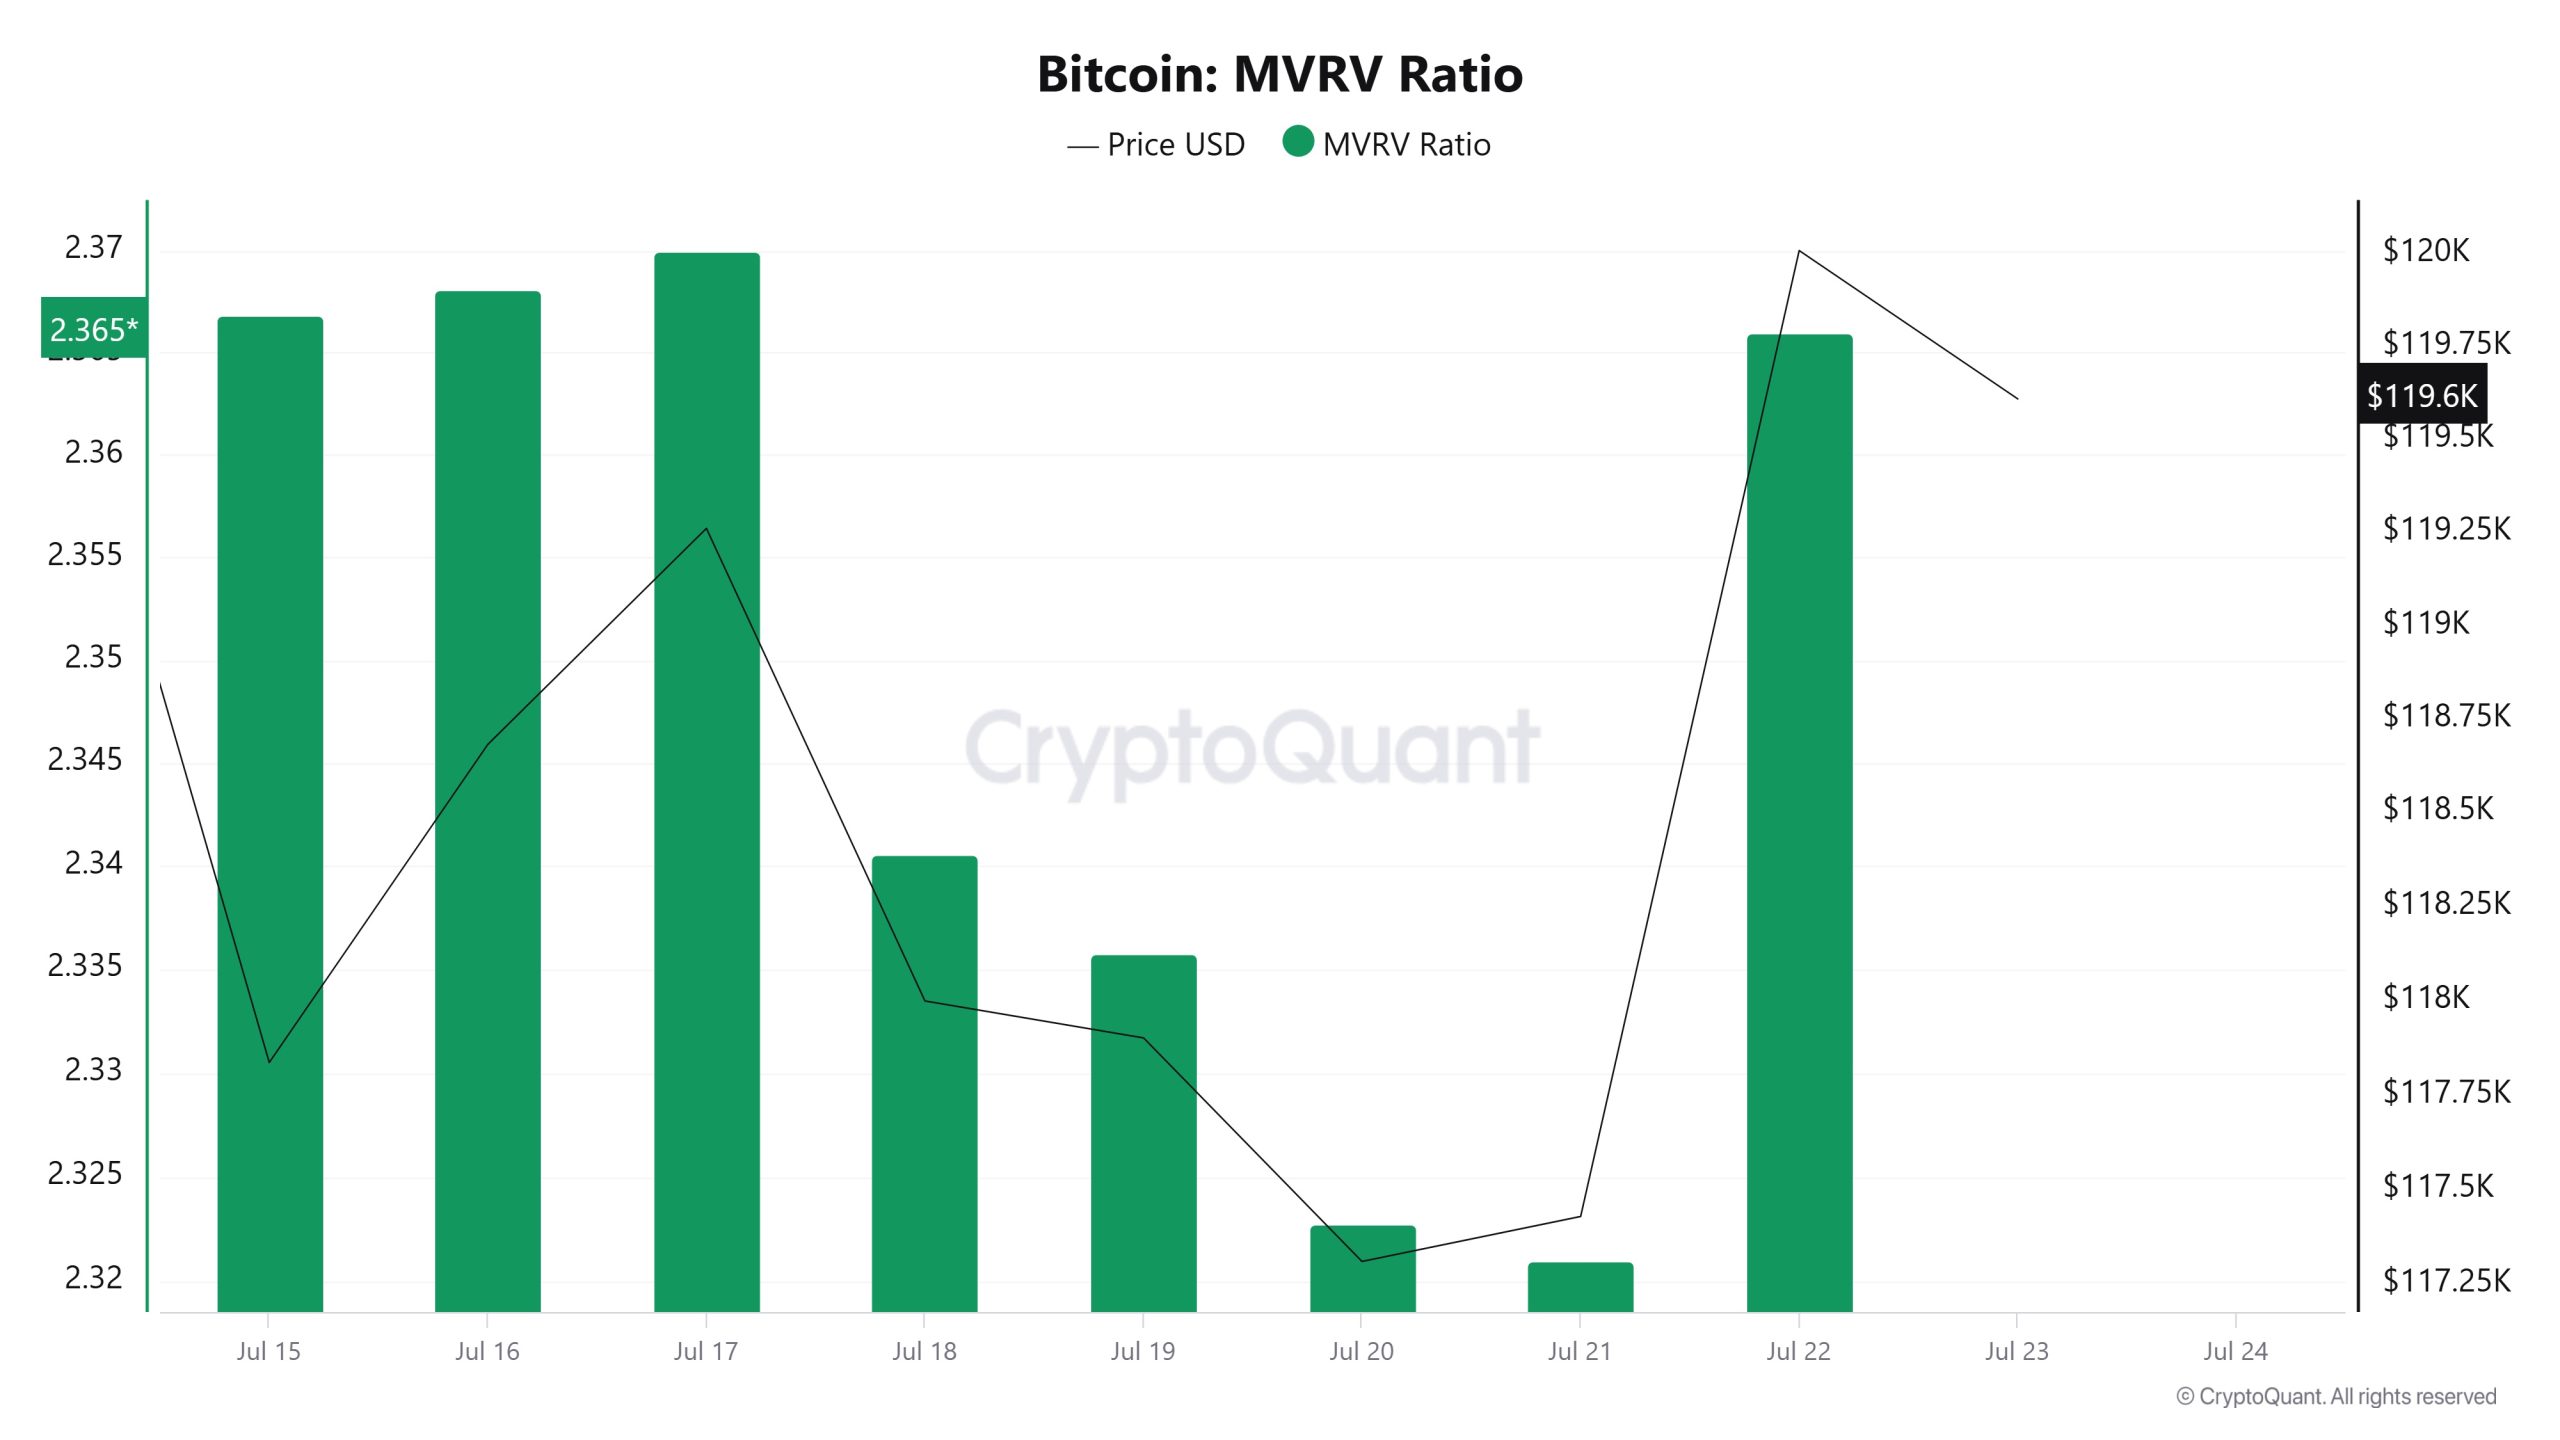
On 16 July, the Bitcoin price was at 118,682, while the MVRV Ratio was 2.368. As of 22 July, the Bitcoin price increased 1.11% to 120,009, while the MVRV Ratio decreased 0.13% to 2.365.
Realized Price
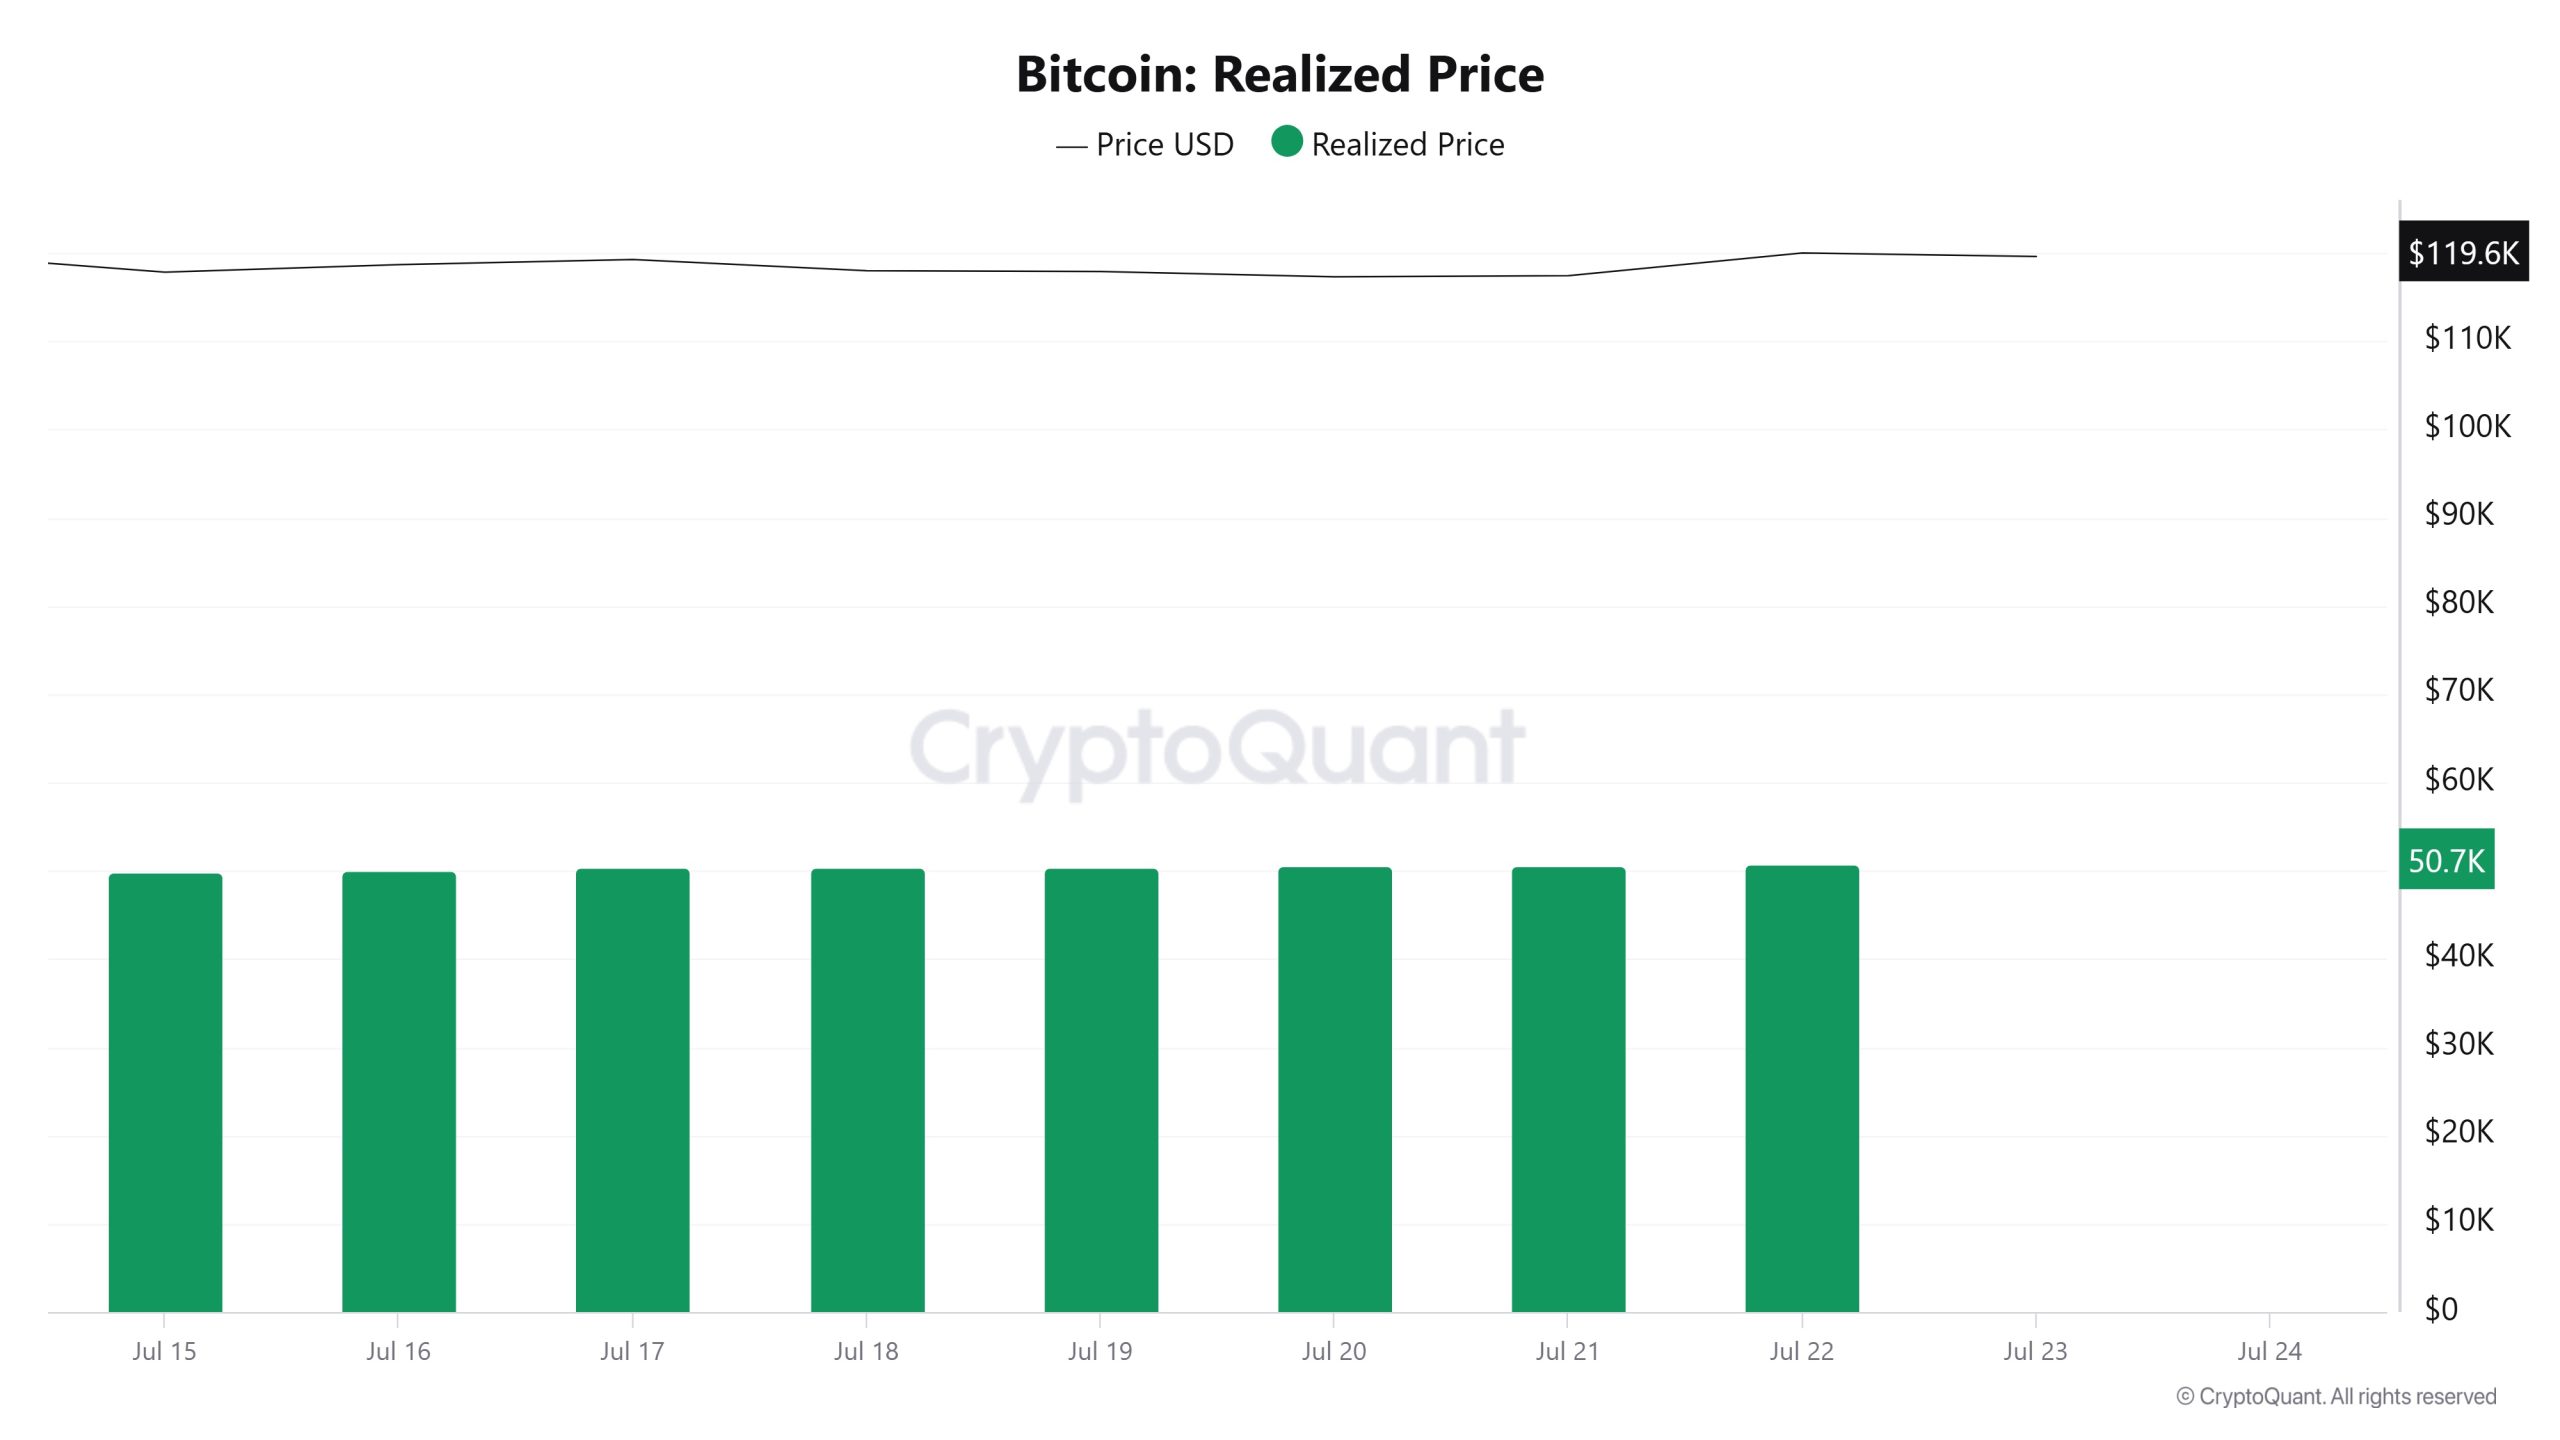
On 16 July, Bitcoin price was 118,682, while Realised Price was 50,117. As of 22 July, Bitcoin price increased 1.11% to 120,009, while Realised Price increased 1.21% to 50,723.
Spent Output Profit Ratio (SOPR)
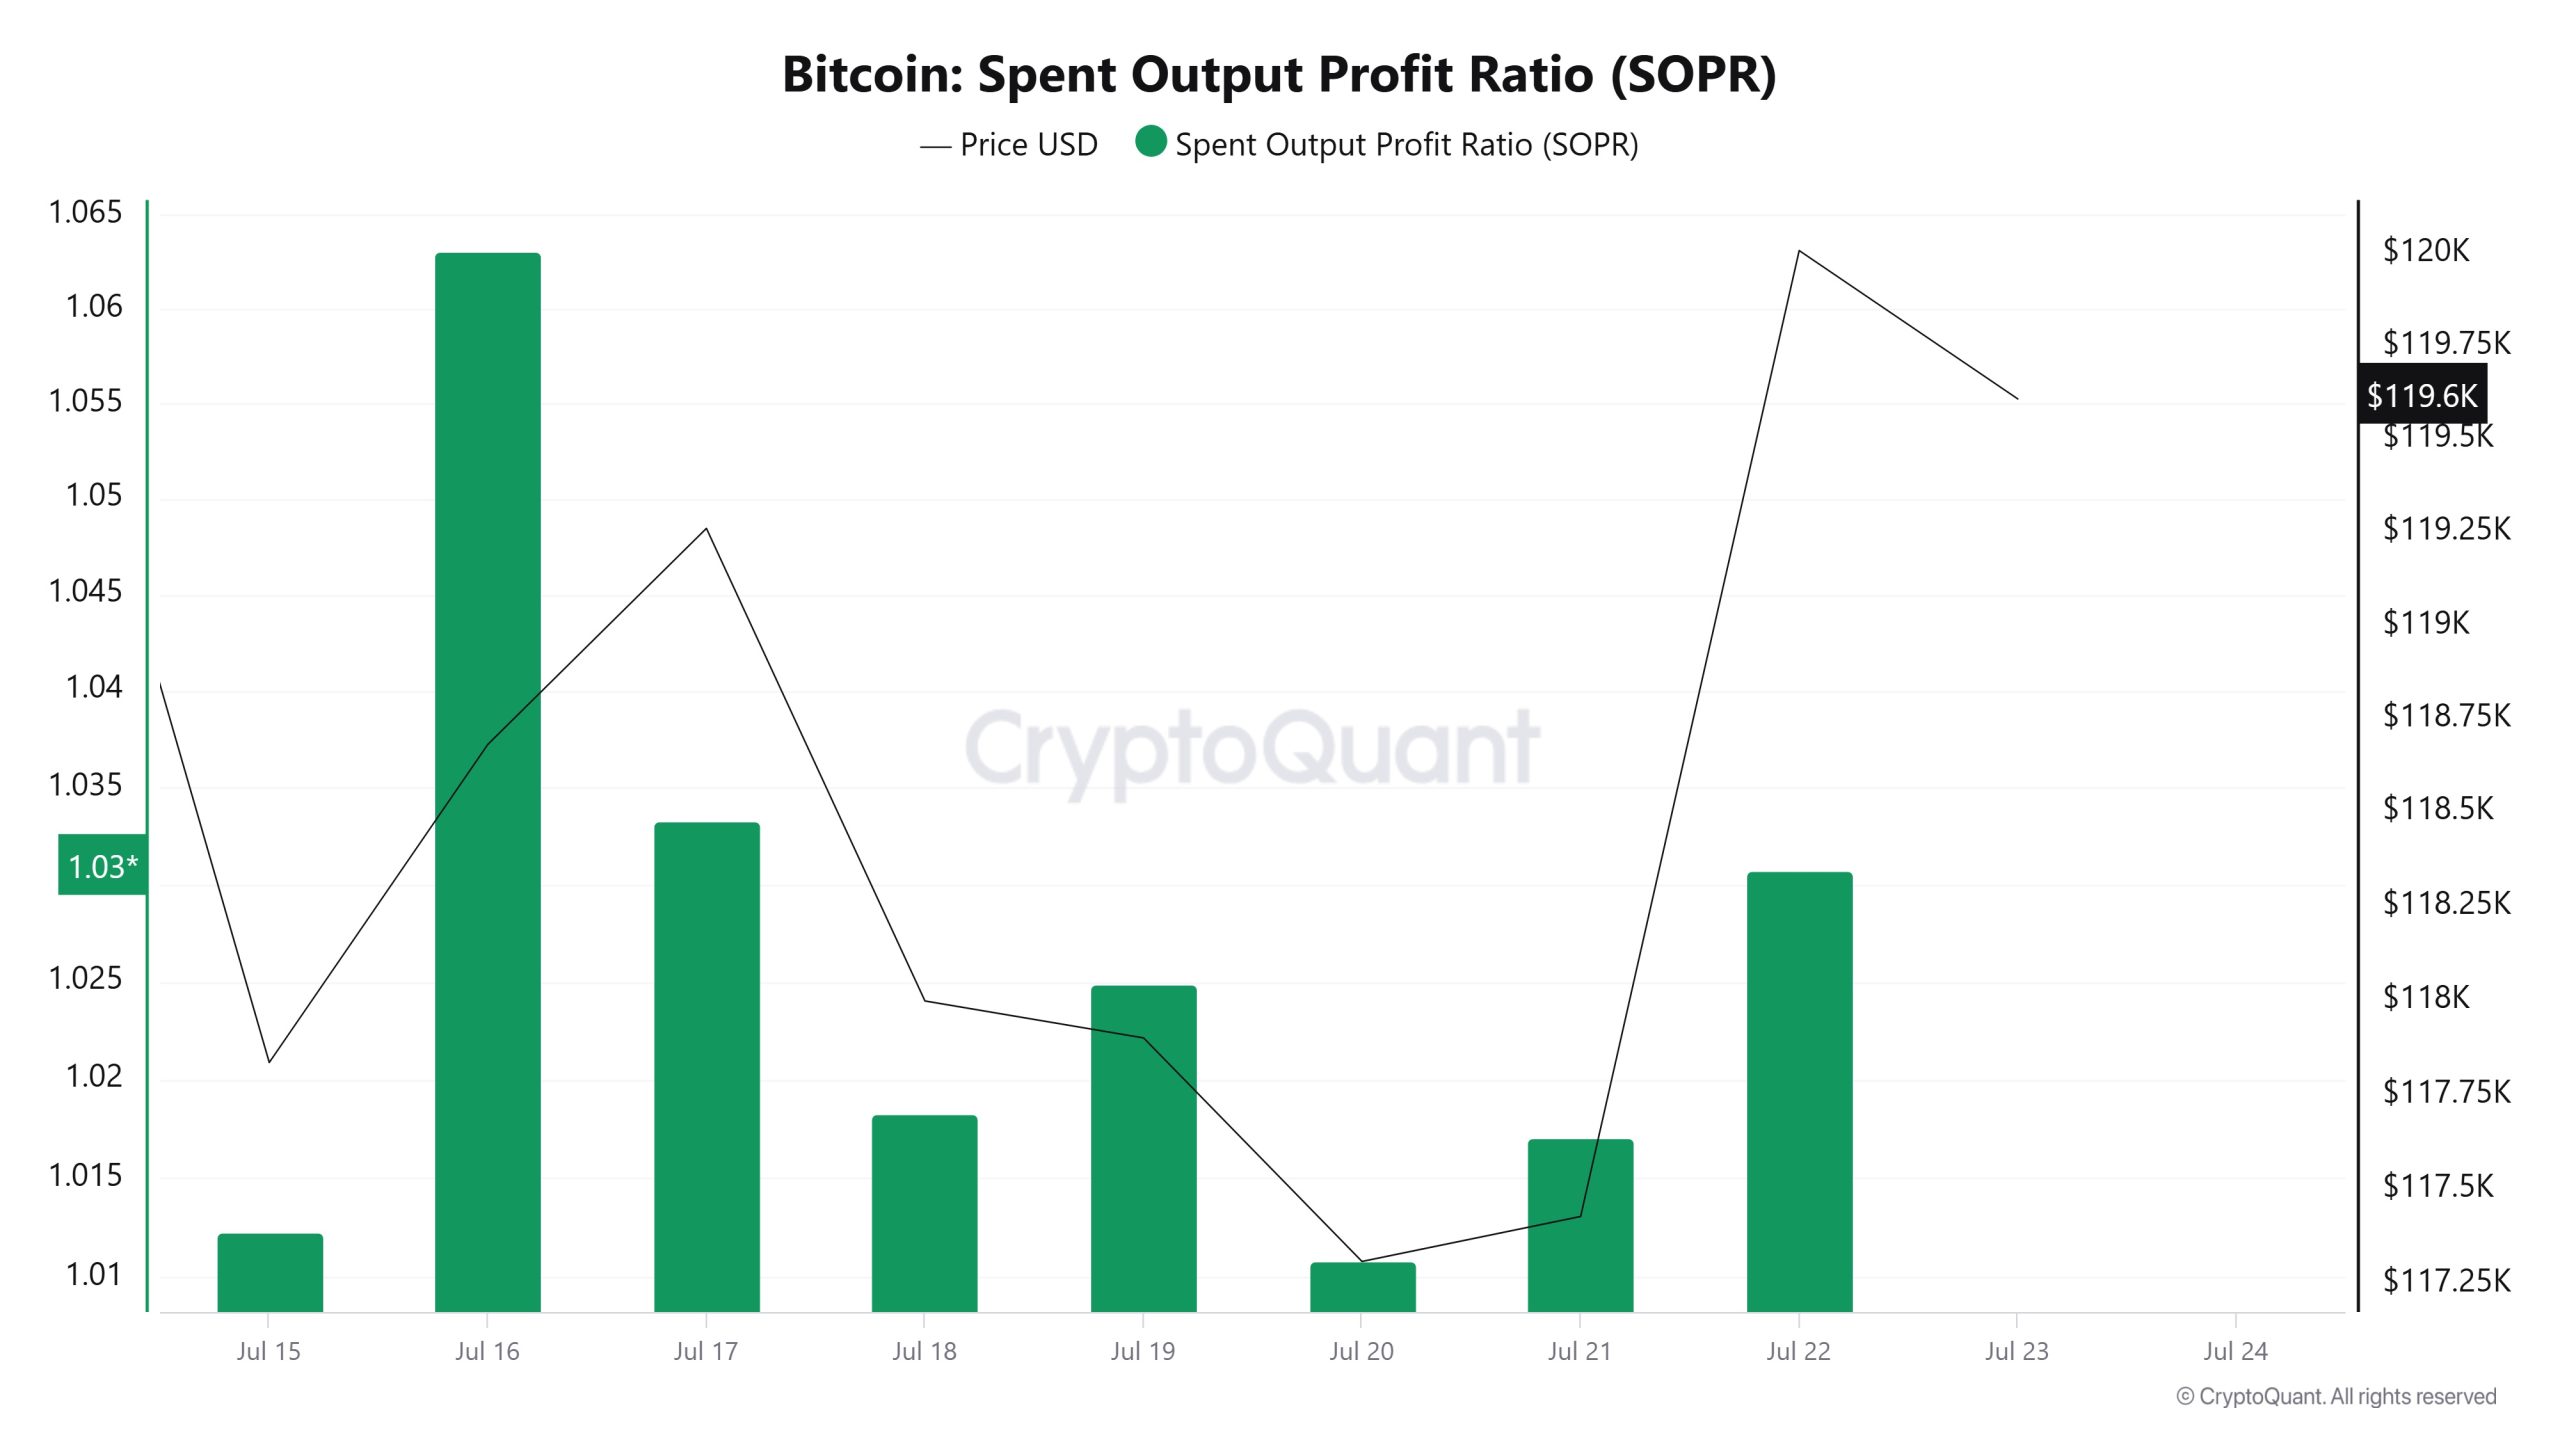
On 16 July, the Bitcoin price was at 118,682, while the SOPR metric was at 1,063. As of 22 July, the Bitcoin price increased 1.11% to 120,009, while the SOPR metric decreased 3.11% to 1,030.
Derivatives
Open Interest
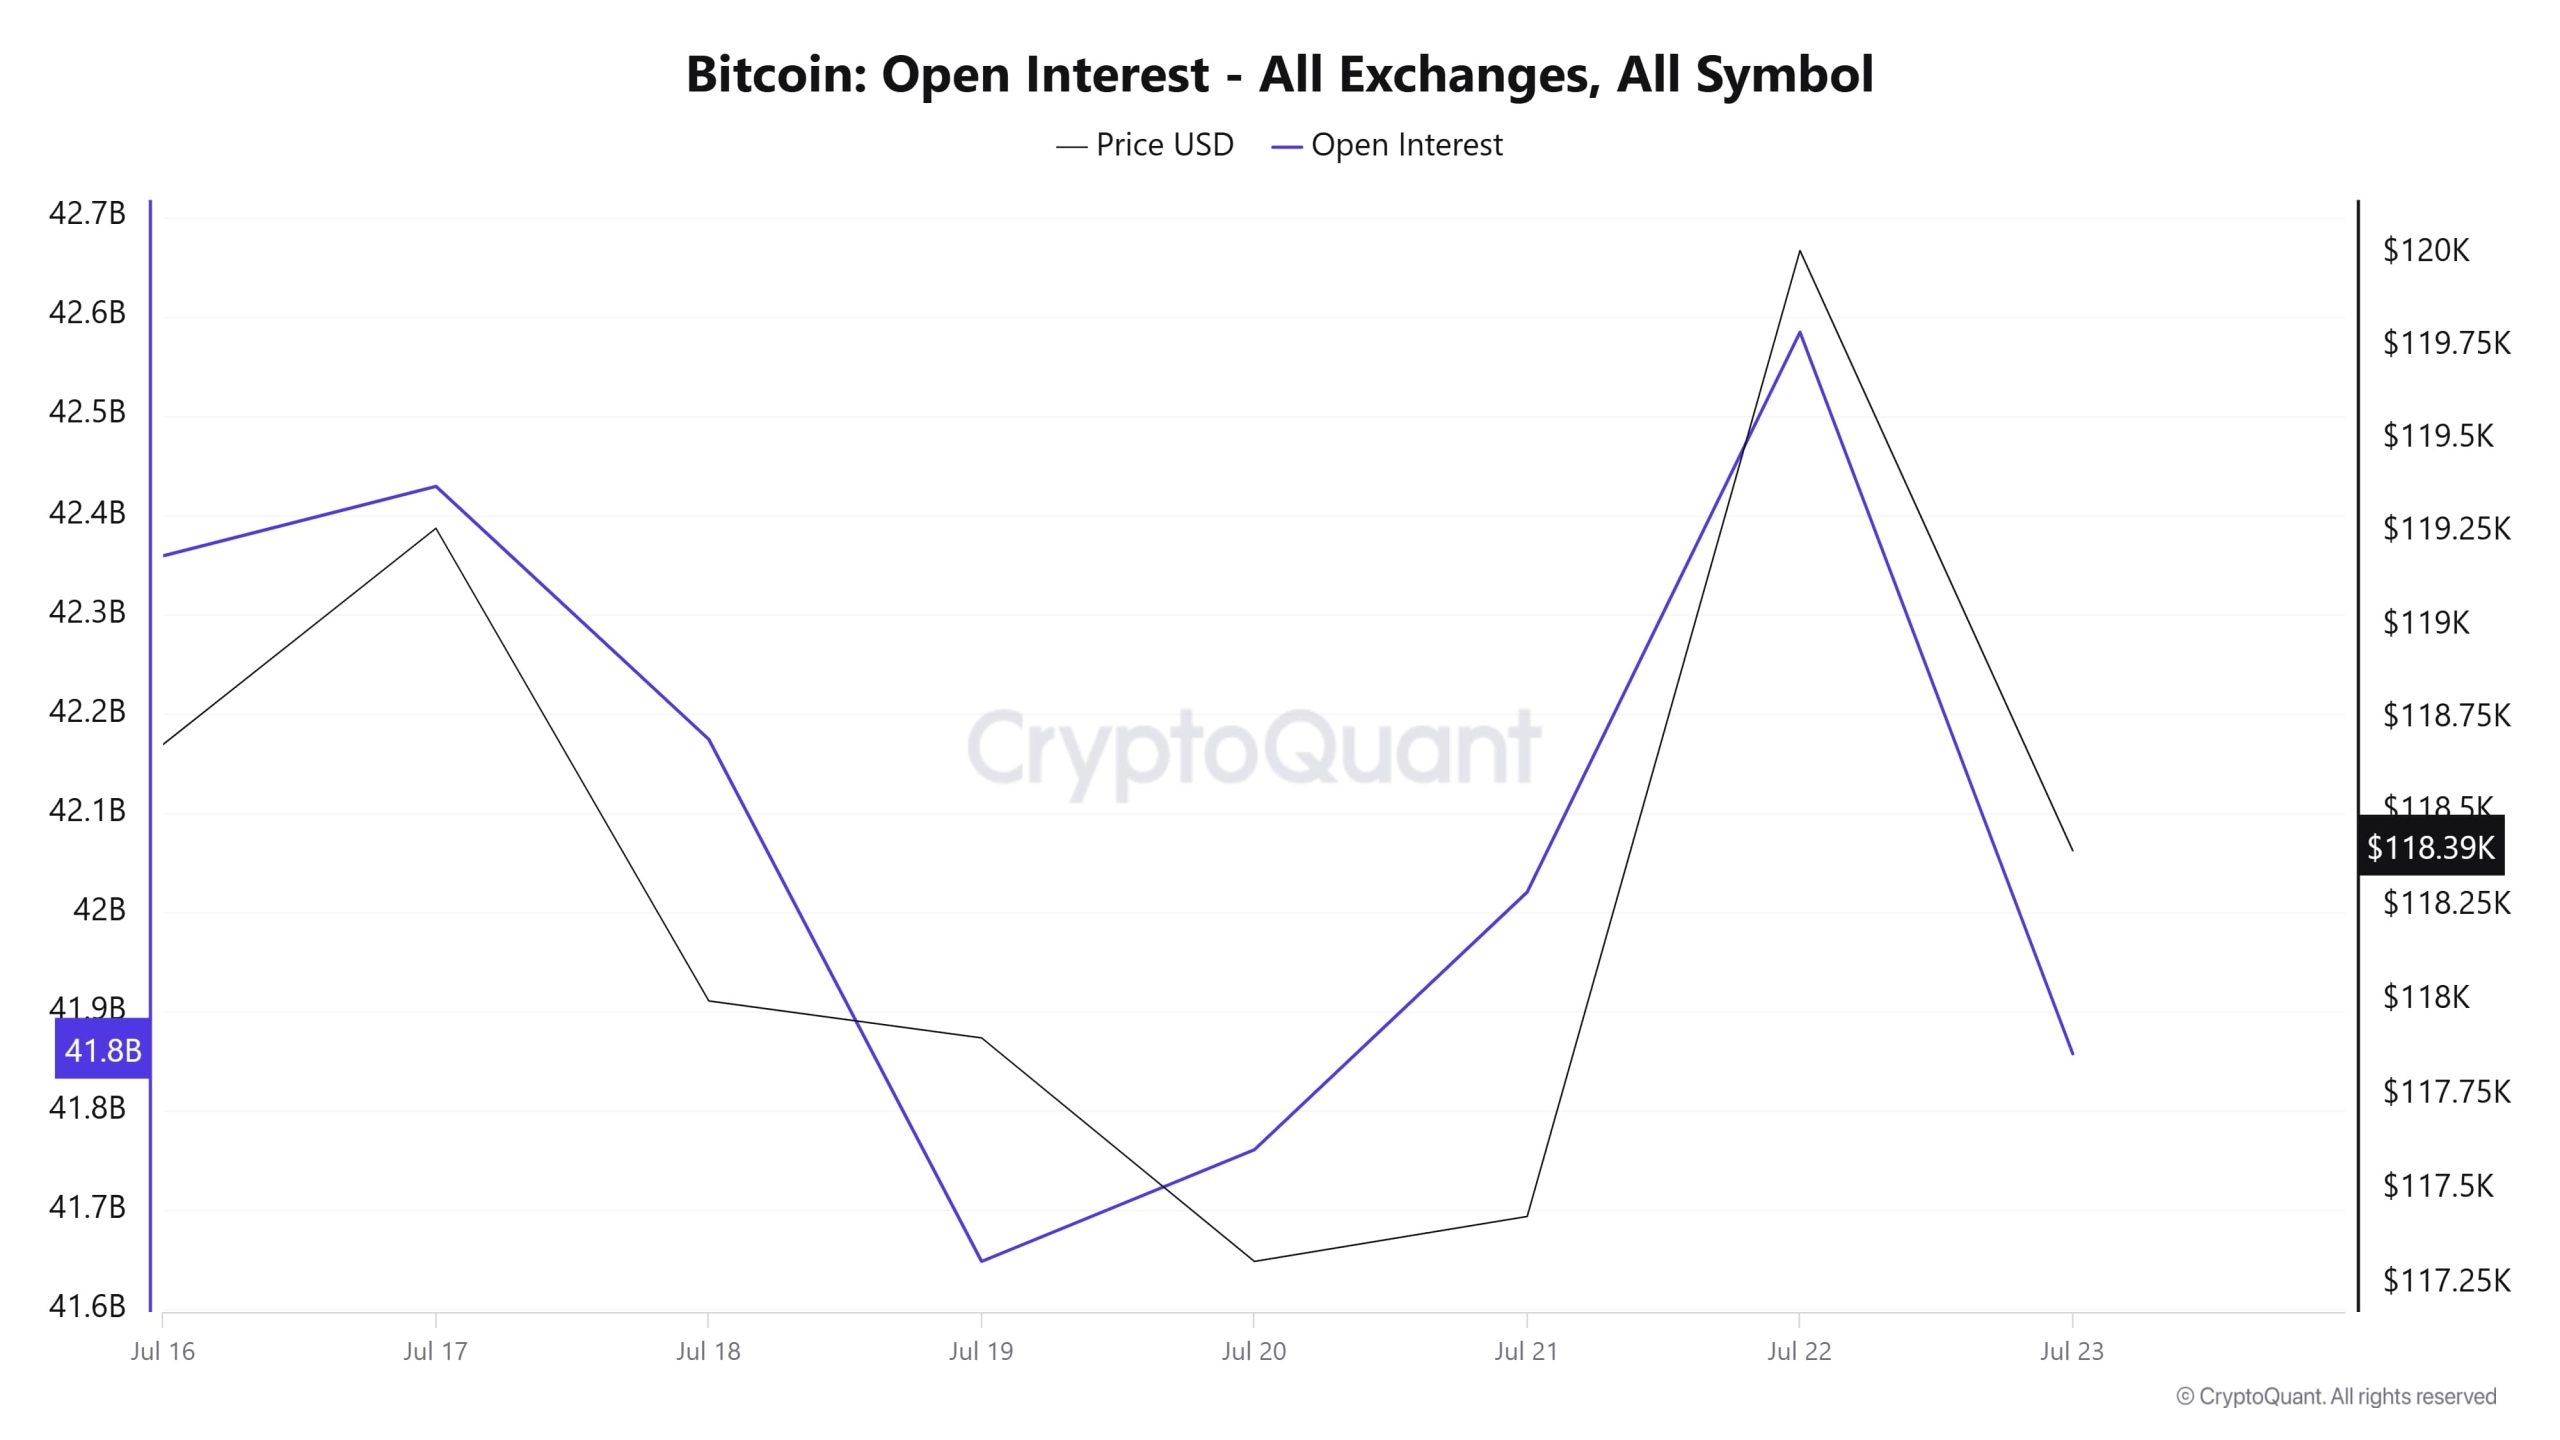
Bitcoin’s open interest data started with an upward trend from 16 July and reached up to $ 42.4 billion on 17 July. After this point, there was a remarkable decline in both price and open interest. As of 19 July, open interest declined to $ 41.65 billion. During this period, it can be thought that market participants tended to reduce their positions or liquidations intensified. After 20 July, a rapid recovery is noticeable. Both price and open interest rose together, reaching their peak levels on 22 July. This simultaneous increase indicates that re-entry to the market accelerated and speculative activity increased. However, this rise was not long-lasting and as of 23 July, both price and open interest started to decline again. In the latest situation, the price is hovering around $118,390, while open interest has fallen to around $41.8 billion. In general, it is seen that open interest movements are quite compatible with the price and profit realisations are effective, especially after sudden outflows.
Funding Rate
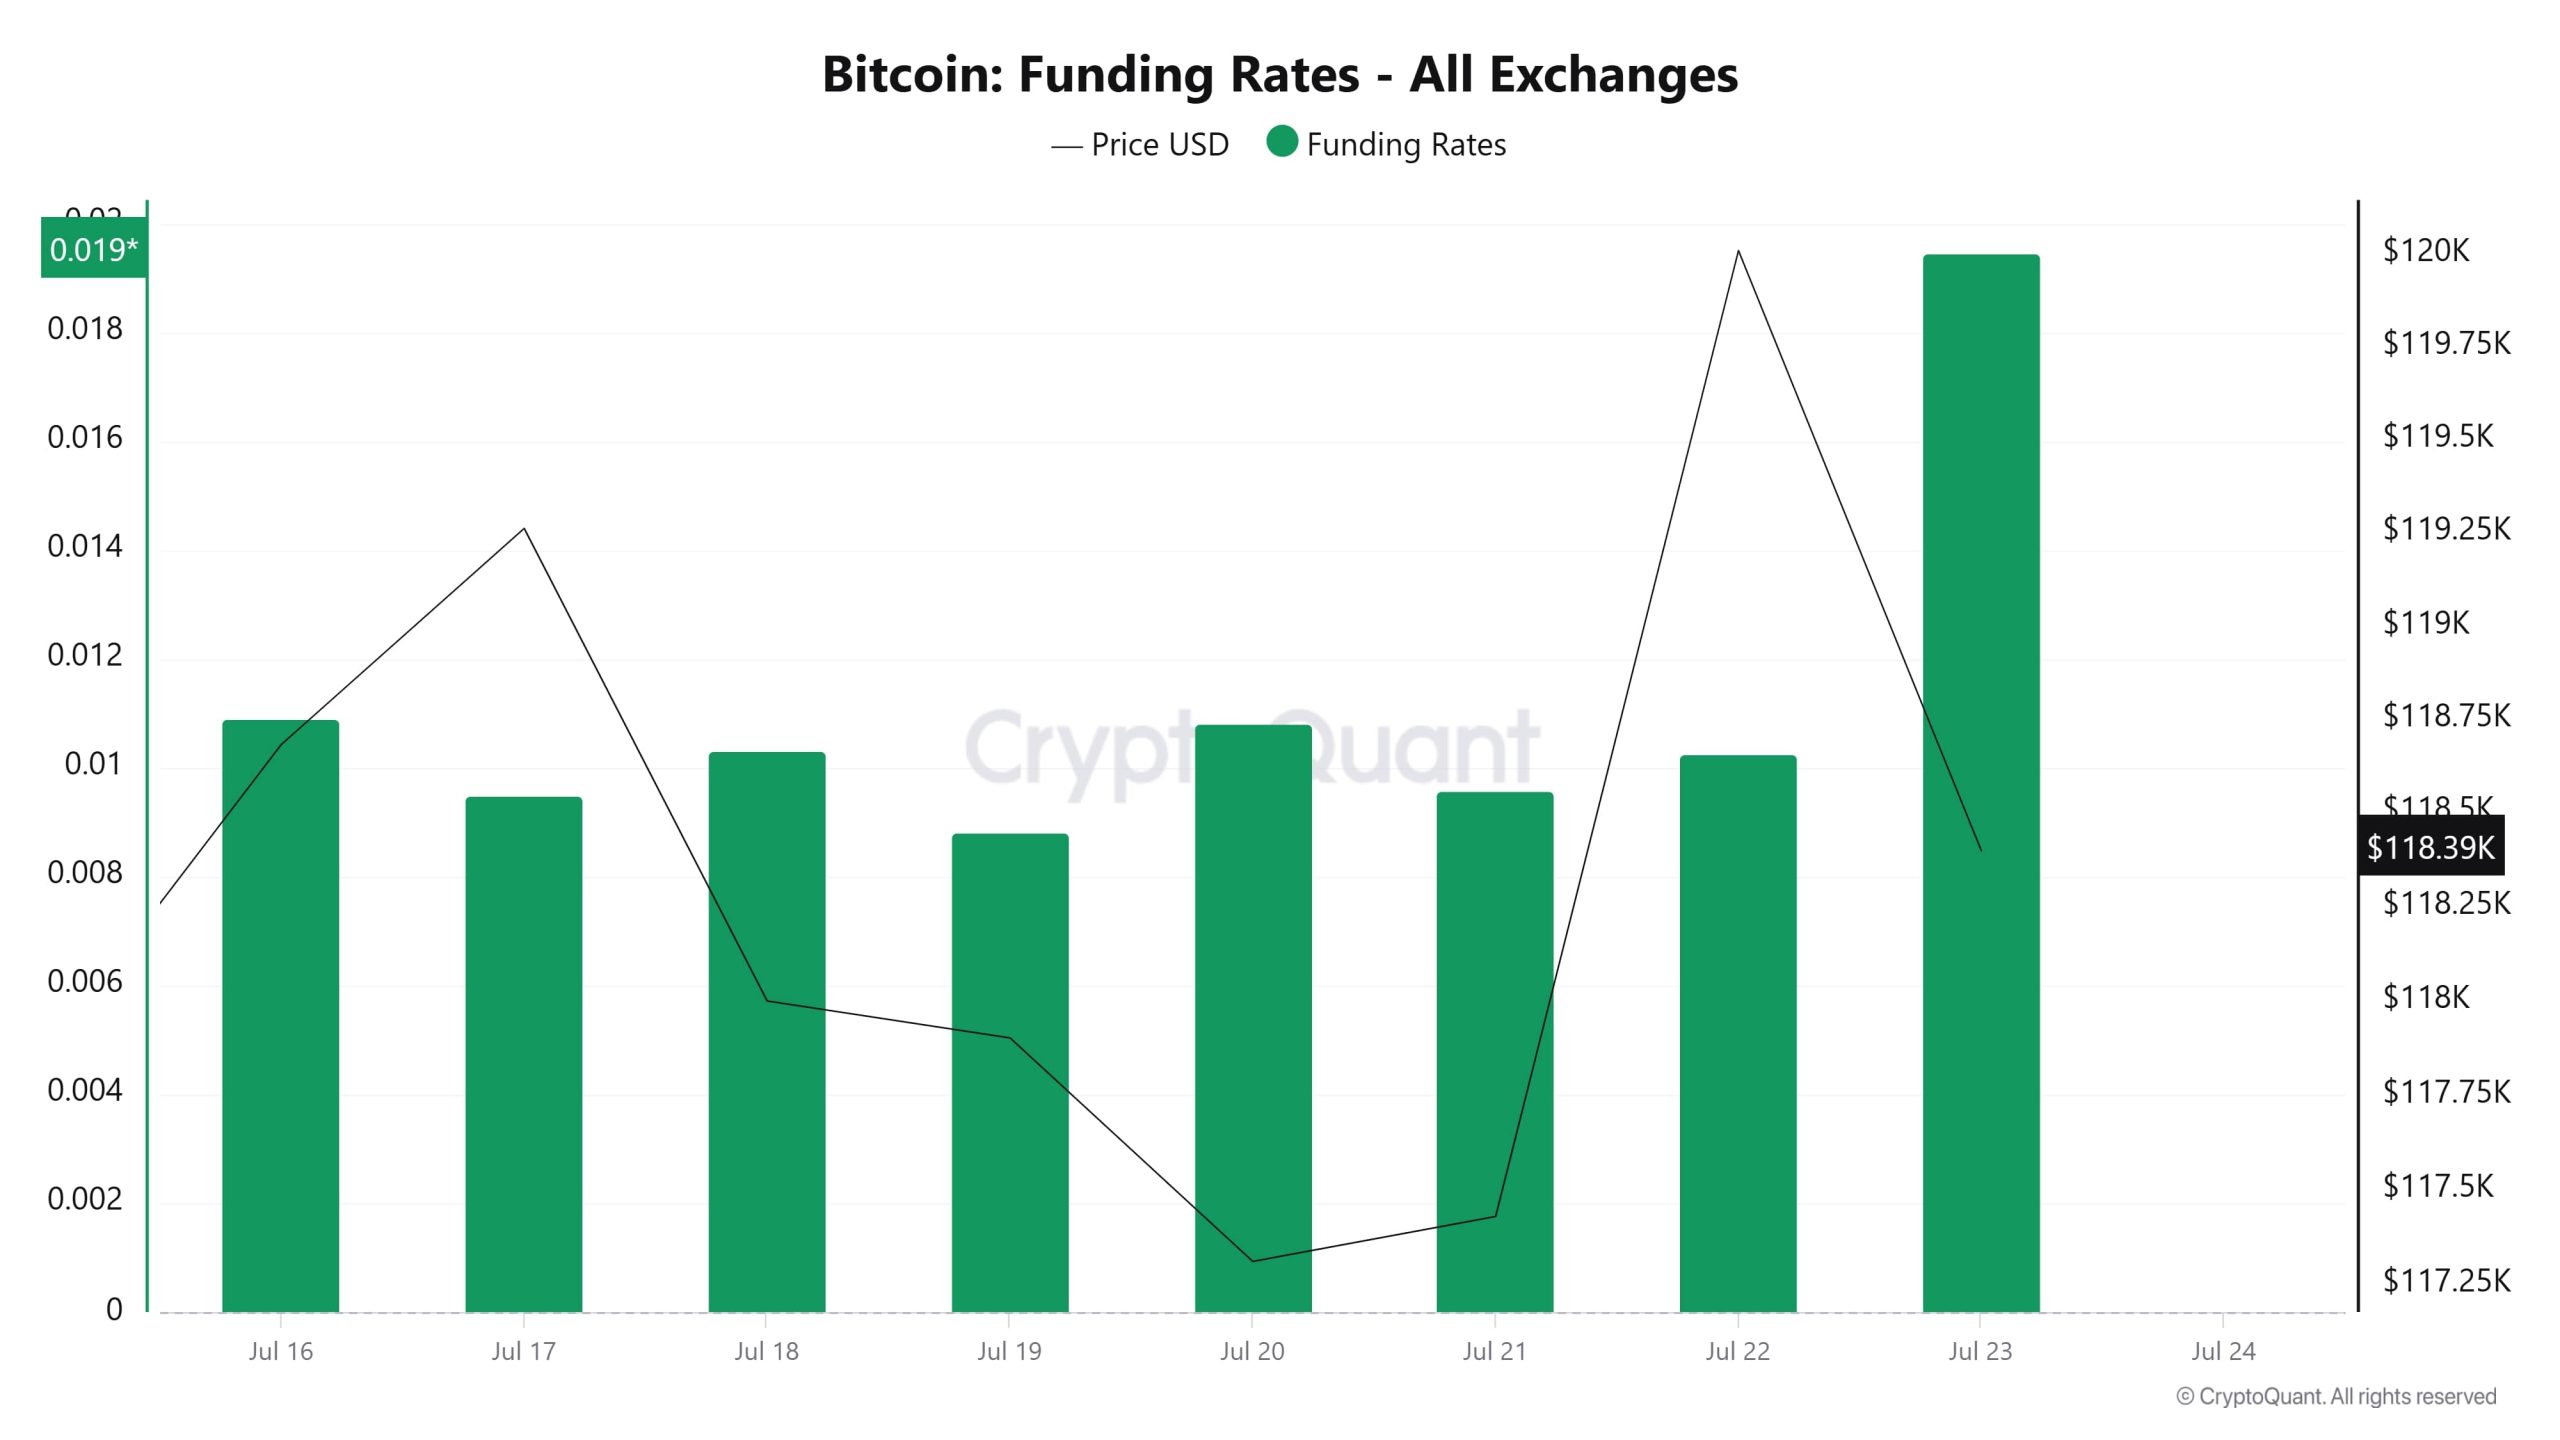
Funding rate data generally remained in positive territory. The ratio, which started around 0.011 on 16 July, declined slightly on 17 July, but moved upwards again between 18 and 20 July. Especially on 20 July, the funding rate reached around 0.0105, indicating that long positions regained weight. Although the price is still weak at this point, long positions seem to have increased as traders’ bullish expectations are maintained. On 23 July, the funding rate reached 0.019, reaching the highest value of the last period. This indicates that excessive optimism and long leveraged positions have intensified in the market. Such high rates usually increase the probability of a correction in the short term.
Long & Short Liquidations
Last week, there were short-weighted liquidations with BTC moving between $ 116,000 and $ 120,500. 260 million dollars of long and 320 million dollars of short transactions were liquidated.
| Date | Long Amount (Million $) | Short Amount (Million $) |
|---|---|---|
| 16 July | 16.82 | 68.41 |
| 17 July | 27.02 | 101.93 |
| 18 July | 135.68 | 24.58 |
| 19 July | 6.11 | 15.63 |
| 20 July | 20.98 | 13.58 |
| 21 July | 32.06 | 68.84 |
| 22 July | 22.04 | 27.83 |
| Total | 260.71 | 320.80 |
Supply Distribution
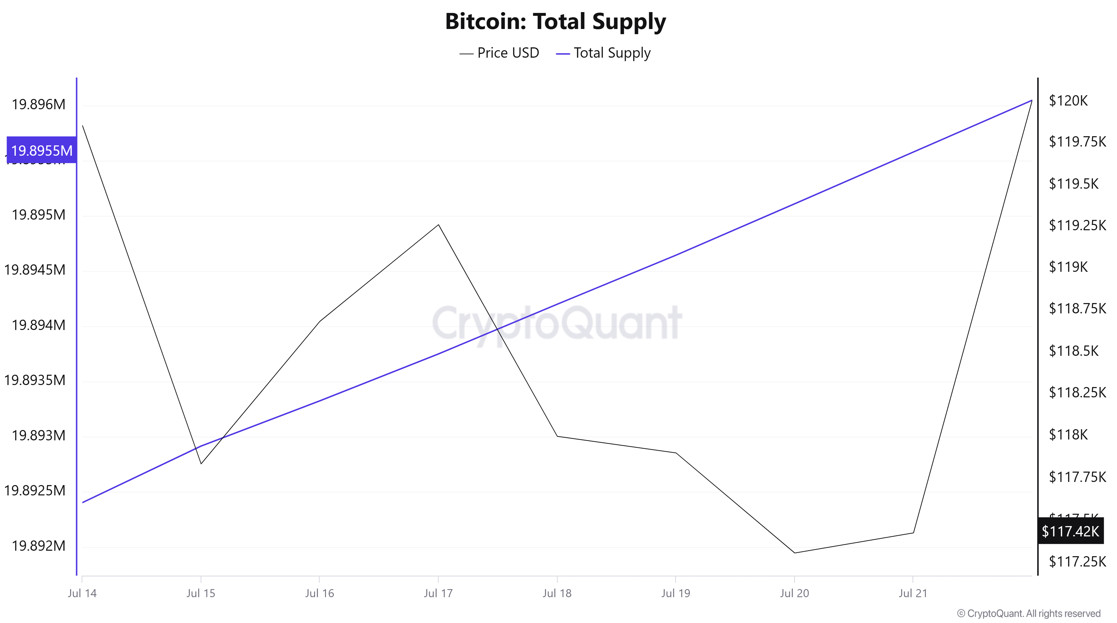
Total Supply: It reached 19,895,577 units, up about 0.0326% from last week.
New Supply: The amount of BTC produced this week was 6,481.
Velocity: The velocity, which was 12.68 last week, was 12.70 as of 21 July.
| Wallet Category | 14.07.2025 | 21.07.2025 | Change (%) |
|---|---|---|---|
| < 1 BTC | 8.4528% | 8.4555% | +0.0319% |
| 1 – 10 BTC | 11.3981% | 11.3903% | –0.0684% |
| 10 – 100 BTC | 24.7238% | 24.6163% | –0.4347% |
| 100 – 1k BTC | 29.1060% | 29.4272% | +1.1022% |
| 1k – 10k BTC | 18.3204% | 18.3698% | +0.2692% |
| 10k+ BTC | 7.9985% | 7.7405% | –3.2257% |
According to the latest weekly data, a mixed outlook in Bitcoin wallet distribution draws attention. While there was a limited decrease of -0.16% in <1 BTC wallets, a decrease of -0.18% was observed in the 1-10 BTC range. In contrast, slight increases of +0.23% in the 10-100 BTC segment and +0.08% in the 100-1k BTC range attracted attention. A limited increase of +0.09% stood out in the 1k-10k BTC group, while a more pronounced decrease of -0.76% was seen in the 10k+ BTC category.
Exchange Reserve
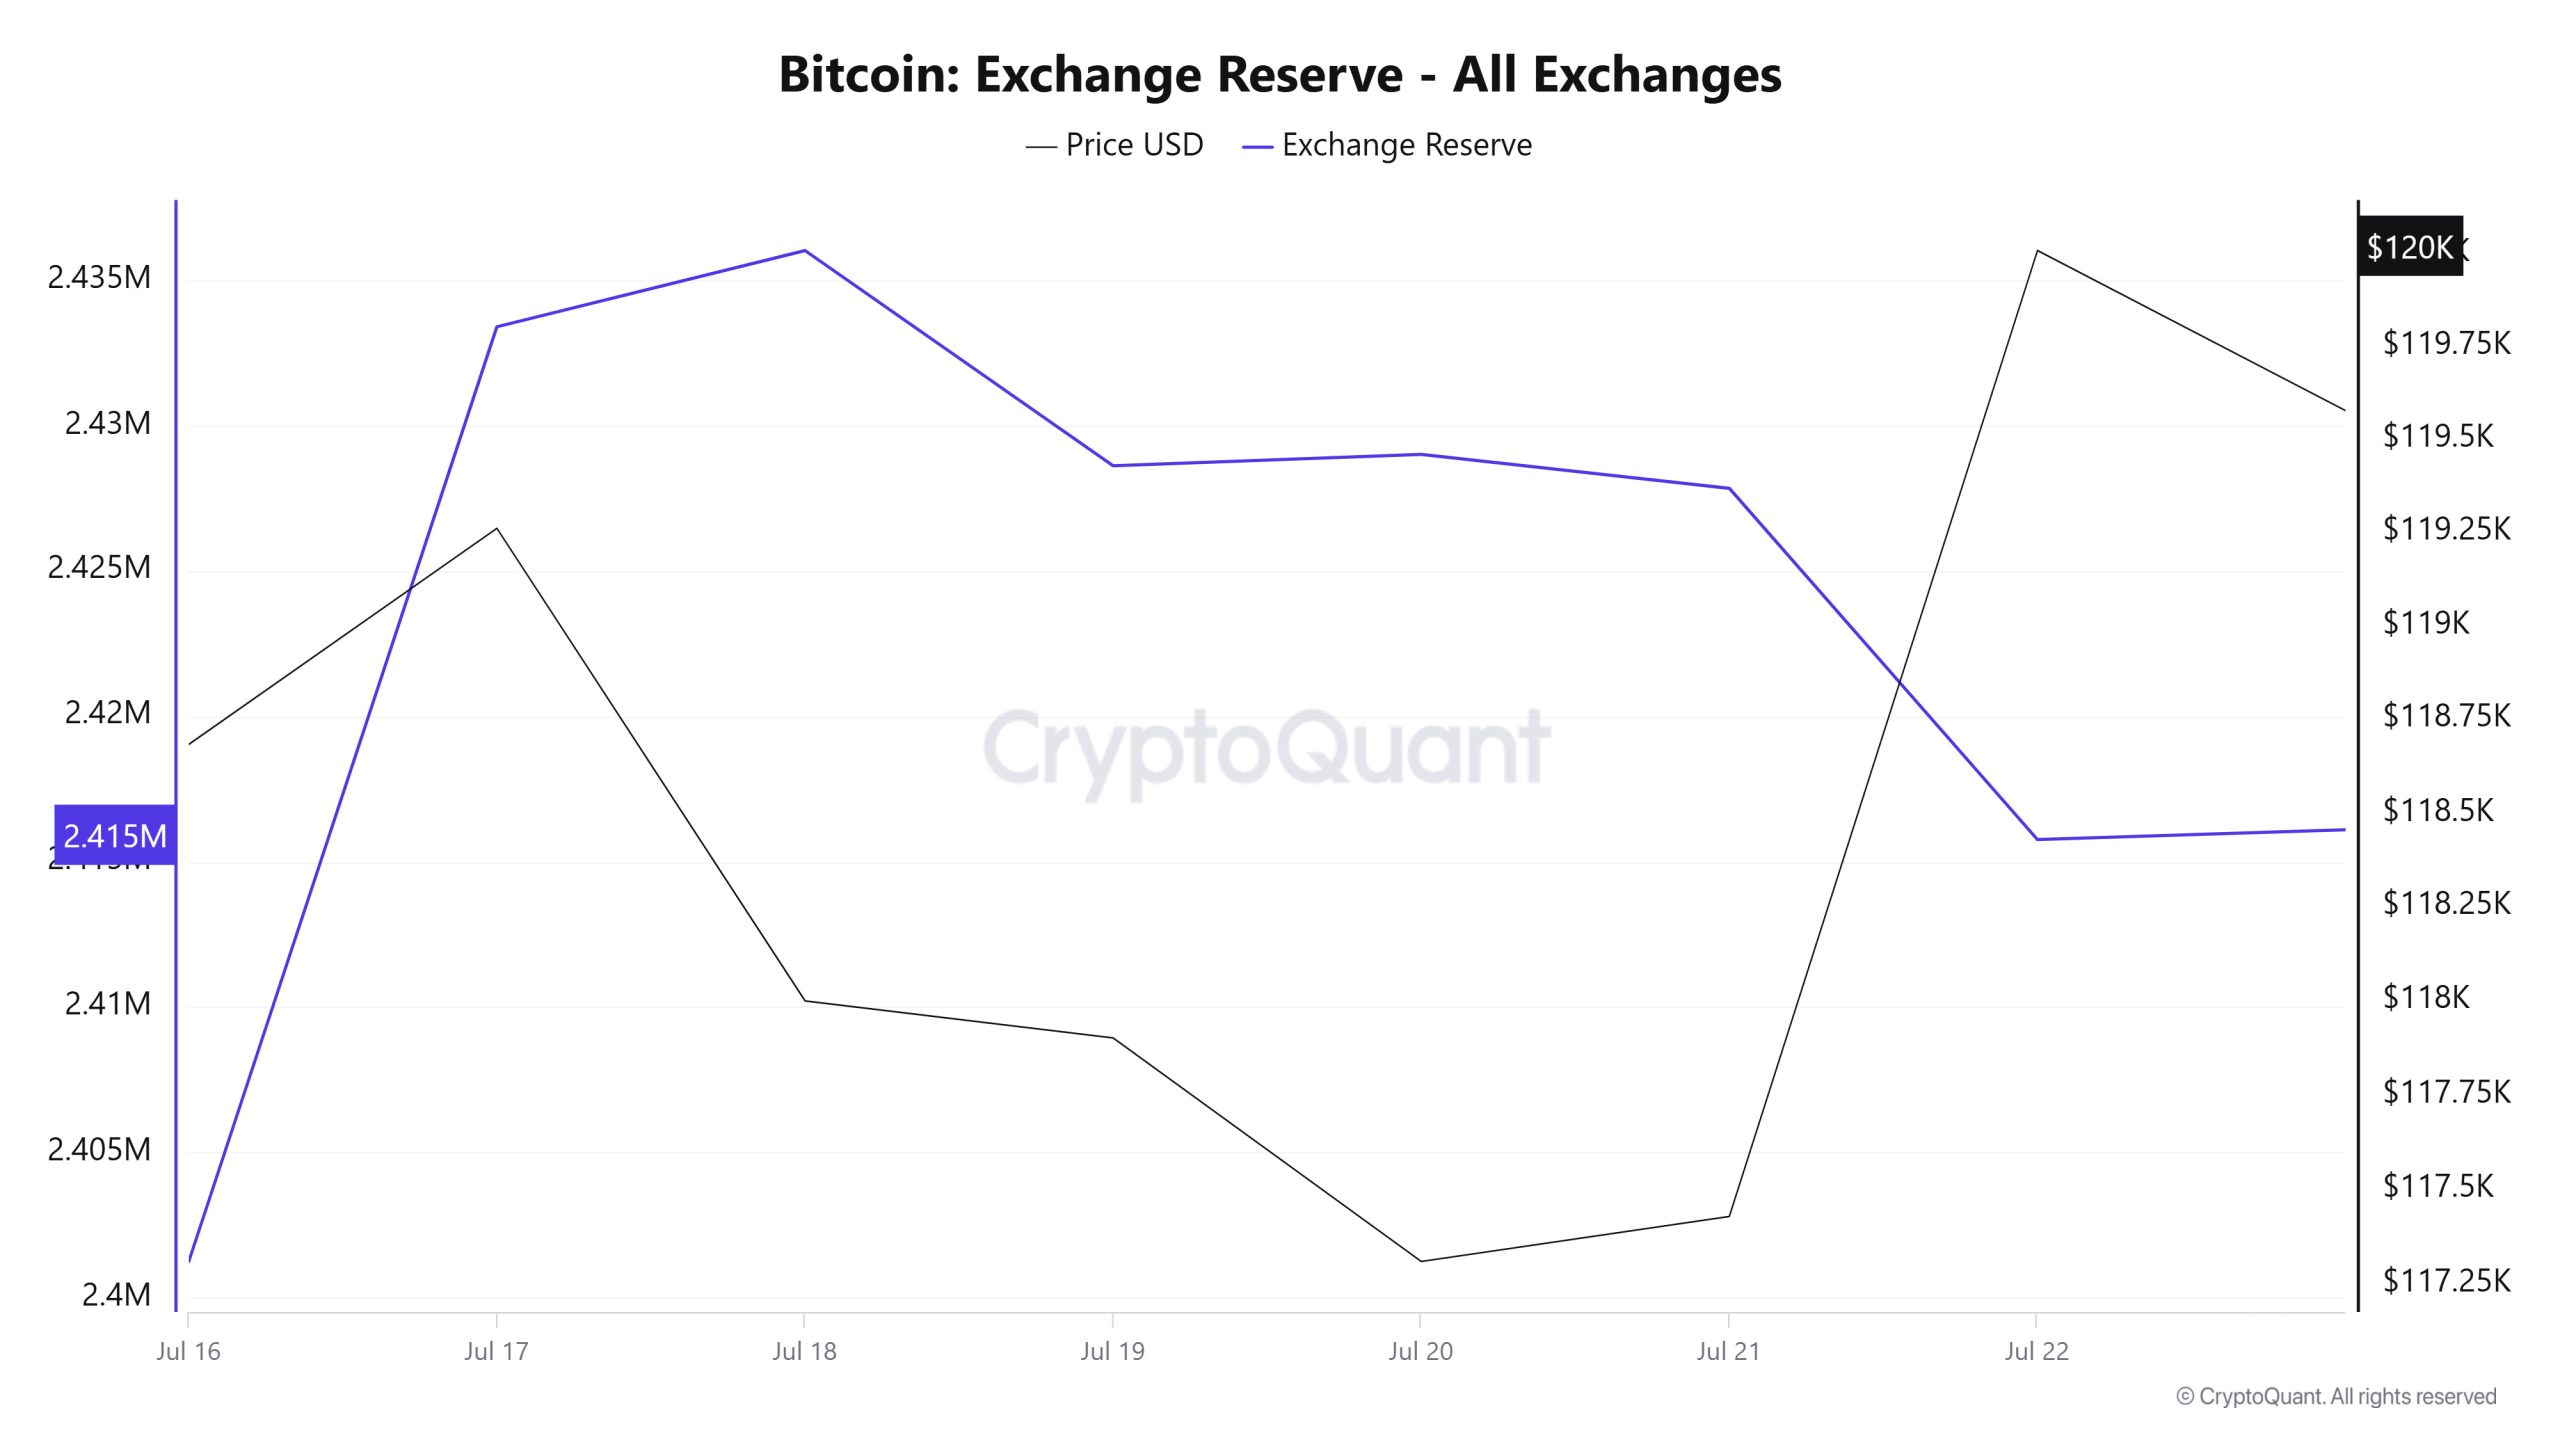
Between 16-22 July 2025, Bitcoin reserves on exchanges increased from 2,401,251 BTC to 2,415,760 BTC. During this period, there was a total net inflow of 14,509 BTC and an increase of approximately 0.6% in exchange reserves. In the same period, the Bitcoin price rose from $ 118,682 to $ 120,009, gaining 1.1%. Although the price remains resistant, indicating strong demand in the short term, the increase in BTC inflows to exchanges may create selling pressure in the coming days. Therefore, a cautiously optimistic outlook for the market stands out.
| Date | 16-Jul | 17-Jul | 18-Jul | 19-Jul | 20-Jul | 21-Jul | 22-Jul |
|---|---|---|---|---|---|---|---|
| Exchange Inflow | 47,782 | 90,510 | 43,506 | 10,596 | 12,663 | 35,449 | 25,286 |
| Exchange Outflow | 58,870 | 58,366 | 40,883 | 17,997 | 12,273 | 36,614 | 37,369 |
| Exchange Netflow | -11,088 | 32,144 | 2,622 | -7,401 | 390 | -1,165 | -12,083 |
| Exchange Reserve | 2,401,251 | 2,433,396 | 2,436,018 | 2,428,618 | 2,429,008 | 2,427,843 | 2,415,760 |
| BTC Price | 118,682 | 119,261 | 117,999 | 117,901 | 117,308 | 117,427 | 120,009 |
Fees and Revenues
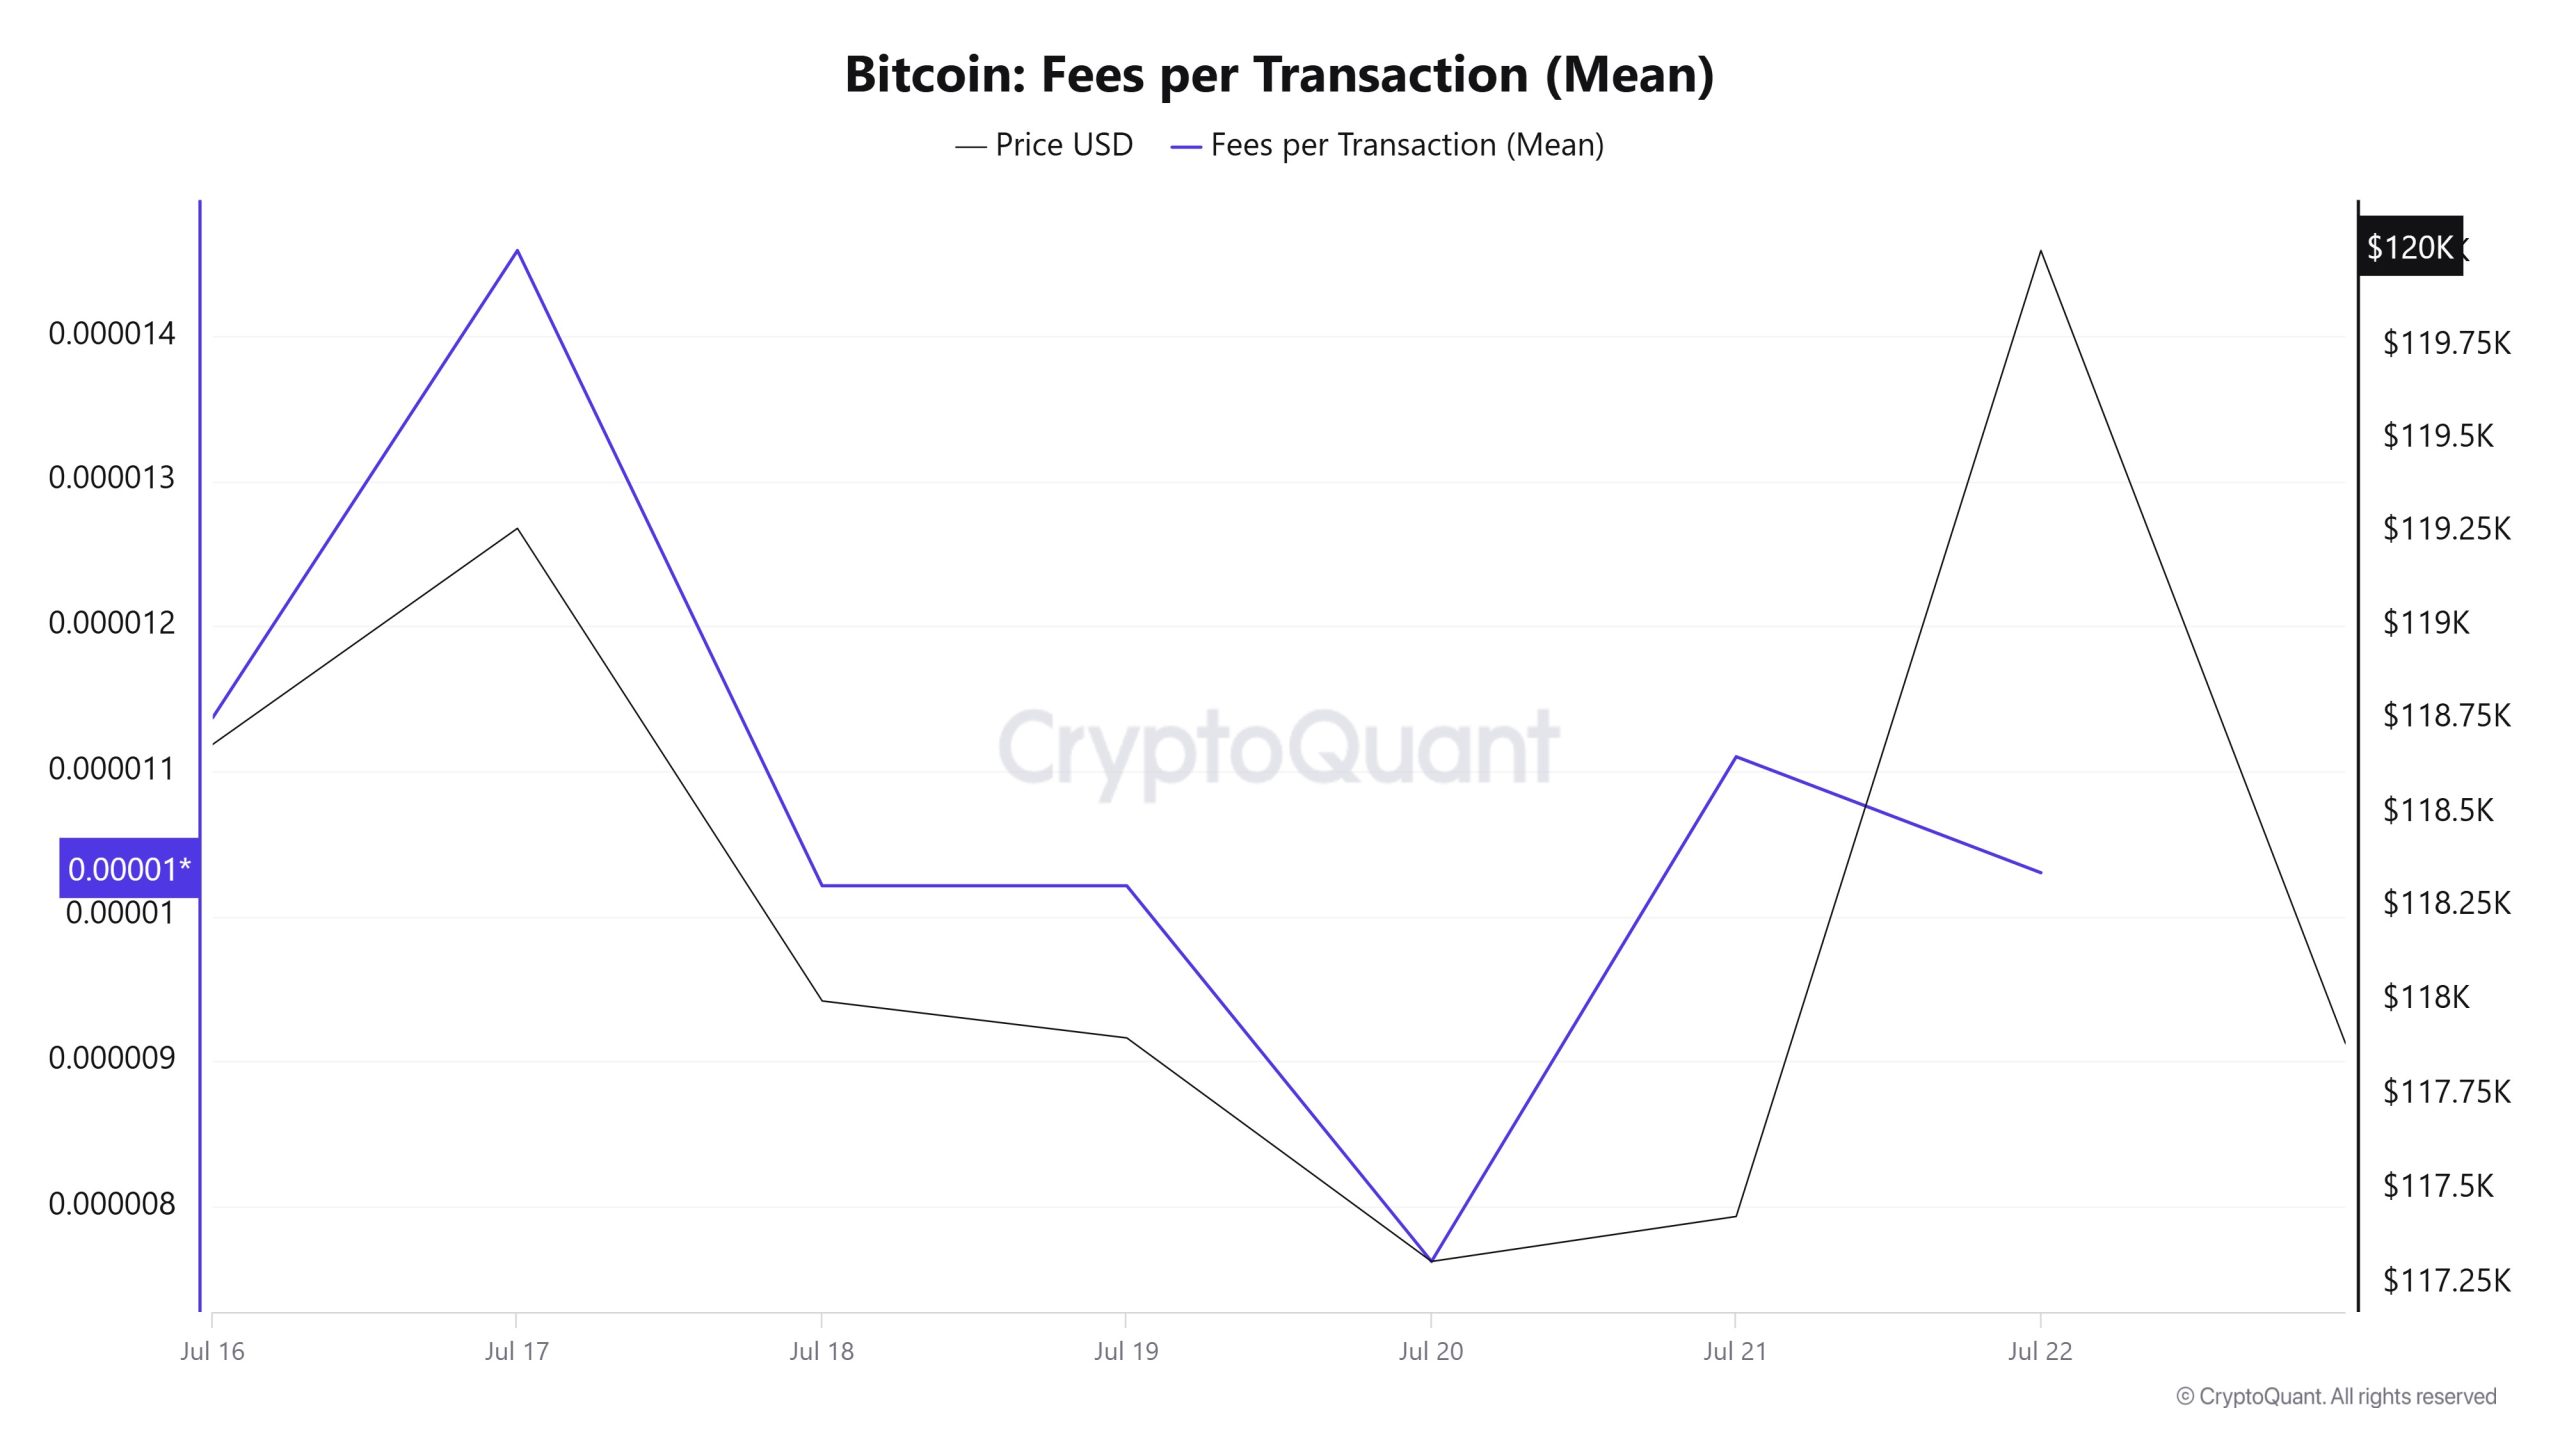
When Bitcoin Fees per Transaction (Mean) data between 16 and 22 July are examined, it is seen that this indicator was at the level of 0.00001137 on 16 July, the first day of the week.
As of this date, a fluctuating course was observed due to the volatile movements in the Bitcoin price; As of 20 July, it reached 0.00000762, reaching the lowest level of the week.
In the following days, Bitcoin Fees per Transaction (Mean) started to rise again and closed at 0.0000103 on 22 July, the last day of the week.
Bitcoin: Fees (Total)
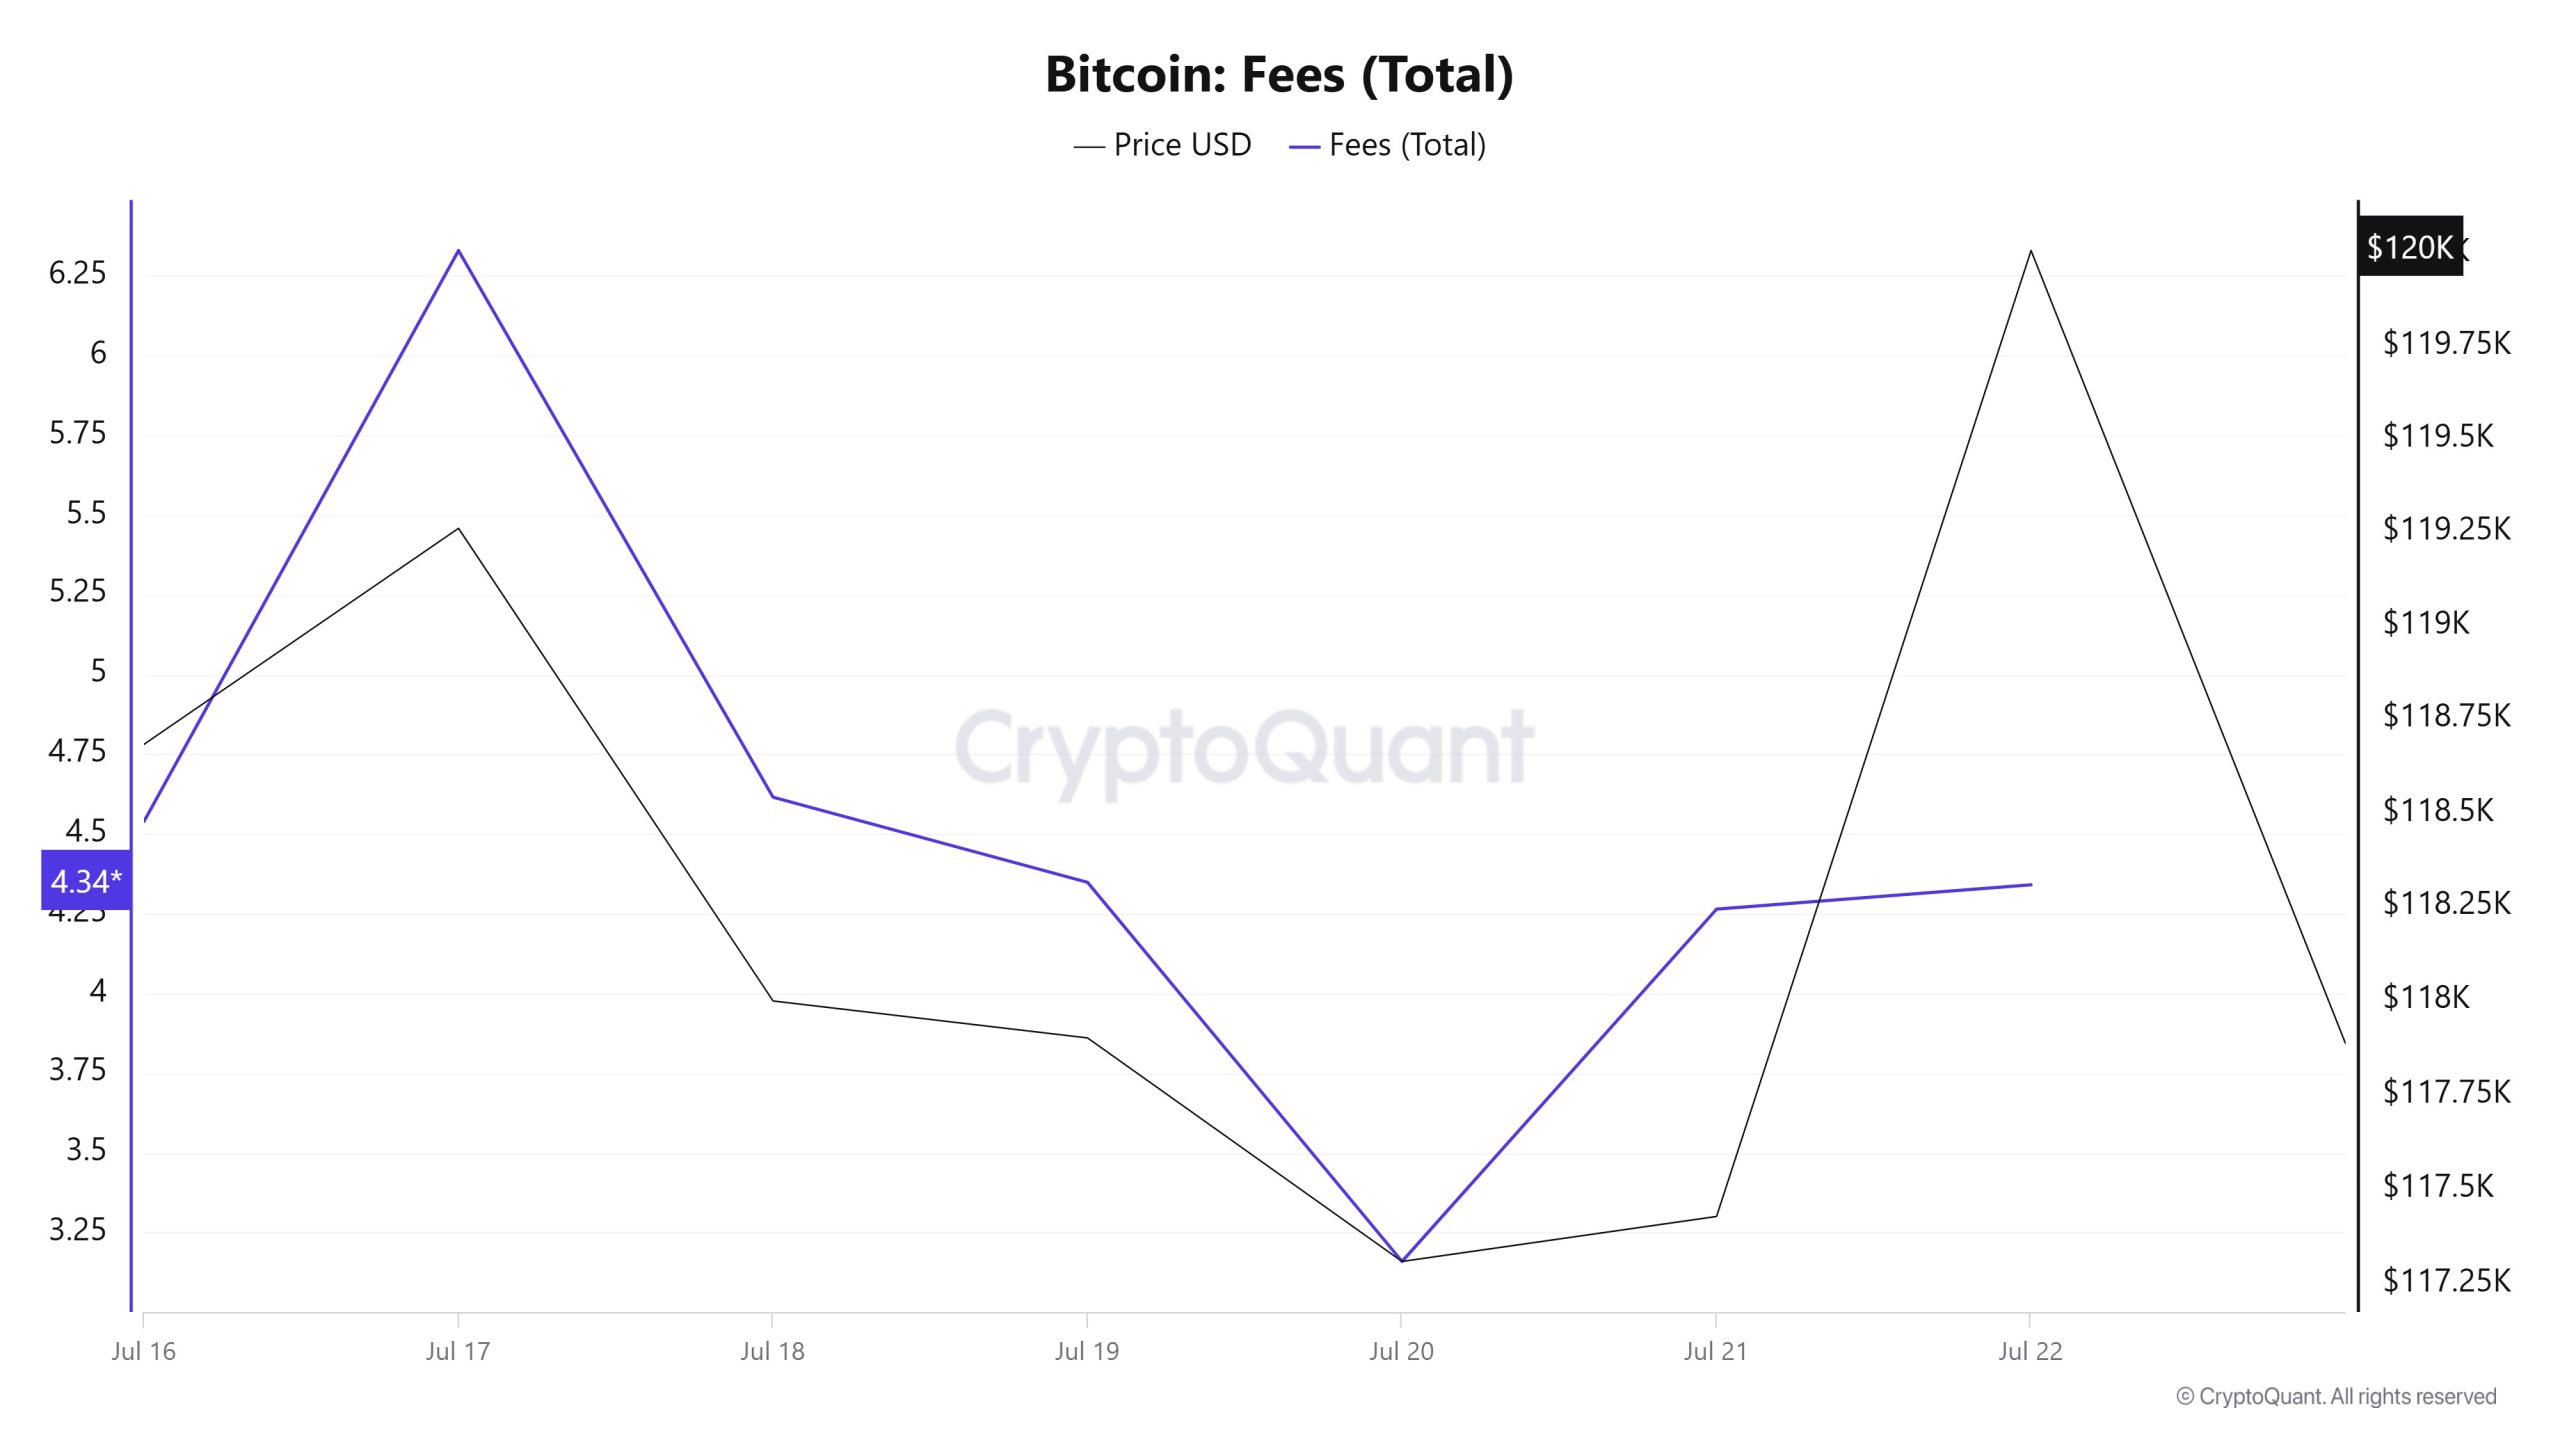
Similarly, when Bitcoin Fees (Total) data between 16 and 22 July are examined, it is seen that this indicator was 4.5393282 on 16 July, the first day of the week.
As of this date, a fluctuating course was observed due to the volatile movements in the Bitcoin price; As of 20 July, it reached 3.15968918, reaching the lowest level of the week.
In the following days, Bitcoin Fees (Total) started to rise again and closed at 4.34082471 on 22 July, the last day of the week.
Miner Flows
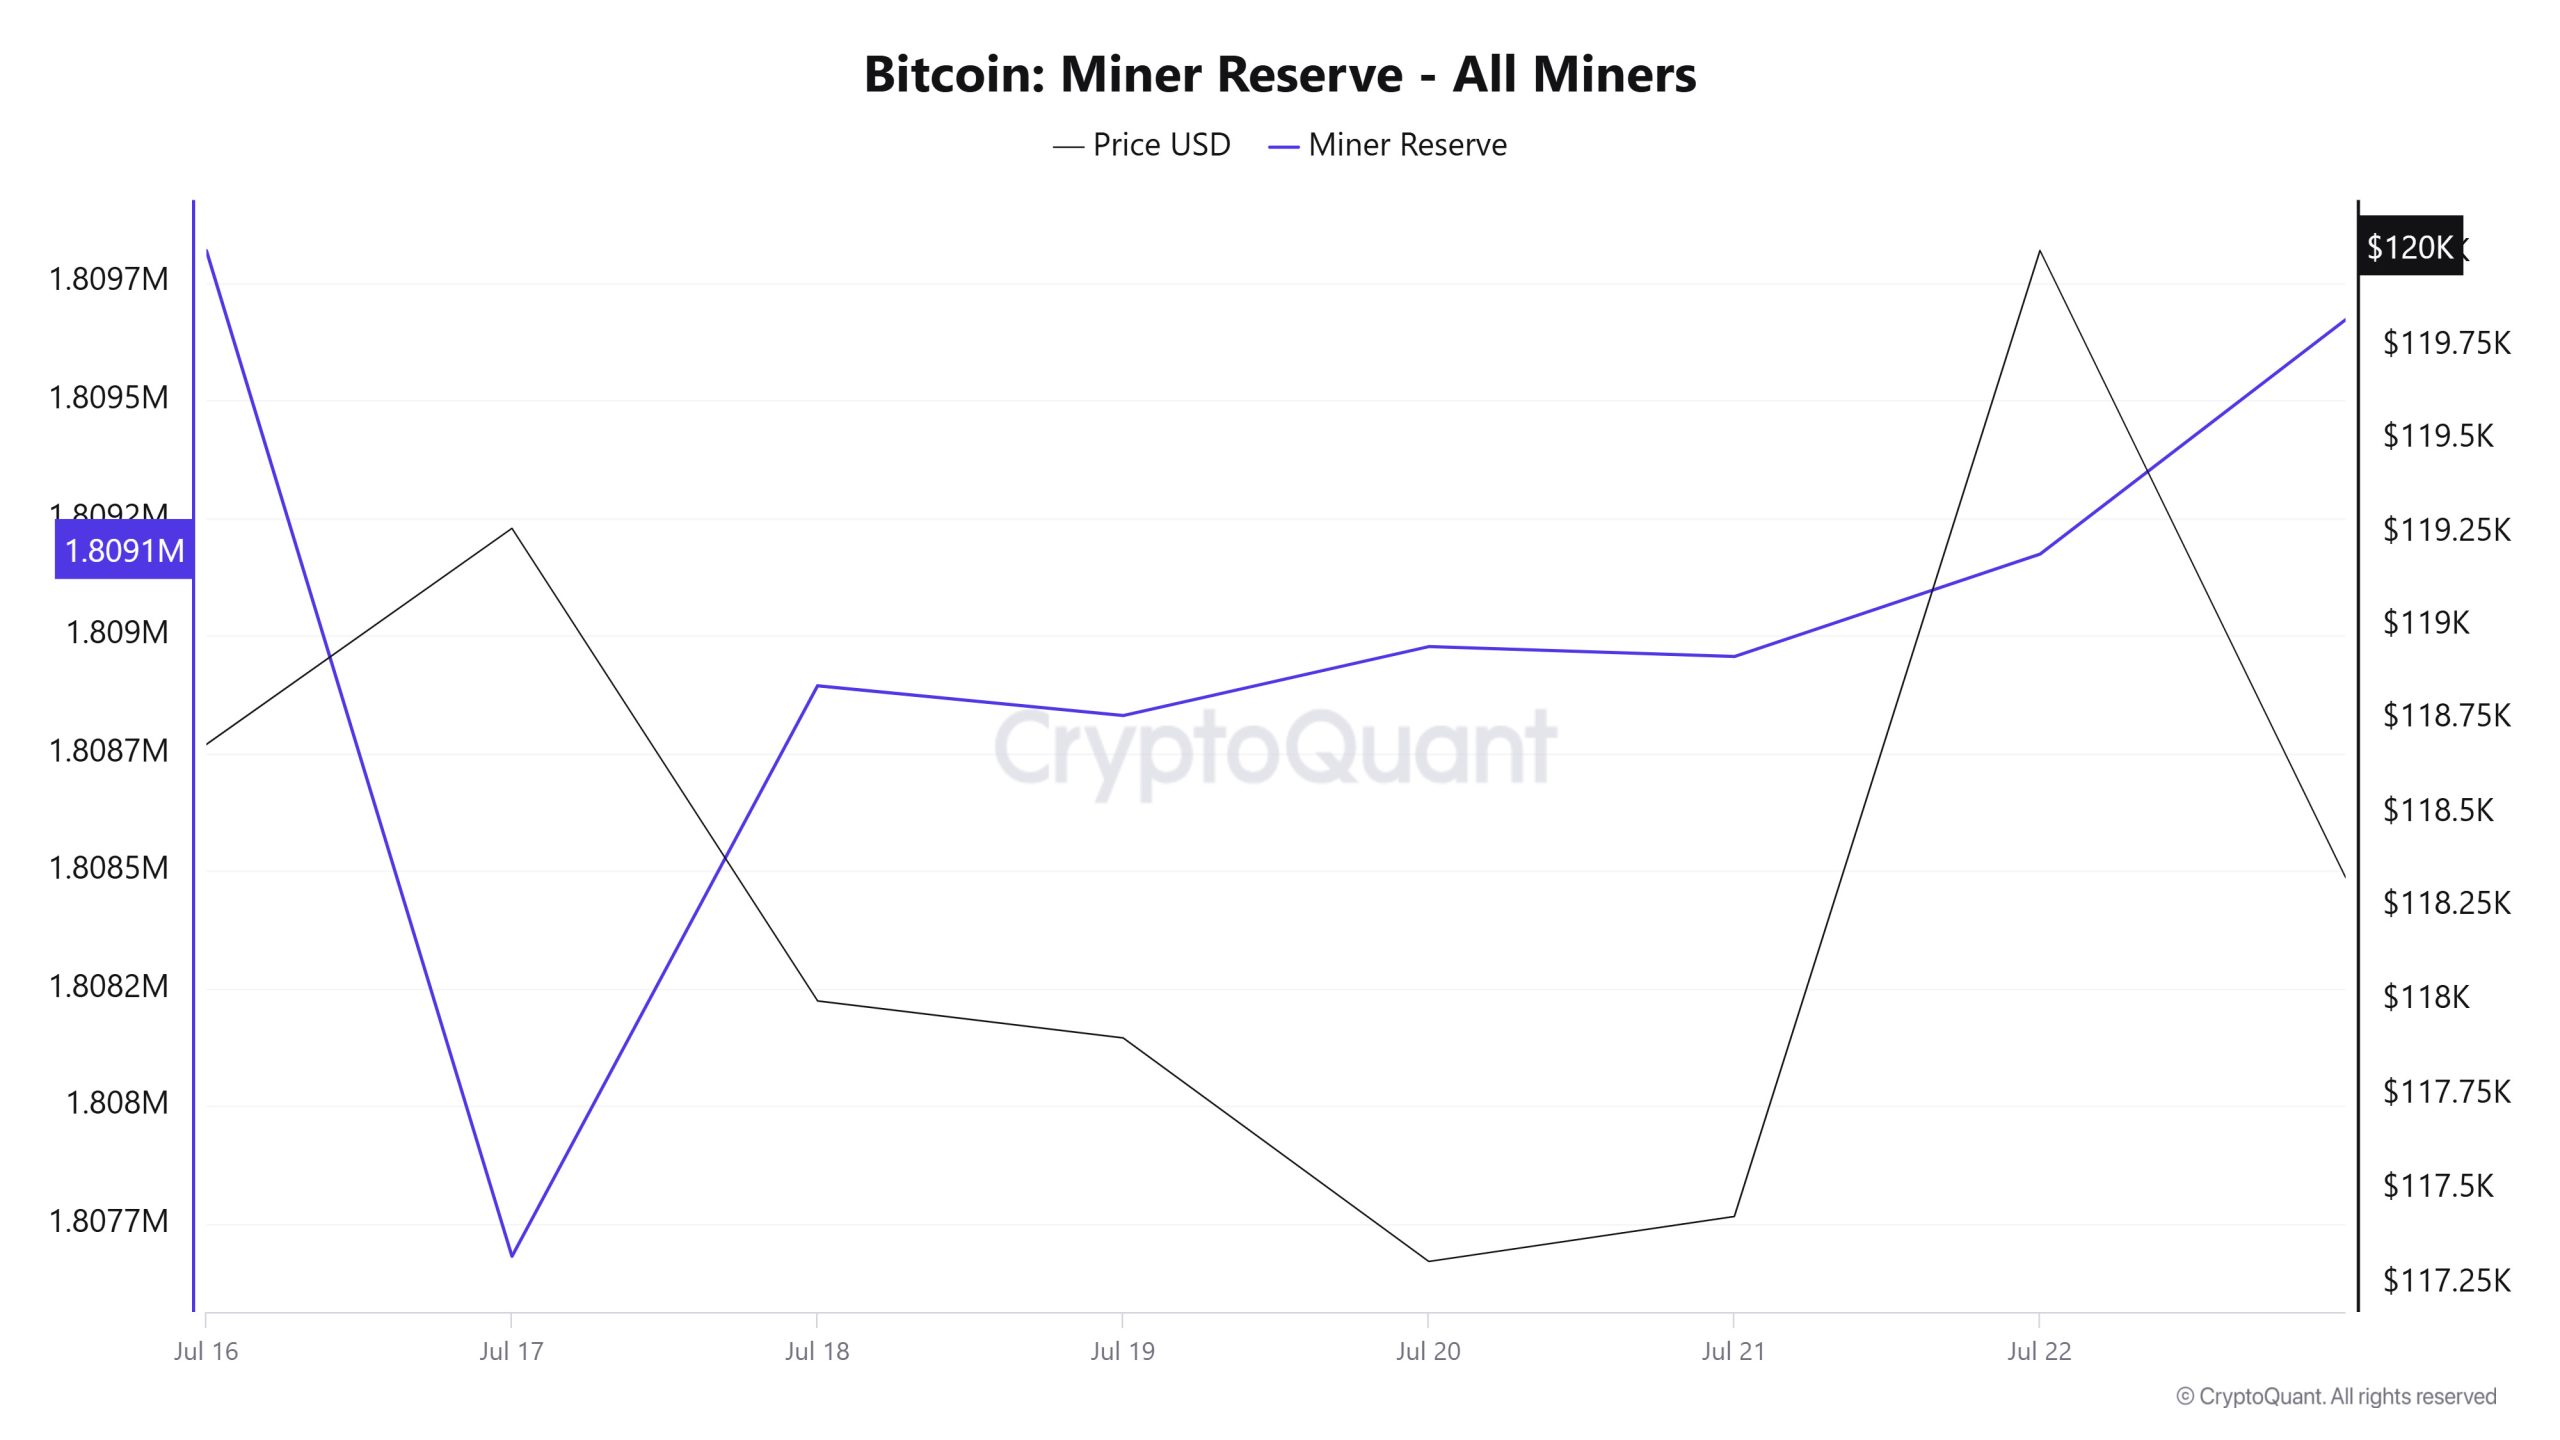
According to the data obtained from the Miner Reserve table, it has been observed that there has been an increase in Bitcoin reserves held in miners’ wallets this week. It was observed that there was a negative correlation between Bitcoin price and Miner Reserve throughout the week, but by the end of the week, this correlation turned positive.
Miner Inflow, Outflow and NetFlow
Between 16 – 22 July, 43,087 Bitcoins were outflowed from miners’ wallets and the amount of Bitcoins that entered miners’ wallets between the same dates was 44,590. This week’s Miner Netflow was 1,503 Bitcoin. Meanwhile, while the Bitcoin price was $ 118,682 on 16 July, it was $ 120,009 on 22 July.
Throughout the week, the net flow (Miner NetFlow) was positive as Bitcoin inflow to miner wallets (Miner Inflow) was higher than Bitcoin outflow from miner wallets (Miner Outflow).
| Date | July 16 | July 17 | July 18 | July 19 | July 20 | July 21 | July 22 |
|---|---|---|---|---|---|---|---|
| Miner Inflow | 6,853.40 | 8,812.66 | 11,444.89 | 2,659.72 | 3,689.25 | 5,829.54 | 5,301.02 |
| Miner Outflow | 4,705.46 | 10,949.85 | 10,232.30 | 2,723.19 | 3,542.74 | 5,850.58 | 5,083.58 |
| Miner NetFlow | 2,147.93 | −2,137.19 | 1,212.59 | −63.47 | 146.51 | −21.04 | 217.44 |
Transaction
While 2,966,538 transactions were carried out on the Bitcoin network last week, it decreased by about 1.19% to 2,931,347 this week. The 452,018 transactions recorded on 18 July constituted the highest transaction volume of the week, while the lowest number of transactions was 384,288 on 21 July.
Throughout the week, the correlation between BTC price and the number of transactions was mixed, changing direction from time to time, but the overall trend was weighted in the positive direction. This suggests that price-based movements on the network were largely supported by transfer and transaction activity.
On the other hand, there was no significant change in the total number of transactions compared to the previous week, indicating that the overall activity on the network remained relatively stable. Such low volatility network behaviour strengthens the likelihood that BTC price may remain flat within a narrow band in the near term.
Tokens Transferred
While 5,414,637 BTC was transferred last week, this week this figure decreased by approximately 2.48% to 5,280,137 BTC. On 17 July, the highest transfer volume of the week was 1,051,889 BTC, while on 20 July, the lowest transfer volume of the week was 410,747 BTC.
Throughout the week, positive correlations were observed between the transfer volume and BTC price on the network. This high level of transfer volume is not just a short-term market reaction. In fact, the fact that BTC transfer volumes both last week and this week continue to hover significantly above the annual average indicates that the liquidity and transaction activity observed in the markets may be permanent.
In this context, the continued transaction density and high-volume transfers on the network have the potential to signal a deeper structural liquidity transformation in the Bitcoin market in the medium term.
Whale Activities
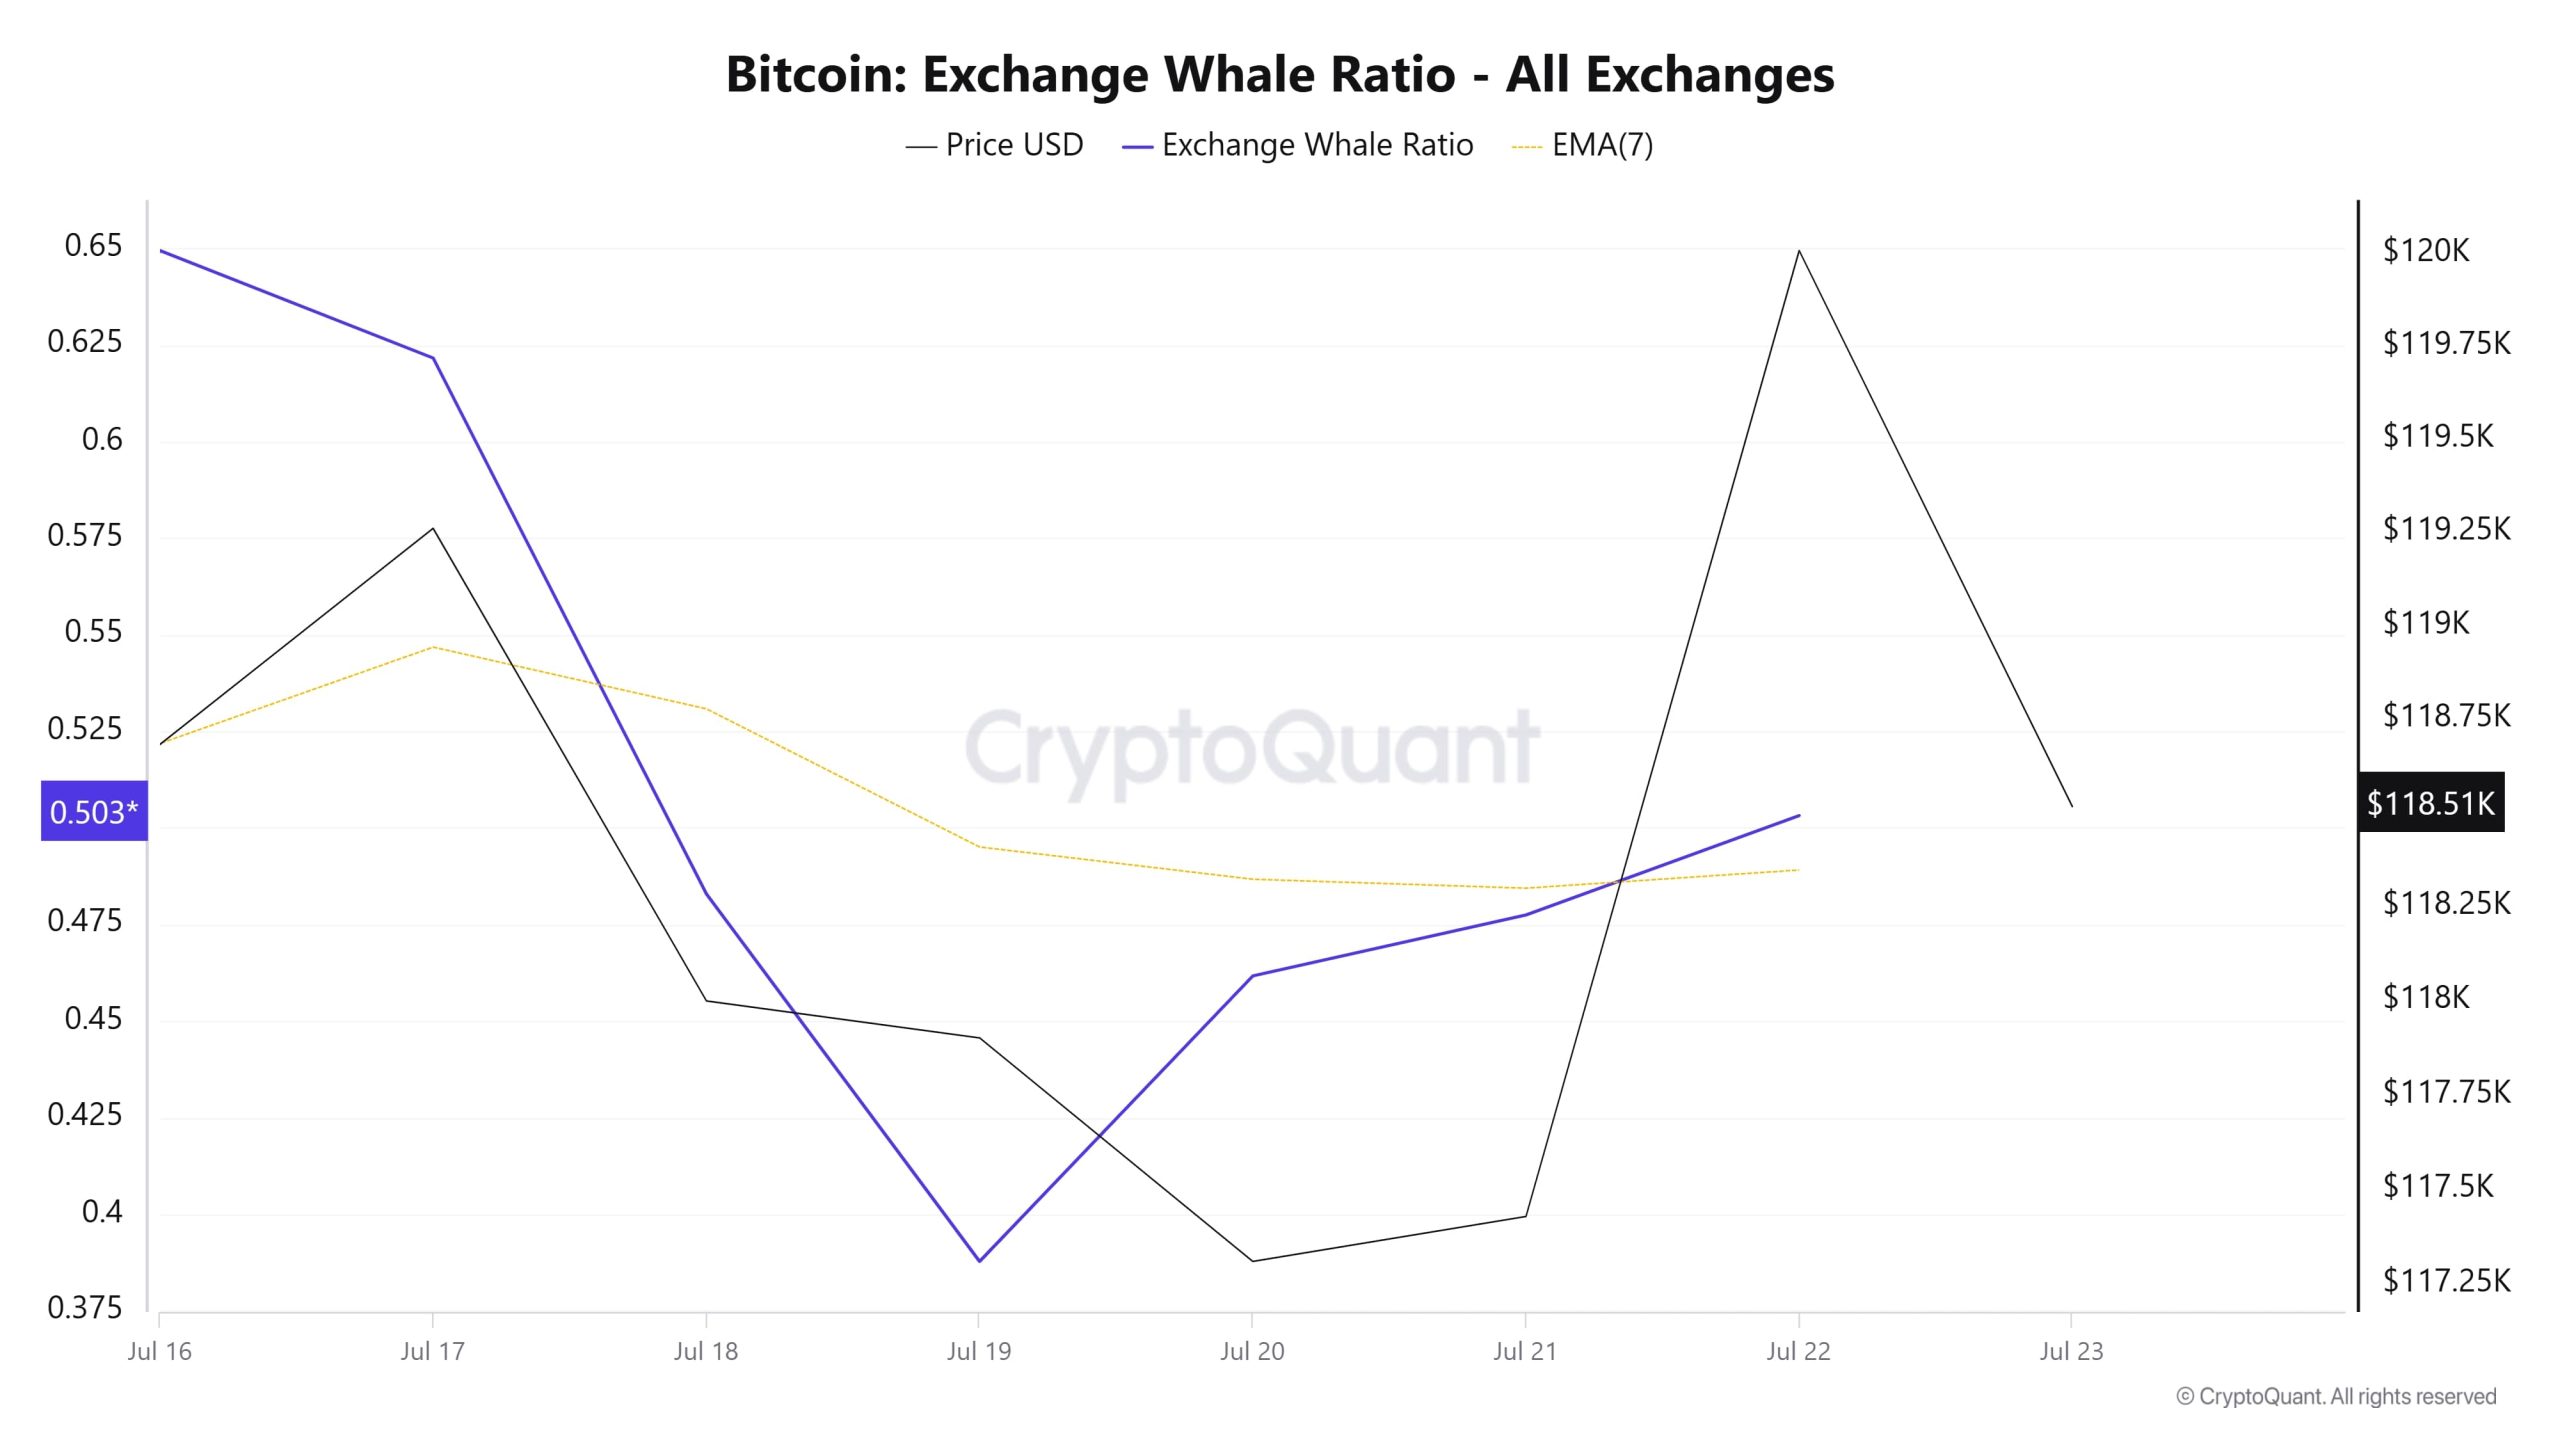
Tokens Transferred
While 5,414,637 BTC was transferred last week, this week this figure decreased by approximately 2.48% to 5,280,137 BTC. On 17 July, the highest transfer volume of the week was 1,051,889 BTC, while on 20 July, the lowest transfer volume of the week was 410,747 BTC.
Throughout the week, positive correlations were observed between the transfer volume and BTC price on the network. This high level of transfer volume is not just a short-term market reaction. In fact, the fact that BTC transfer volumes both last week and this week continue to hover significantly above the annual average indicates that the liquidity and transaction activity observed in the markets may be permanent.
In this context, the intensity of transactions on the network and the persistence of high-volume transfers have the potential to signal a deeper structural liquidity transformation in the Bitcoin market in the medium term.
BTC Onchain Overall
| Metric | Positive 📈 | Negative 📉 | Neutral ➖ |
|---|---|---|---|
| Active Addresses | ✓ | ||
| Breakdowns | ✓ | ||
| Derivatives | ✓ | ||
| Supply Distribution | ✓ | ||
| Exchange Reserve | ✓ | ||
| Fees and Revenues | ✓ | ||
| Miner Flows | ✓ | ||
| Transaction | ✓ | ||
| Whale Activities | ✓ |
*The metrics and guidance in the table do not, by themselves, describe or imply an expectation of future price changes for any asset. The prices of digital assets may change depending on many different variables. The onchain analysis and related guidance are intended to assist investors in the decision-making process, and directing financial investments based solely on the results of this analysis may lead to harmful transactions. Even if all metrics produce a positive, negative or neutral result at the same time, the expected results may not be seen according to market conditions. It would be useful for investors who review the report to take these warnings into consideration.
Legal Notice
The investment information, comments and recommendations contained in this document do not constitute investment advisory services. Investment advisory services are provided by authorized institutions on a personal basis, taking into account the risk and return preferences of individuals. The comments and recommendations contained in this document are of a general type. These recommendations may not be suitable for your financial situation and risk and return preferences. Therefore, making an investment decision based solely on the information contained in this document may not result in results that are in line with your expectations.
NOTE: All data used in Bitcoin onchain analysis is based on Cryptoqaunt.