
Active Addresses
In terms of active addresses, there were 1,022,033 active entries on the BTC network between June 11 and June 18 this week. During this date range, Bitcoin rose to the $106,000 level. On June 11, at the intersection of price and the number of active addresses, the number of active addresses increased while the price decreased. When we follow the 7-day simple moving average, it is observed that the price followed a downward trend on the dates when this average also crossed the price. This situation indicates that there were exits up to 104,000 dollars.
Active Sending Addresses
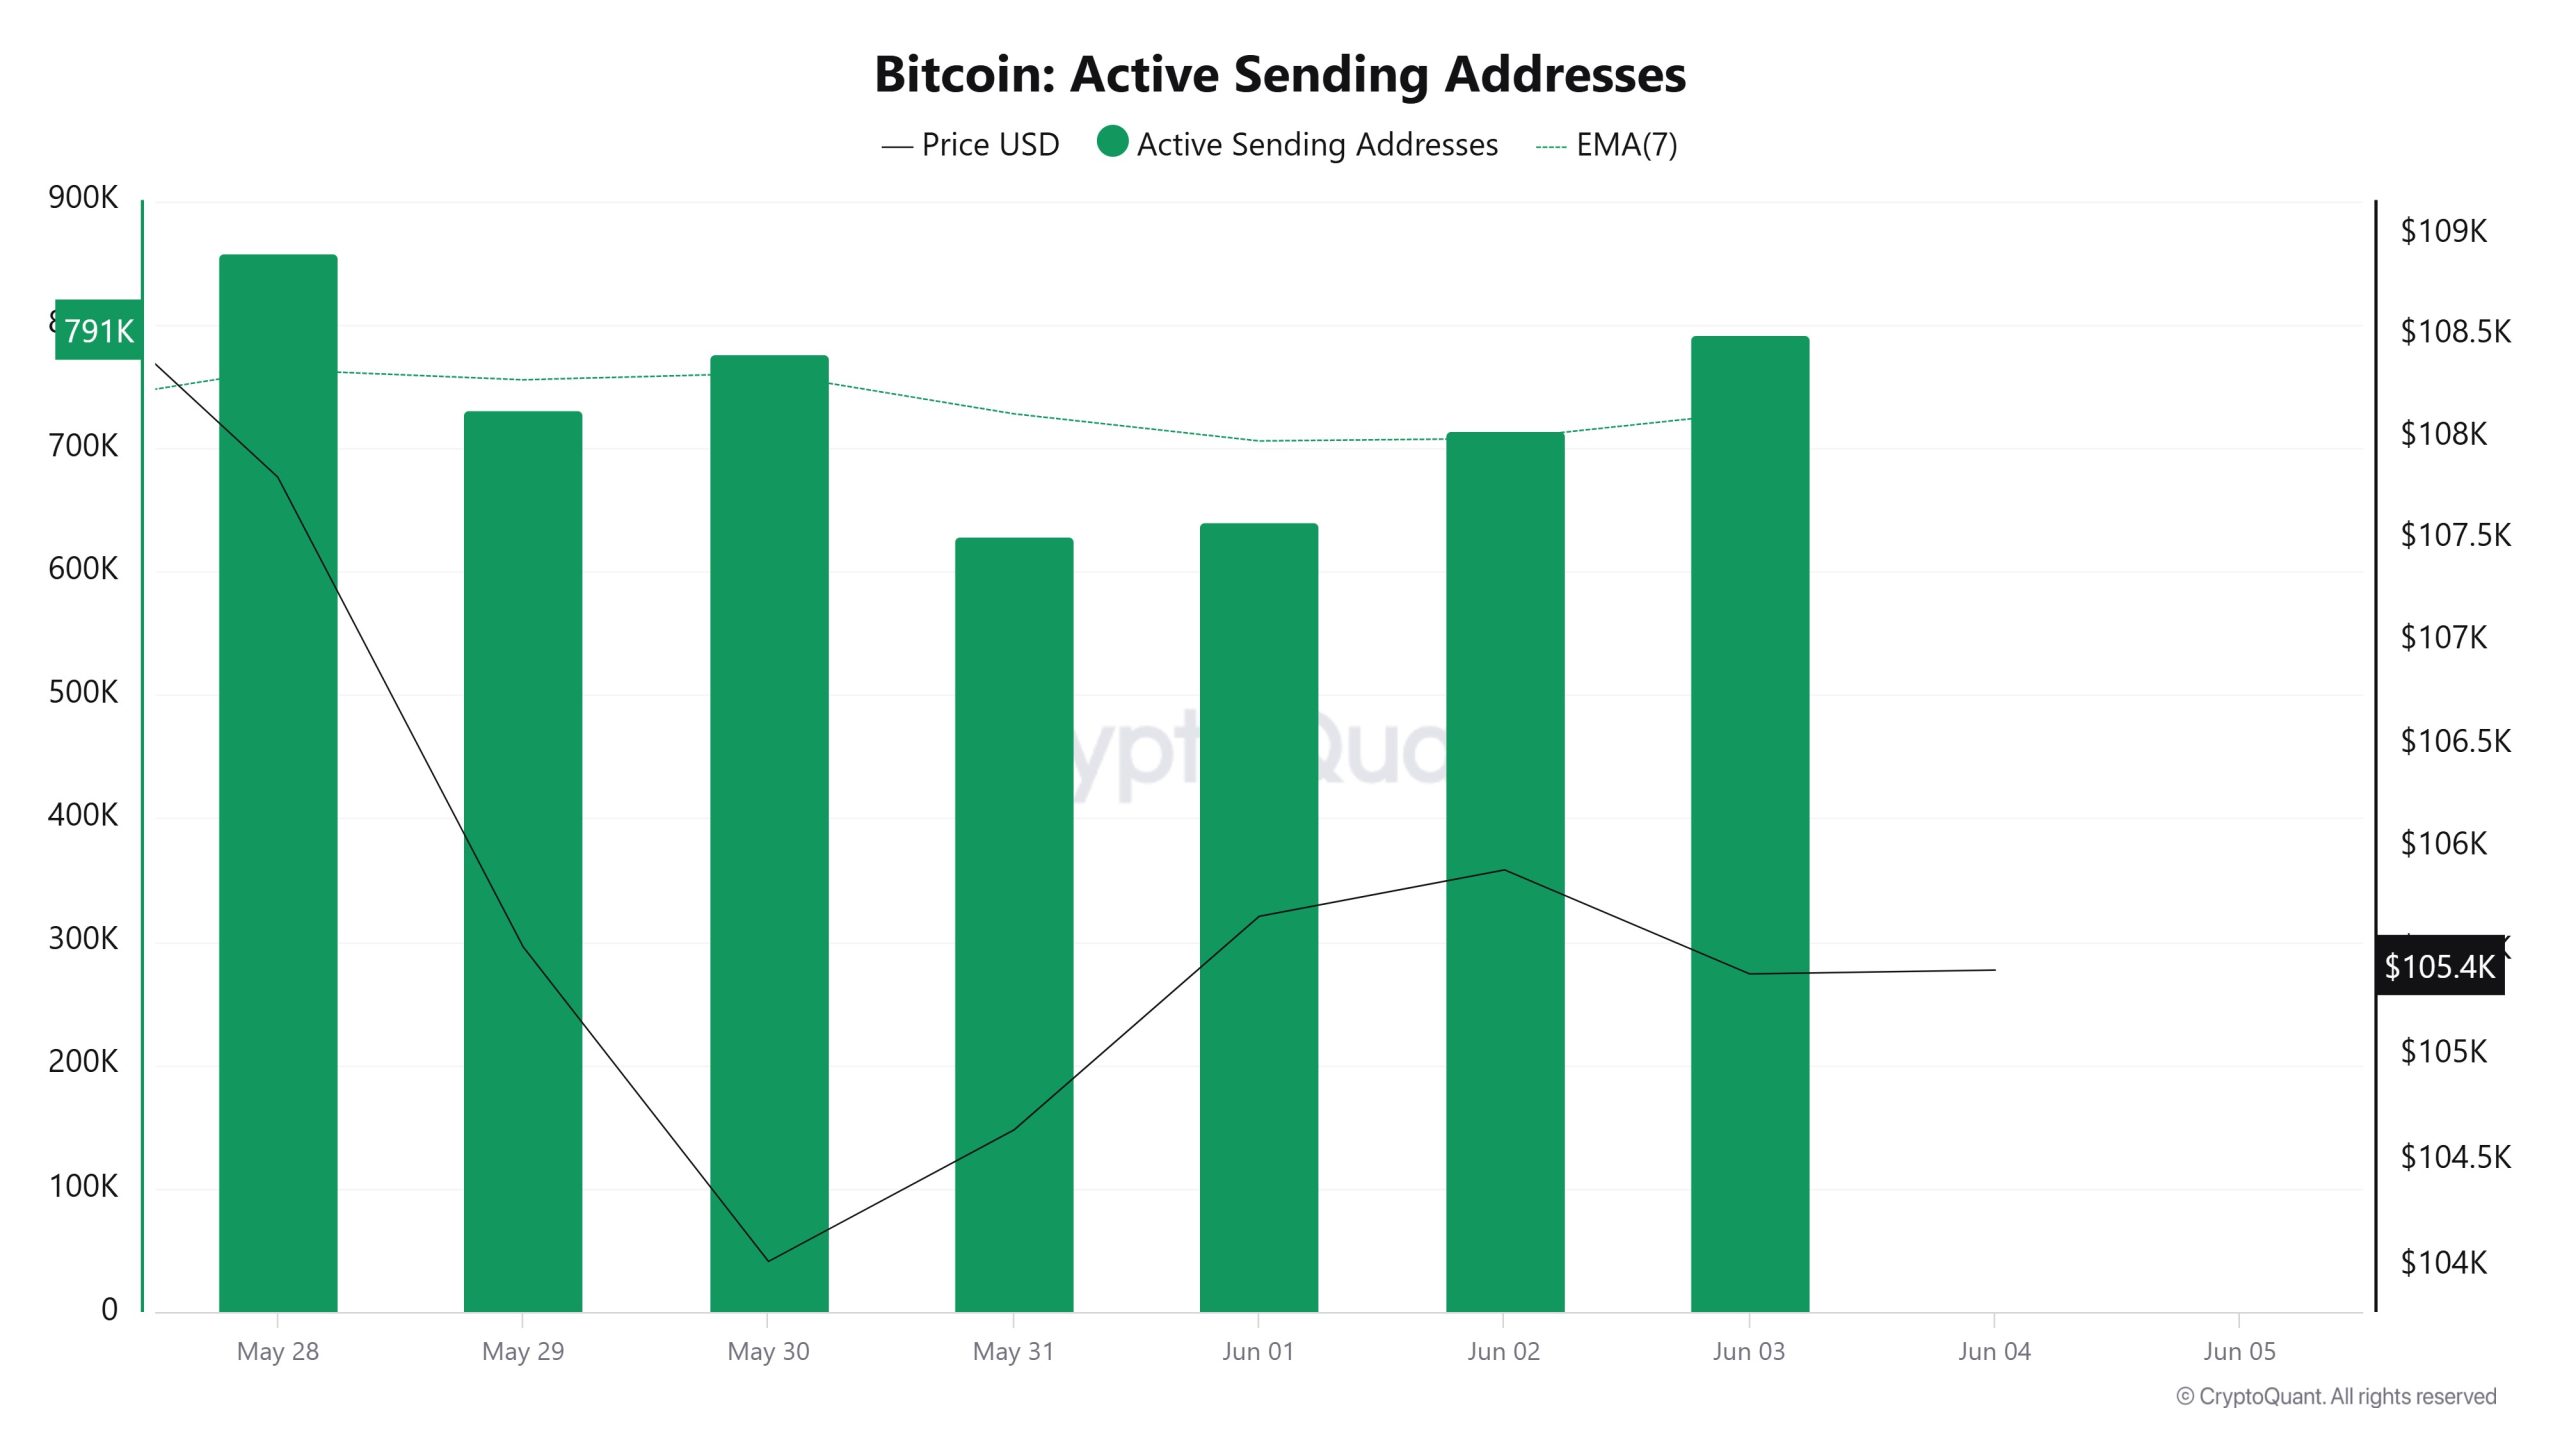
There was an increase in active shipping addresses on June 11-18. On the day when the price reached its highest level, active sending addresses rose to 711,804 levels; Bitcoin active address entries show that active address entries take into account the 106,000 dollar levels. As a result, there is an increase in Active Sending Addresses levels.
Active Receiving Addresses
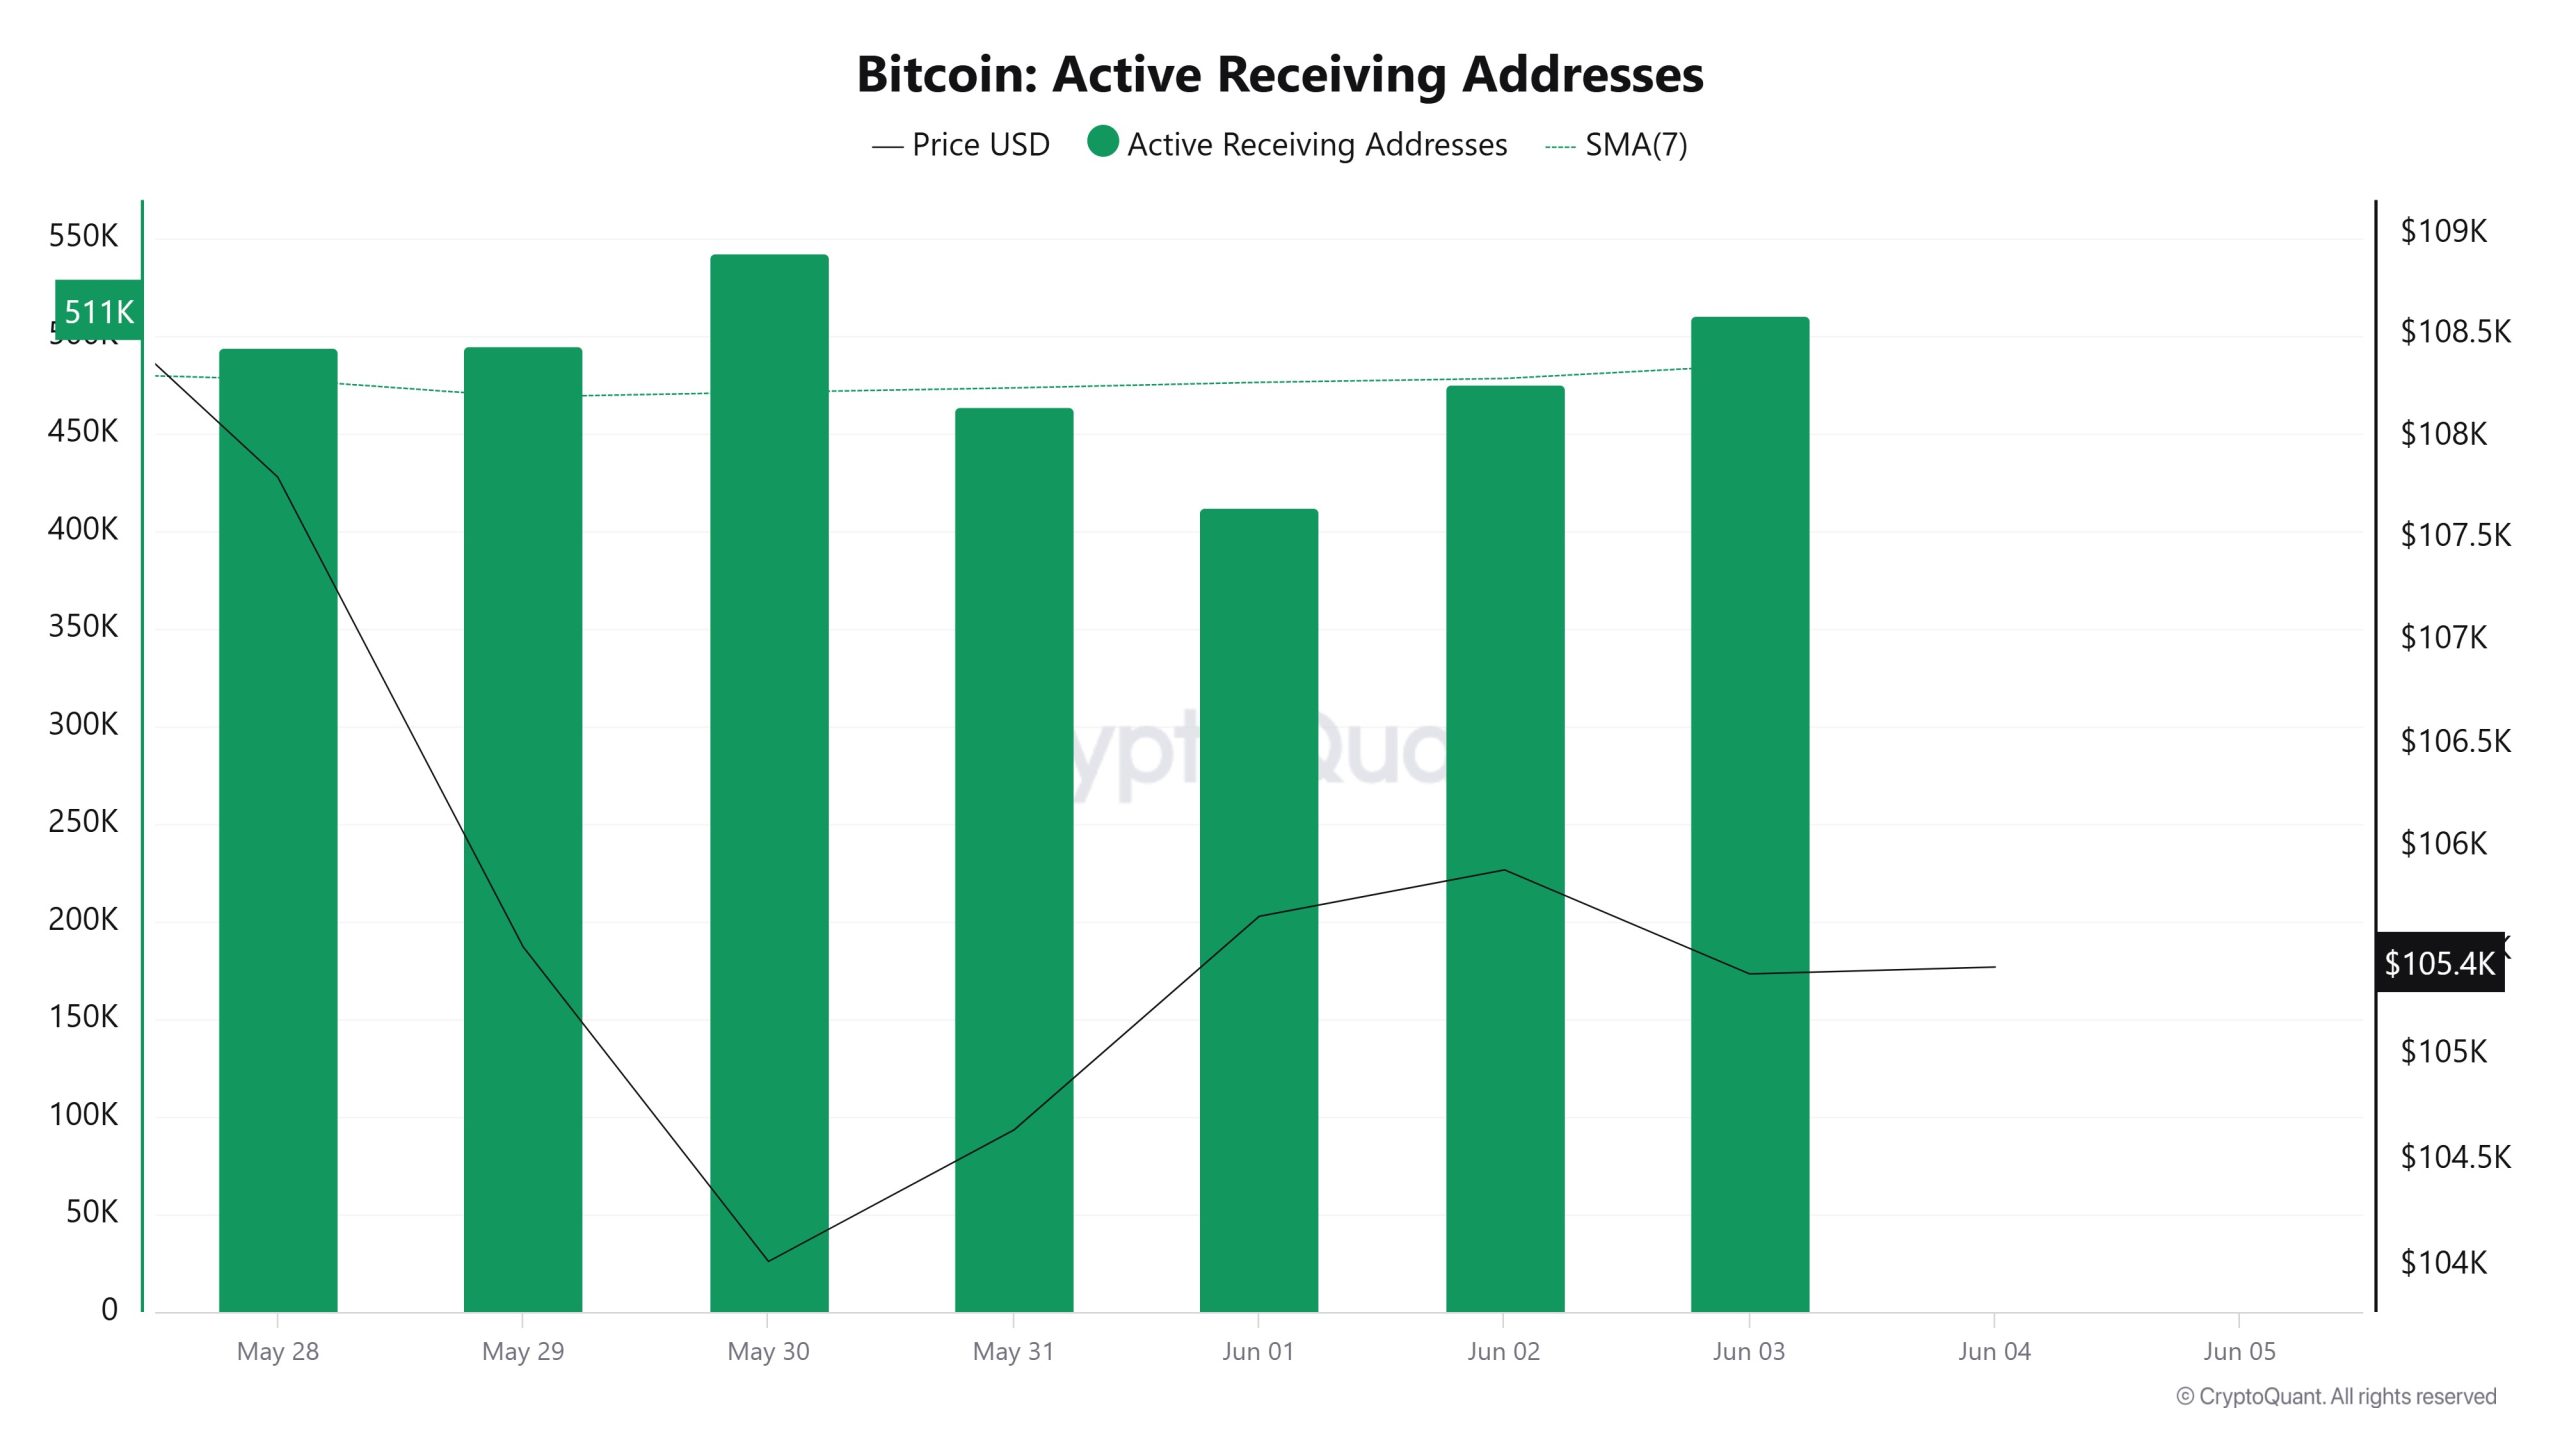
Active buying addresses, along with the Black Line (price line), saw a significant decline on June 11-18. On the day of the price high, active buying addresses rose as high as 653,953, indicating that buyers bought Bitcoin at $108,000.
Breakdowns
MRVR
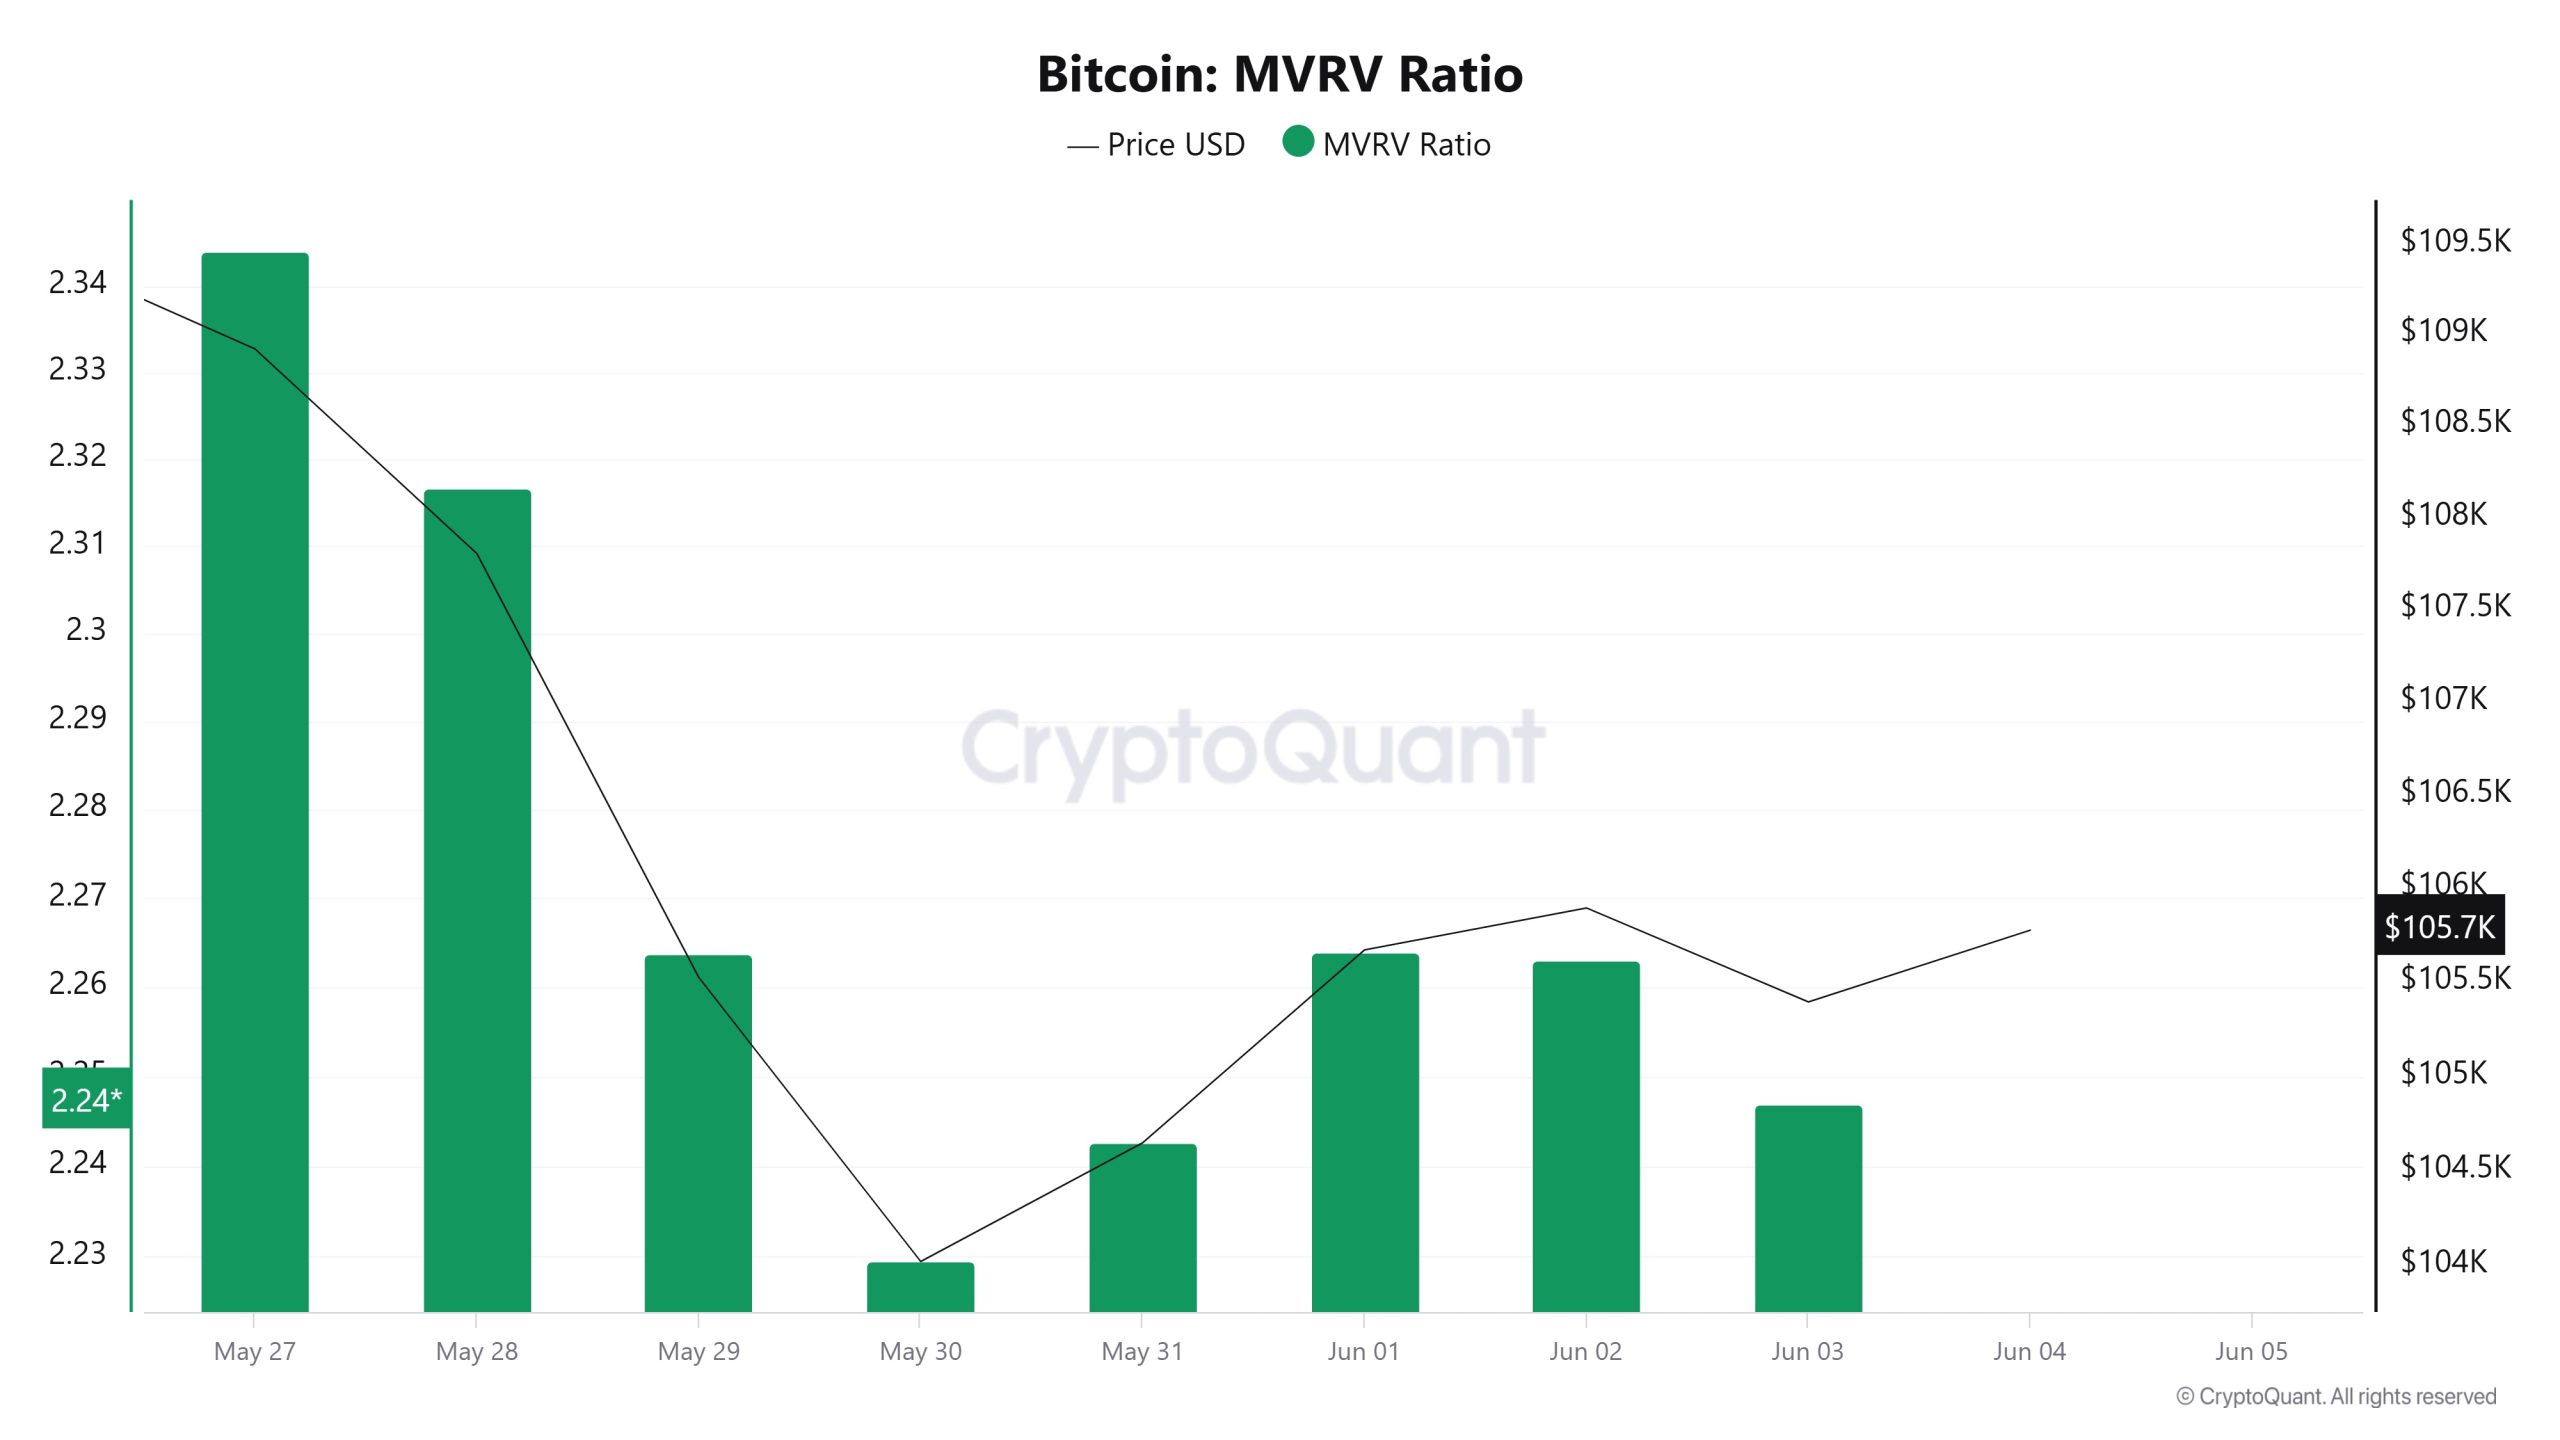
On June 11, the Bitcoin price was at 108,655 while the MVRV Ratio was 2.29. As of June 17, the Bitcoin price was down to 104,667, while the MVRV Ratio was 2.203. Compared to last week, Bitcoin price decreased by 3.68% and MVRV Ratio decreased by 4.18%.
Realized Price
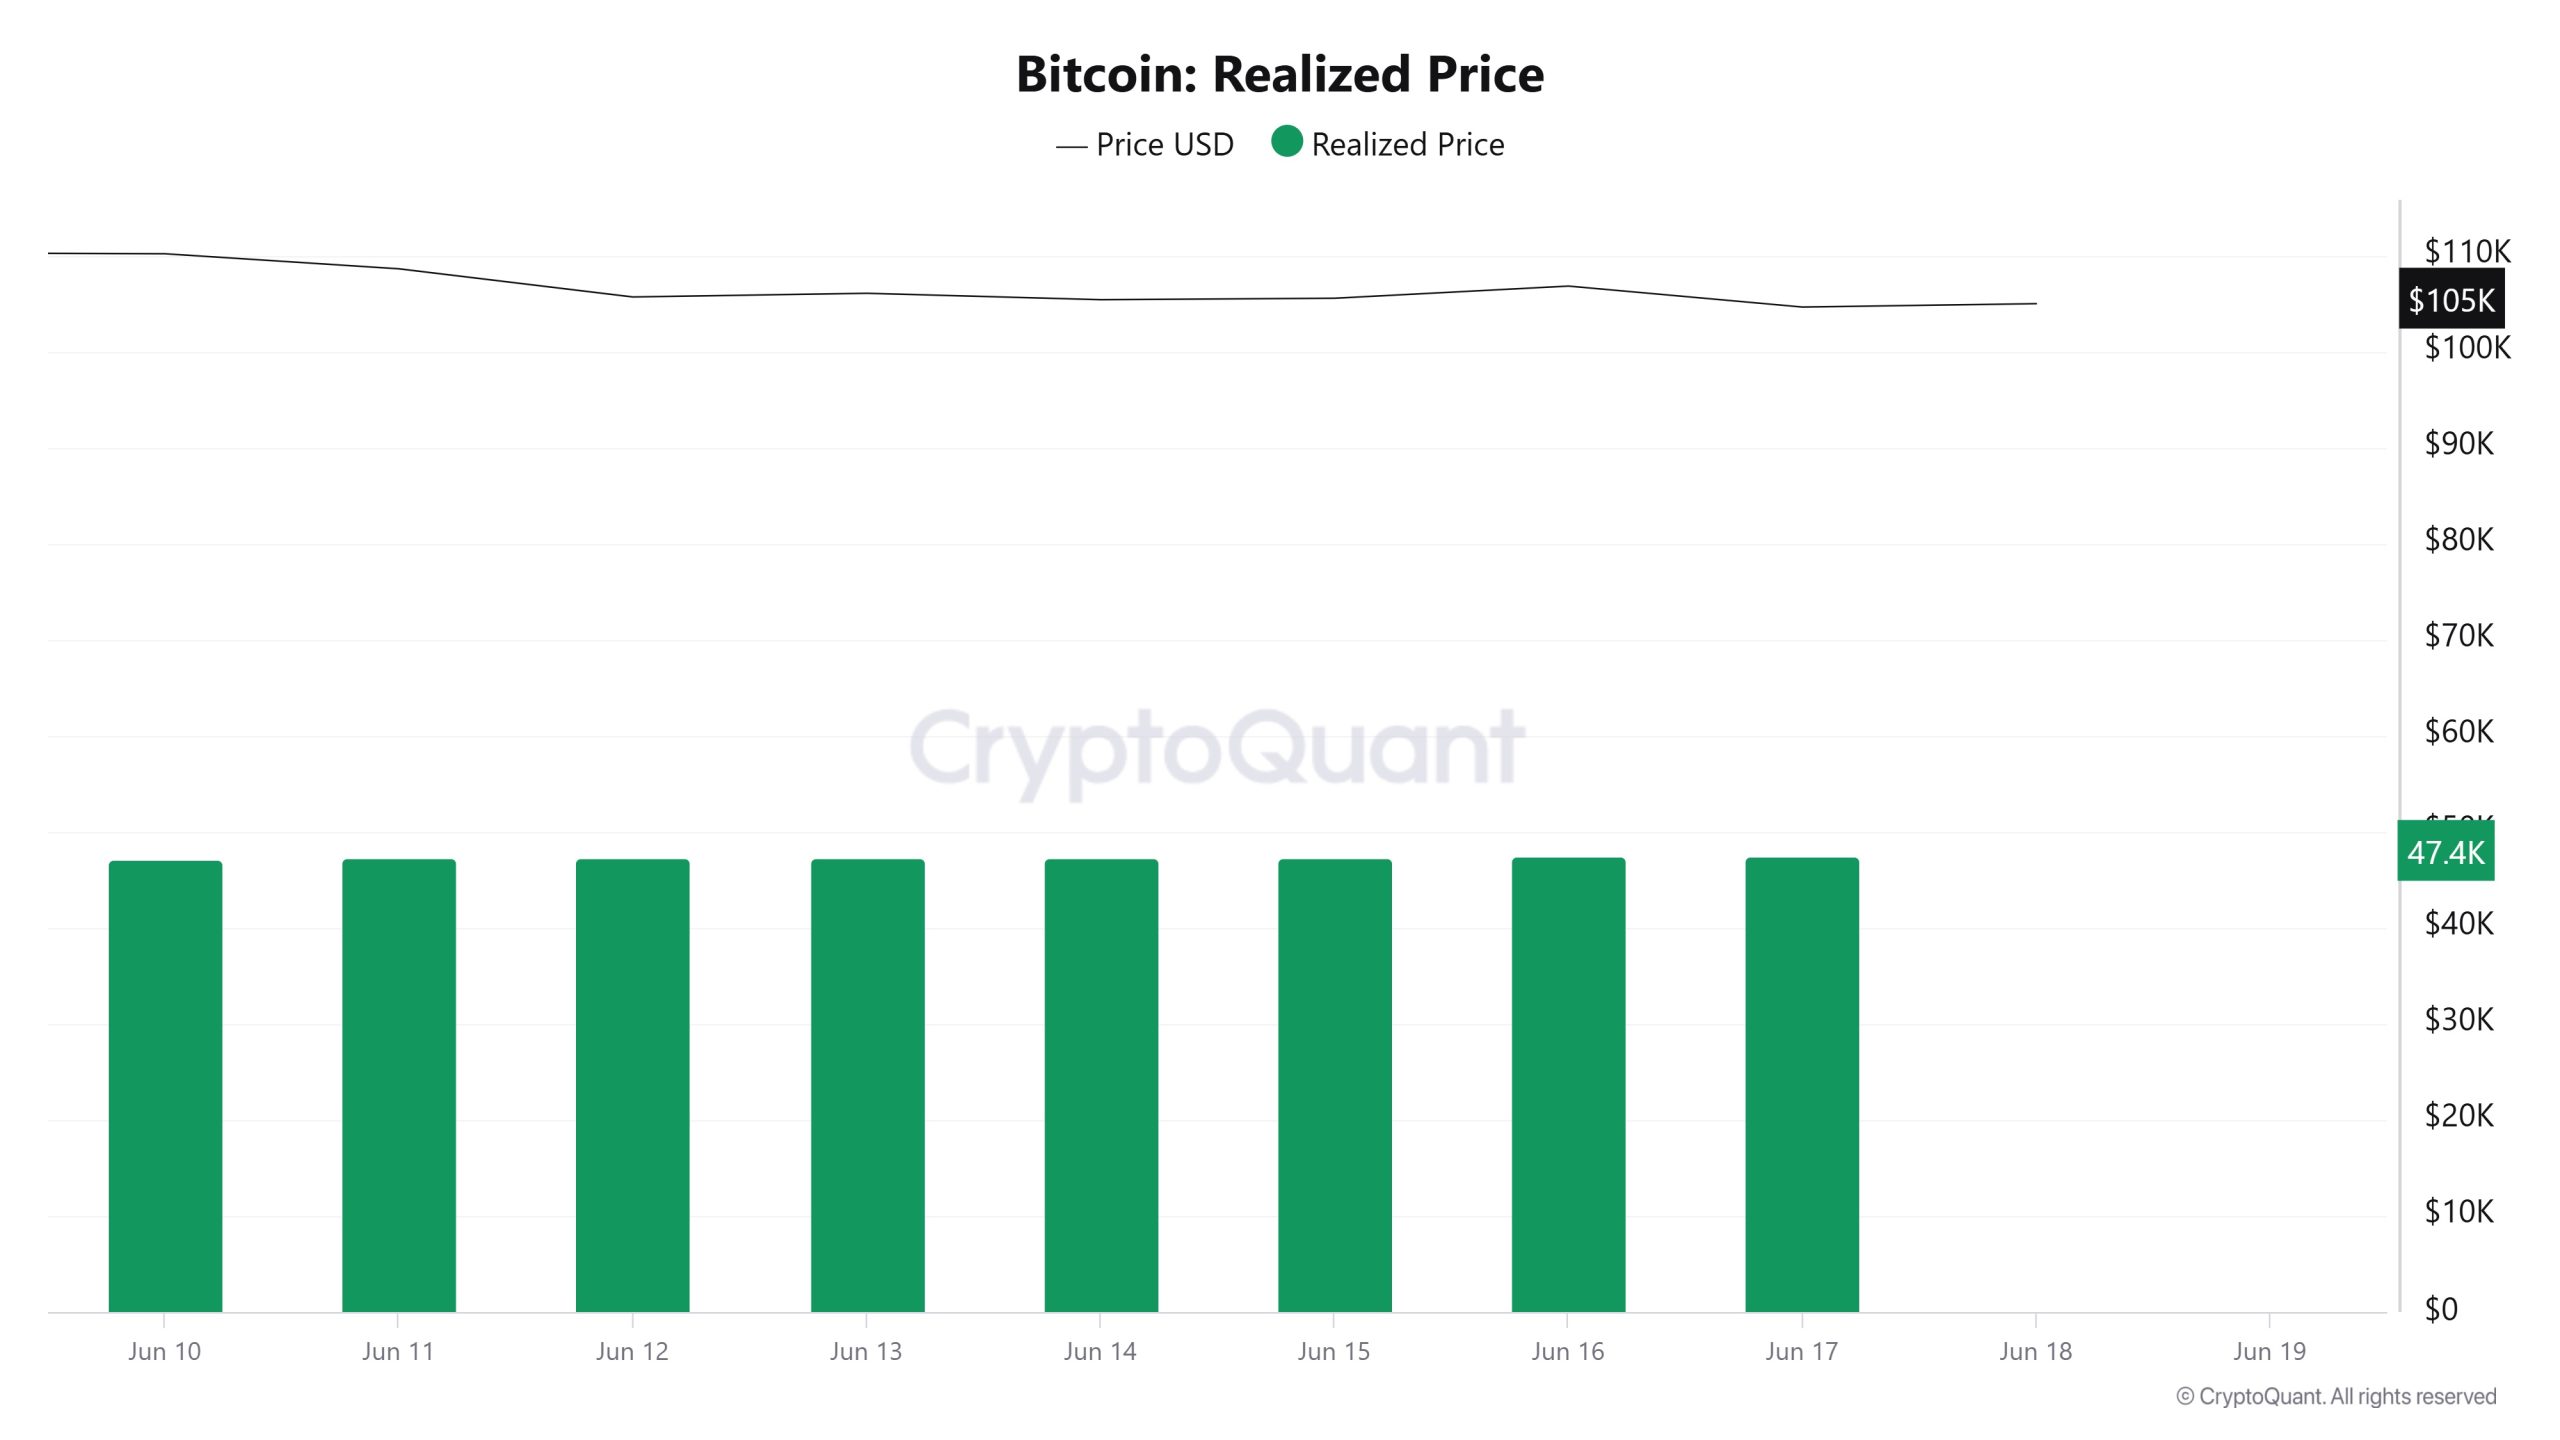
On June 11th, Bitcoin price was 108,655 while Realized Price was 47,252. As of June 17, the Bitcoin price decreased by 3.68% to 104,667, while the Realized Price increased by 0.51% to 47,492.
Spent Output Profit Ratio (SOPR)
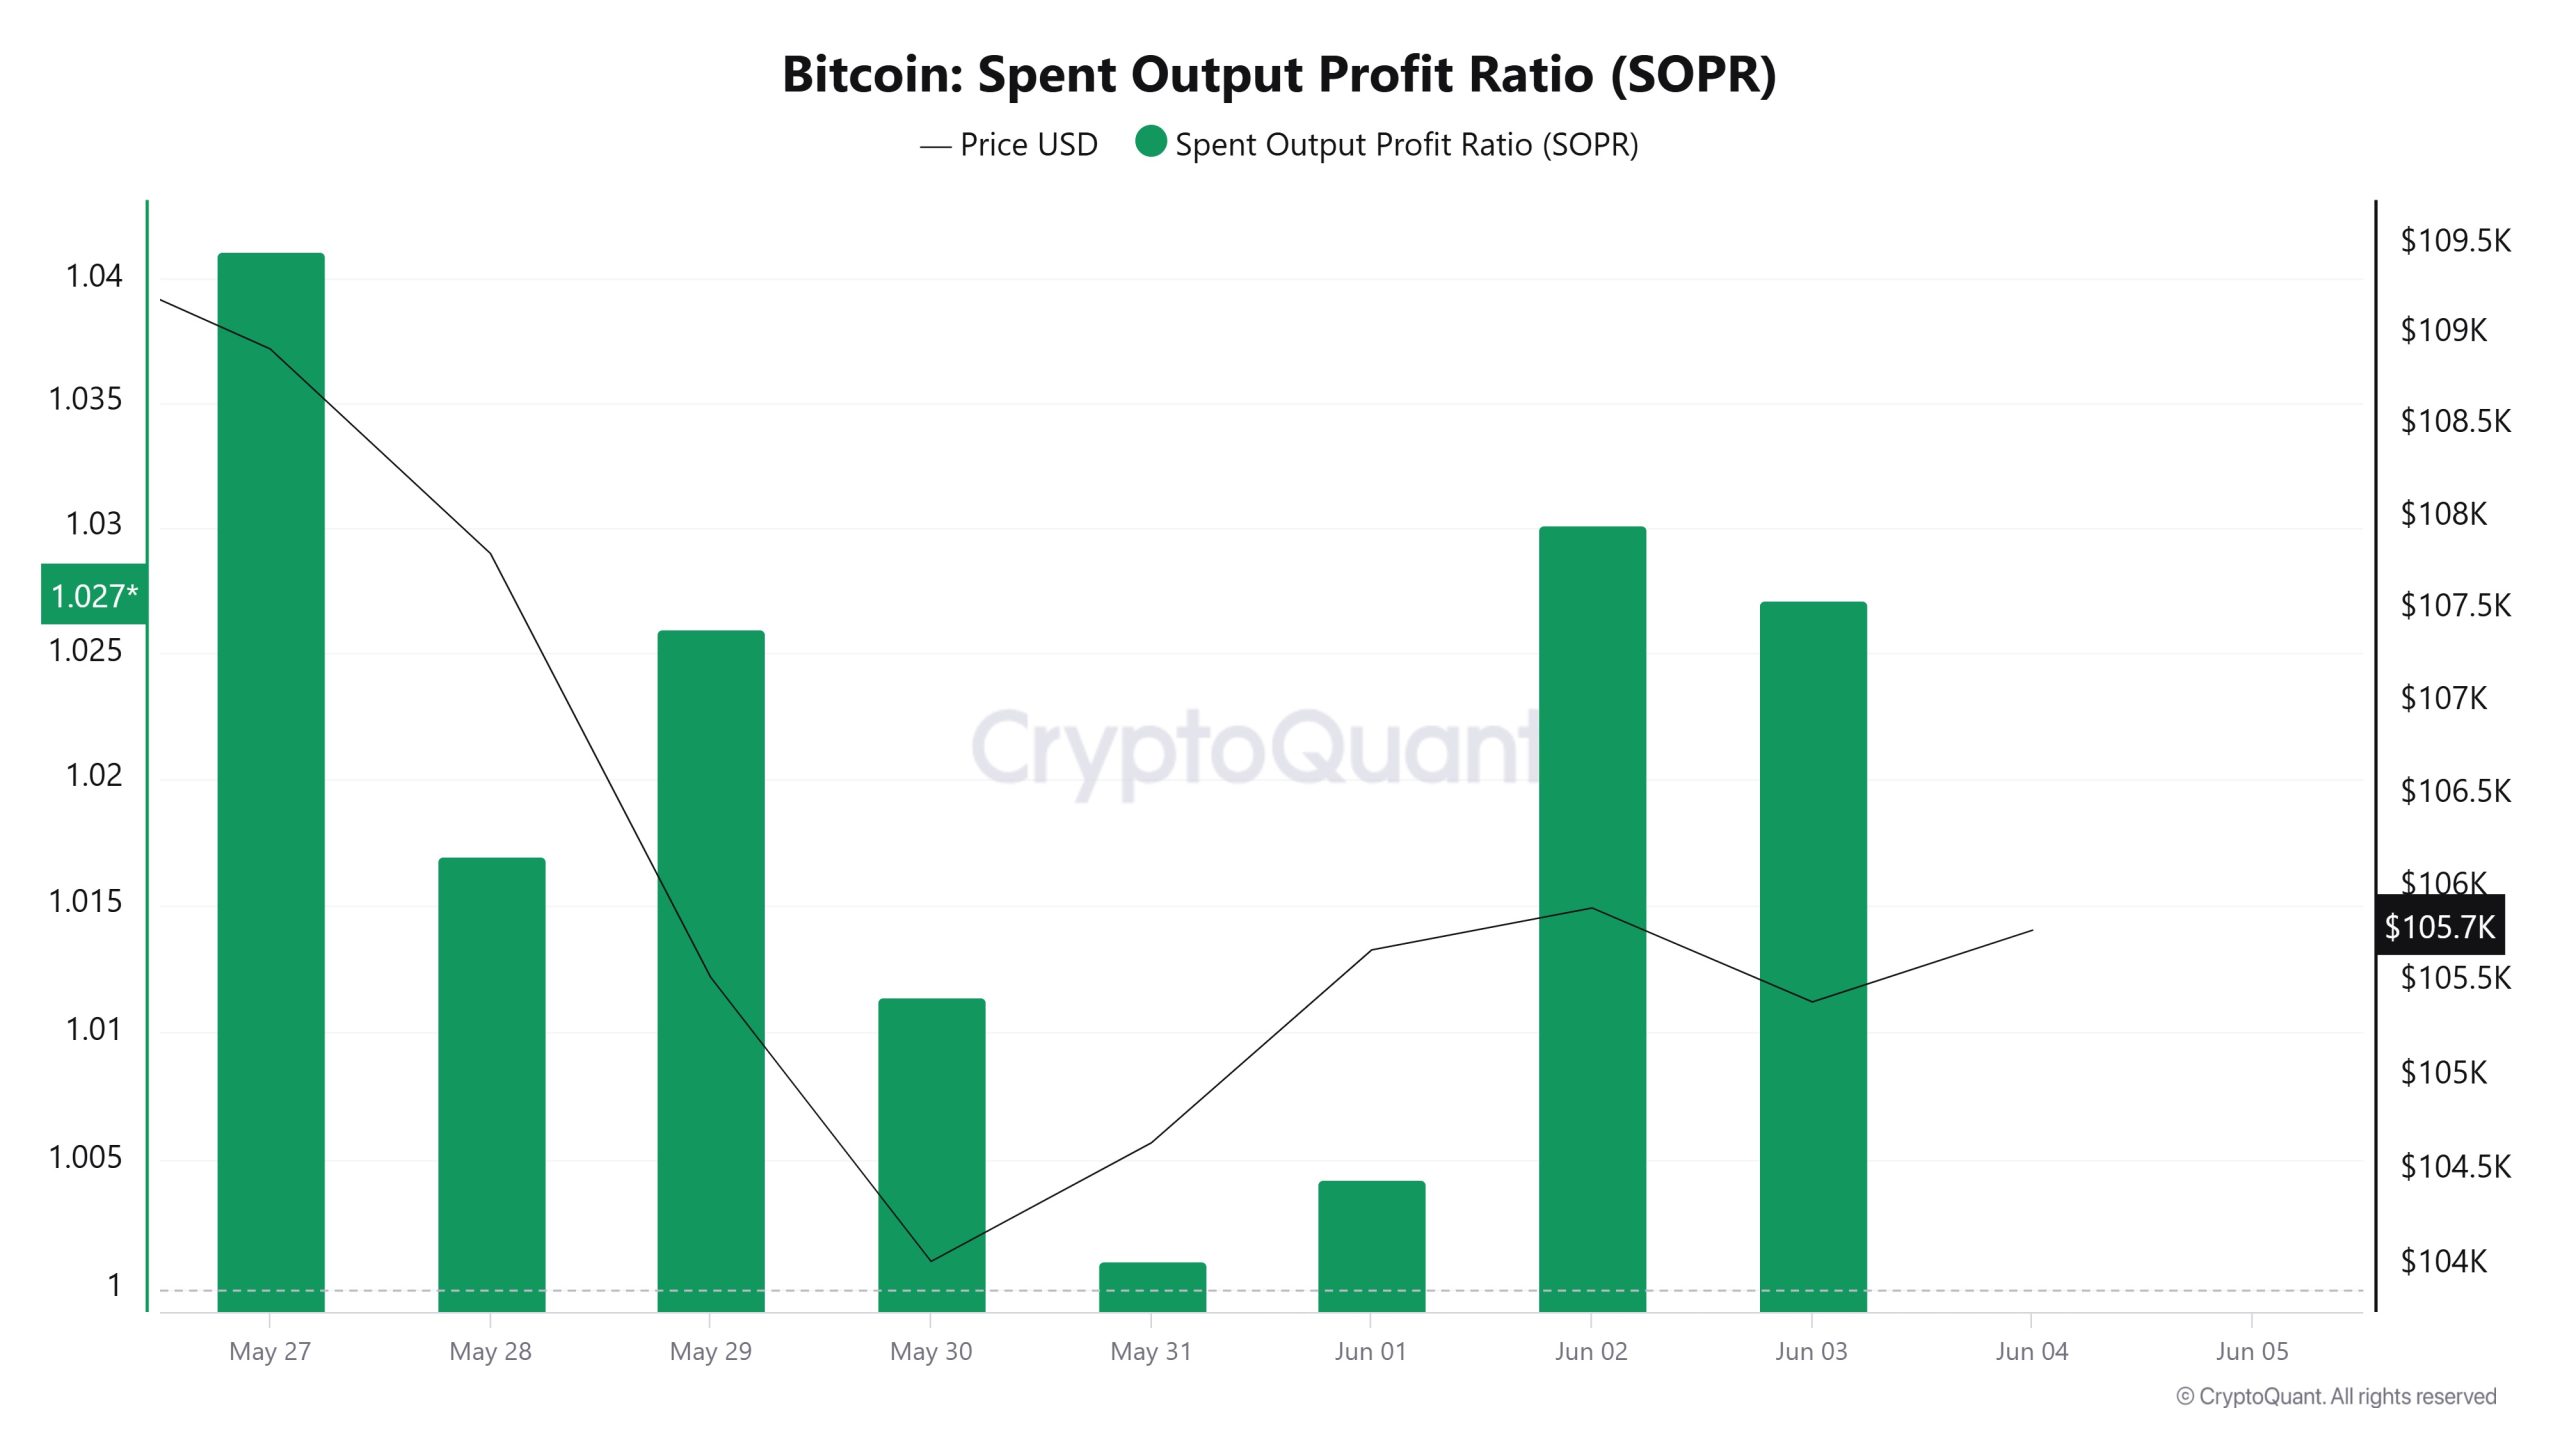
On June 11, the Bitcoin price was at 108,655 while the SOPR metric was at 1,015. As of June 17, the Bitcoin price was down 3.68% to 104,667, while the SOPR metric was down 1.18% to 1,003.
Derivatives
Open Interest
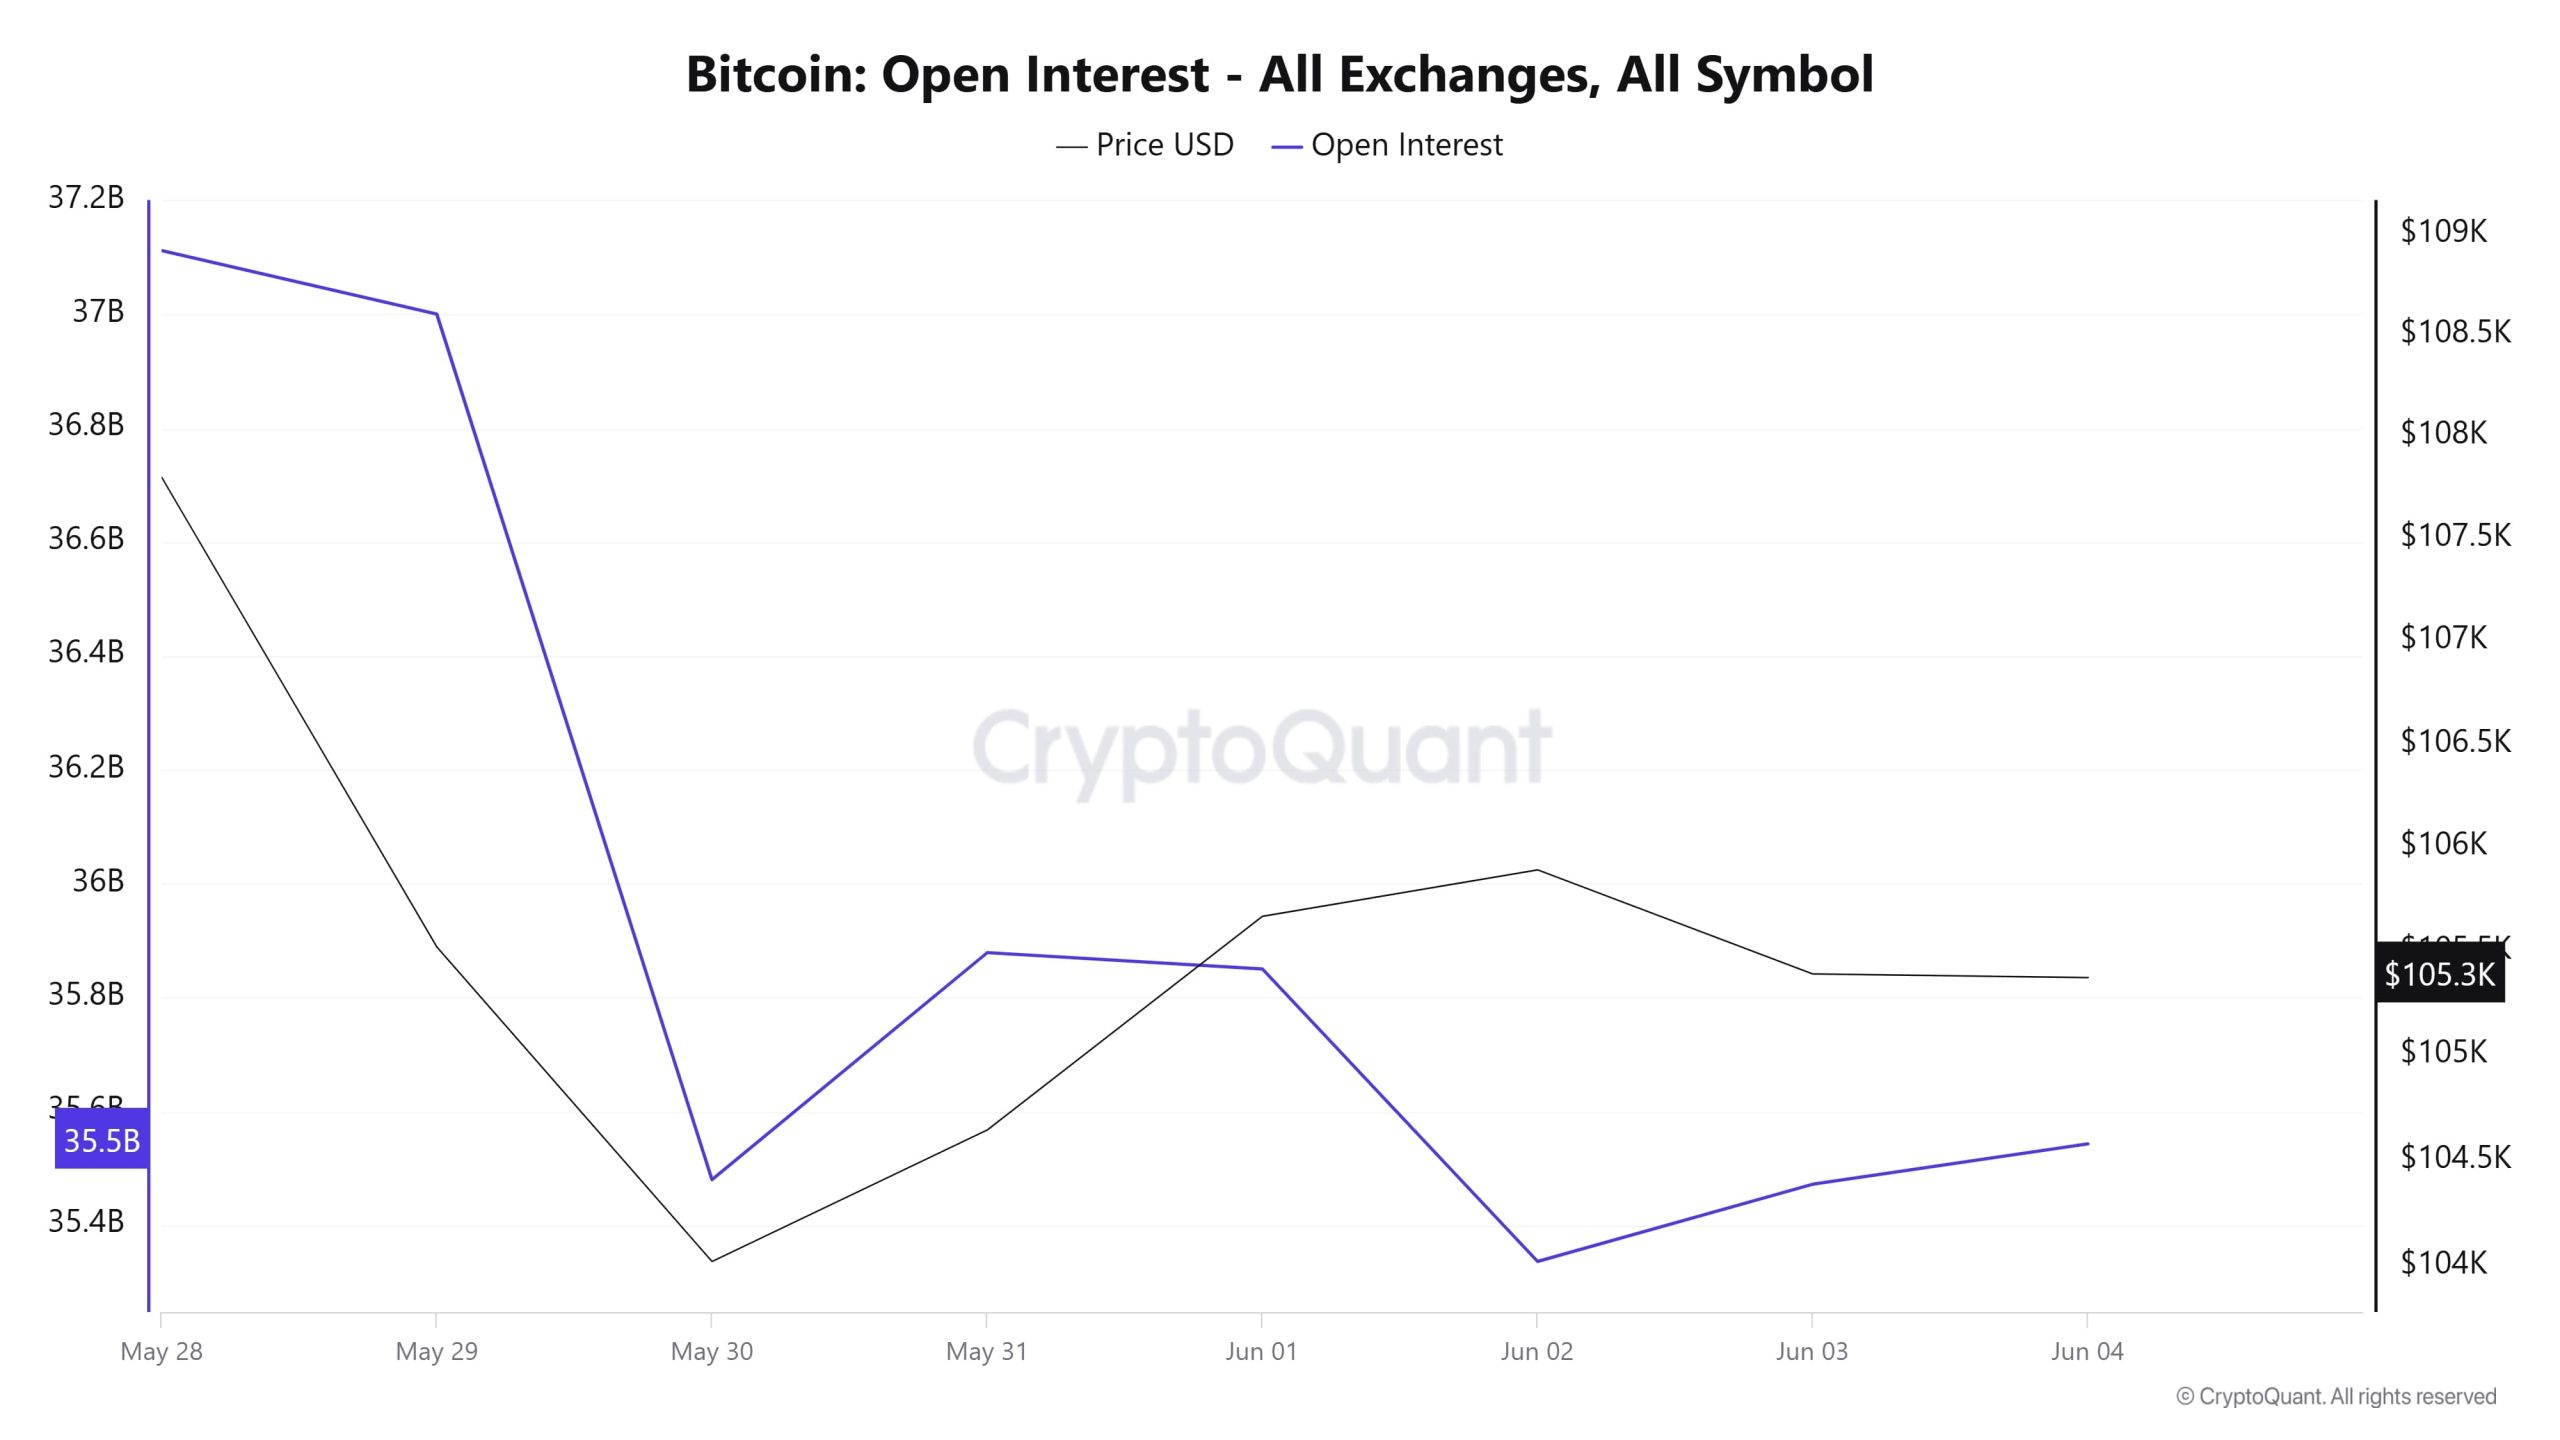
On June 11, open positions, which were around $35.8 billion, declined sharply with the price, falling to $33.6 billion on June 14. This decline indicates that positions were closed rapidly or that there was a serious liquidation in the market. On June 15, although there was a limited movement in both data, the real movement took place on June 16, and both the price and open positions rose significantly. However, this rise was not long-lasting. A downward break was seen again on June 17 as tensions between Iran and Israel escalated. This suggests that the rise the day before was driven by short-term buying rather than a strong trend start. As of June 18, there has been a slight recovery in open positions, but the price remains under pressure. The overall picture suggests that investors are not yet convinced of a clear direction due to geopolitical risks and a cautious waiting mood persists in the market.
Funding Rate
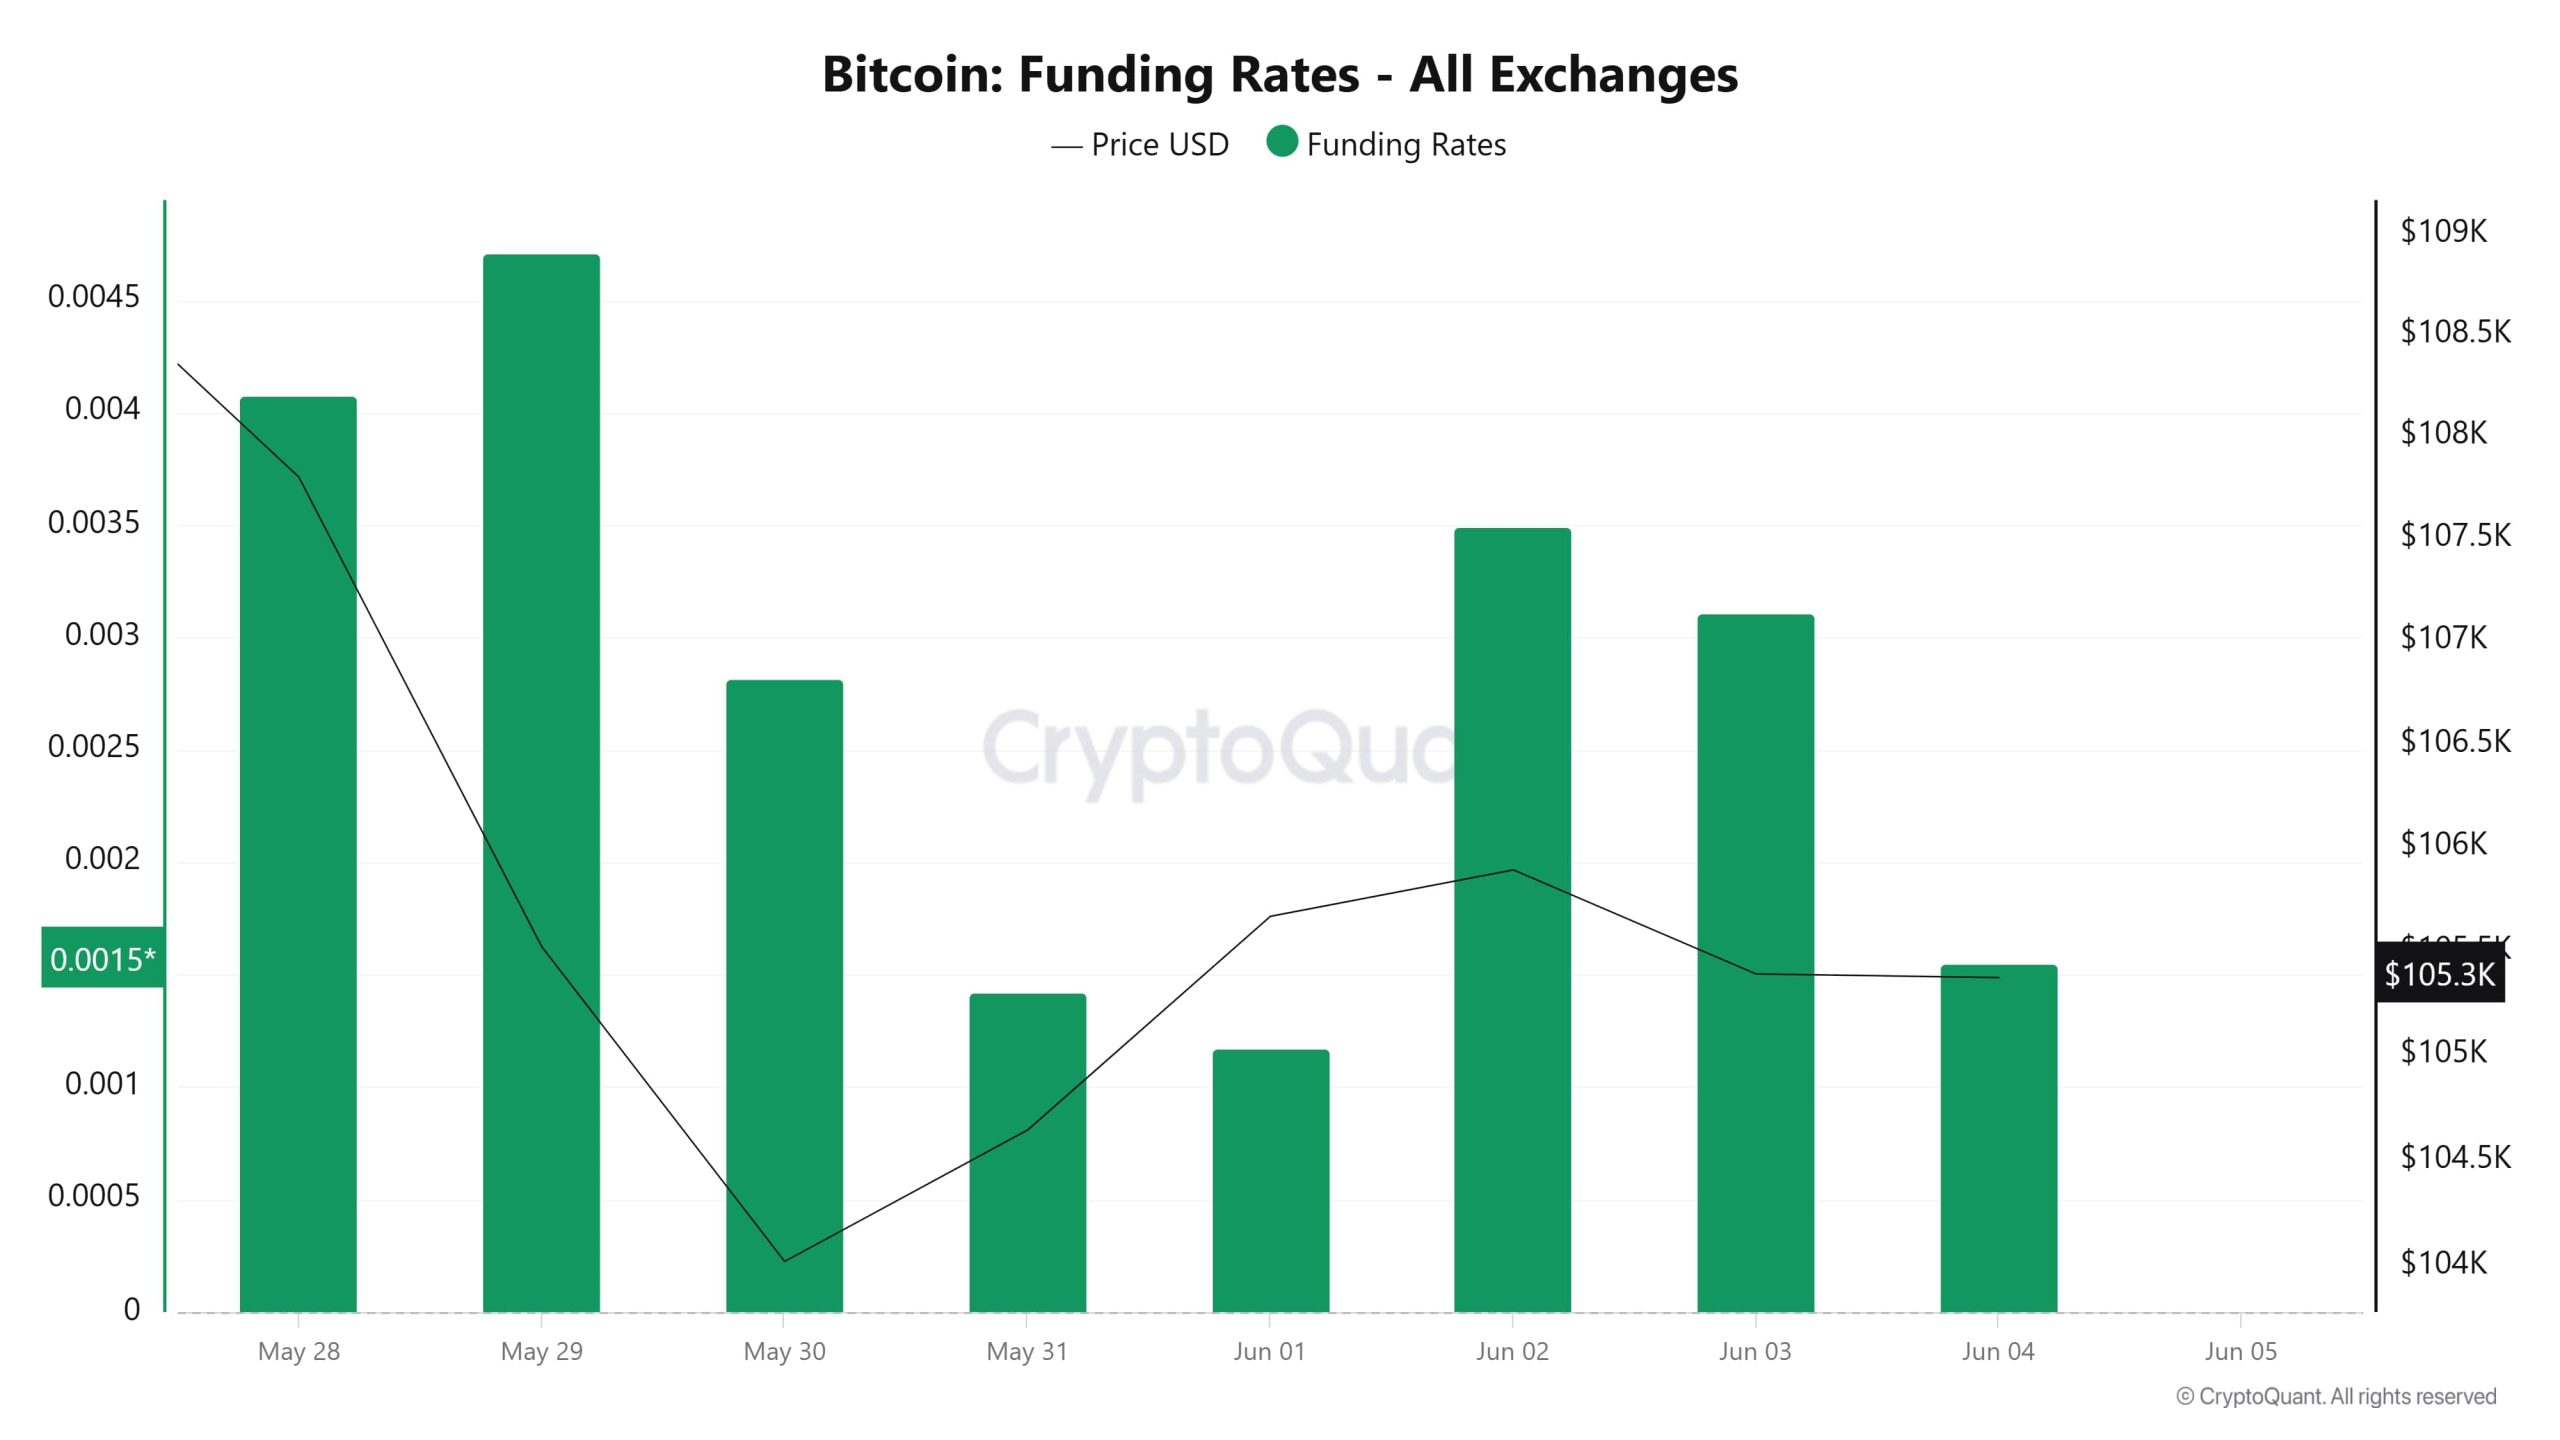
On June 11, while the funding rate started quite high, the price seems to have exhibited a downward movement. This suggests that traders maintained or even increased their long positions despite the falling price. On June 12, similarly, the funding rate remained strong, indicating that the market sees the decline as temporary and that bullish expectations continue. However, on June 13 and 14, funding rates weakened significantly. It can be said that there was a short-term decrease in investor appetite as a result of geopolitical risks. As of June 15, funding rates started to climb again, while a very sharp rise was observed on June 16. This move indicates that risk-taking tendency in the market has increased again and long positions have clearly dominated. However, this optimism did not last and on June 17, the funding rate fell along with the price. On June 18th, rates remained positive, but at a more moderate level compared to the previous days. The overall outlook suggests that investors have not completely given up on the uptrend, but have started to act cautiously. Even if the price pulls back, the continued weight on the long side suggests that the market is still dominated by an upside expectation.
Long & Short Liquidations
Bitcoin, which fell sharply after US President Donald Trump’s speech on June 12 that Israel may launch an attack soon and the start of tensions between Israel and Iran on June 13, liquidated $ 656 million worth of lon transactions this week. In contrast, 197 million dollars worth of short transactions were liquidated.
| Date | Long Amount (Million $) | Short Amount (Million $) |
|---|---|---|
| June 11 | 27.34 | 13.88 |
| June 12 | 363.29 | 10.46 |
| June 13 | 128.14 | 41.48 |
| June 14 | 18.77 | 6.89 |
| June 15 | 8.30 | 8.50 |
| June 16 | 17.40 | 88.59 |
| June 17 | 93.74 | 27.27 |
| Total | 656.98 | 197.07 |
Supply Distribution
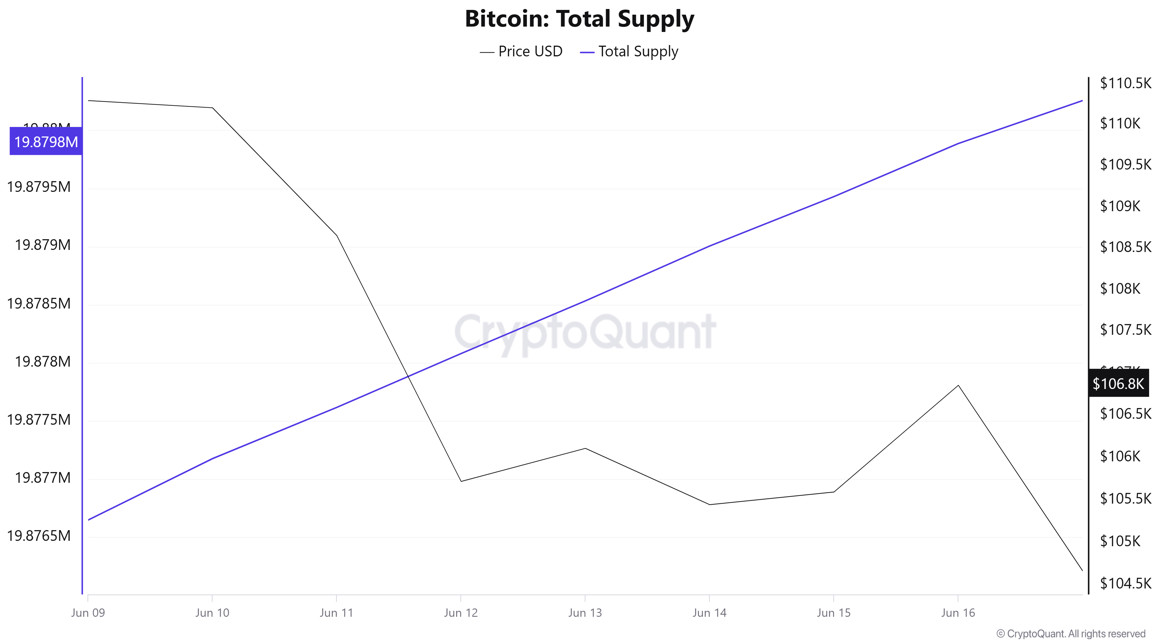
Total Supply: It reached 19,879,886 units, up about 0.0163% from last week.
New Supply: The amount of BTC produced this week was 3,237.
Velocity: Velocity, which was 12.91 last week, was 12.87 as of June 16.
| Wallet Category | 09.06.2025 | 17.06.2025 | Change (%) |
|---|---|---|---|
| < 1 BTC | 8.5% | 8.48% | -0.15% |
| 1 – 10 BTC | 11.4885% | 11.4706% | -0.16% |
| 10 – 100 BTC | 24.5406% | 24.5713% | +0.13% |
| 100 – 1k BTC | 28.7641% | 28.8714% | +0.37% |
| 1k – 10k BTC | 18.4560% | 18.3746% | -0.44% |
| 10k+ BTC | 8.2504% | 8.2271% | -0.28% |
According to the latest weekly data, <1 BTC wallets experienced a limited decrease of -0.15%, while the 1-10 BTC range saw a decrease of -0.16%. The 10-100 BTC segment experienced a +0.13% increase, with a more pronounced increase of +0.37% in 100-1k BTC. There was a -0.44% decrease in the 1k-10k BTC range, while the 10k+ BTC category decreased by -0.28%.
Exchange Reserve
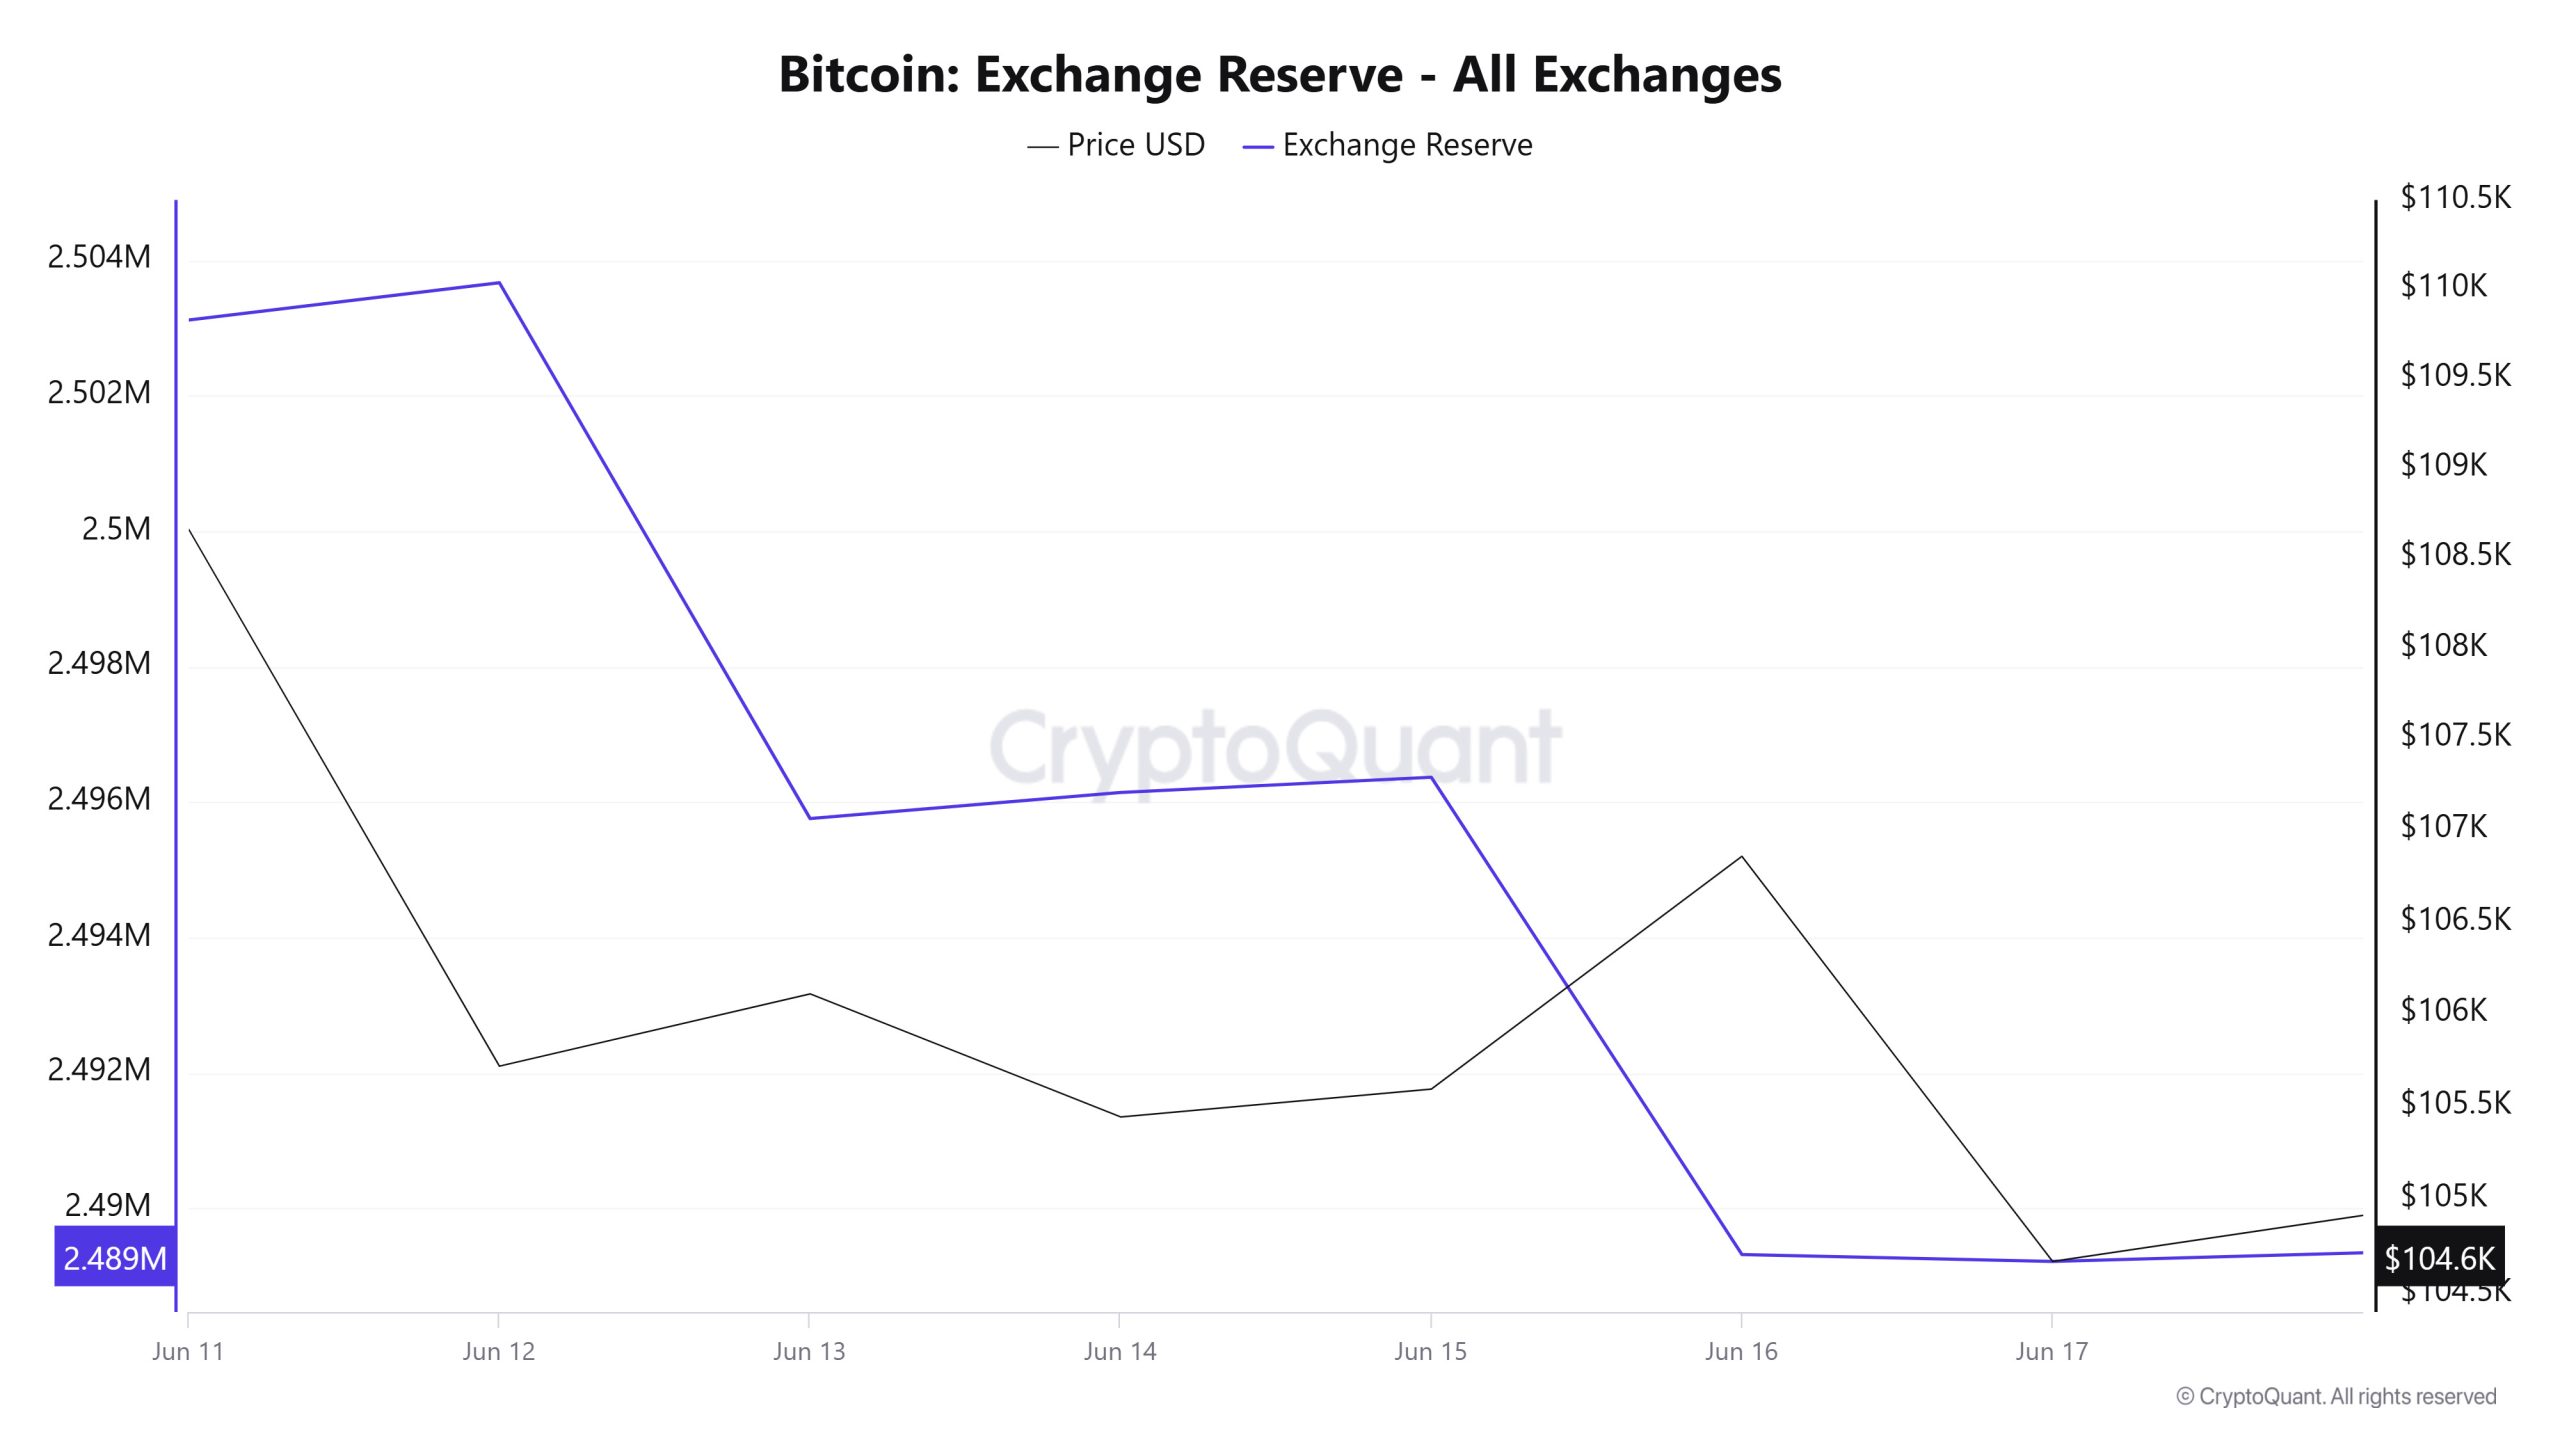
Between June 11-17, 2025, Bitcoin reserves on exchanges decreased from 2,503,122 BTC to 2,489,214 BTC. During this period, there was a total net outflow of 13,908 BTC and the Bitcoin reserves of exchanges decreased by approximately 0.56%. The Bitcoin price fell by 3.6% during the same period, from $108,656 to $104,668. Although the decline in reserves suggests that investors are moving their assets off-exchange and selling pressure is limited, the downward trend in Bitcoin price suggests that market sentiment is weakening. This outlook points to a market structure with weak potential in the short term.
| Date | 11-June | 12-June | 13-June | 14-June | 15-June | 16-June | 17-June |
|---|---|---|---|---|---|---|---|
| Exchange Inflow | 22,343 | 17,056 | 29,324 | 8,411 | 7,221 | 23,941 | 23,415 |
| Exchange Outflow | 23,370 | 16,506 | 37,239 | 8,027 | 6,995 | 30,993 | 23,517 |
| Exchange Netflow | -1,027 | 550 | -7,915 | 384 | 226 | -7,052 | -101 |
| Exchange Reserve | 2,503,122 | 2,503,672 | 2,495,757 | 2,496,142 | 2,496,367 | 2,489,316 | 2,489,214 |
| BTC Price | 108,656 | 105,717 | 106,108 | 105,444 | 105,593 | 106,857 | 104,668 |
Fees and Revenues
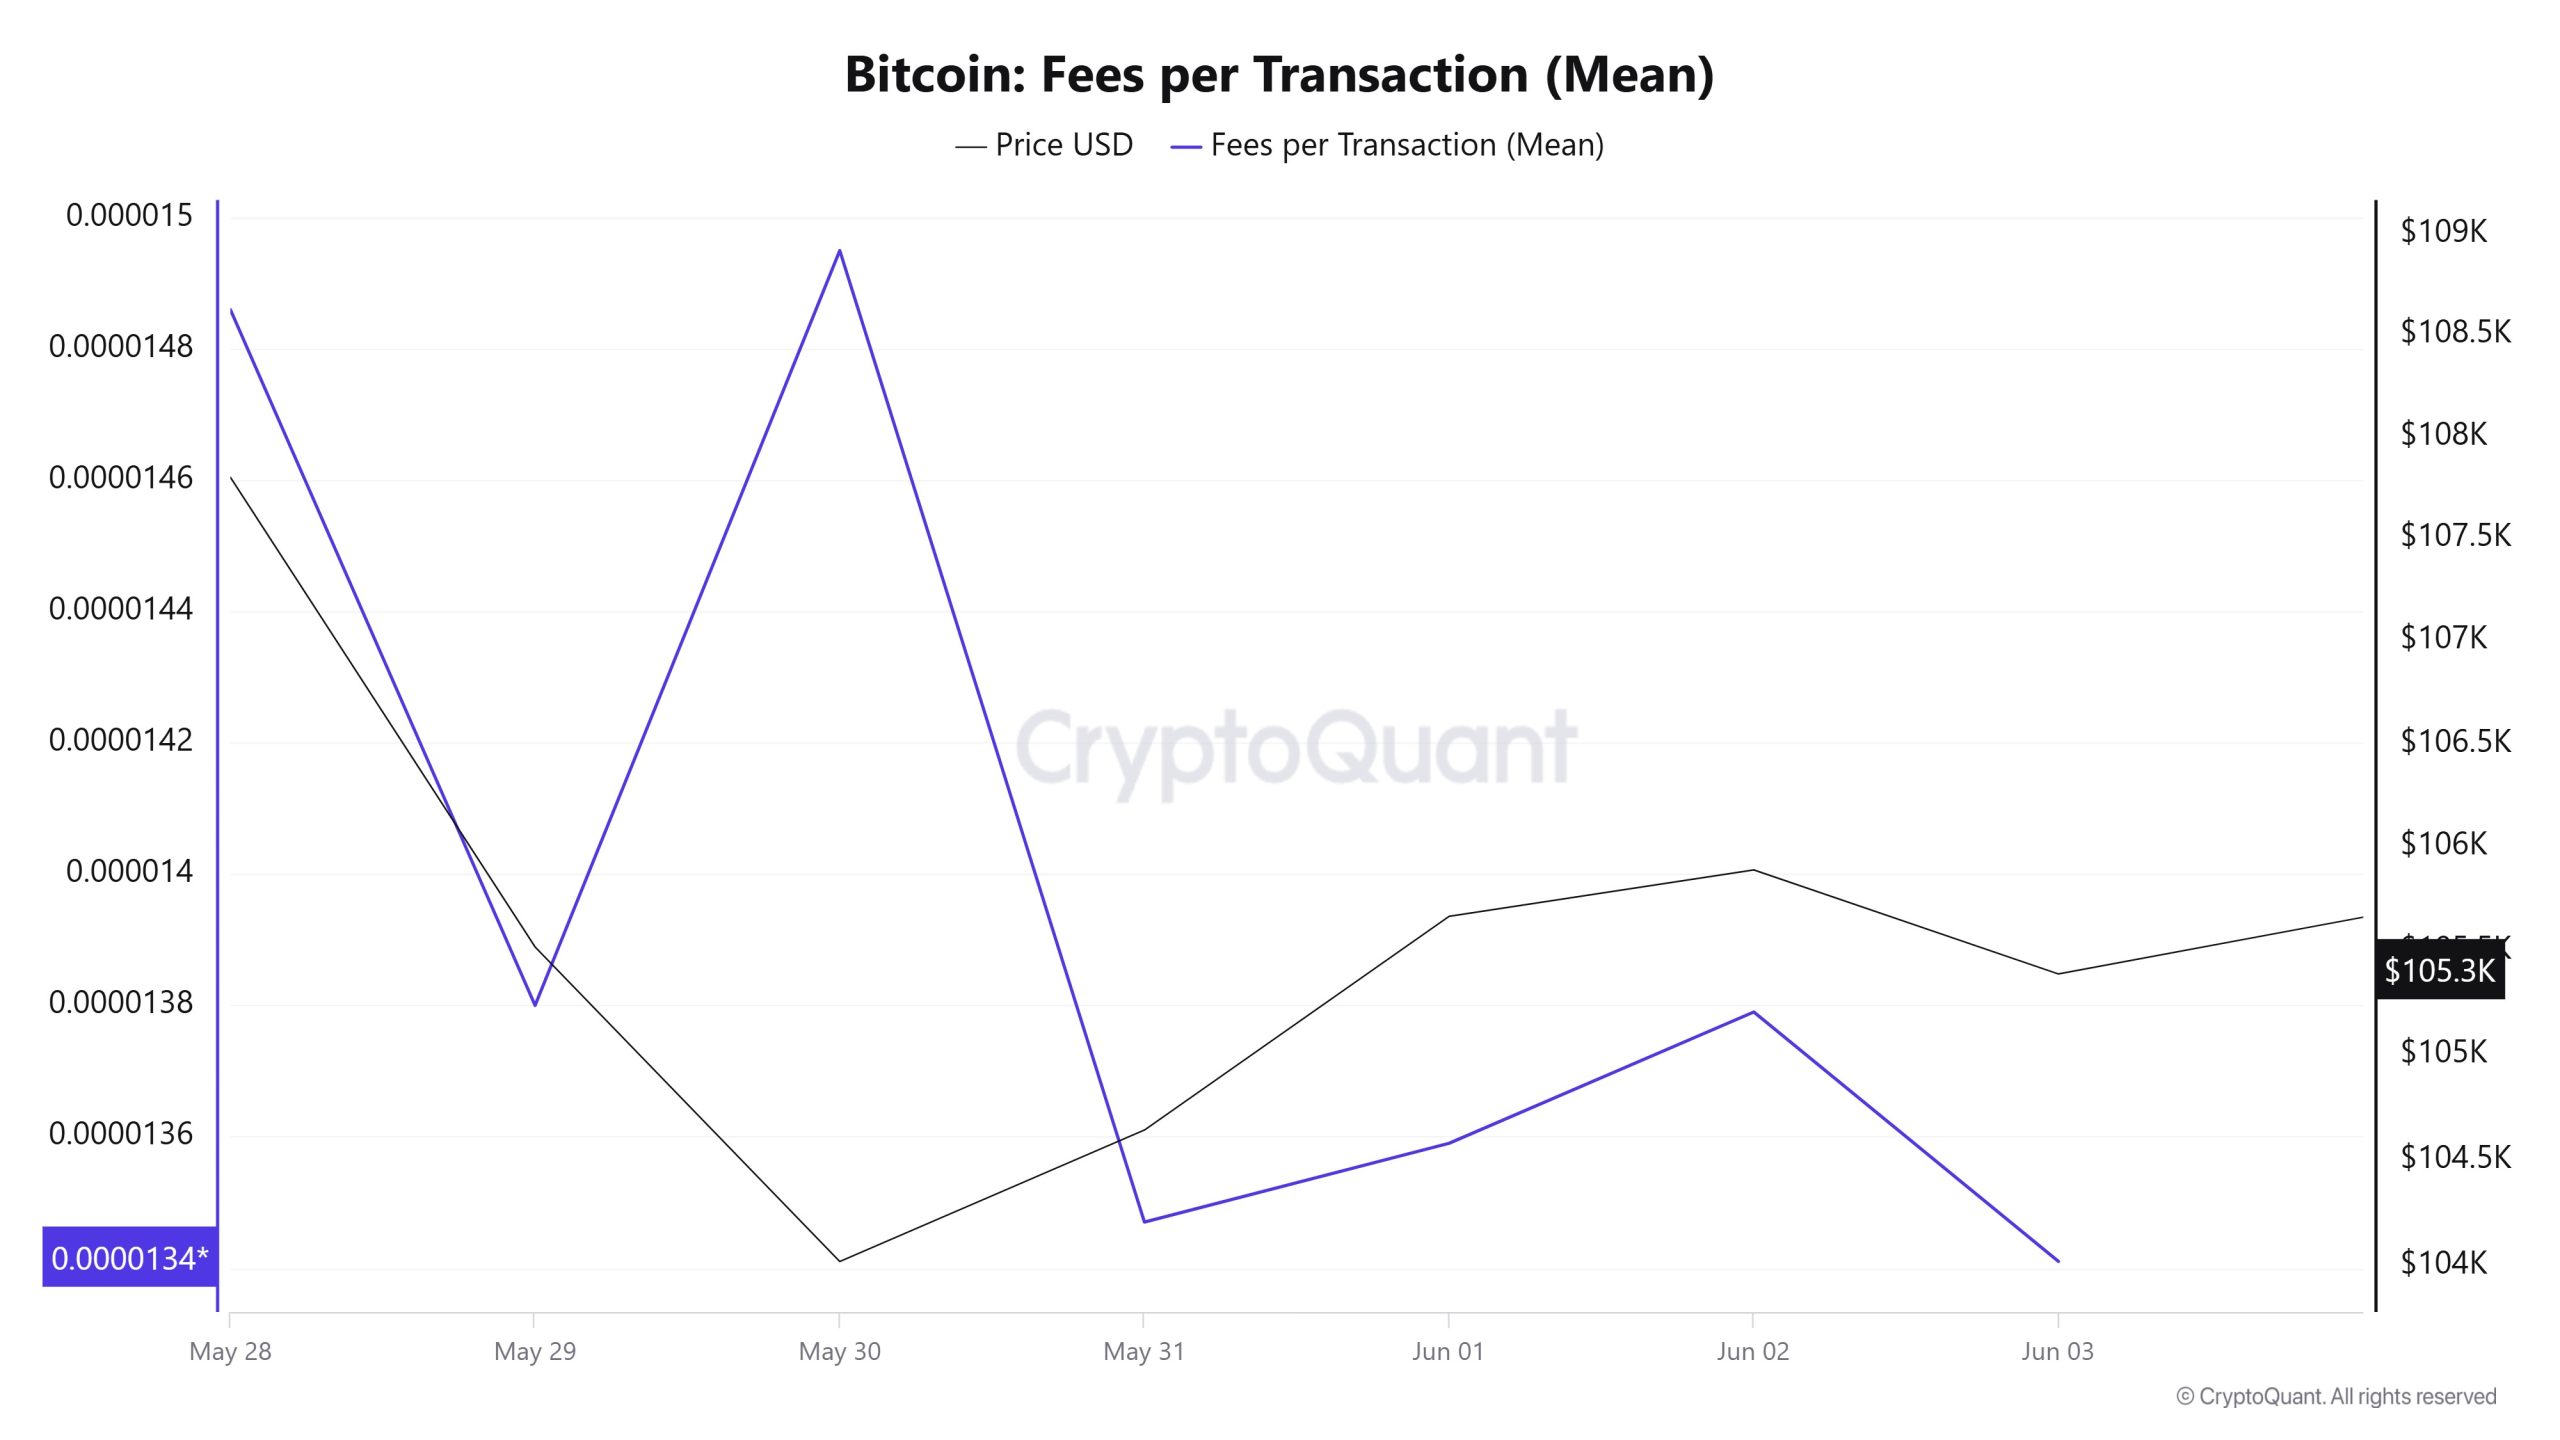
When the Bitcoin Fees per Transaction (Mean) data between June 11 and June 17 are analyzed, it is seen that this indicator was realized at 0.00001373 on June 11, the first day of the week.
On June 12, the data in question showed a slight retreat; however, on June 13, it entered an upward trend due to the volatile movements in the Bitcoin price, reaching 0.00001858 and thus recording the highest value of the week.
After this date, a downward trend was observed in the indicator, which fell to 0.00000933 as of June 15, reaching its lowest level of the week.
In the following days, Bitcoin Fees per Transaction (Mean) started to rise again and closed at 0.00001766 on June 17, the last day of the week.
Bitcoin: Fees (Total)
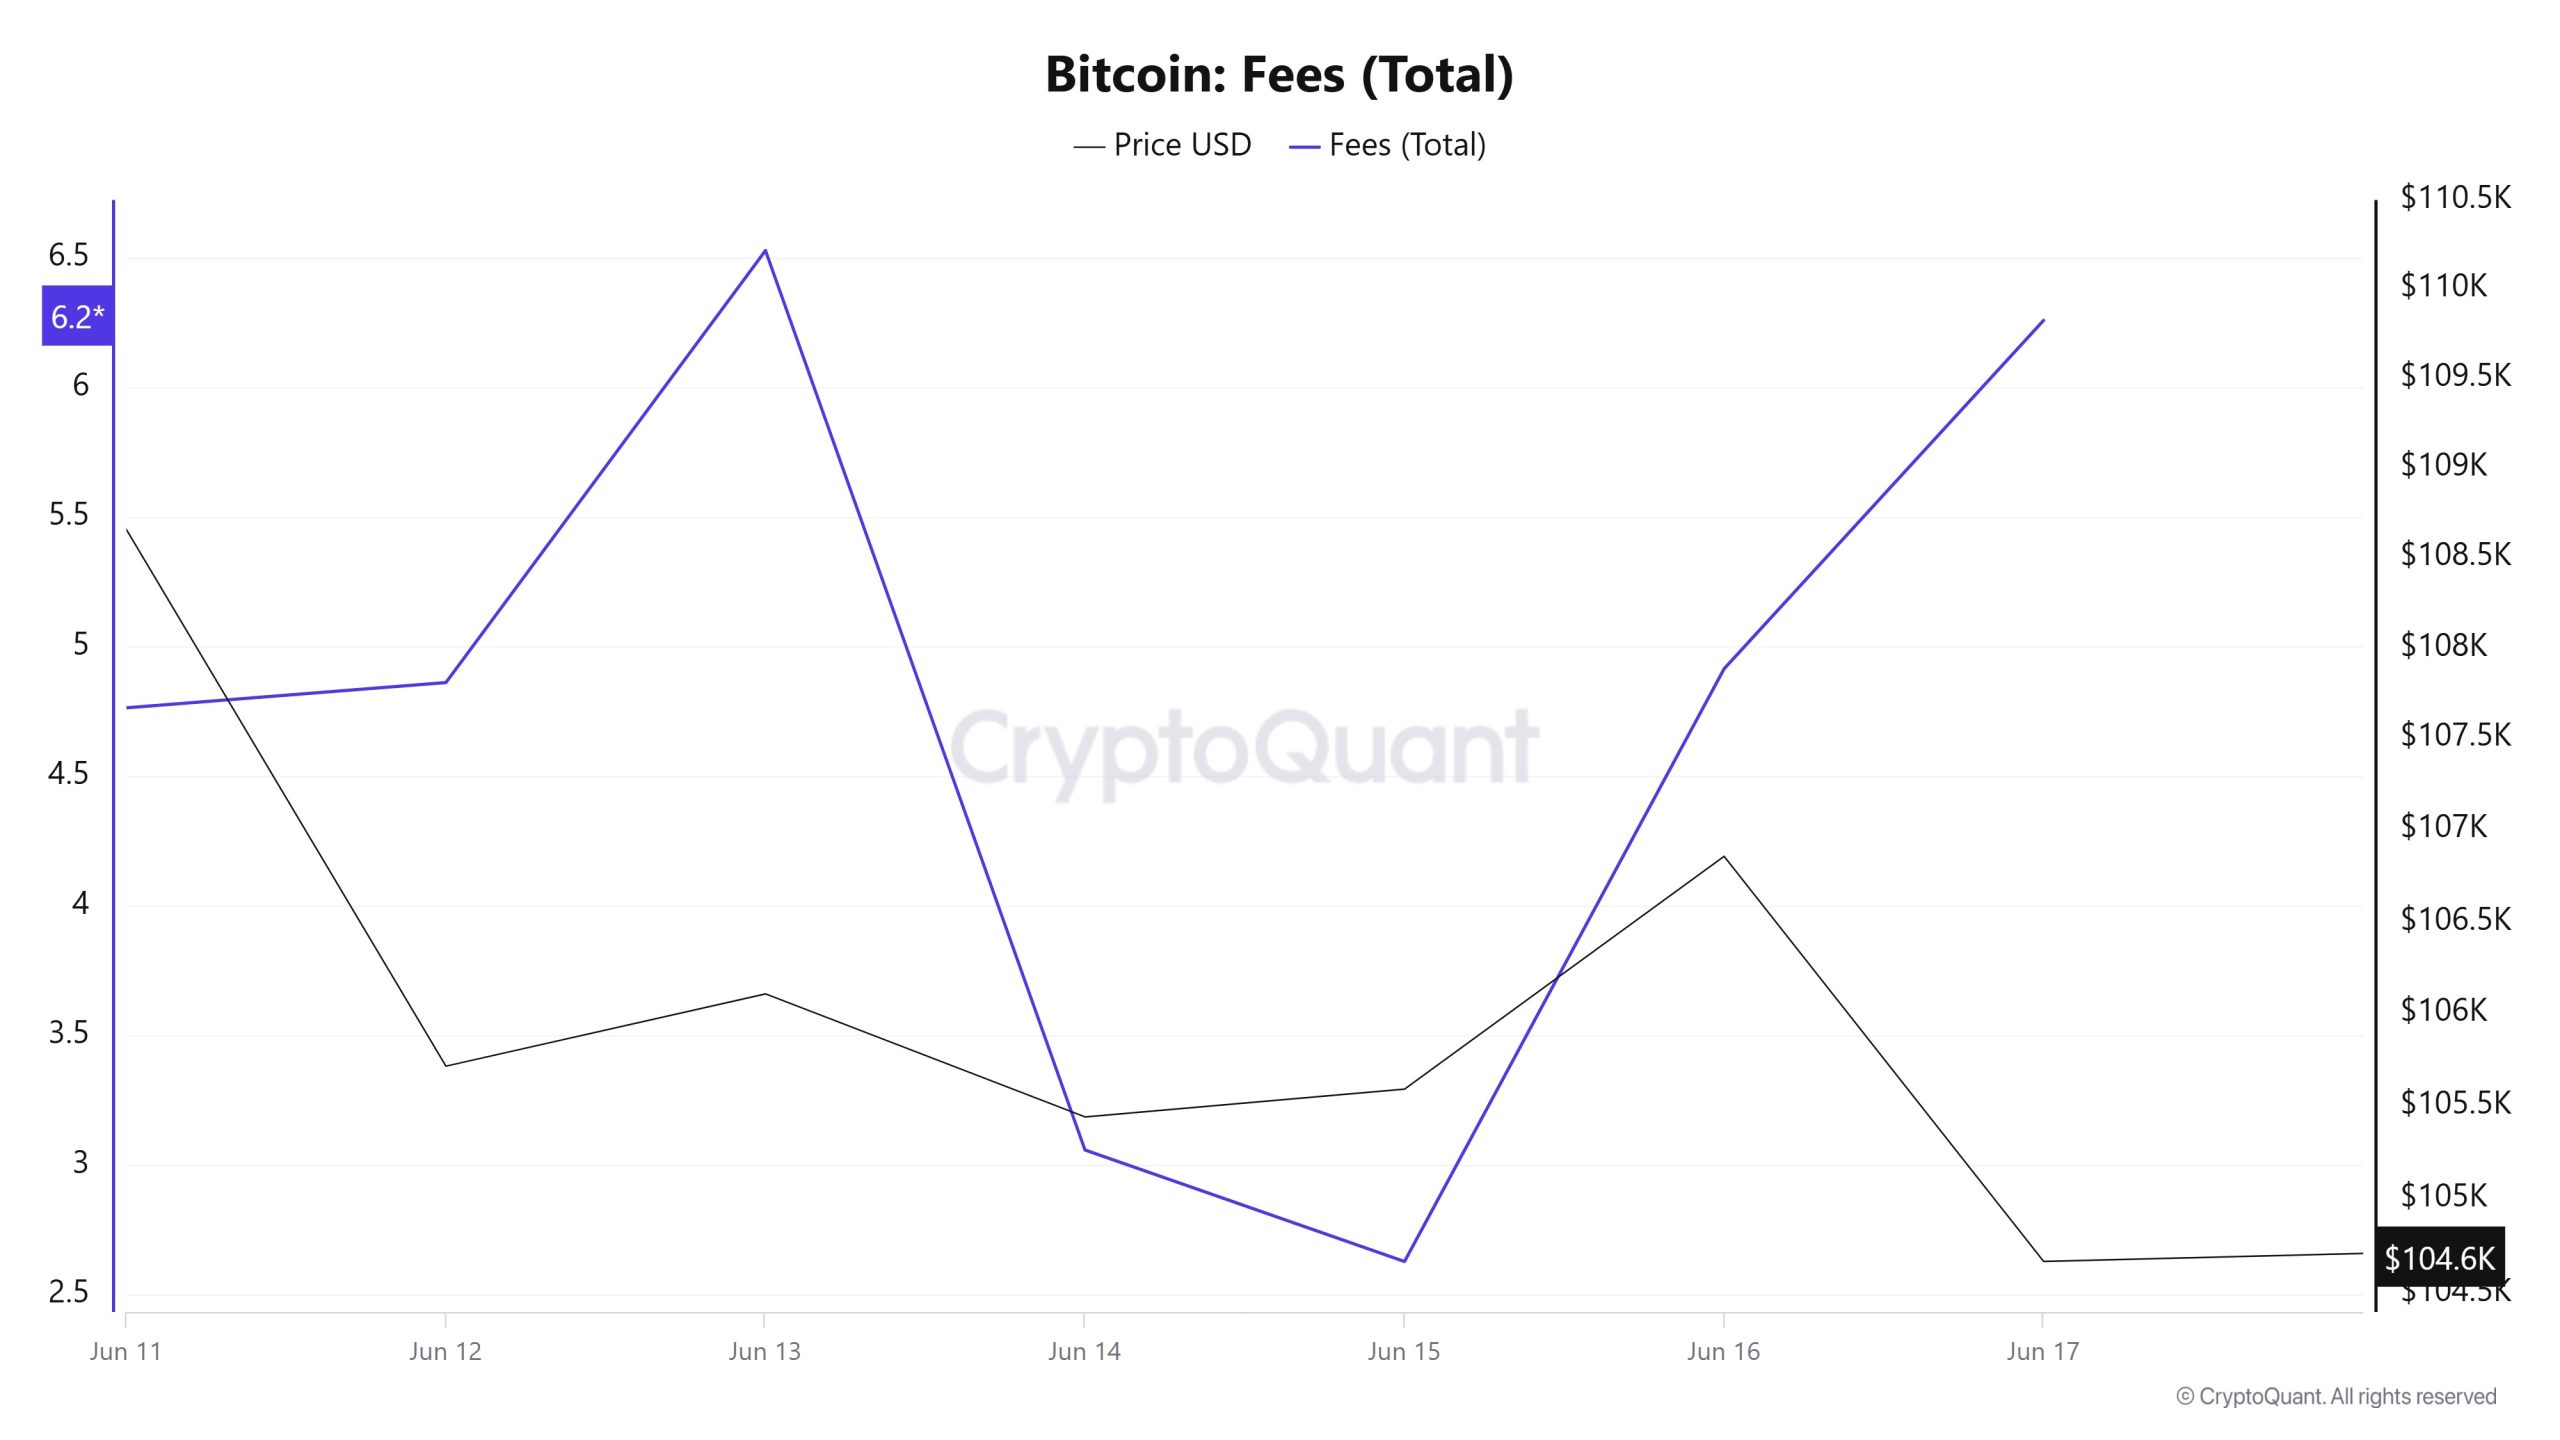
Similarly, an analysis of Bitcoin Fees (Total) data between June 11 and June 17 shows that this indicator stood at 4.7645727 on June 11, the first day of the week.
On June 12, the data in question showed a slight retreat; however, on June 13, it entered an upward trend due to the volatile movements in the Bitcoin price, reaching 6.52806429 and thus recording the highest value of the week.
After this date, a downward trend was observed in the indicator, which fell to 2.62938943 as of June 15, reaching its lowest level of the week.
In the following days, Bitcoin Fees (Total) started to rise again and closed at 6.25886652 on June 17, the last day of the week.
Miner Flows
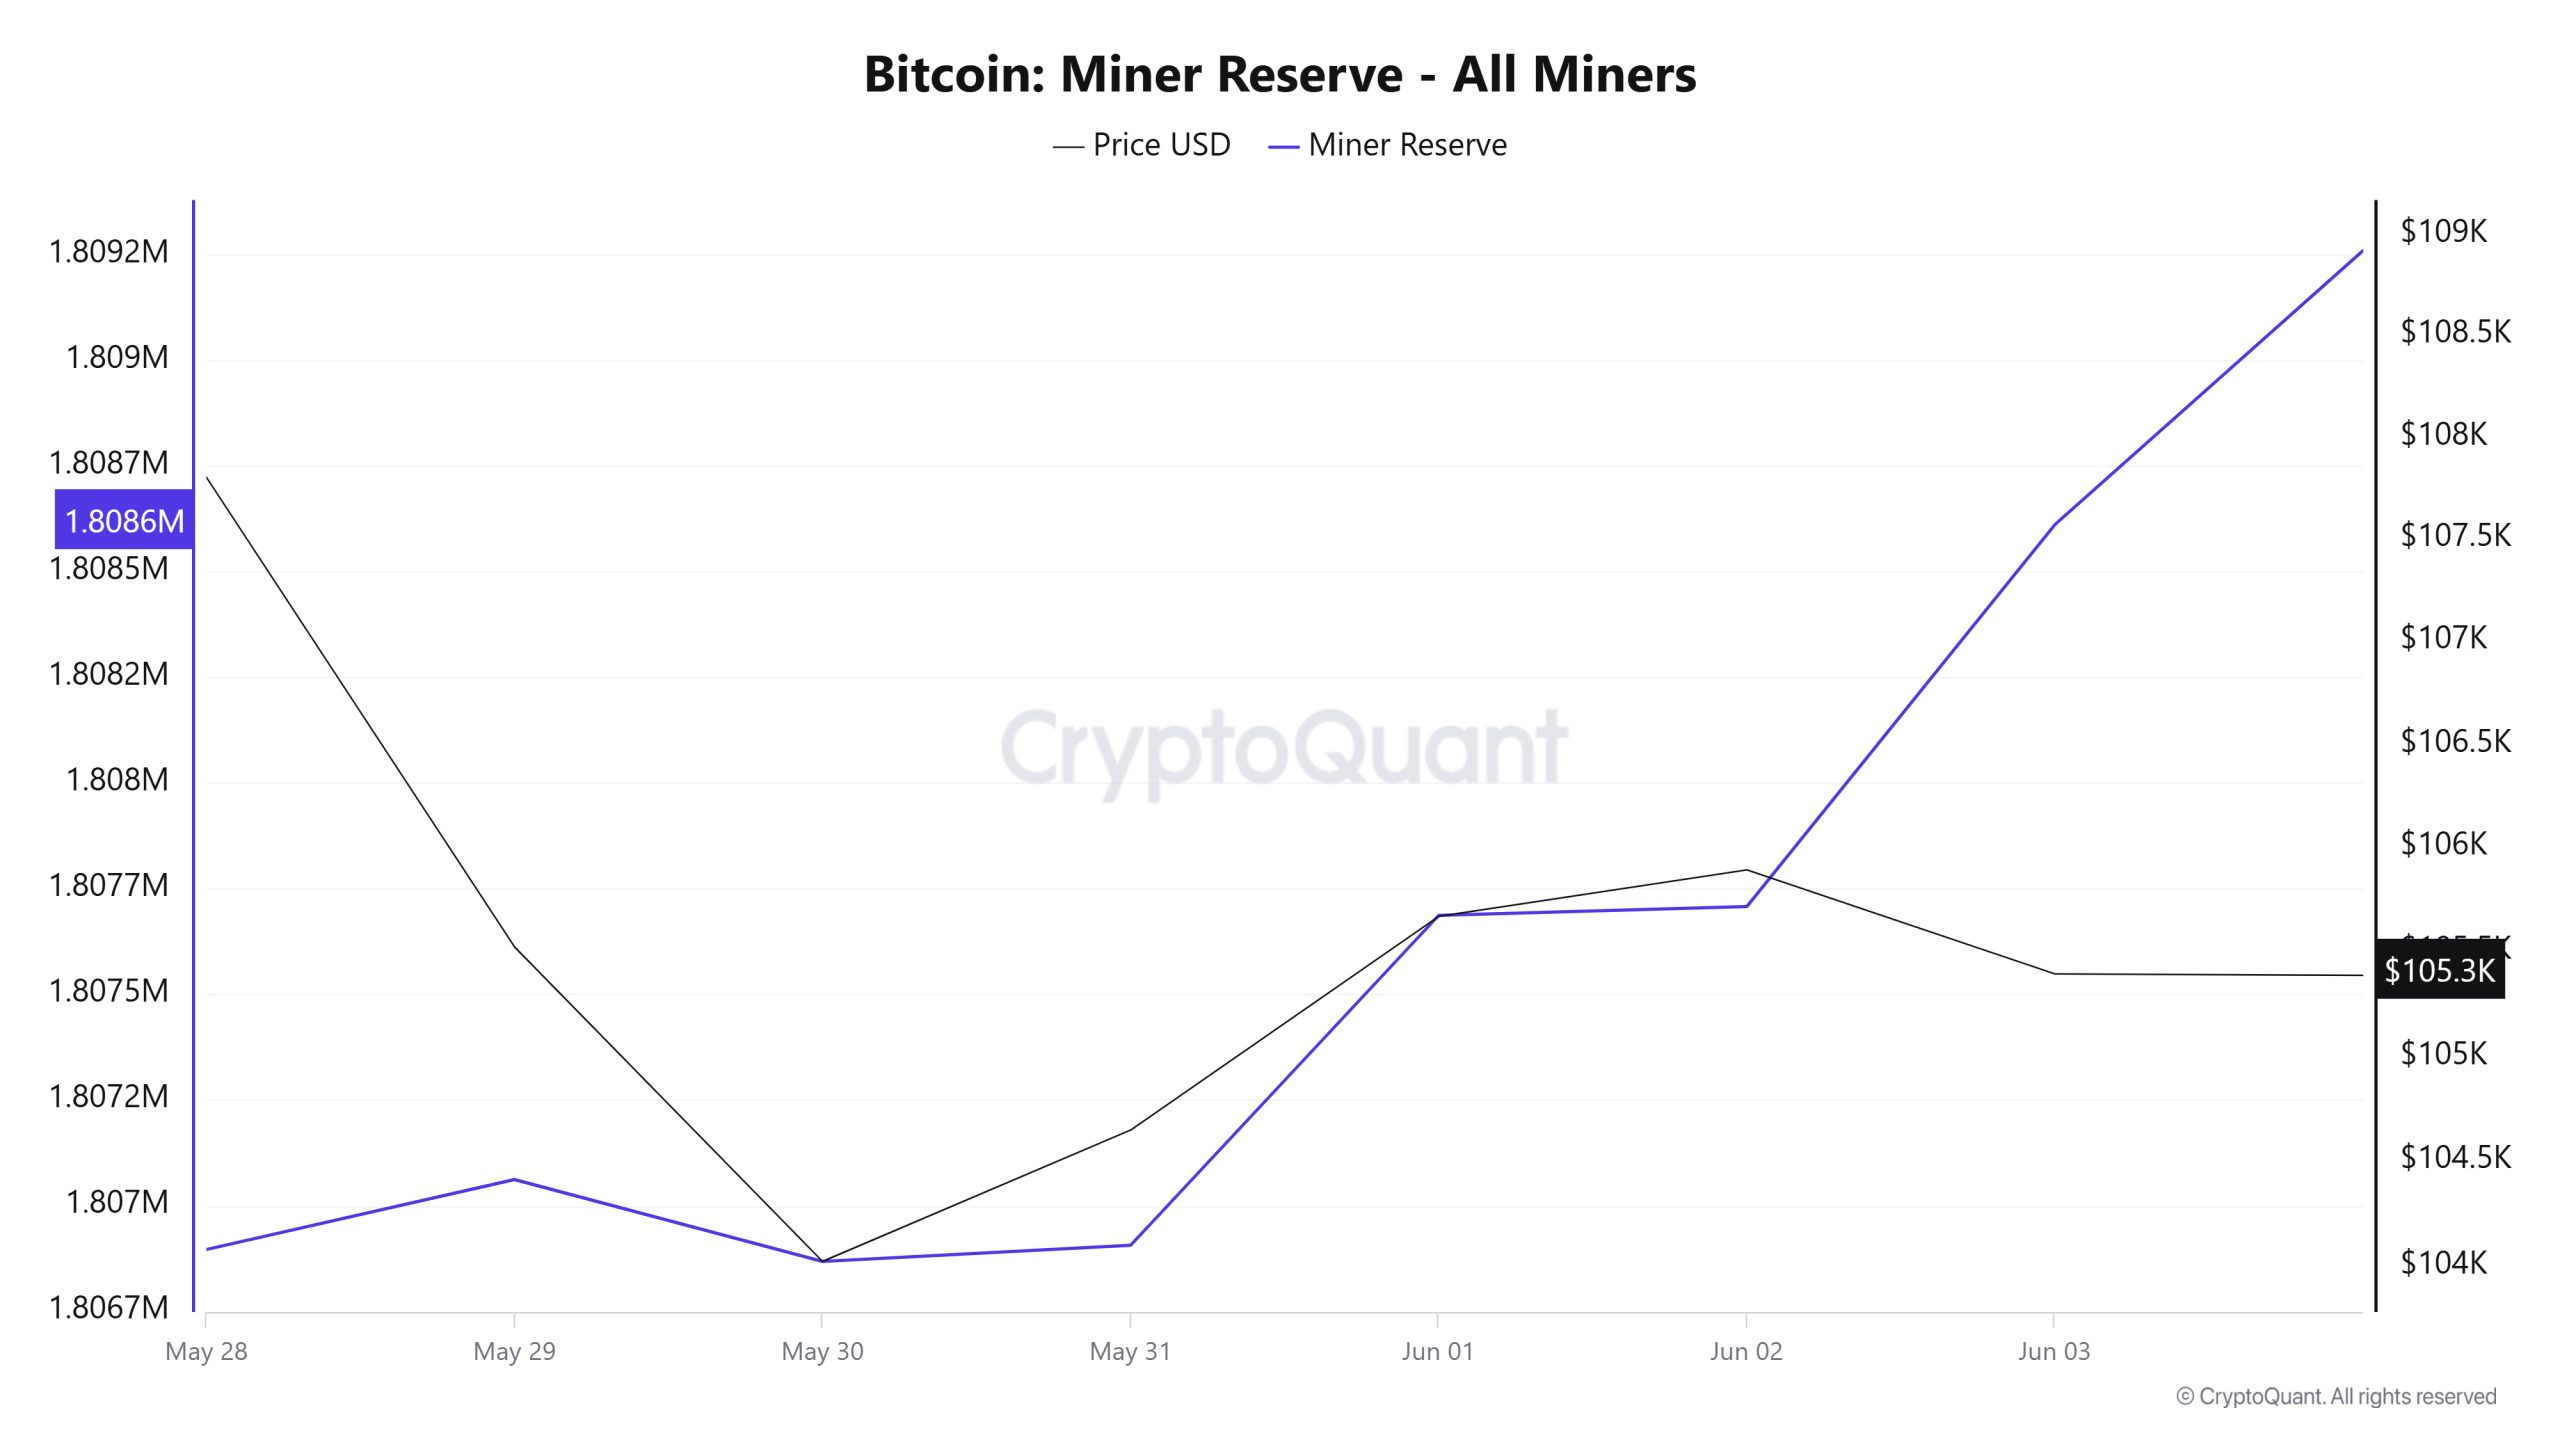
According to data from the Miner Reserve table, there was an increase in Bitcoin reserves held in miners’ wallets this week. There was a positive correlation between Miner Reserve and Bitcoin price throughout the week.
Miner Inflow, Outflow and Netflow
Between June 11 and June 17, 31,787 Bitcoins exited miners’ wallets and 32,444 Bitcoins entered miners’ wallets between the same dates. The Miner Netflow for this week was 657 Bitcoin. Meanwhile, the Bitcoin price was $108,665 on June 11 and $104,665 on June 17.
For the week, the net flow (Miner Netflow) was positive as Bitcoin inflow into miner wallets (Miner Inflow) was higher than Bitcoin outflow from miner wallets (Miner Outflow).
| Date | June 11 | June 12 | June 13 | June 14 | June 15 | June 16 | June 17 |
|---|---|---|---|---|---|---|---|
| Miner Inflow | 4867.78 | 4921.73 | 7164.24 | 2714.89 | 2260.25 | 5236.74 | 5279.00 |
| Miner Outflow | 4845.48 | 4862.26 | 6239.59 | 4119.33 | 2226.41 | 3951.48 | 5543.40 |
| Miner Netflow | 22.30 | 59.47 | 924.65 | -1404.44 | 33.84 | 1285.26 | -264.40 |
Transaction
“Bitcoin Transaction Count (Total) – image to be added”
Last week, there were 2,343,485 transactions on the Bitcoin network, while this week it increased by about 2.18% to 2,394,602. The 273,699 transactions recorded on June 14 was the lowest transaction volume of the week, while the highest number of transactions was 425,265 on June 12.
Correlations between price and the number of trades were mixed throughout the week, with negative correlations dominating at the beginning of the week and positive correlations towards the middle of the week, suggesting that the market is in a decision phase and investors may be on the verge of a new trend or that volatility will continue in the short term.
Tokens Transferred
Last week, 4,125,792 BTC was transferred, while this week it decreased by approximately 9.94% to 3,715,566 BTC. June 17 saw the highest token transfer volume of the week with 687,826 BTC transfers, while June 15 saw the lowest token transfer volume with 279,532 BTC. Positive correlations between the amount of BTC transferred on the network and the price started to increase this week.
Whale Activities
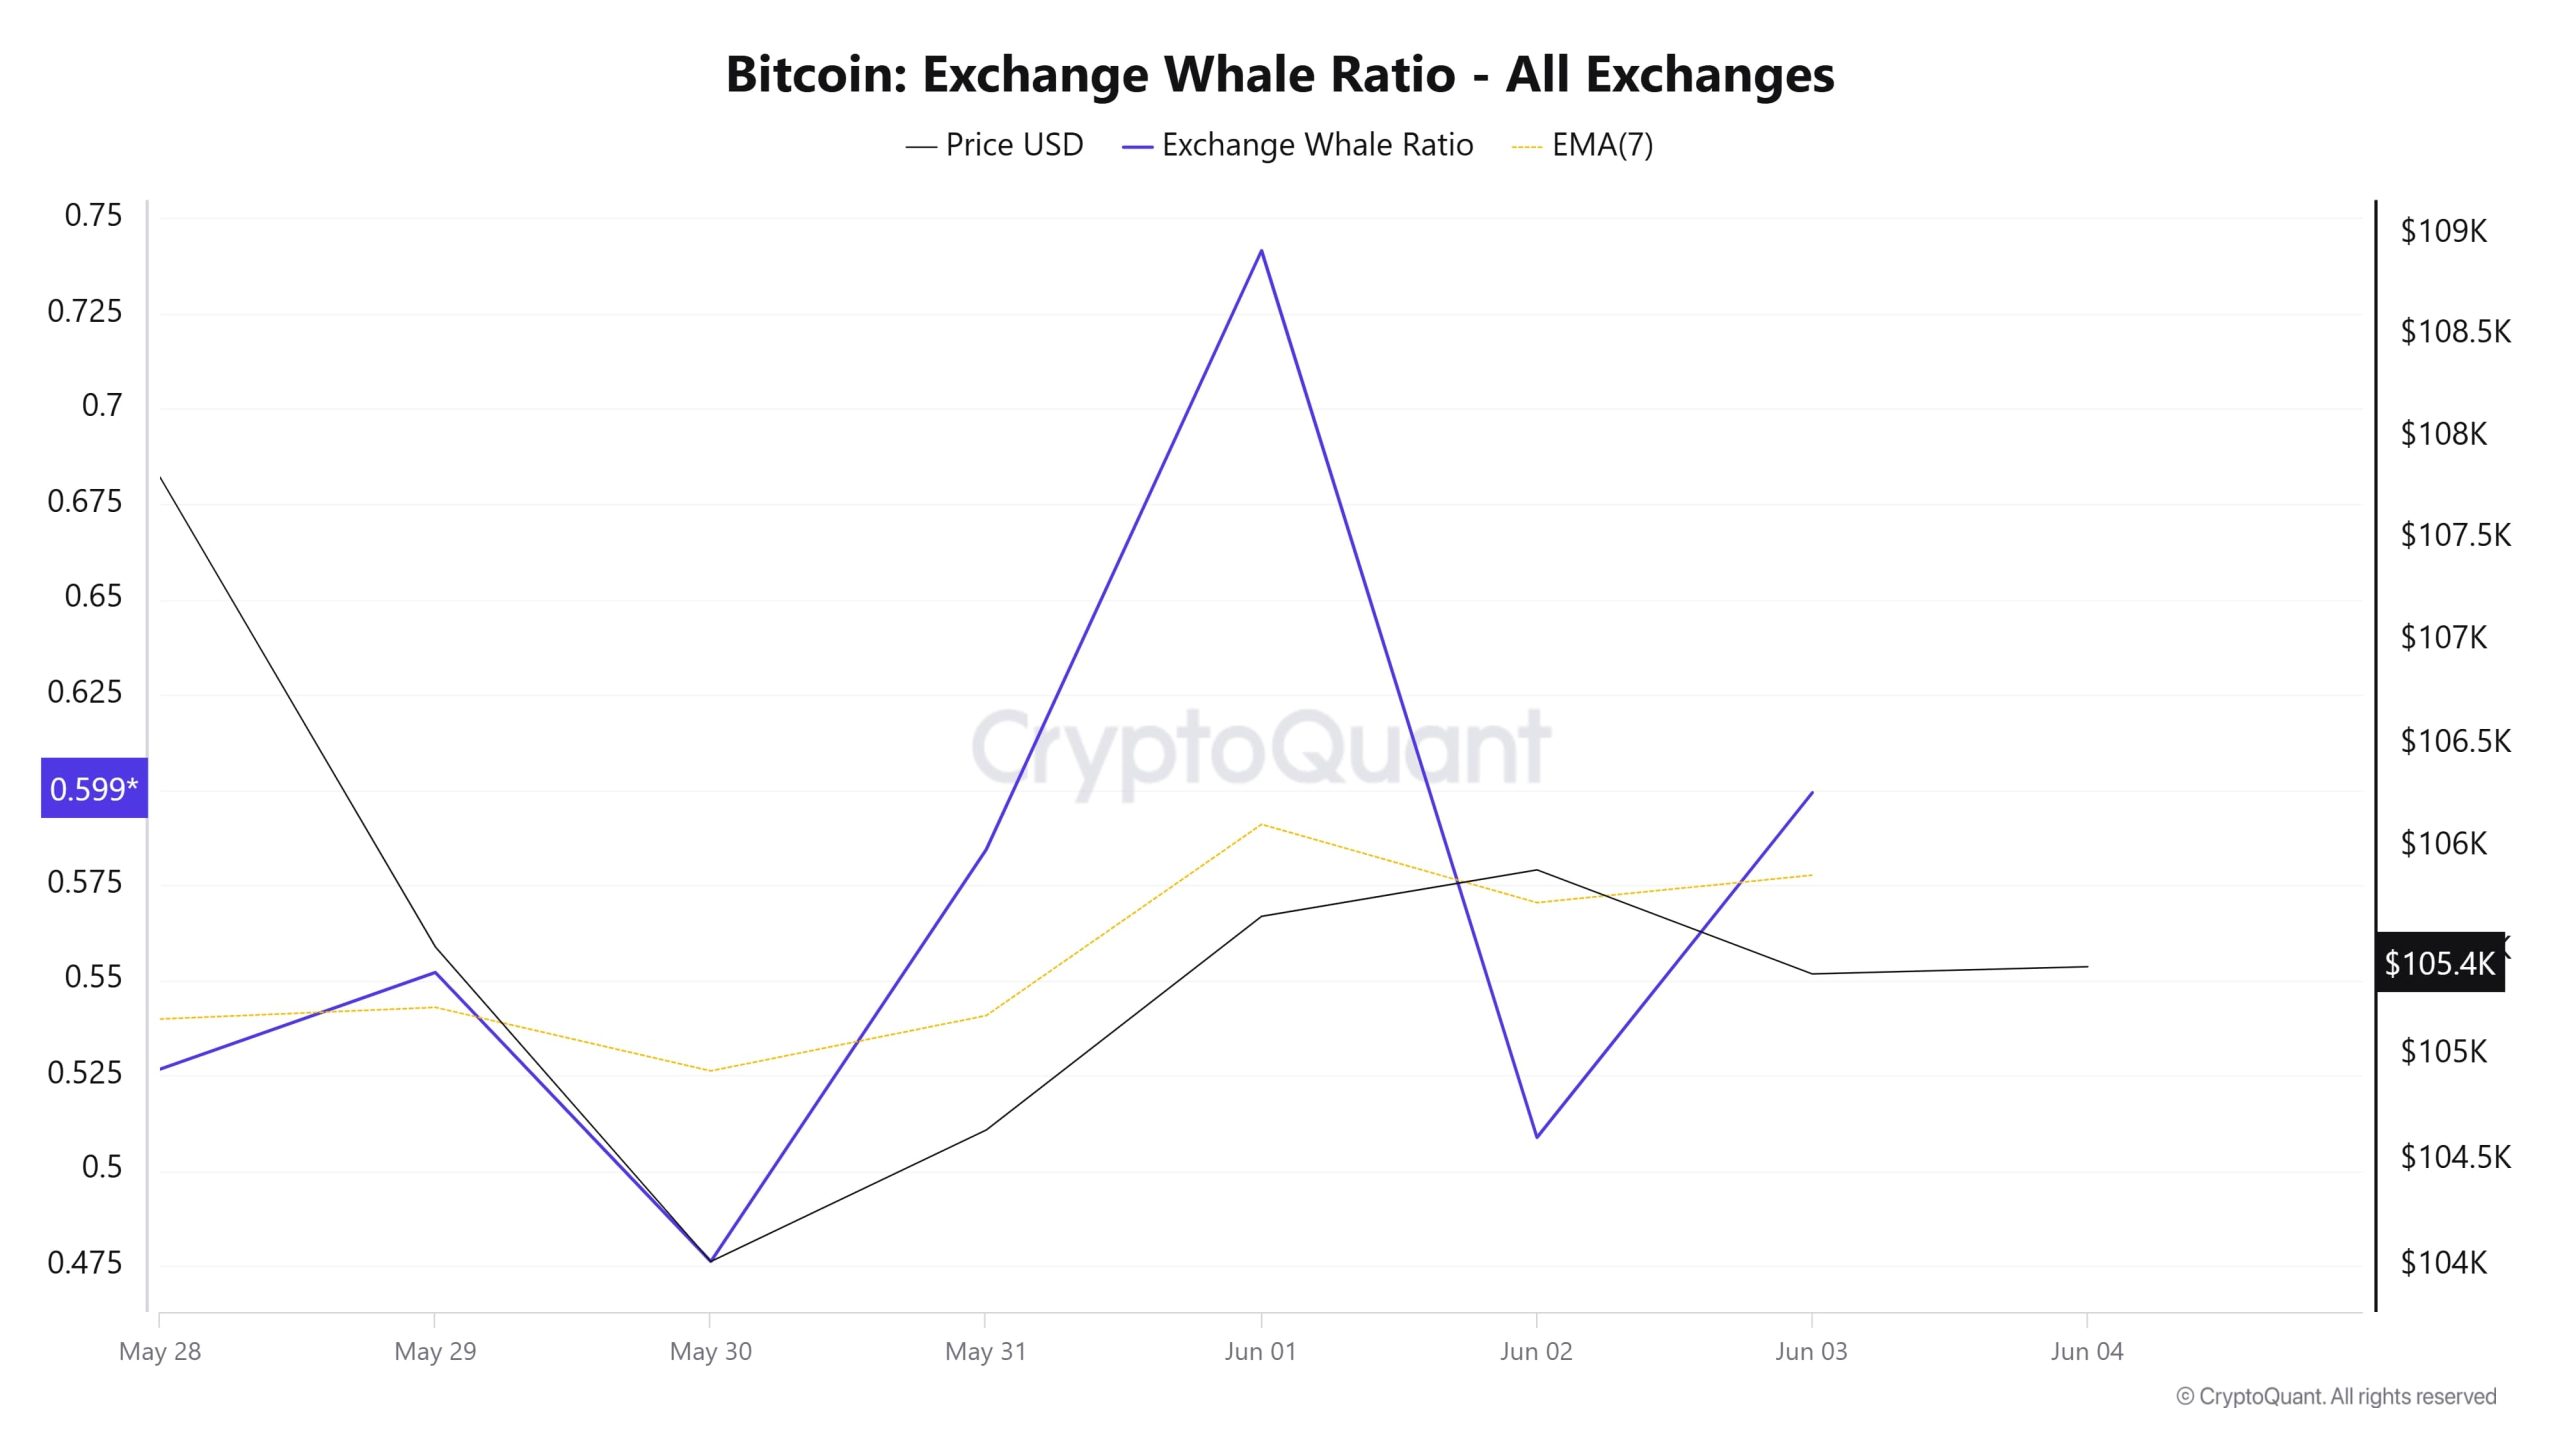
Whales Data:
Over the last 7 days, data from the cryptocurrency market showed that whale activity on centralized exchanges was high at the beginning of the process. Towards the middle of the process, these activities declined. When we look at the Exchange Whale Ratio metric, June 11, the first day of the 7-day period, measured the rate of whales using central exchanges at 0.573, which was the peak of the process. When this ratio is above 0.35, it usually means that whales use central exchanges frequently. This measurement decreased towards the middle of the process, falling to 0.515 on June 14. The lowest point of the process occurred on June 16, reaching 0.497. Currently, it stands at 0.584 and centralized exchanges continue to be used frequently. The fact that BTC moved between $109,000 and $103,000 at the beginning of this process indicates that whales use central exchanges mostly to sell. At the same time, the total number of BTC transfers decreased by about 10% compared to last week, with 3,715,566 BTC moving. The data shows that Bitcoin whales have accumulated $240,000 worth of BTC this year. This whale accumulation trend, which includes strategic purchases, reflects potential high net worth investor confidence and affects market liquidity and volatility. As a result, whales’ use of centralized exchanges for selling could have a negative impact on the price. However, the high number of institutional purchases may offset this.
BTC Onchain Overall
| Metric | Rise 📈 | Decline 📉 | Neutral ➖ |
|---|---|---|---|
| Active Addresses | ✓ | ||
| Breakdowns | ✓ | ||
| Derivatives | ✓ | ||
| Supply Distribution | ✓ | ||
| Exchange Reserve | ✓ | ||
| Fees and Revenues | ✓ | ||
| Miner Flows | ✓ | ||
| Transaction | ✓ | ||
| Whale Activities | ✓ |
*The metrics and guidance in the table do not, by themselves, describe or imply an expectation of future price changes for any asset. The prices of digital assets may vary depending on many different variables. The onchain analysis and related guidance is intended to assist investors in their decision-making process, and making financial investments based solely on the results of this analysis may result in harmful transactions. Even if all metrics produce a bullish, bearish or neutral result at the same time, the expected results may not be seen depending on market conditions. Investors who review the report should take these warnings into account.
LEGAL NOTICE
The investment information, comments and recommendations contained in this document do not constitute investment advisory services. Investment advisory services are provided by authorized institutions on a personal basis, taking into account the risk and return preferences of individuals. The comments and recommendations contained in this document are of a general type. These recommendations may not be suitable for your financial situation and risk and return preferences. Therefore, making an investment decision based solely on the information contained in this document may not result in results that are in line with your expectations.
NOTE: All data used in Bitcoin onchain analysis is based on Cryptoqaunt.