
Active Adresses
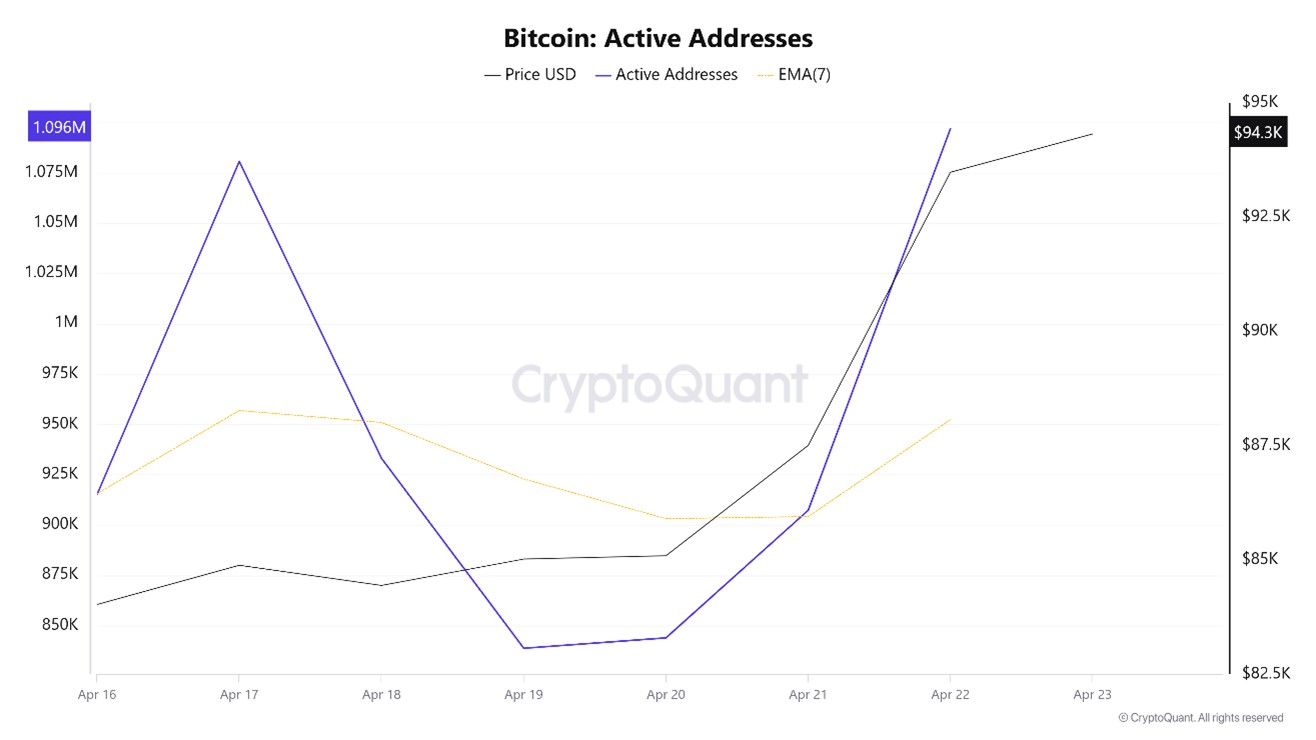
In terms of active addresses, there were 1,096,708 active entries on the BTC network this week between April 16 and April 23, 2025. During this period, Bitcoin rose to the $93,000 level. In the region marked on the chart, where the price and the number of active addresses intersect, we see that Bitcoin purchases have changed direction. When we follow the 7-day simple moving average, it is observed that the price follows an upward trend on the dates when this average cuts the price. This situation indicates that the Bitcoin price is experiencing entries at $85,000 levels.
Active Sending Addresses
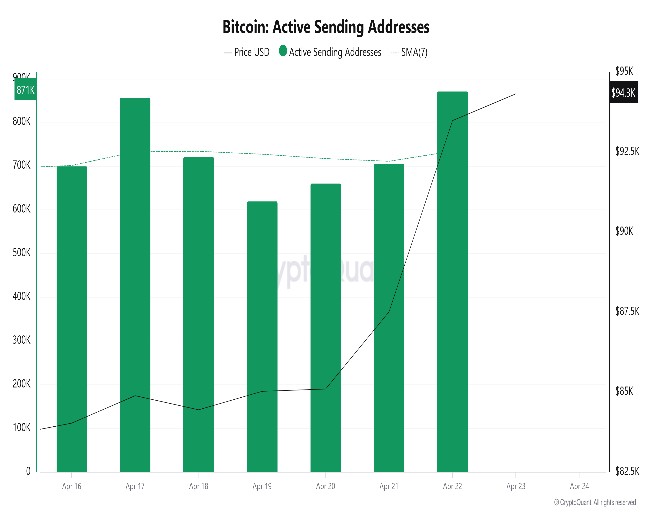
With the Black Line (price line) in active shipping addresses, there has been a significant drop in active shipping addresses after April 19. On the day when the price hit its lowest point, active sending addresses rose as high as 838,836, indicating that buyers sold their positions as Bitcoin stayed around the $84,000 level for a while. As a result, it is seen that price drops cause an acceleration in sending addresses.
Active Receiving Addresses
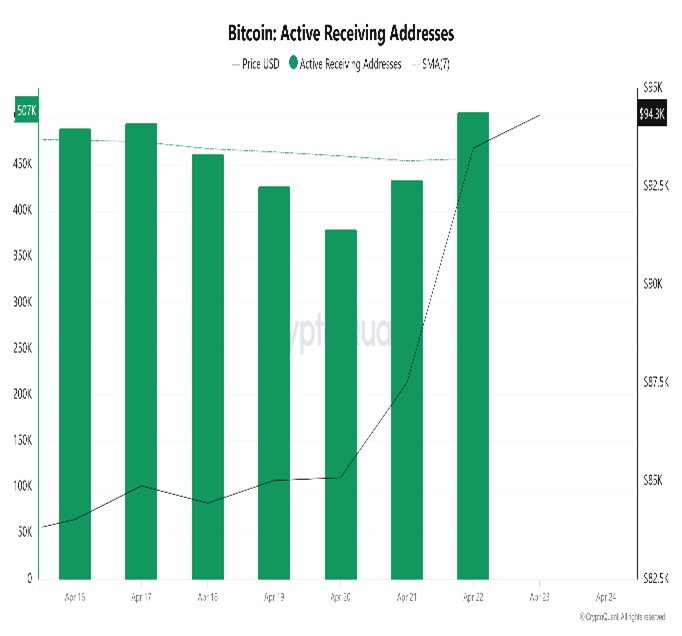
With the Black Line (price line) in active shipping addresses, there has been a significant rise in active shipping addresses after April 17. On the day of the price high point, active shipping addresses rose as high as 1,080,565, indicating that buyers took their positions at Bitcoin’s $84,000 level.
Breakdowns
MRVR
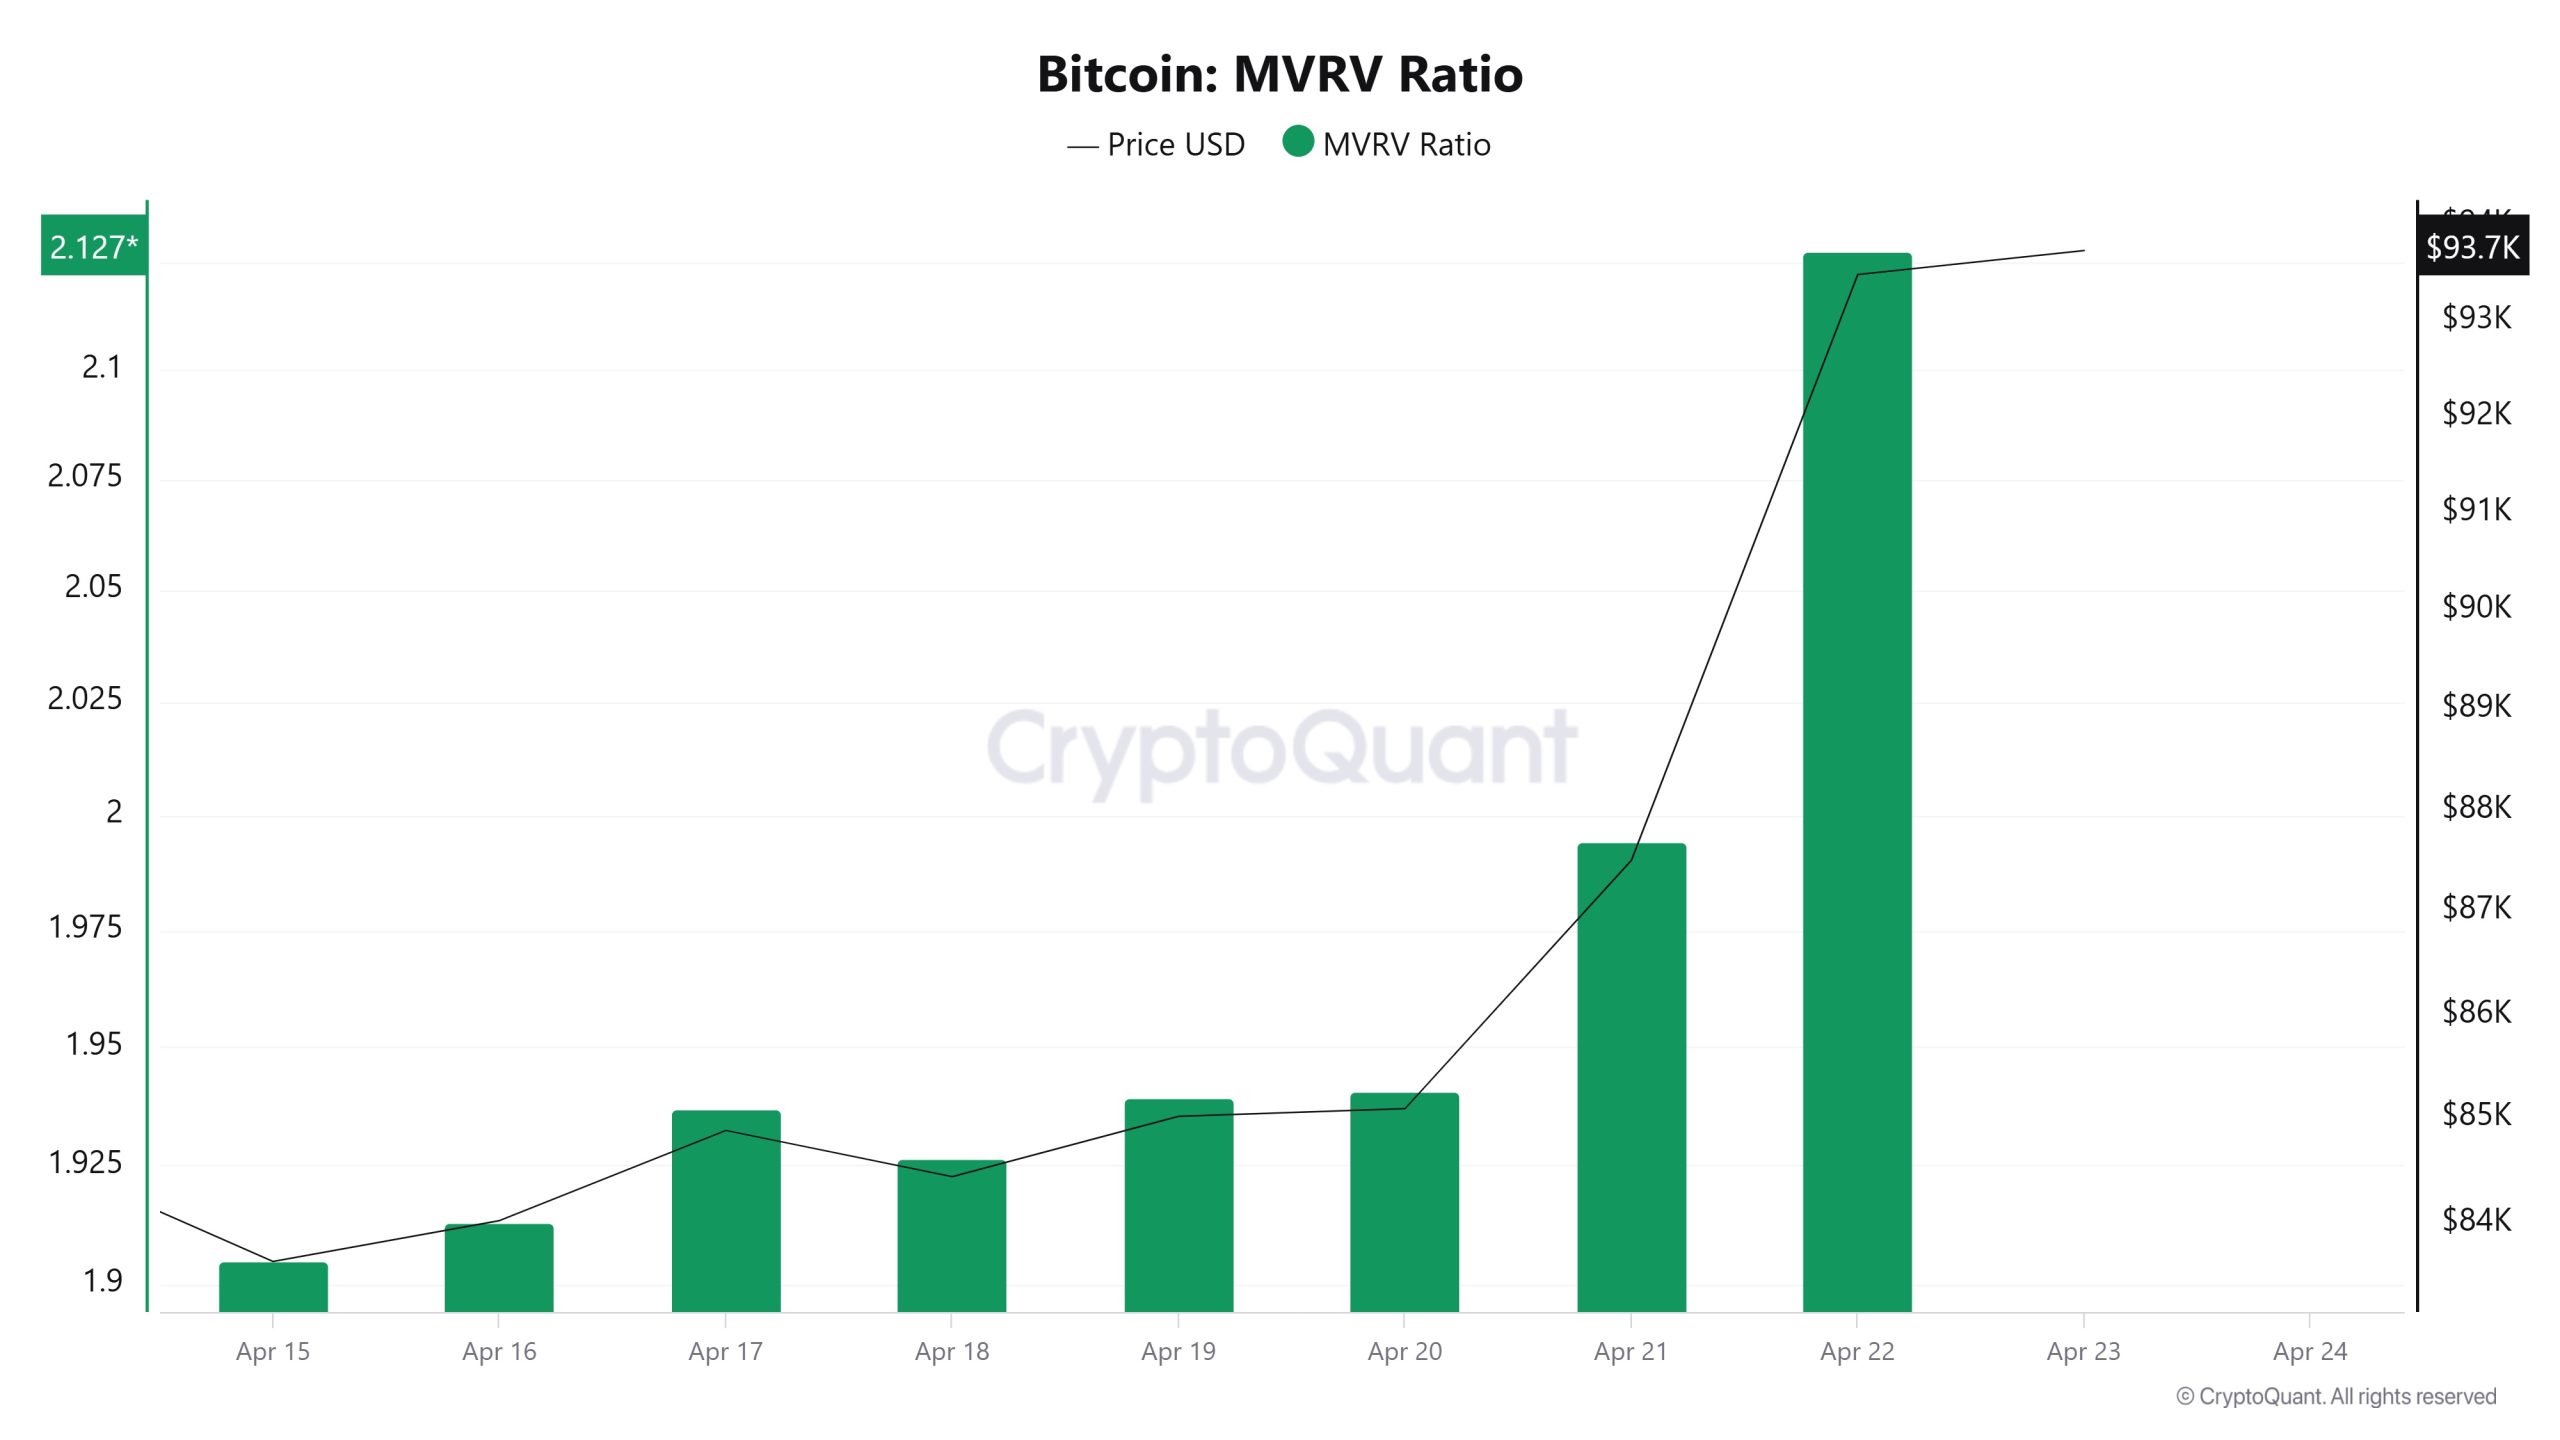
On April 16, the Bitcoin price was 84,025 while the MVRV Ratio was 1.91. As of April 22, the Bitcoin price was 93,480, while the MVRV Ratio was 2.12. Compared to last week, there was an 11.25% increase in Bitcoin price and a 10.99% increase in MVRV Ratio.
Realized Price
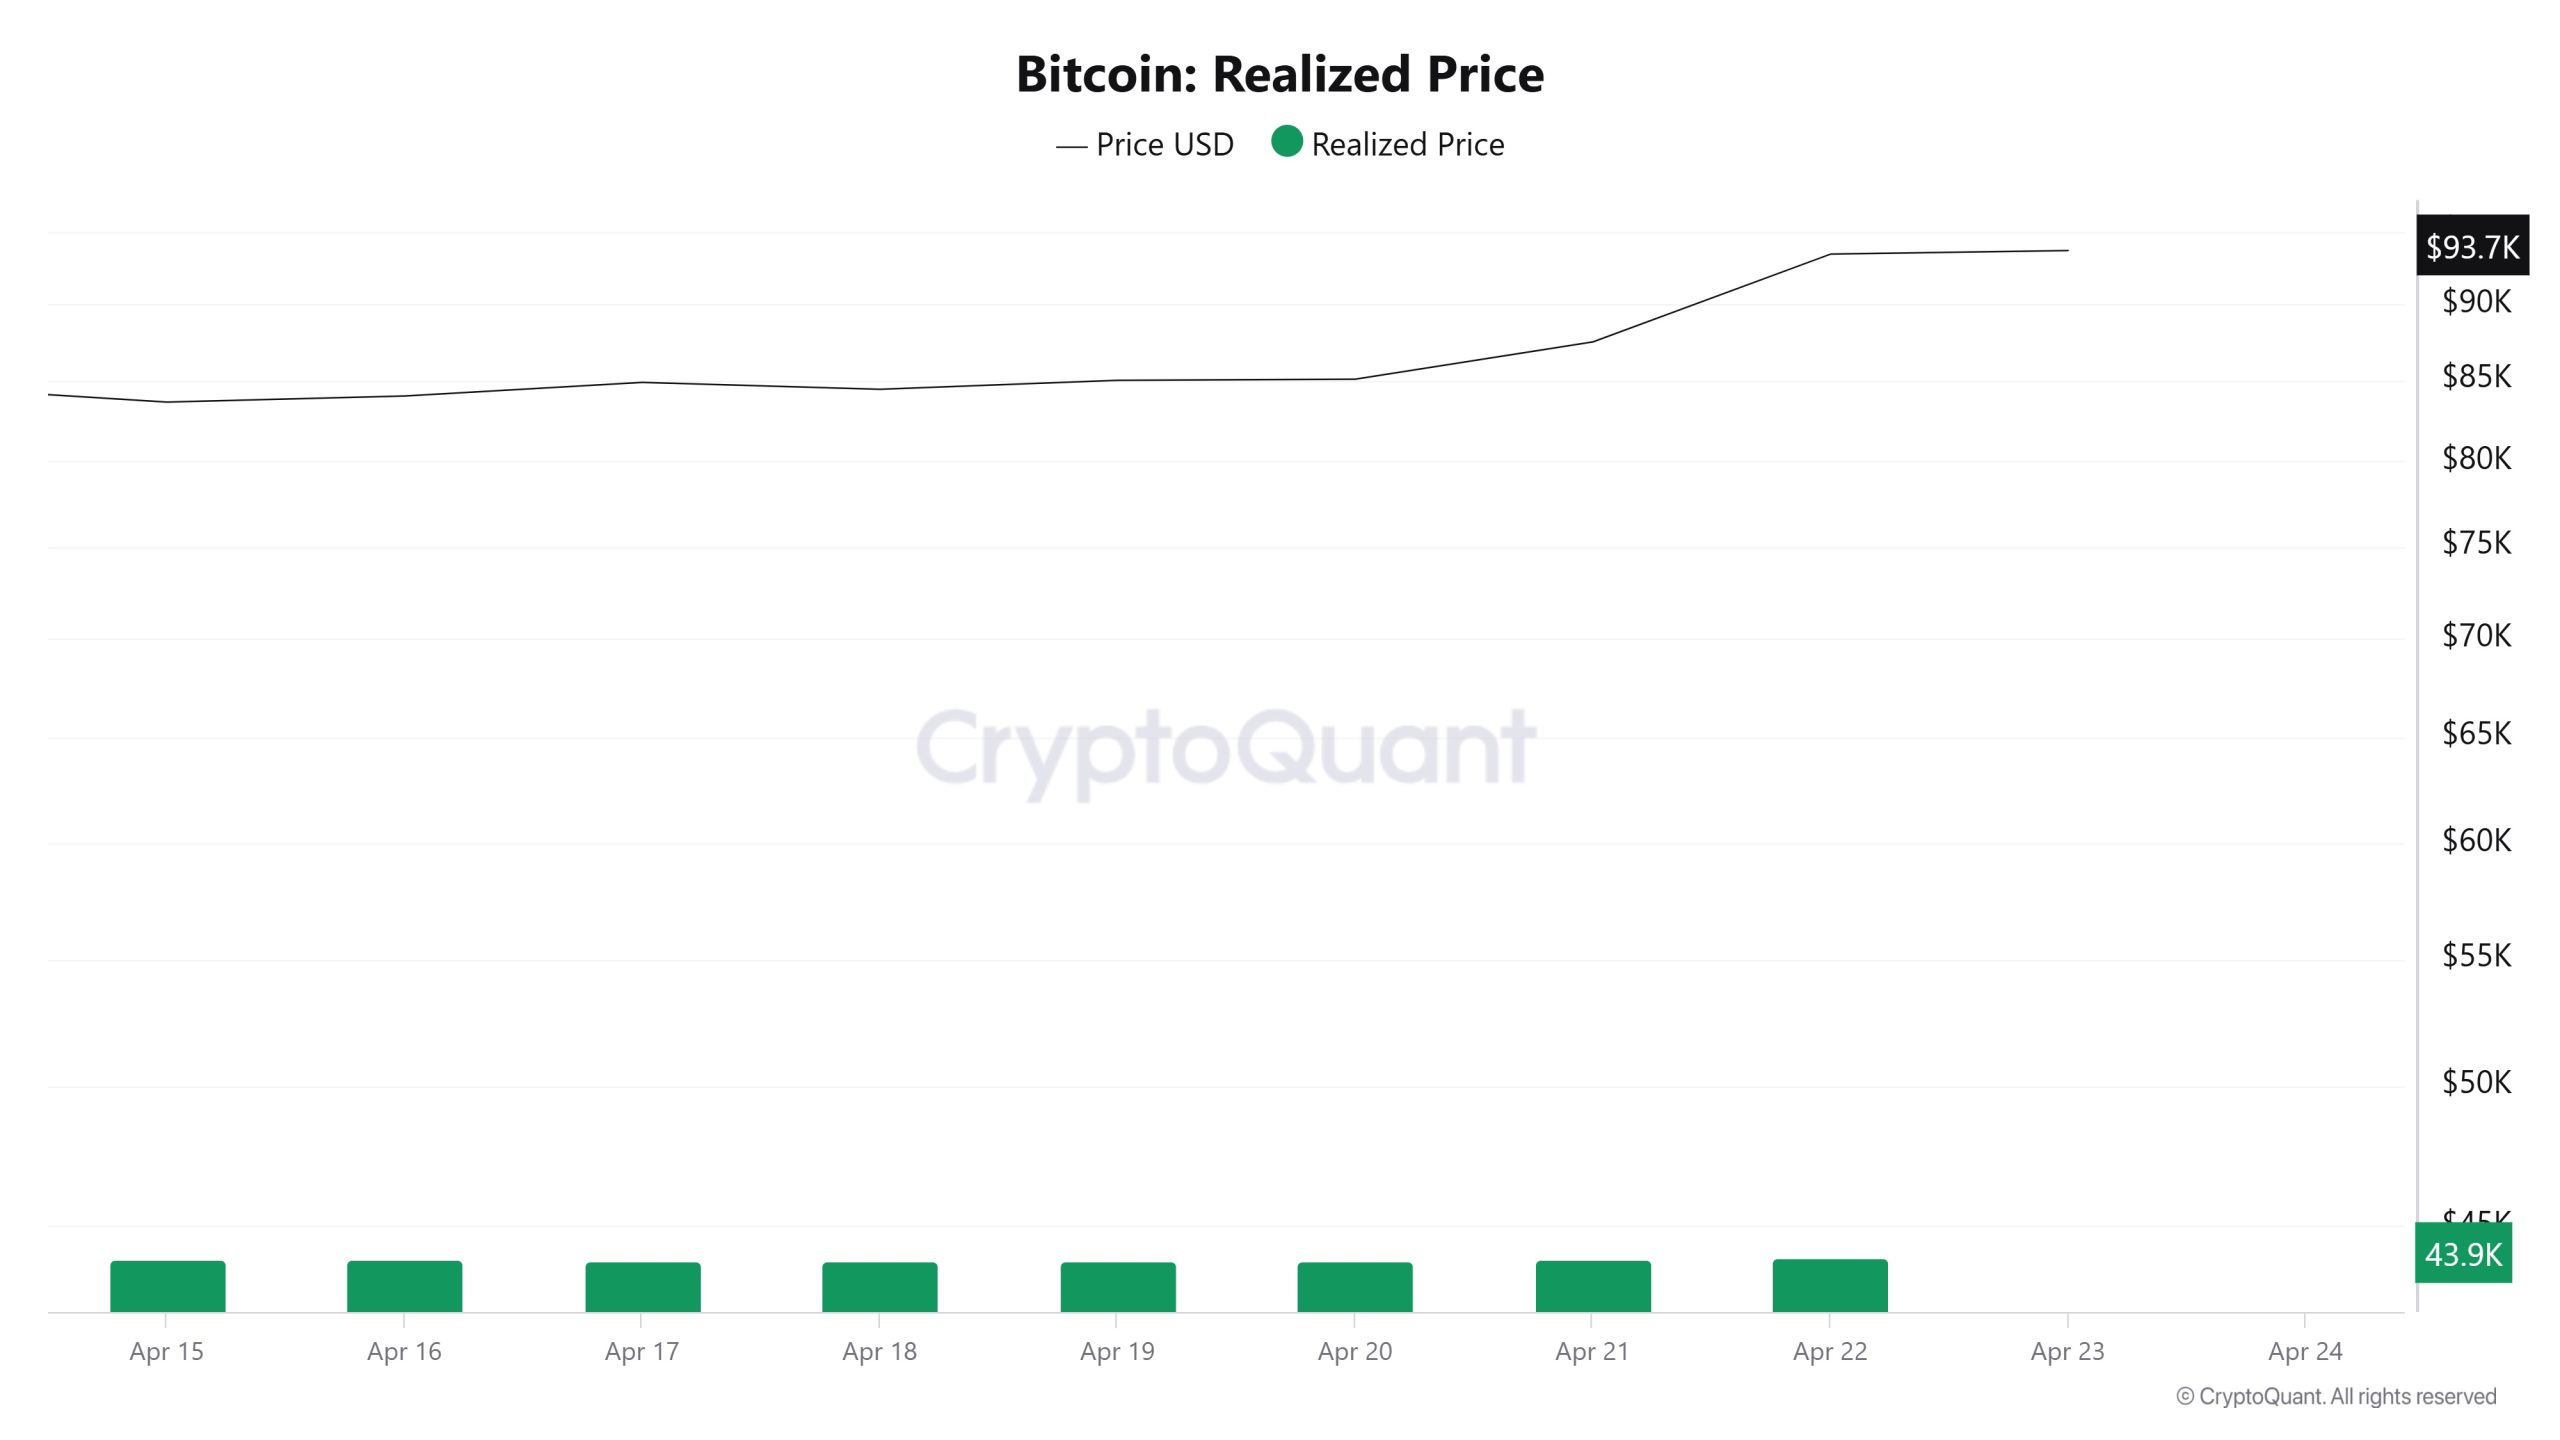
On April 16, Bitcoin price was 84,025 while Realized Price was 43,923. As of April 22, the Bitcoin price was 93,480 while the Realized Price was 43,934. Compared to last week, there was an 11.25% increase in Bitcoin price and a 0.025% increase in Realized Price.
Spent Output Profit Ratio (SOPR)
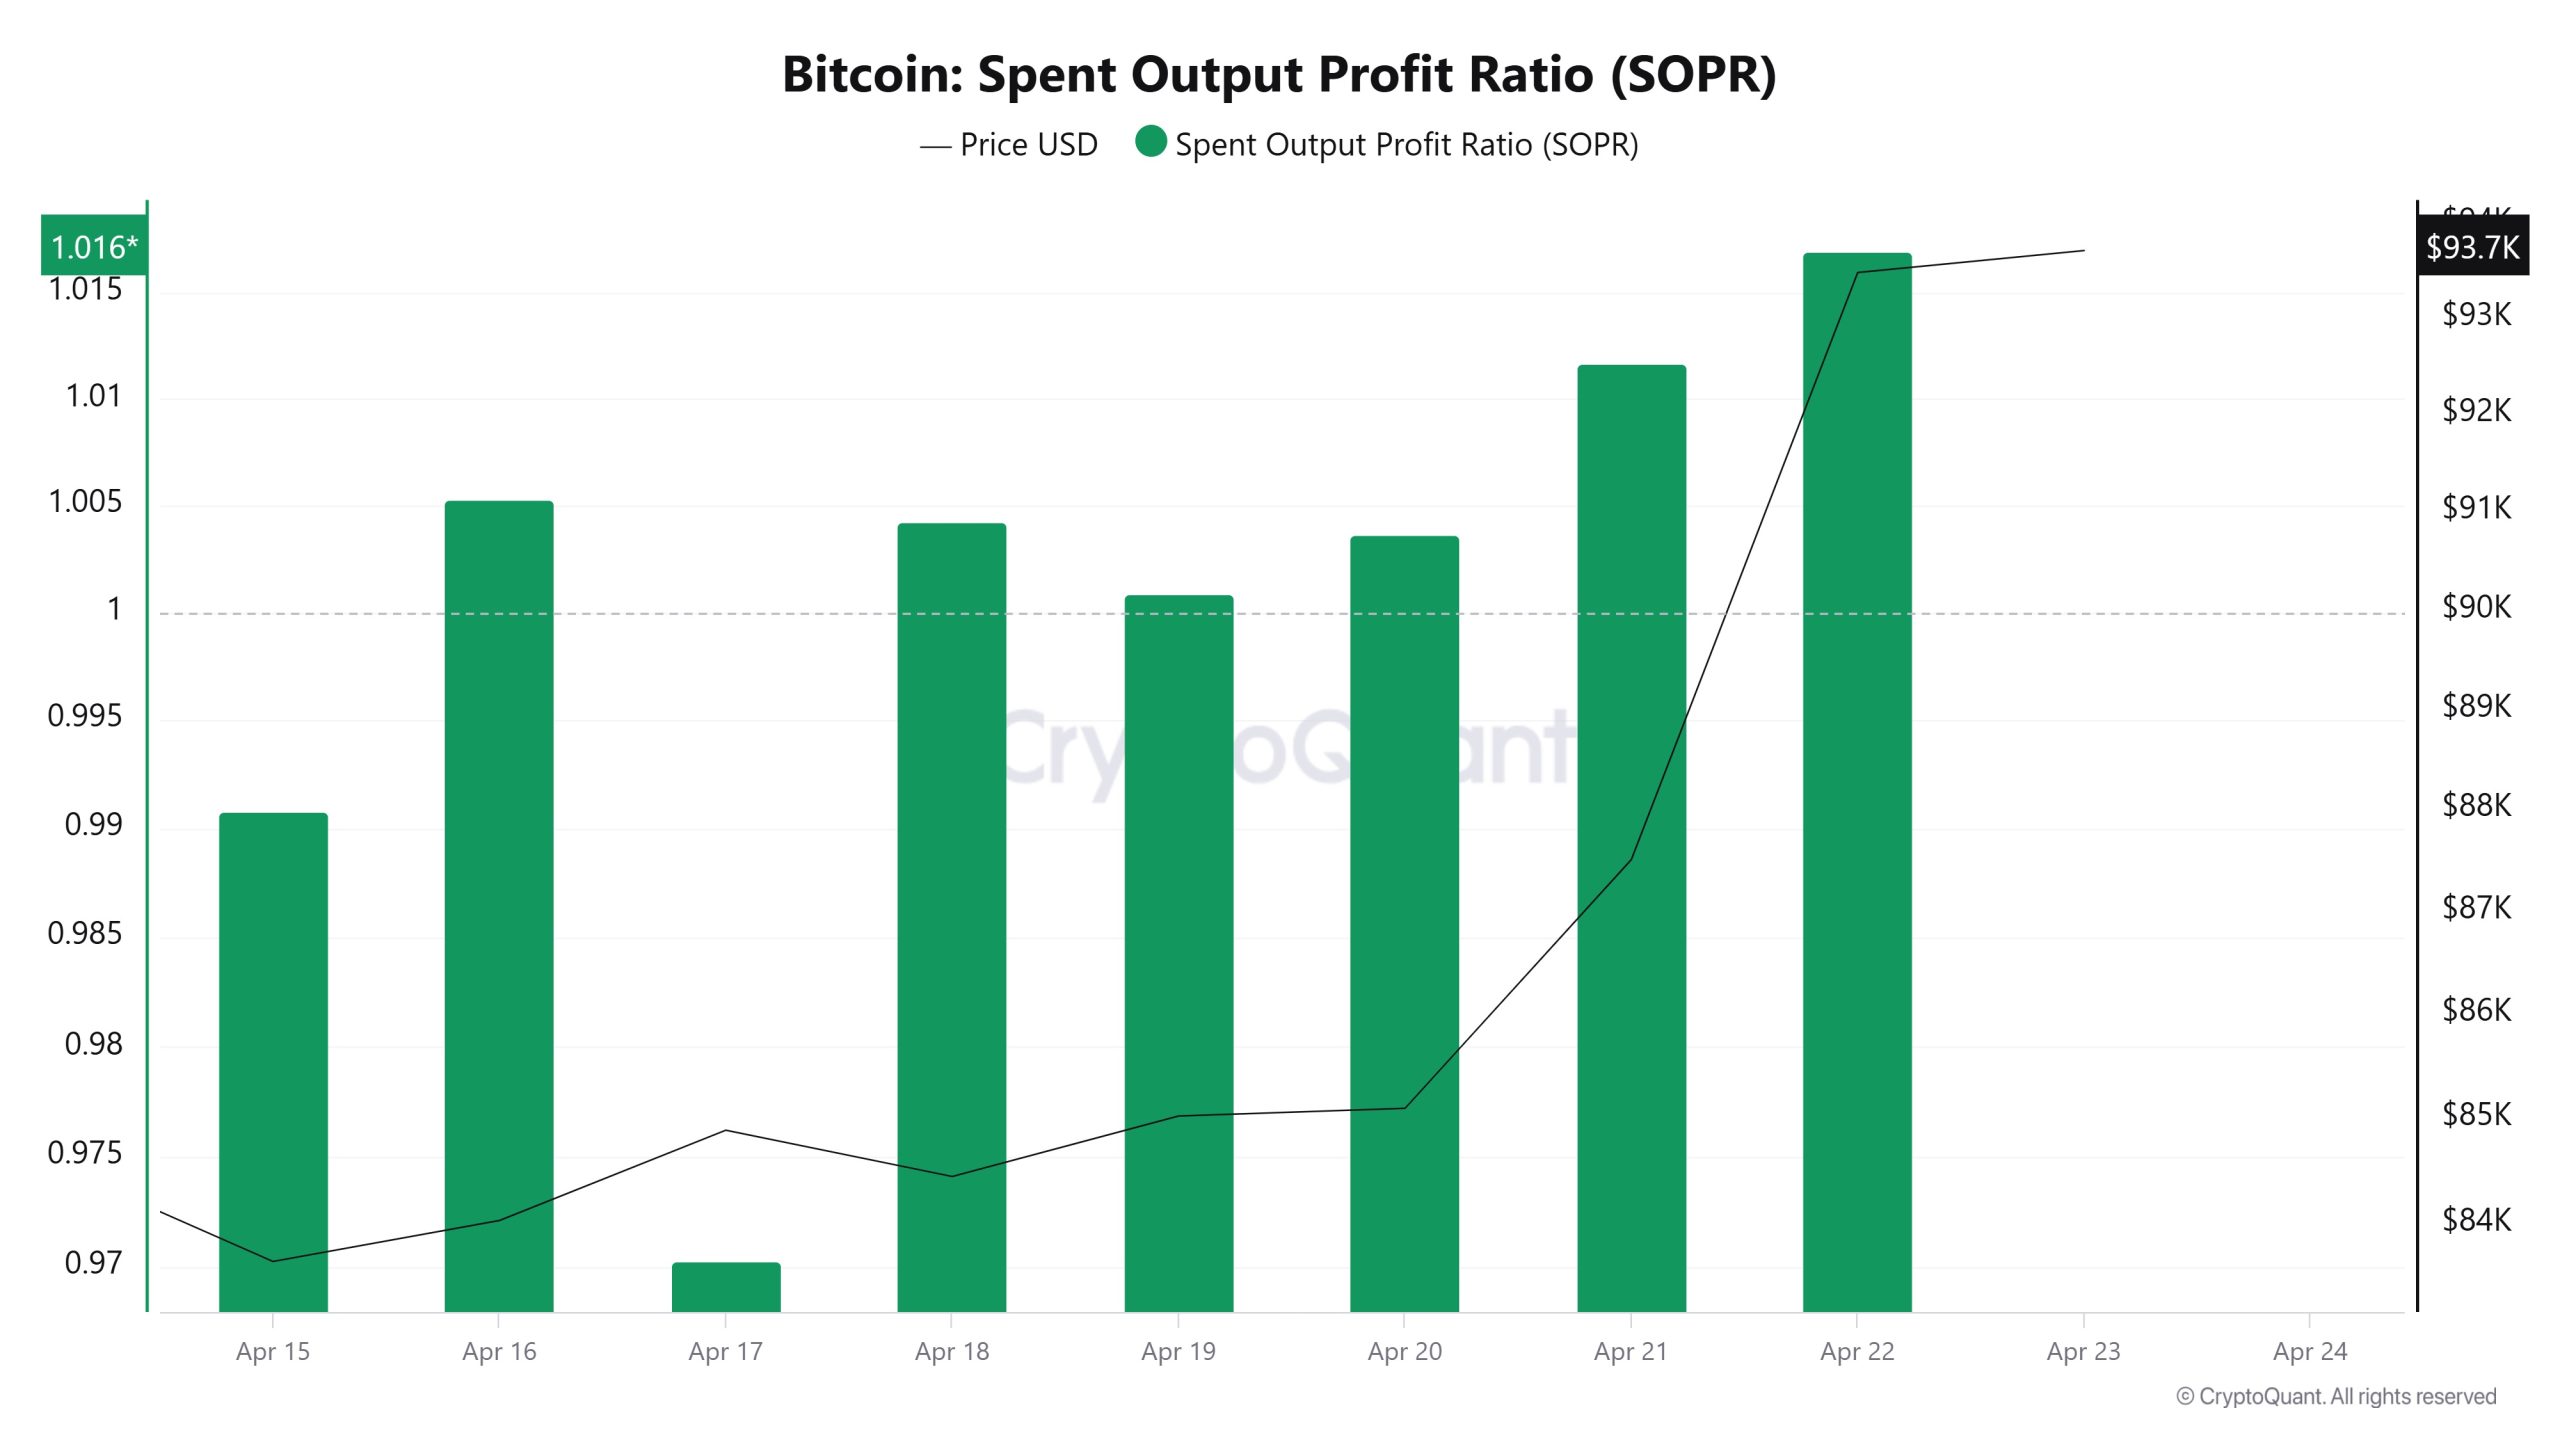
On April 16, the Bitcoin price was at 84,025 while the SOPR metric was at 1,005. As of April 22, the Bitcoin price rose to 93,480 while the SOPR metric rose to 1,016. Compared to last week, the Bitcoin price has risen by 11.25% while the SOPR metric has risen by 1.09%.
Derivatives
Open Interest
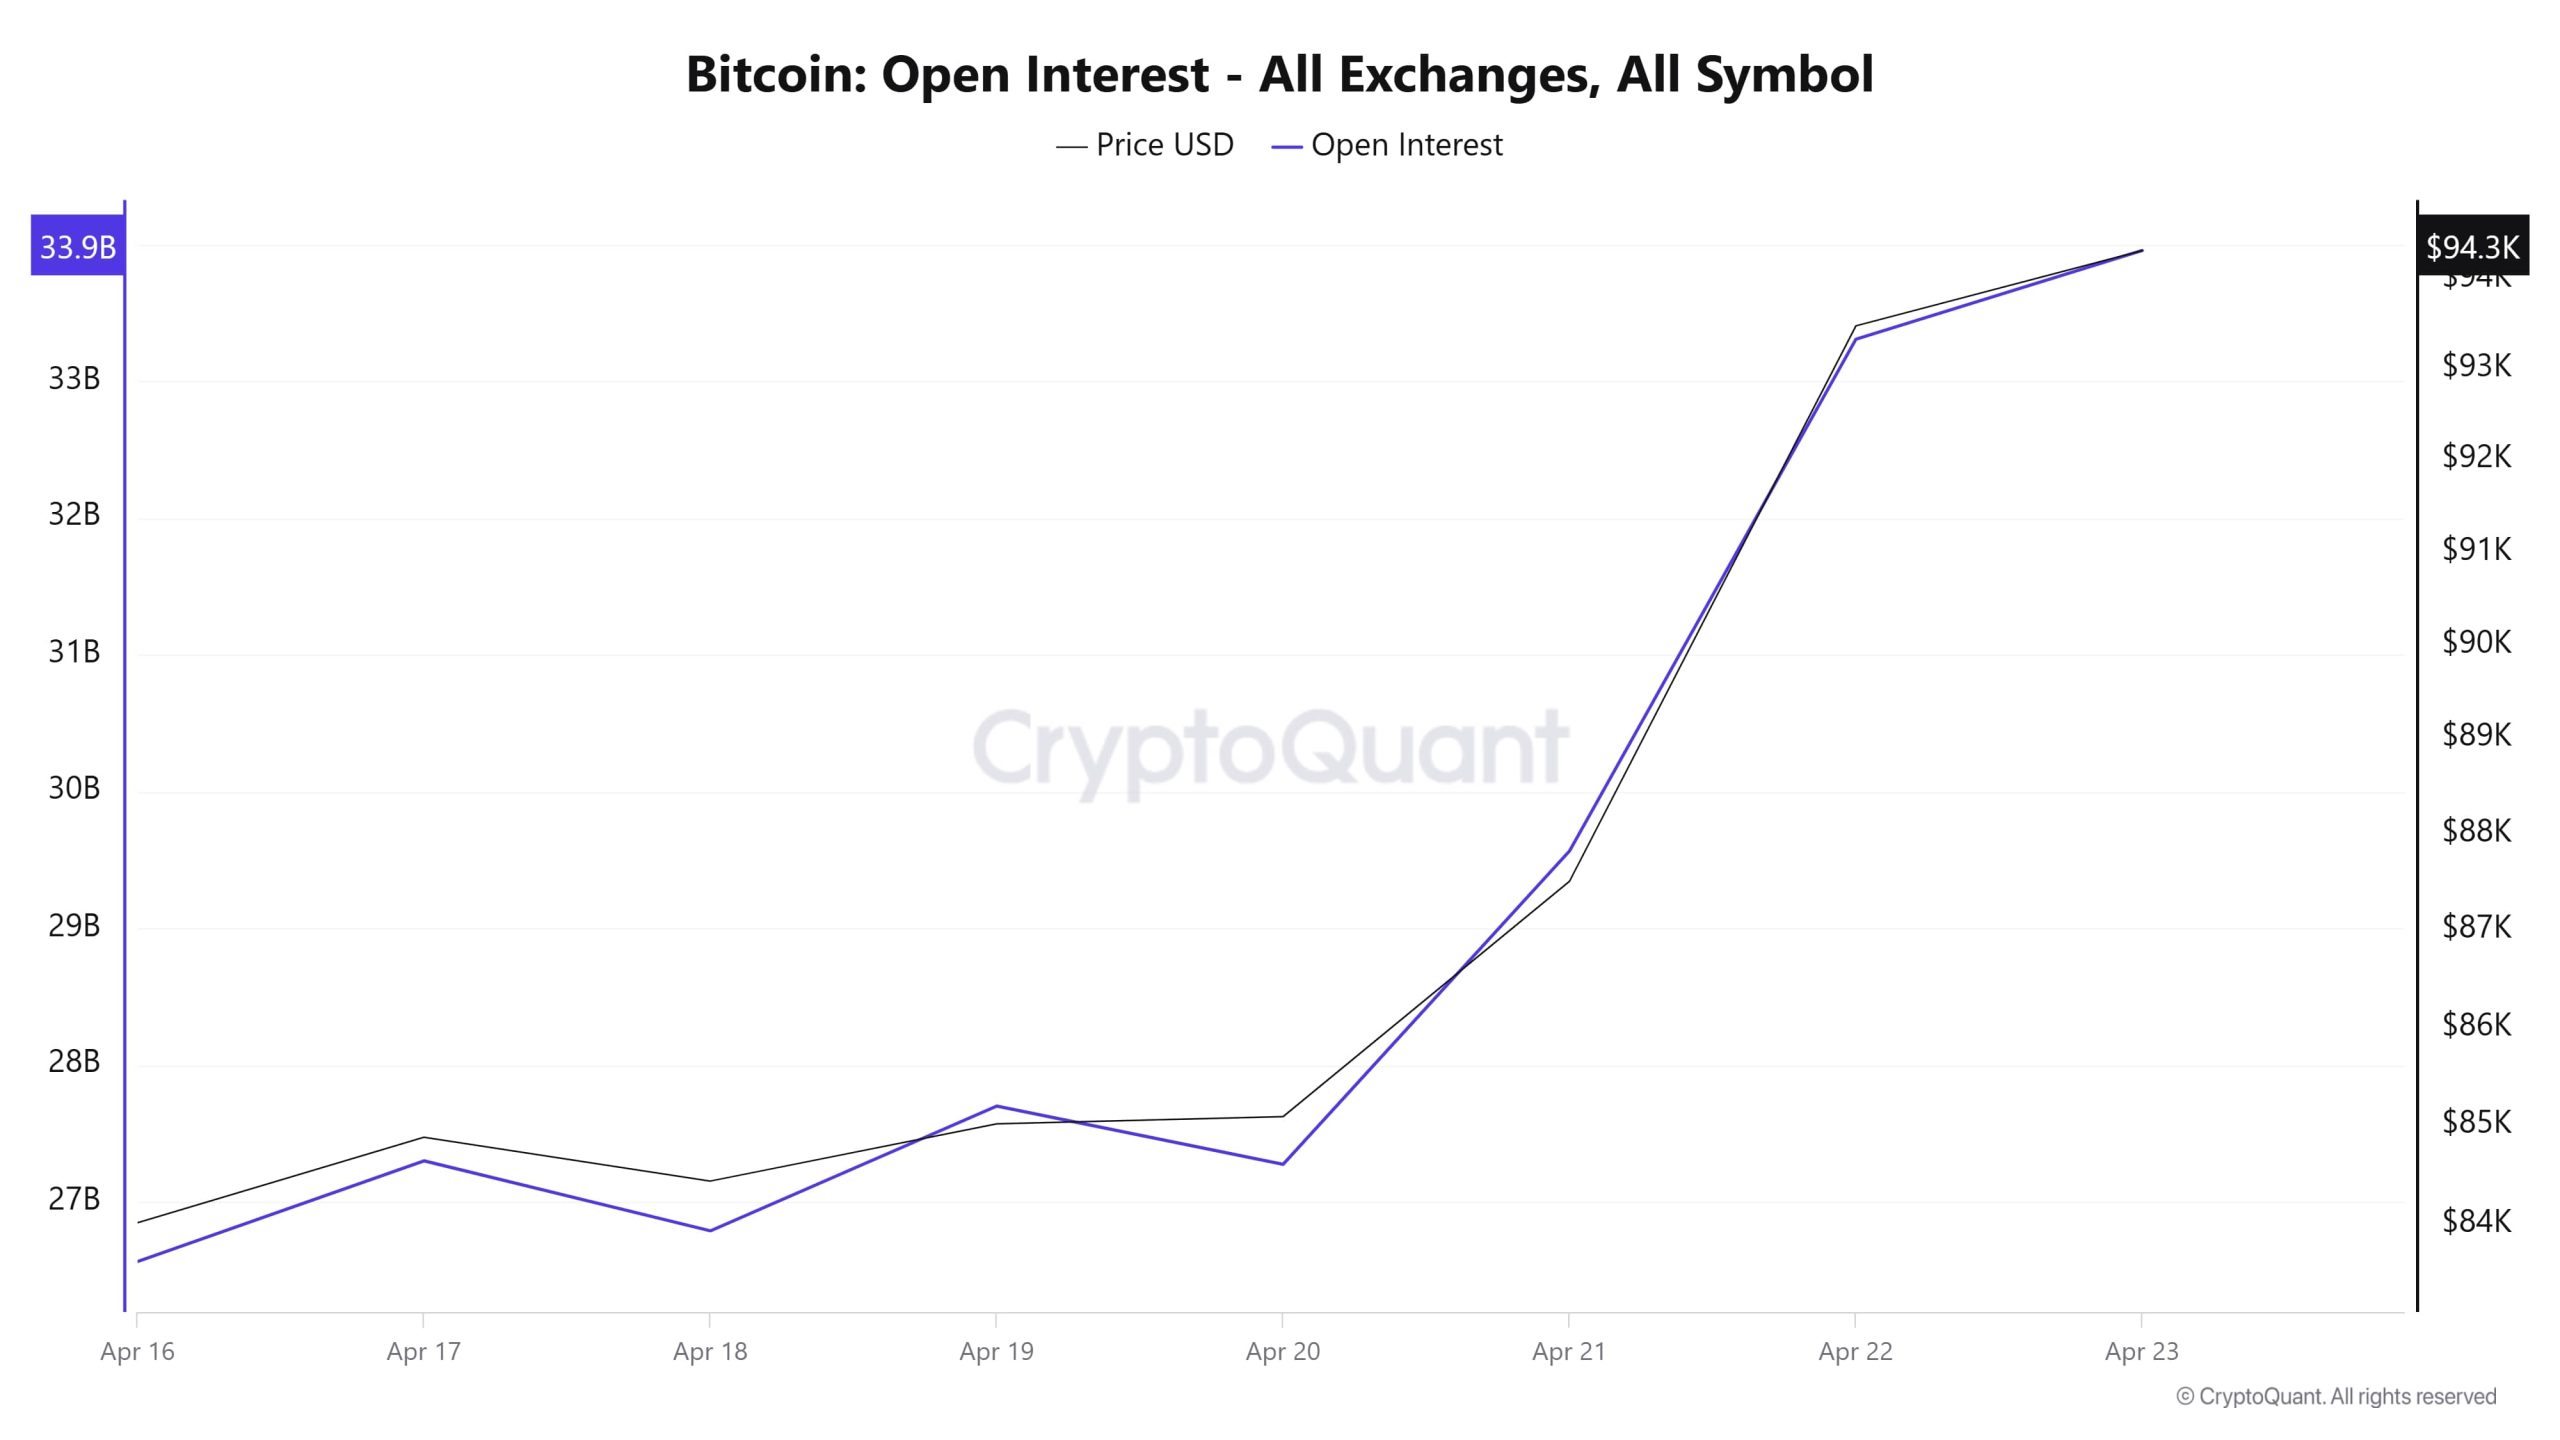
Between April 16 and April 23, there has been a remarkable increase in both the price and the amount of open positions. On April 16, open interest stood at around $26.8 billion, rising to $33.9 billion as of April 23, an increase of around 26 percent. This increase has been realized with a steep slope, especially after April 20, and it is seen that the upward movement is synchronized with both price and open interest. The fact that open interest also increased as the price rose suggests that new long positions were added to the market and that leveraged transactions were actively used in this process, strengthening investors’ bullish expectations and increasing risk appetite. However, such synchronized rallies may also indicate that the market has become overleveraged in the short term. This can be considered as a factor that increases the risk of volatility. In particular, the price reaching the $94,300 level and the open interest reaching record highs at the same time may bring the risk of a possible long squeeze in the market. In such scenarios, the likelihood of rapid and sharp corrections in prices increases. However, in the current situation, the correlation between price and open interest is constructive, as price increases seem to have been supported by direct position expansions rather than speculative ones. Overall, this picture suggests that the market is in a strong short-term bullish trend and that investors are highly participating in this trend.
Funding Rate
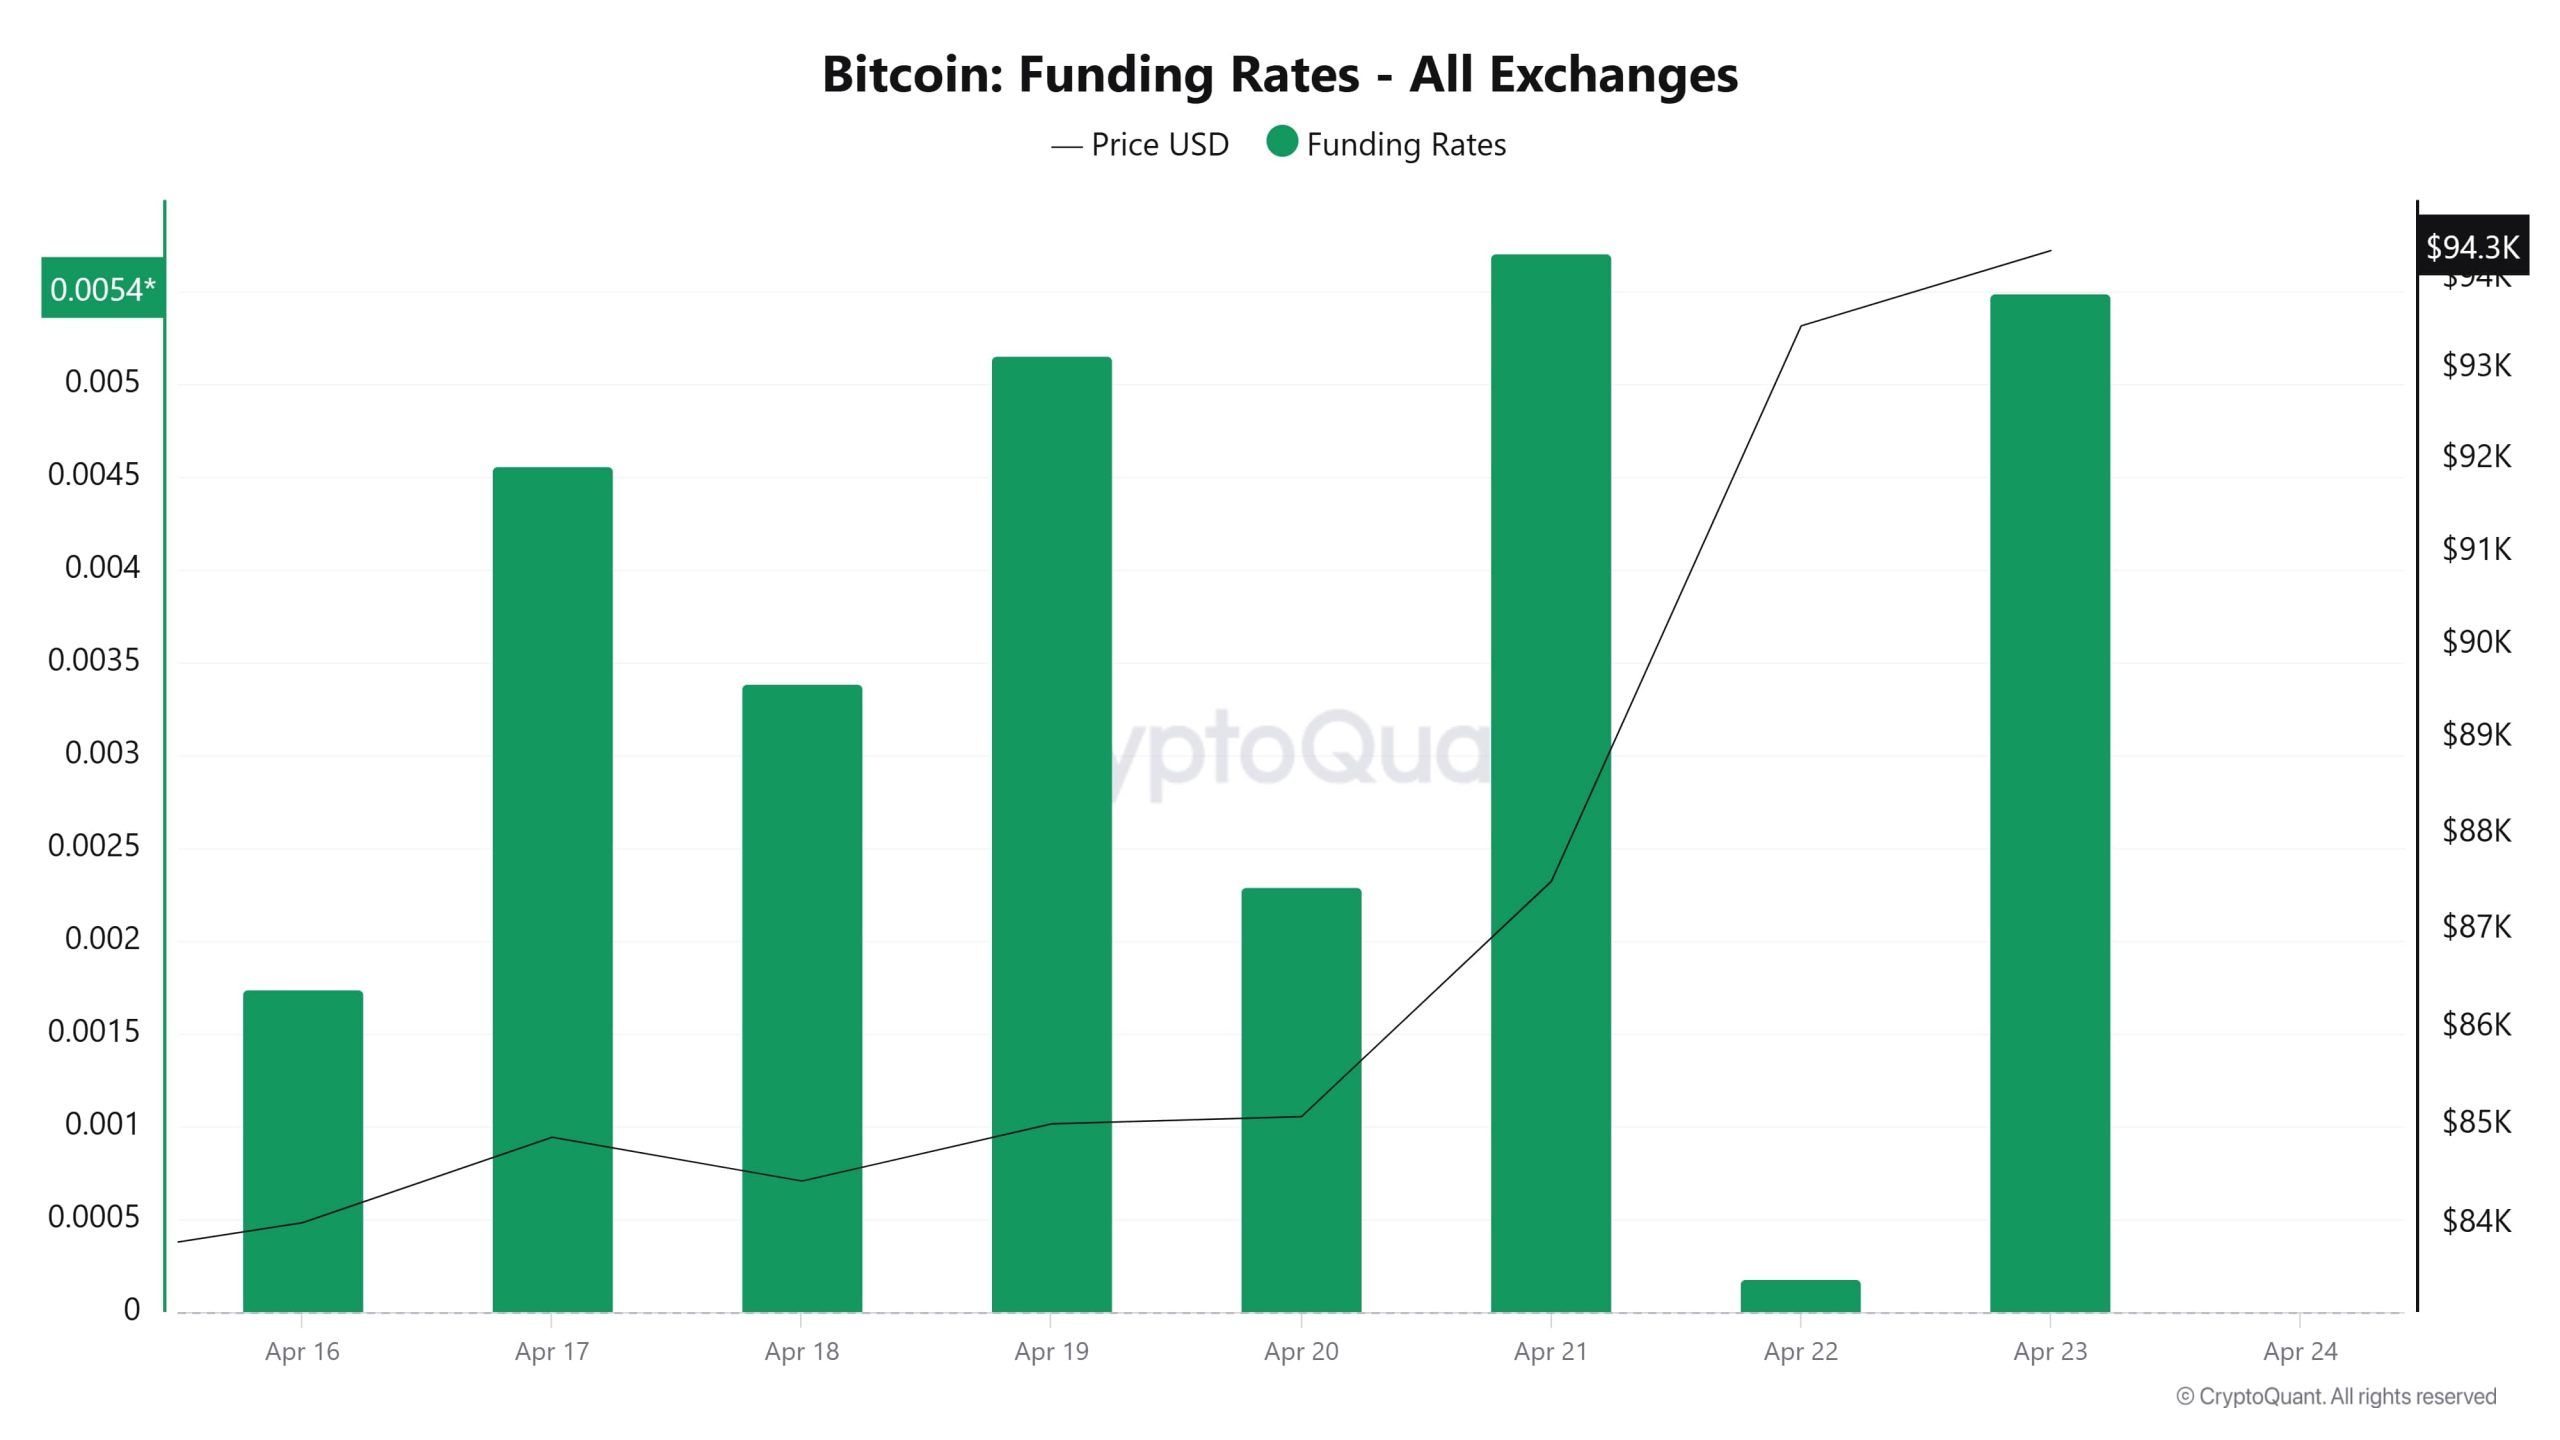
The fact that the funding rate values remained in the positive zone during the period analyzed reveals that the market is generally full of long positions. Starting at a very low level on April 16, the funding rate rose to 0.0045% on April 17, clearly reflecting the market’s buying expectations. Although there were short-term declines afterwards, especially as of April 20, the funding rate and BTC price exhibited an upward movement together. Between April 21 and 23, the funding rate rose as high as 0.0054%, clearly reflecting the increased demand for leveraged long positions in the market in recent days. This indicates that traders have increased their bullish expectations, and the majority of positions were opened long. Positive funding rates at this level mean that long position holders are paying short position holders, so the dominant view in the market is that prices will rise further. However, such high funding ratios also indicate that the market is filled with excessive long positions and that a possible reversal, i.e. a sudden price decline, could create a long squeeze. This is a warning to be careful in the short term. In general, the fact that both price and funding rate have risen together indicates that the uptrend is supported by trader confidence; however, it is important to keep in mind that this structure also increases the risk of vulnerability in the market.
Long & Short Liquidations
This week, when BTC rose from $83,000 to $94,200, $160 million worth of long trades were liquidated while $405 million worth of short trades were liquidated.
| Date | Long Amount (Million $) | Short Amount (Million $) |
|---|---|---|
| April 16 | 55.33 | 33.42 |
| April 17 | 13.95 | 39.38 |
| April 18 | 31.82 | 2.94 |
| April 19 | 3.17 | 13.95 |
| April 20 | 13.22 | 10.59 |
| April 21 | 25.94 | 117.87 |
| April 22 | 16.71 | 187.84 |
| Total | 160.14 | 405.99 |
| < 1 BTC |
Supply Distribution
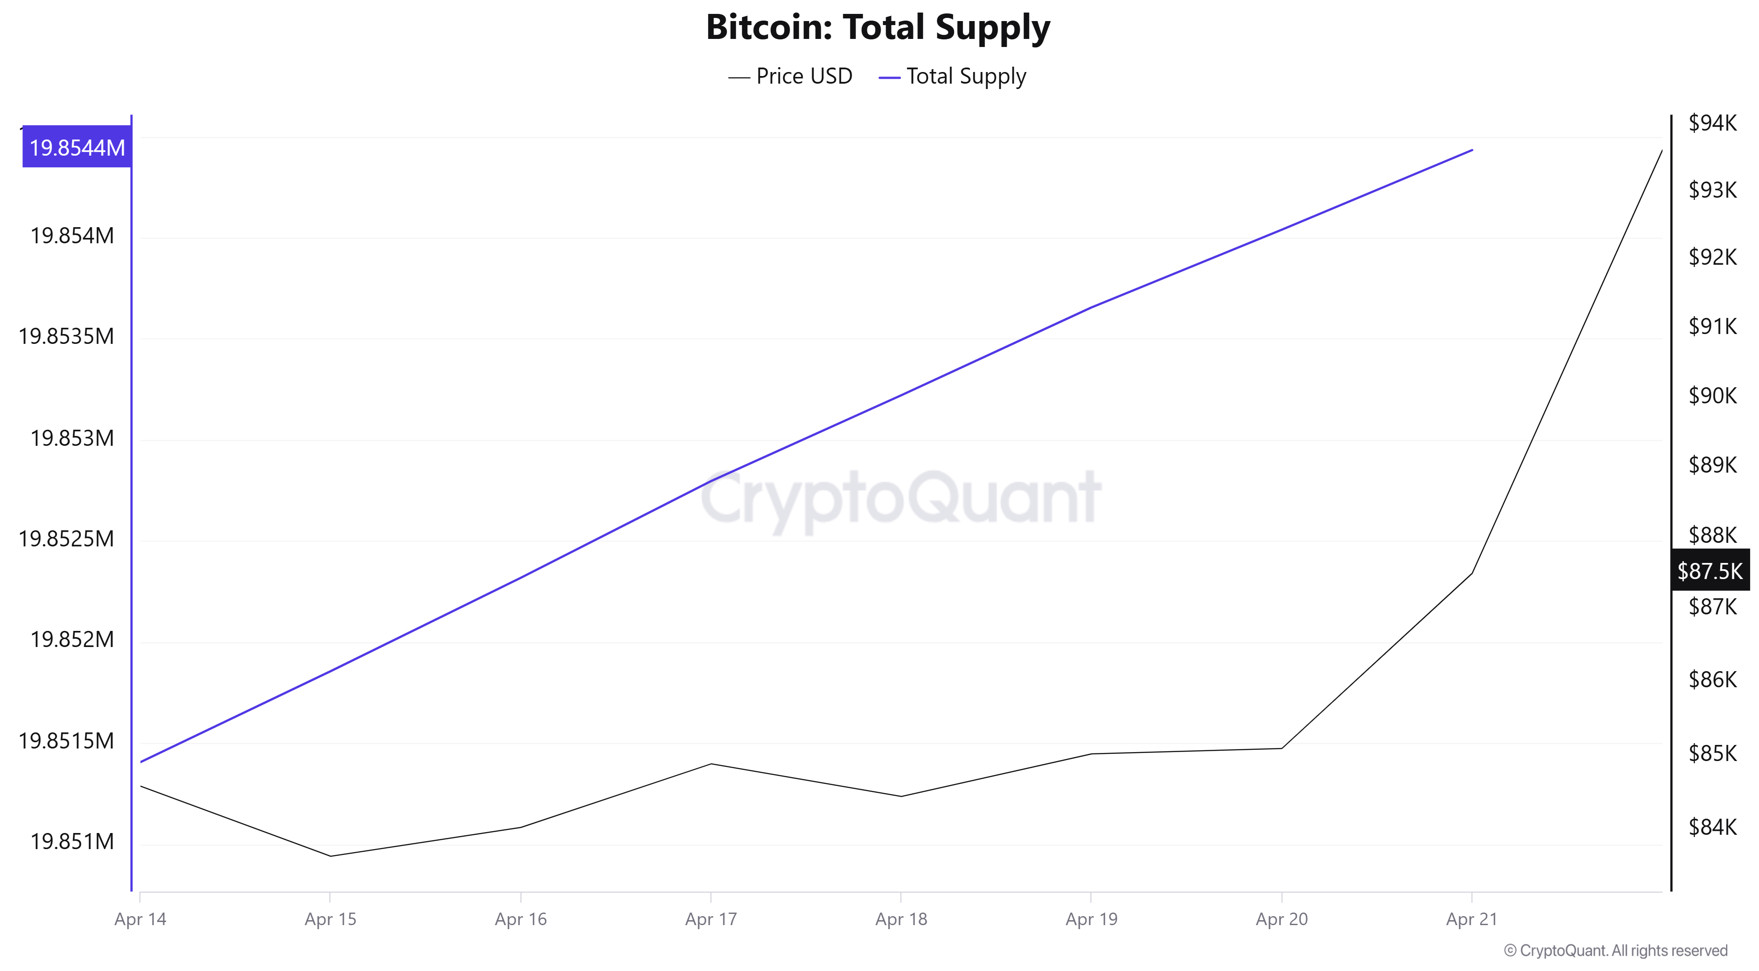
Total Supply: It reached 19,854,433 units, up about 0.0130% from last week.
New Supply: The amount of BTC produced this week was 2,578.
Velocity: Velocity, which was 13.12 last week, was 13.03 as of April 21.
| Wallet Category | 14.04.2025 | 21.04.2025 | Change (%) | 8.5397% | 8.5442% | 0.0527% |
|---|---|---|---|---|---|---|
| 1 – 10 BTC | 11.7057% | 11.7060% | 0.0026% | |||
| 10 – 100 BTC | 24.8273% | 24.7852% | -0.1695% | |||
| 100 – 1k BTC | 28.1208% | 28.2169% | 0.3417% | |||
| 1k – 10k BTC | 18.3995% | 18.2797% | -0.6520% | |||
| 10k+ BTC | 8.4065% | 8.4675% | 0.7251% |
Looking at the wallet distribution of the current supply, a limited increase of 0.0527% was observed in the < 1 BTC category, while 1 – 10 BTC holders experienced a very limited increase of 0.0026%. In the 10 – 100 BTC range, there was a slight decrease of 0.1695%, while the 100 – 1K BTC segment showed a significant increase of 0.3417%. 1K – 10K BTC holders experienced a significant decline of 0.6520%, while the most notable change was in the 10K+ BTC category, with a strong increase of 0.7251% in this segment
Exchange Reserve
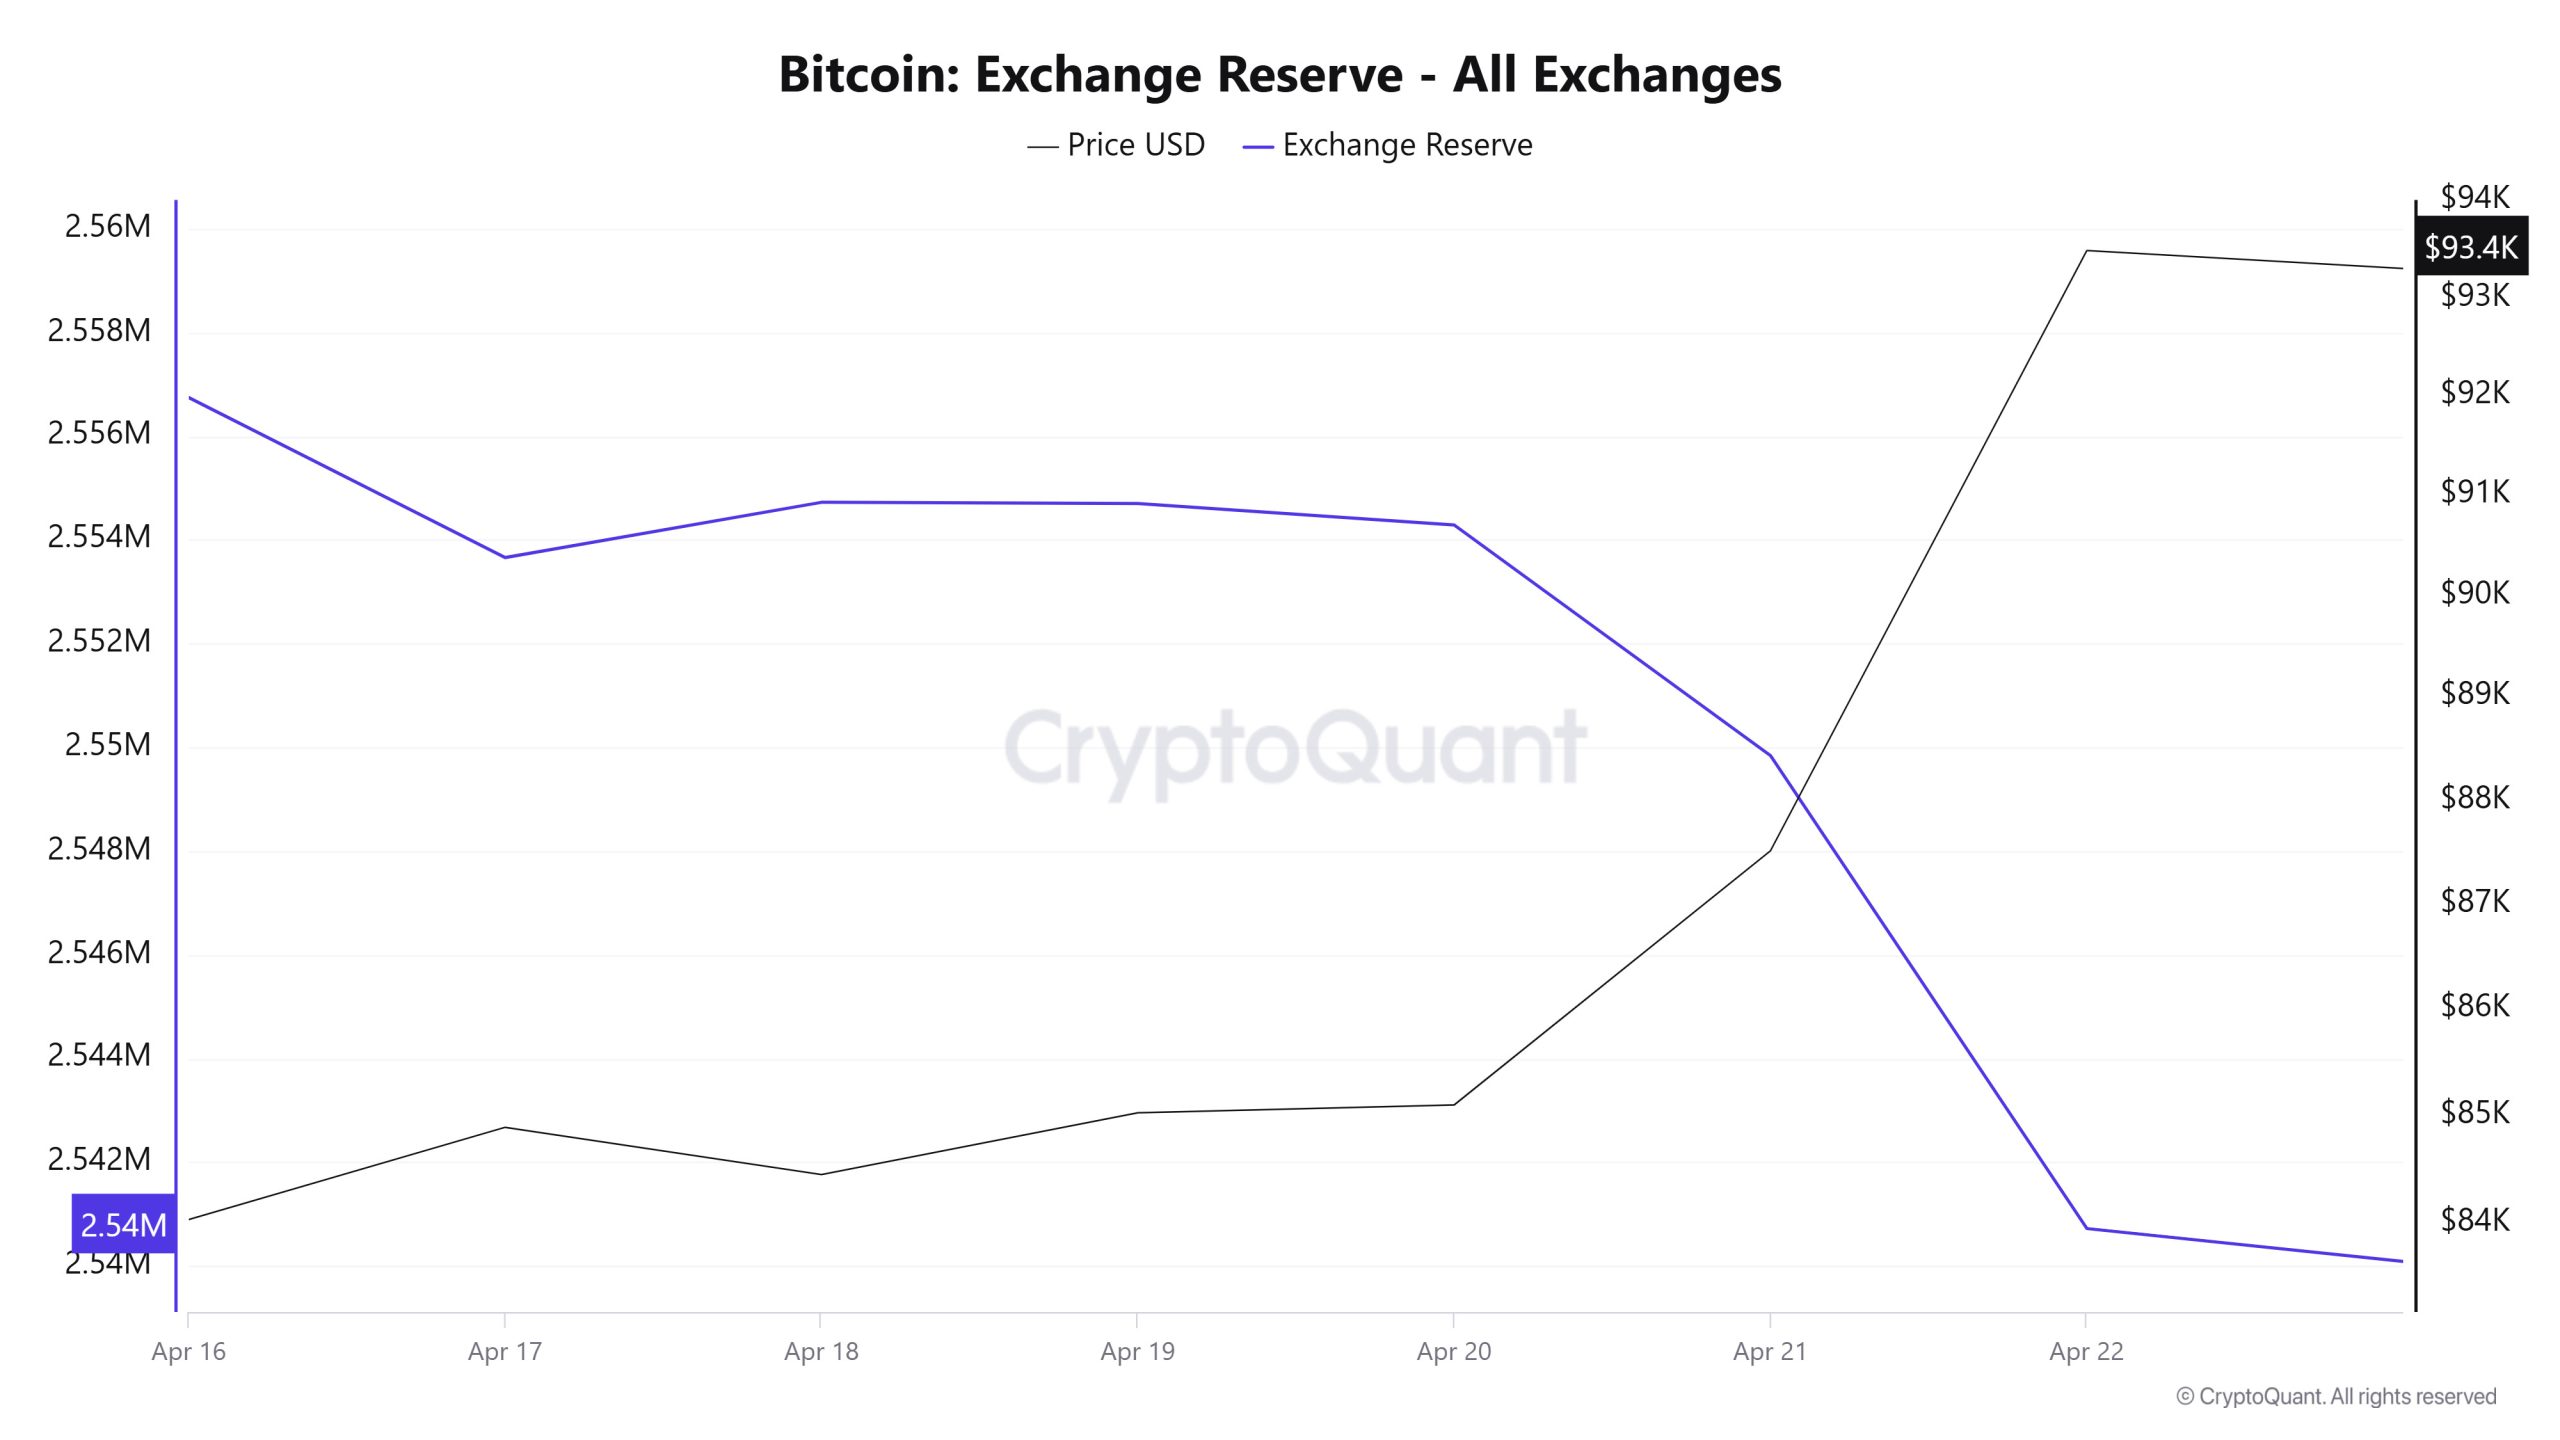
Between April 16-22, 2025, Bitcoin reserves on exchanges decreased from 2,556,744 BTC to 2,540,721 BTC. During this period, there was a total net outflow of 16,023 BTC and the Bitcoin reserves of exchanges decreased by 0.63%. The Bitcoin price increased by approximately 11.2% during the same period. Bitcoin, which closed at $84,025 on April 16, 2025, closed at $93,480 on April 22, 2025. When the decline in reserves and the price increase are evaluated together, it is seen that market participants have regained confidence and selling pressure has decreased. While this supports positive pricing in the short term, it may create more upside potential in the long term by keeping supply off-exchange. (Bullish)
| Date | 16-Apr | 17-Apr | 18-Apr | 19-Apr | 20-Apr | 21-Apr | 22-Apr |
|---|---|---|---|---|---|---|---|
| Exchange Inflow | 33,865 | 30,089 | 17,743 | 12,993 | 11,155 | 35,049 | 51,224 |
| Exchange Outflow | 36,700 | 33,174 | 16,677 | 13,017 | 11,569 | 39,497 | 60,342 |
| Exchange Netflow | -2,835 | -3,085 | 1,066 | -23 | -413 | -4,448 | -9,118 |
| Exchange Reserve | 2,556,744 | 2,553,658 | 2,554,724 | 2,554,701 | 2,554,288 | 2,549,840 | 2,540,721 |
| BTC Price ($) | 84,025 | 84,883 | 84,443 | 85,019 | 85,092 | 87,506 | 93,480 |
Fees and Revenues
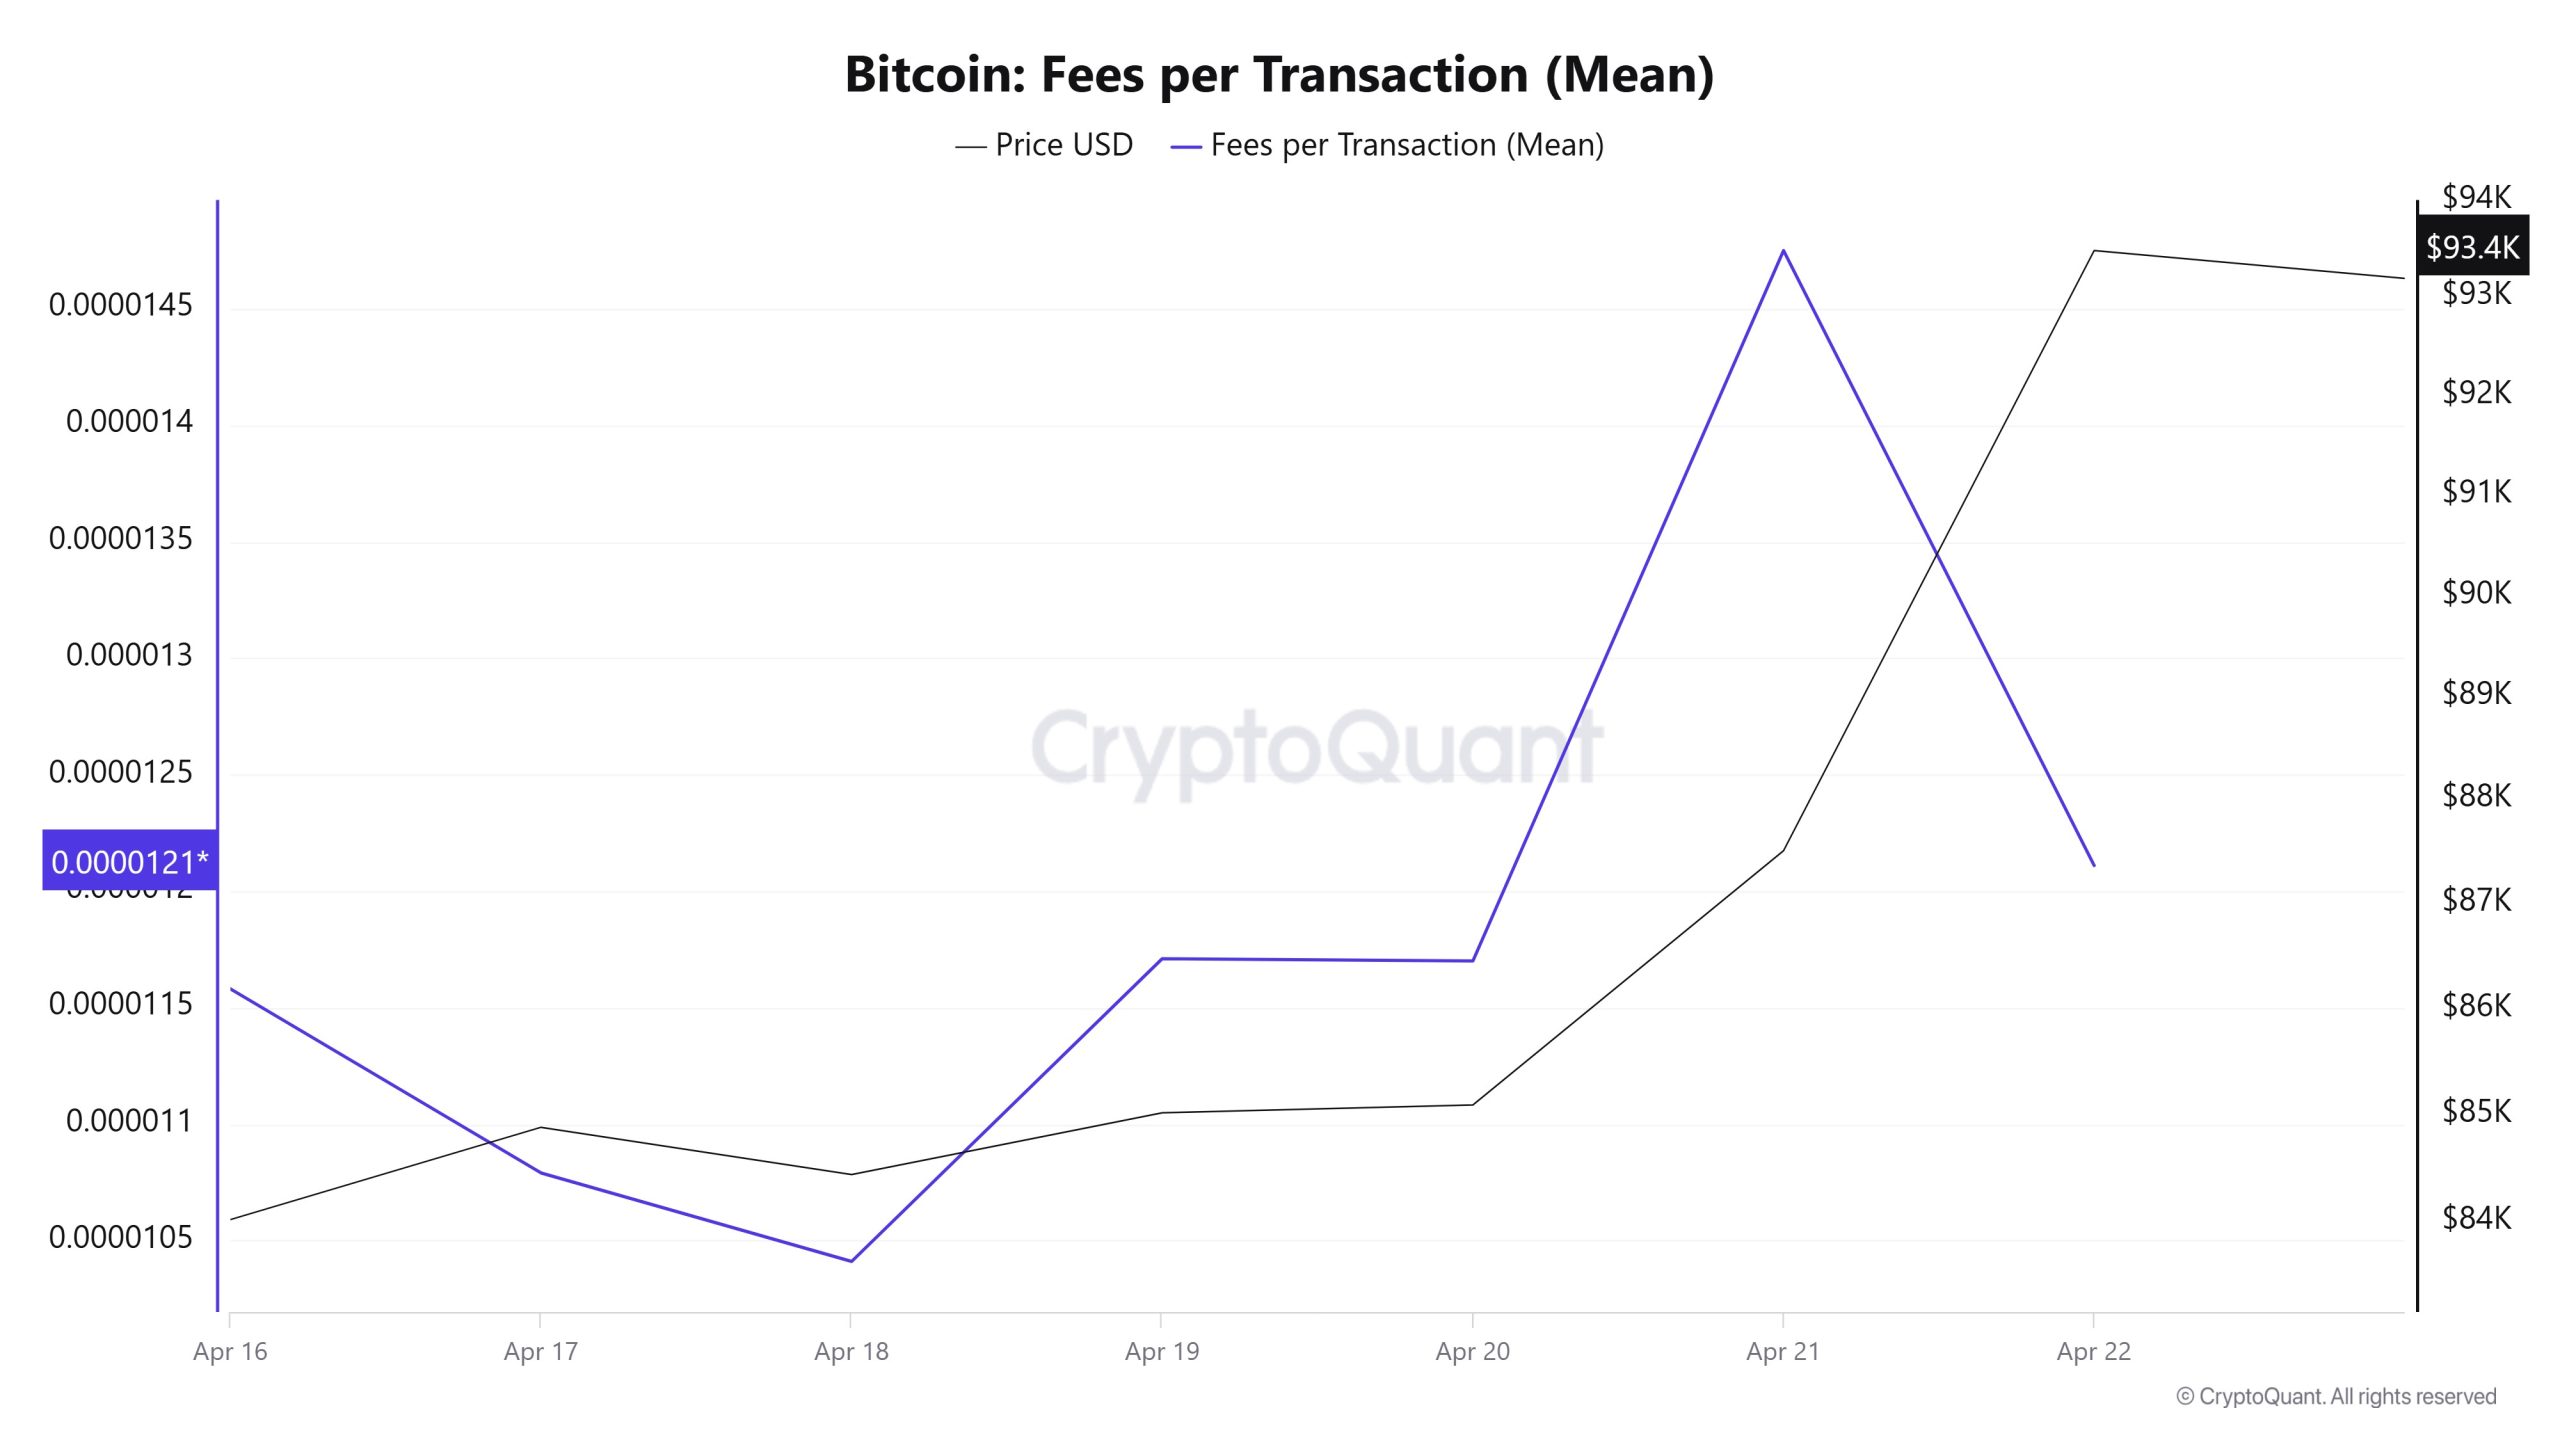
Analysing the Bitcoin Fees per Transaction (Mean) data between April 16 and April 22, it was observed that this value was at 0.00001158 on April 16, the first day of the weekly period. The value, which followed a decreasing trend until April 18, decreased to 0.00001041 on this date and recorded its lowest value on a weekly basis.
After April 18, the value, which entered an upward trend with the movements observed in the Bitcoin price, rose to 0.00001475 on April 21, forming a weekly high.
On April 22, the last day of the weekly period, Bitcoin Fees per Transaction (Mean) declined slightly to close at 0.00001211.
Bitcoin: Fees (Total)
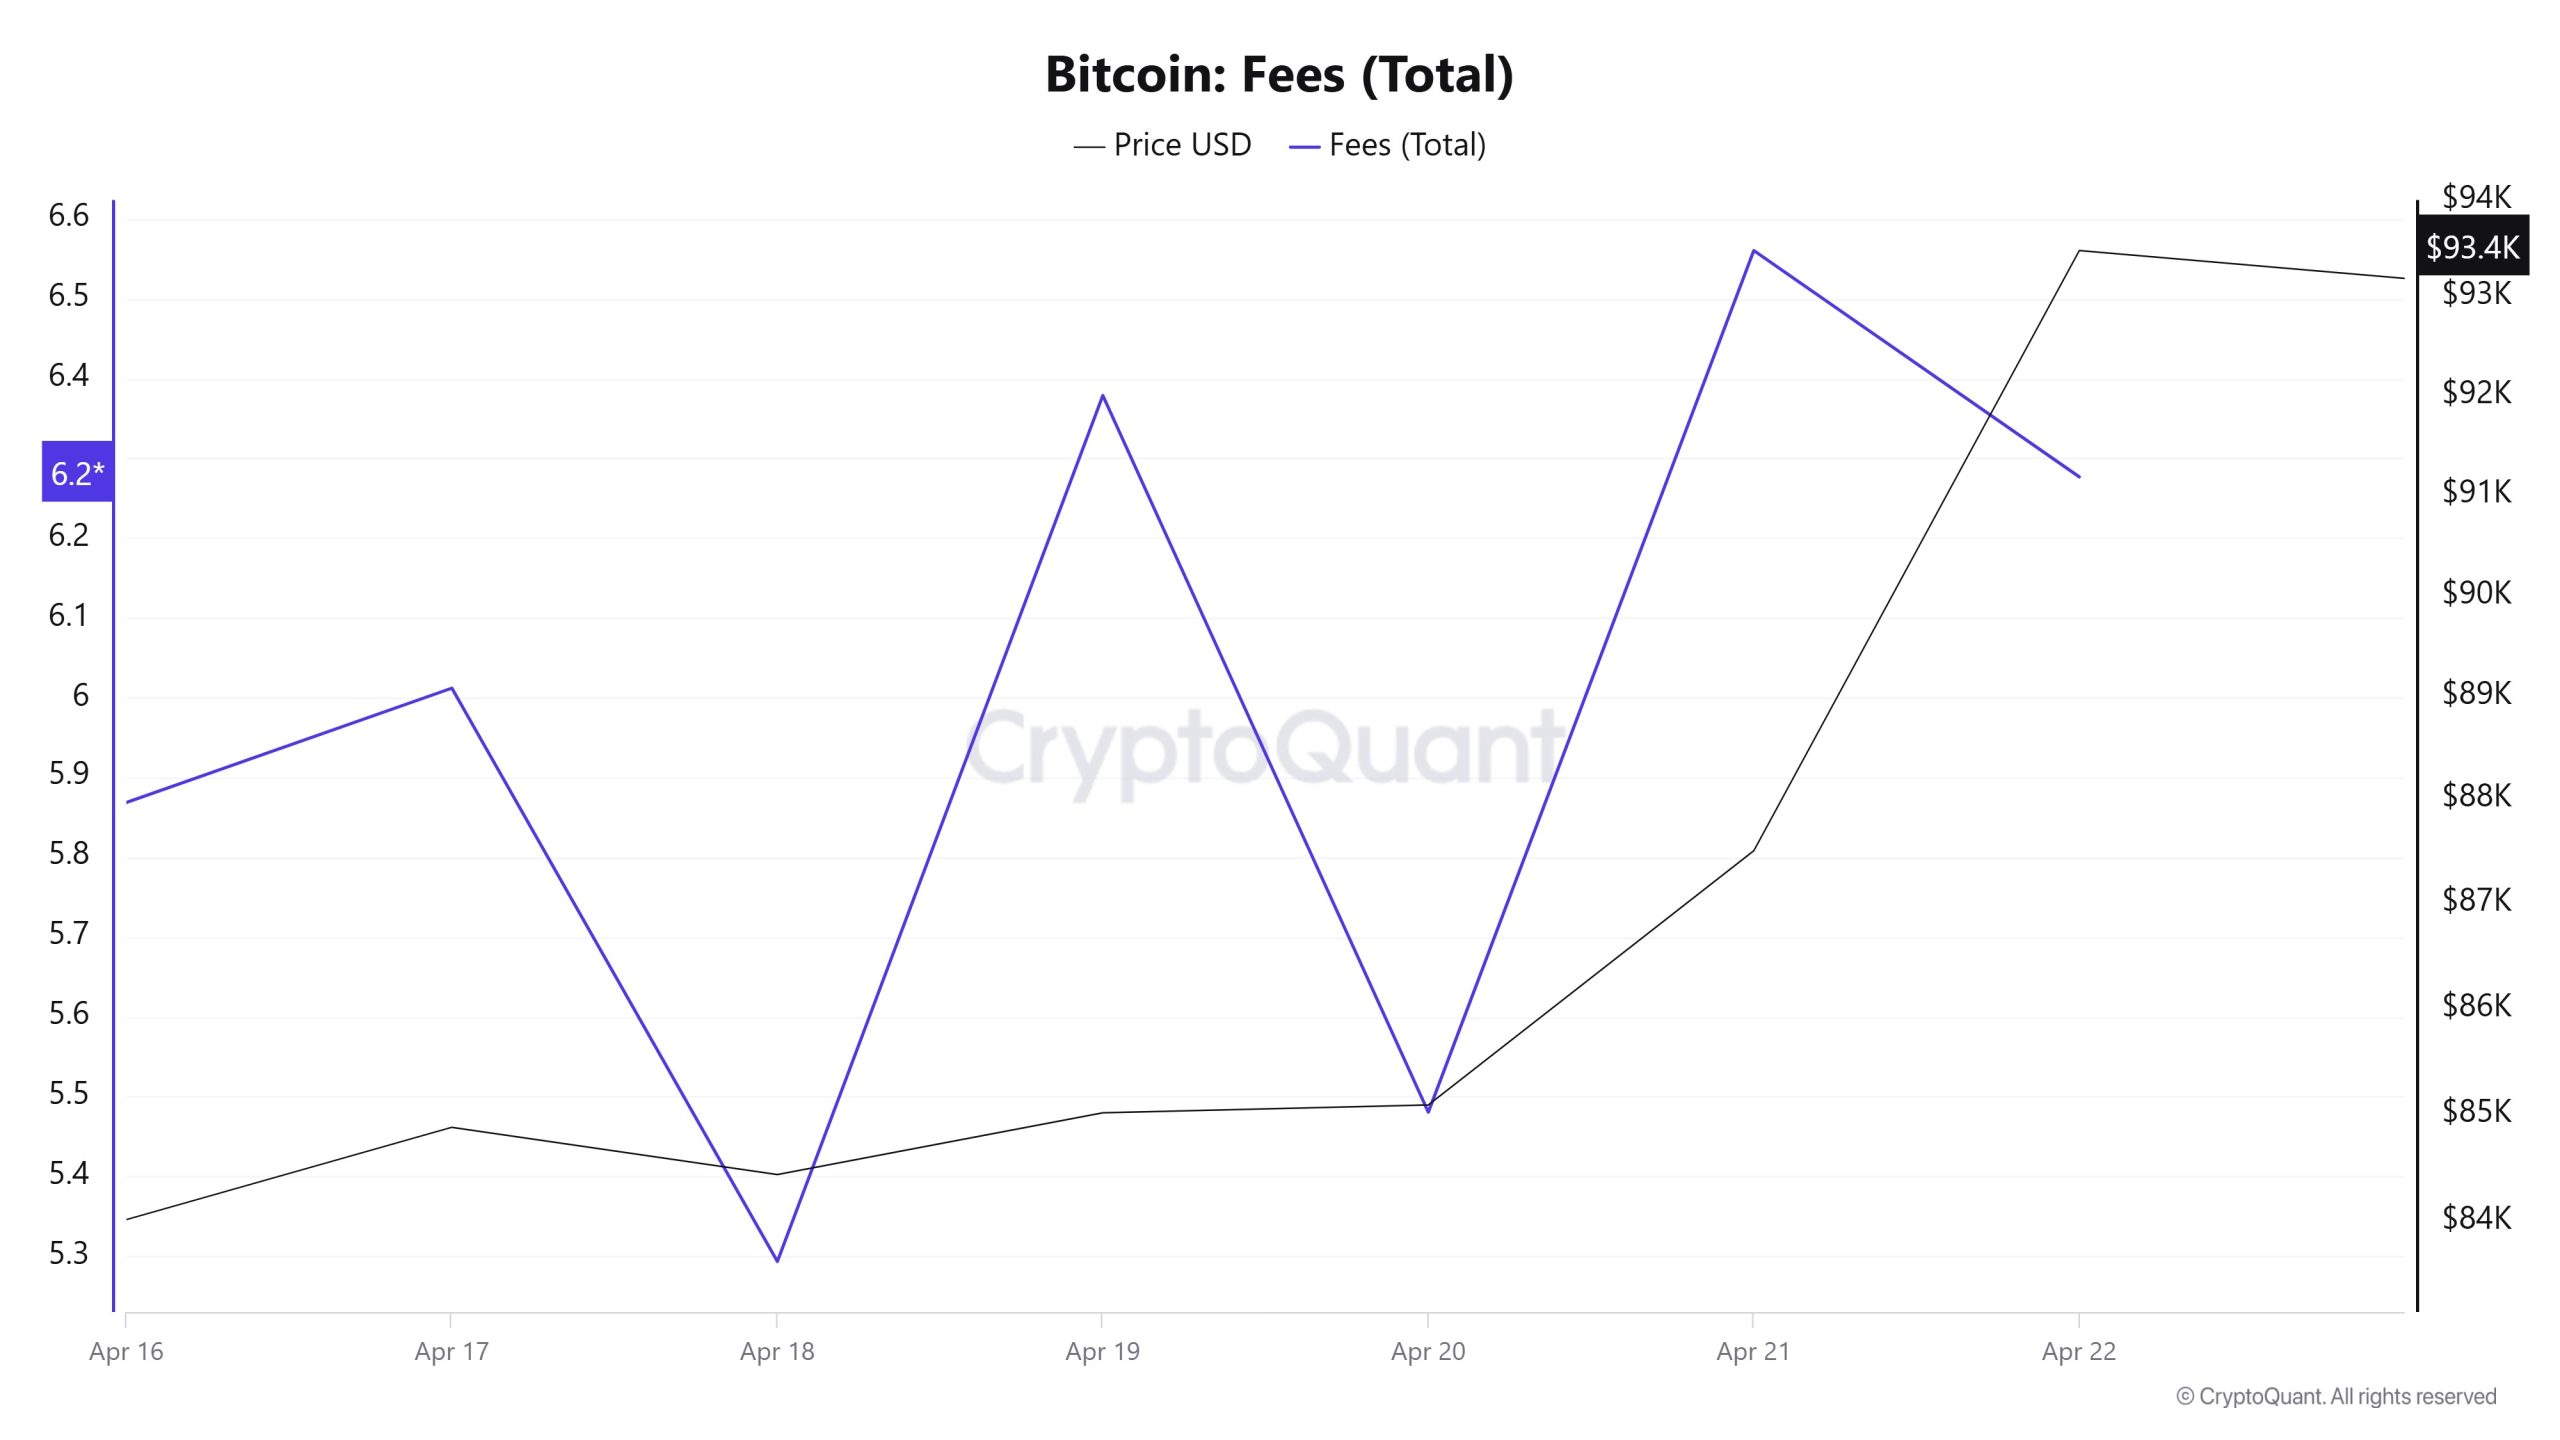
Similarly, when Bitcoin Fees (Total) data between April 16 and April 22 are analyzed, it is seen that this value was at 5.86866499 on April 16, the first day of the weekly period. Until April 18, the value followed a decreasing trend, falling to 5.29350354 on this date, recording its lowest value on a weekly basis.
After April 18, the value, which entered an upward trend with the movements observed in the Bitcoin price, rose to 6.56028401 on April 21, forming a weekly high.
On April 22, the last day of the weekly period, Bitcoin Fees (Total) declined slightly to close at 6.27668027.
Miner Flow
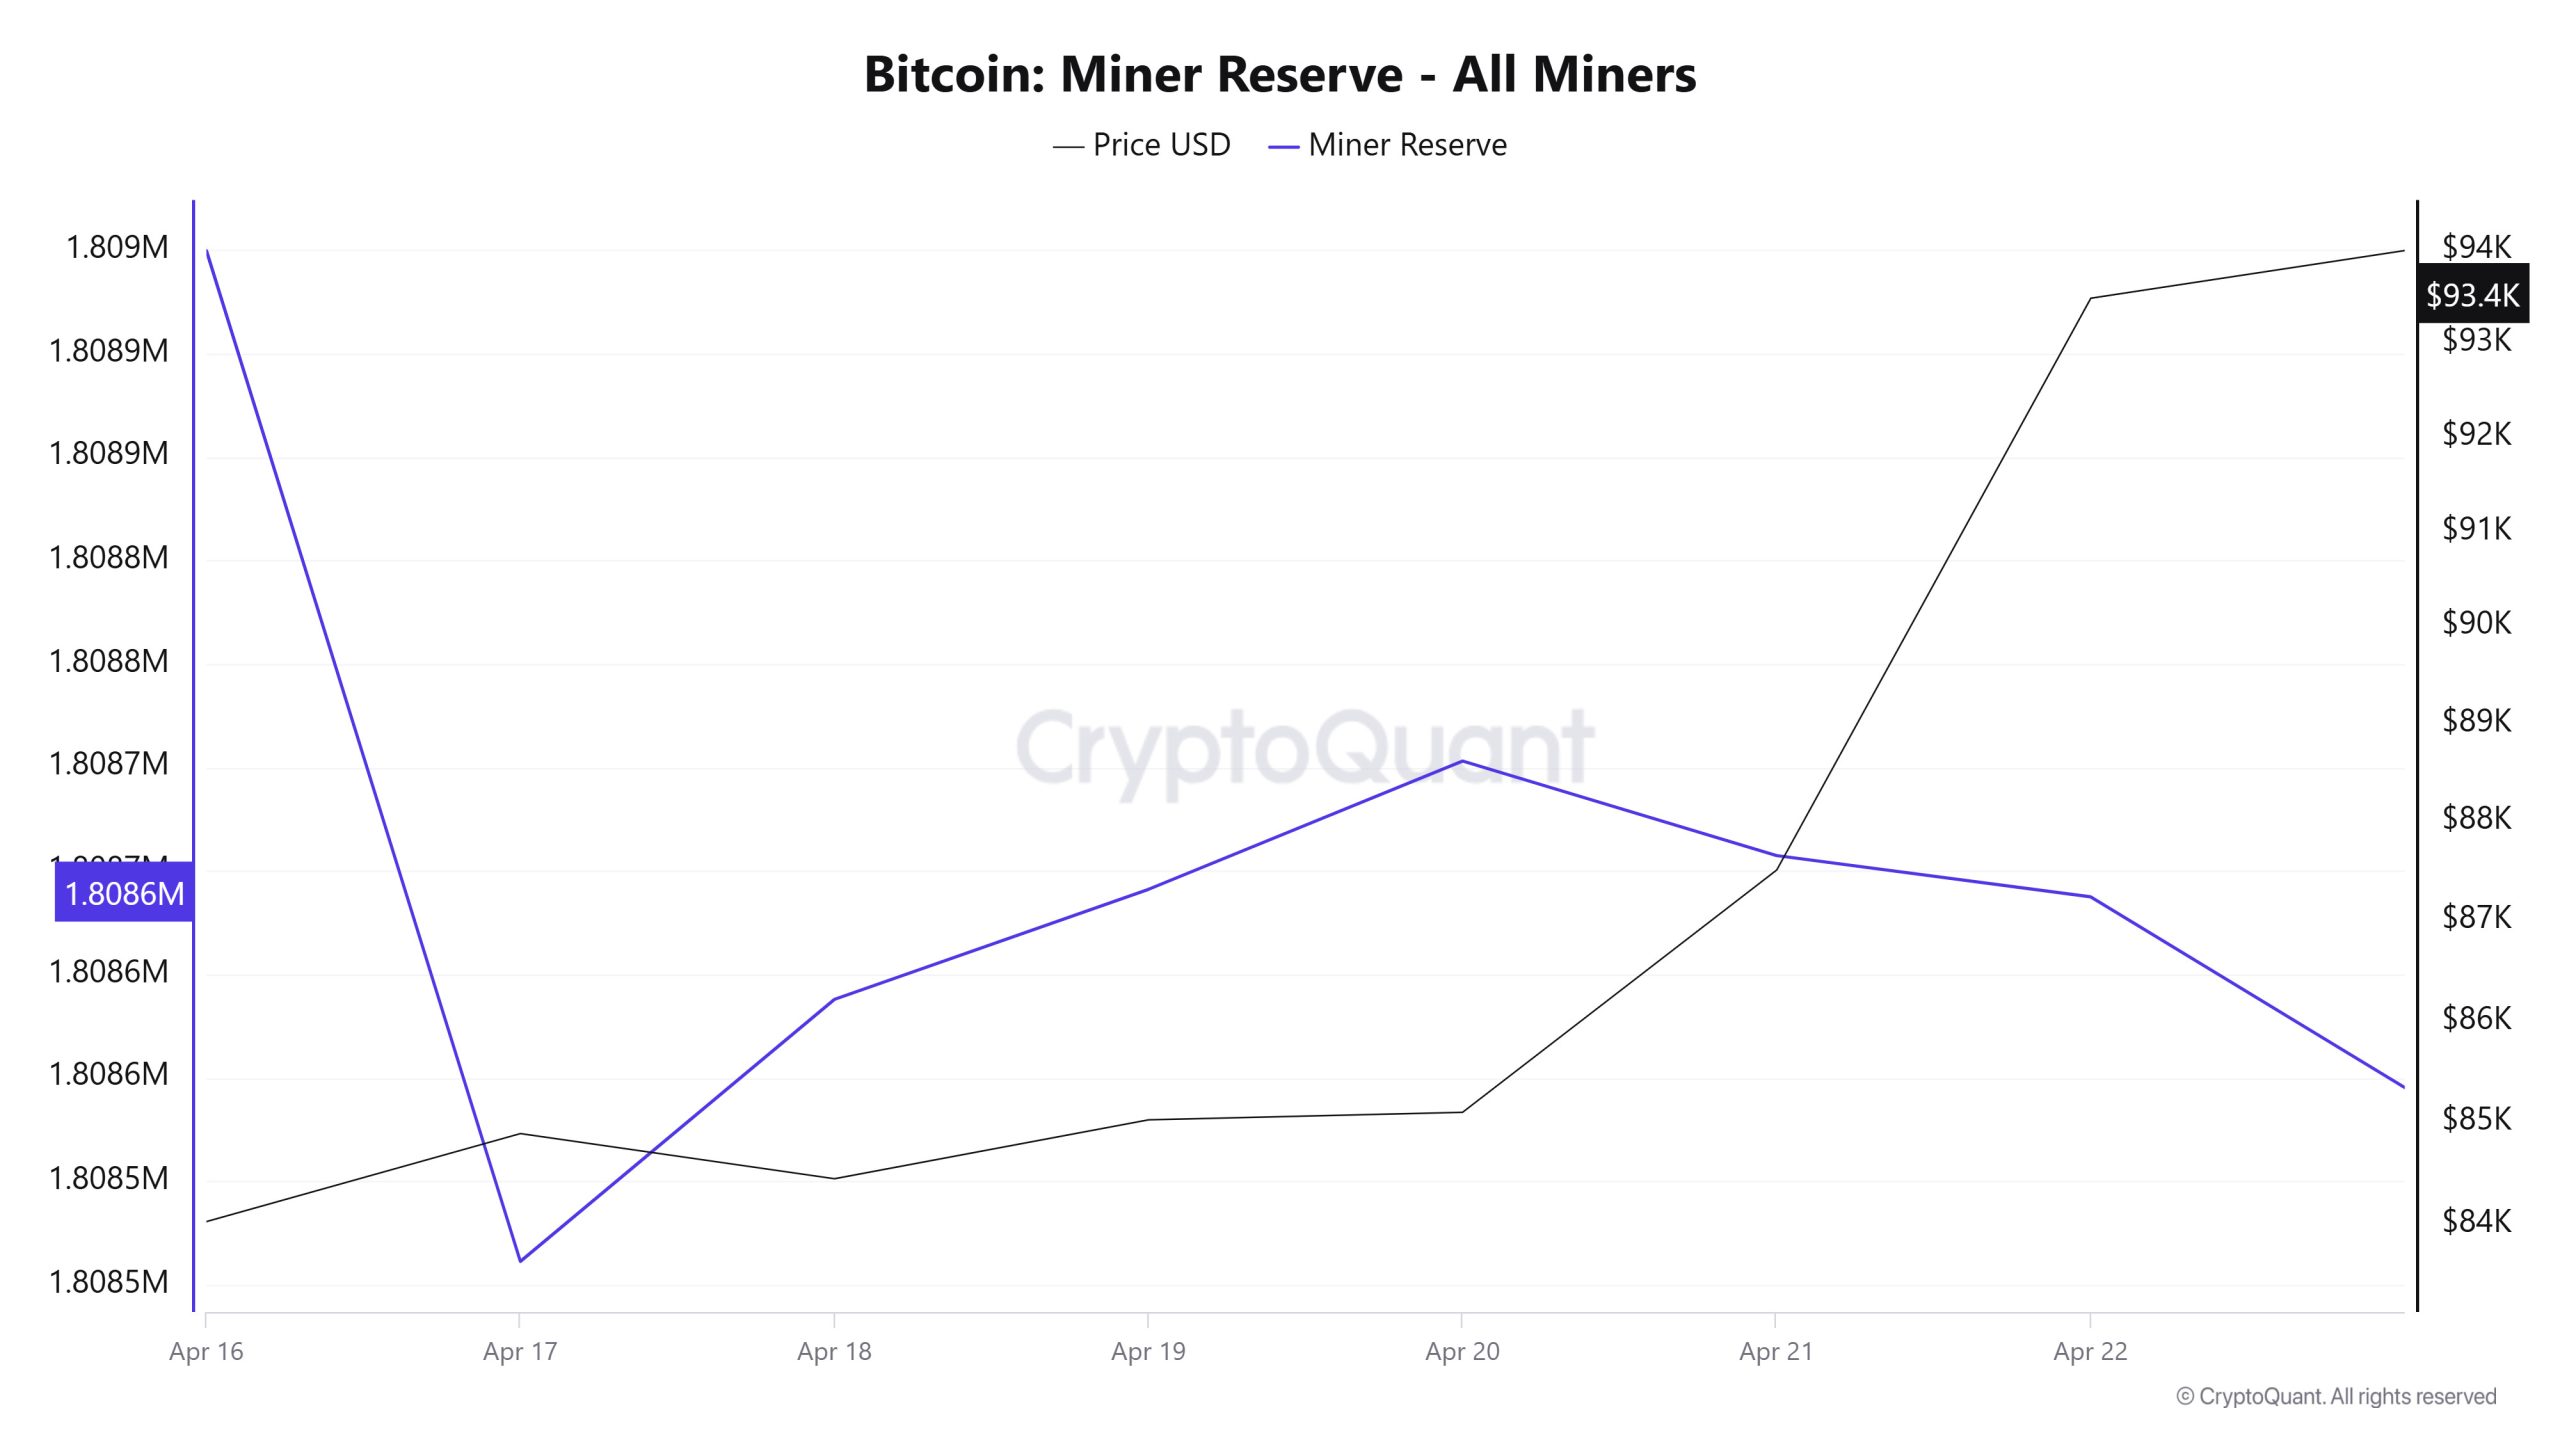
As seen in the Miner Reserve table, the number of Bitcoins in miners’ wallets decreased this week. There is a negative correlation between Miner Reserve and Bitcoin price throughout the week.
Miner Inflow, Outflow and Netflow
Between April 16 and April 22, 42,075 Bitcoins exited miners’ wallets and 41,815 Bitcoins entered miners’ wallets between the same dates. The Miner Netflow for this week was -260 Bitcoin. Meanwhile, the Bitcoin price was $84,025 on April 16 and $93,480 on April 22.
For the week, the net flow (Miner Netflow) was negative as Bitcoin inflow into miner wallets (Miner Inflow) was less than Bitcoin outflow from miner wallets (Miner Outflow).
| Category | April 16 | April 17 | April 18 | April 19 | April 20 | April 21 | April 22 |
|---|---|---|---|---|---|---|---|
| Miner Inflow | 6,671.80 | 5,843.40 | 4,213.78 | 3,539.48 | 2,867.19 | 7,953.41 | 10,726.56 |
| Miner Outflow | 6,618.98 | 6,331.86 | 4,087.14 | 3,486.30 | 2,805.23 | 7,999.10 | 10,746.48 |
| Miner Netflow | 52.82 | -488.45 | 126.64 | 53.18 | 61.96 | -45.68 | -19.92 |
Transaction
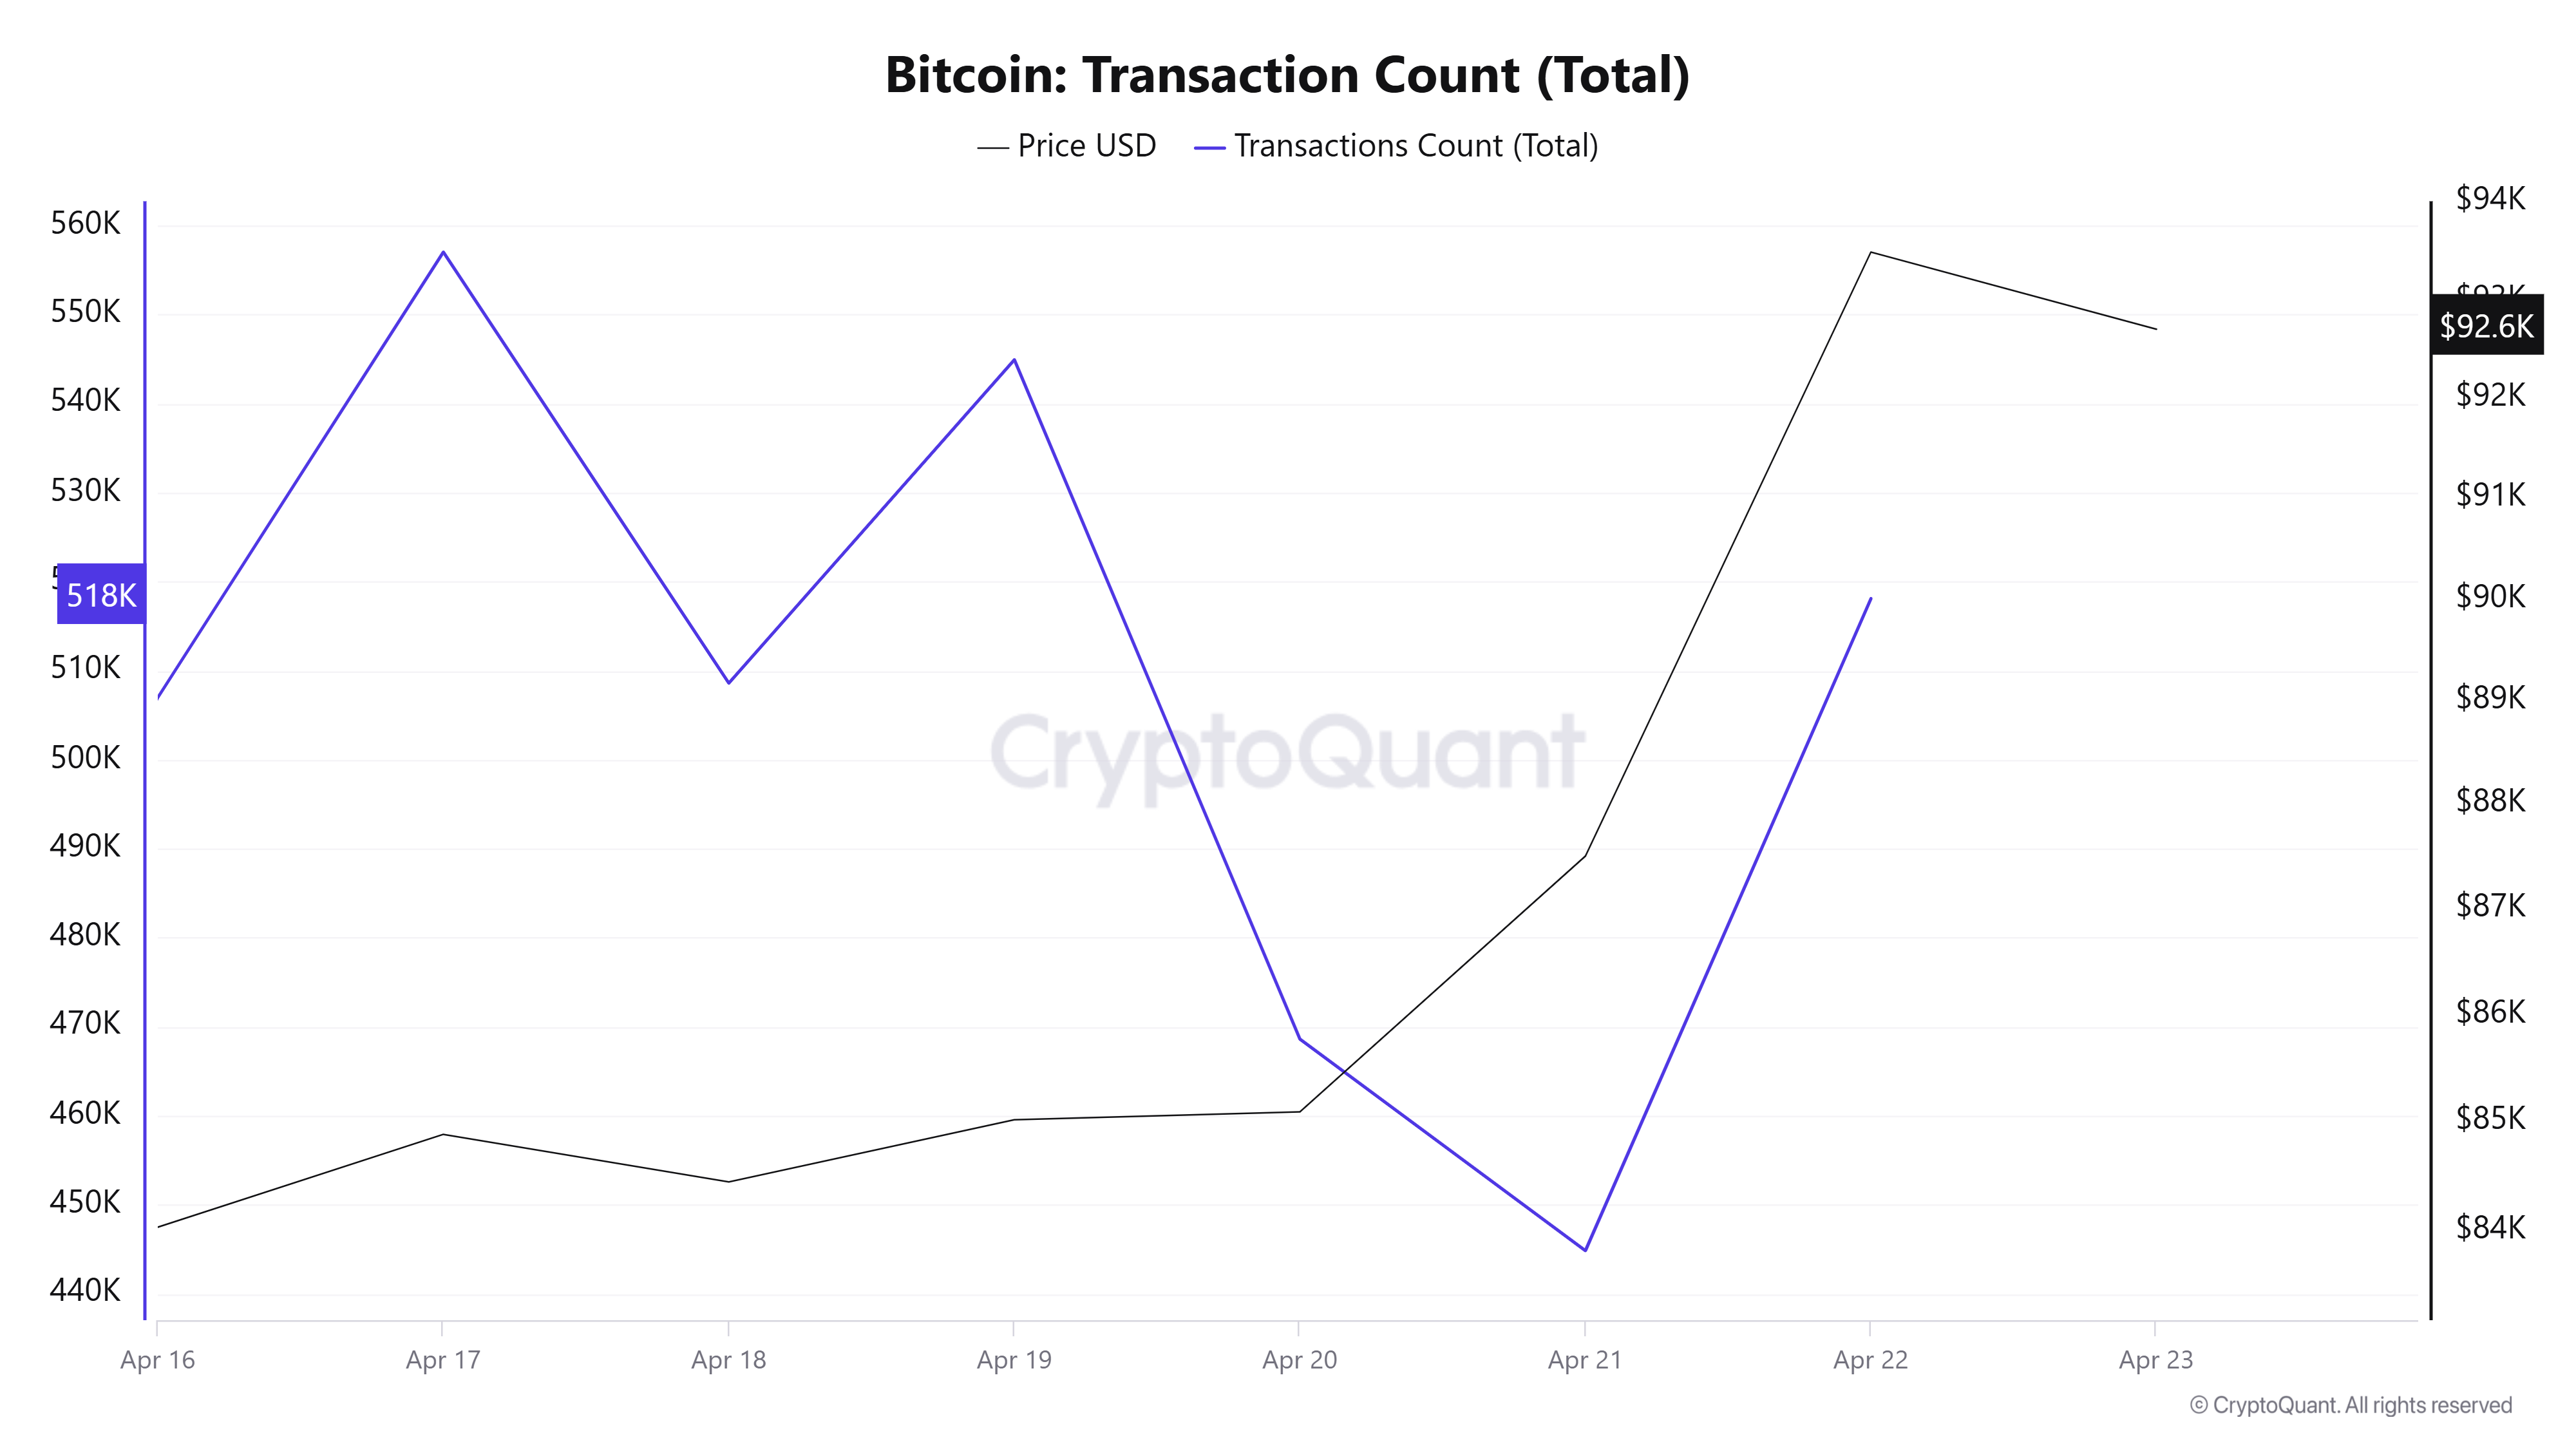
Last week, there were 2,789,841 transactions on the Bitcoin network, compared to 3,549,489 this week, an increase of 27.25%. The 557,028 transactions recorded on April 17th was the highest transaction volume of the week, while the lowest number of transactions was 444,860 on April 21st.
The correlations between price and number of trades are dominated by positive correlations. The increase in the number of trades this week compared to the previous week creates a stronger network outlook.
Tokens Transferred
While 4,183,260 BTC was transferred last week, it decreased by 7.28% to 3,878,668 BTC this week. On April 22, 756,942 BTC were transferred, the highest token transfer volume of the week, while the lowest token transfer volume was recorded on April 20 with 339,273 BTC. There is a gradual decrease in the amount of BTC transferred on the network between April 9-13. Between 20-22, there is a regular increase in the amount of tokens transferred. In the “amount of BTC transferred – Price” relationship, positive correlations continue.
Whale Activities
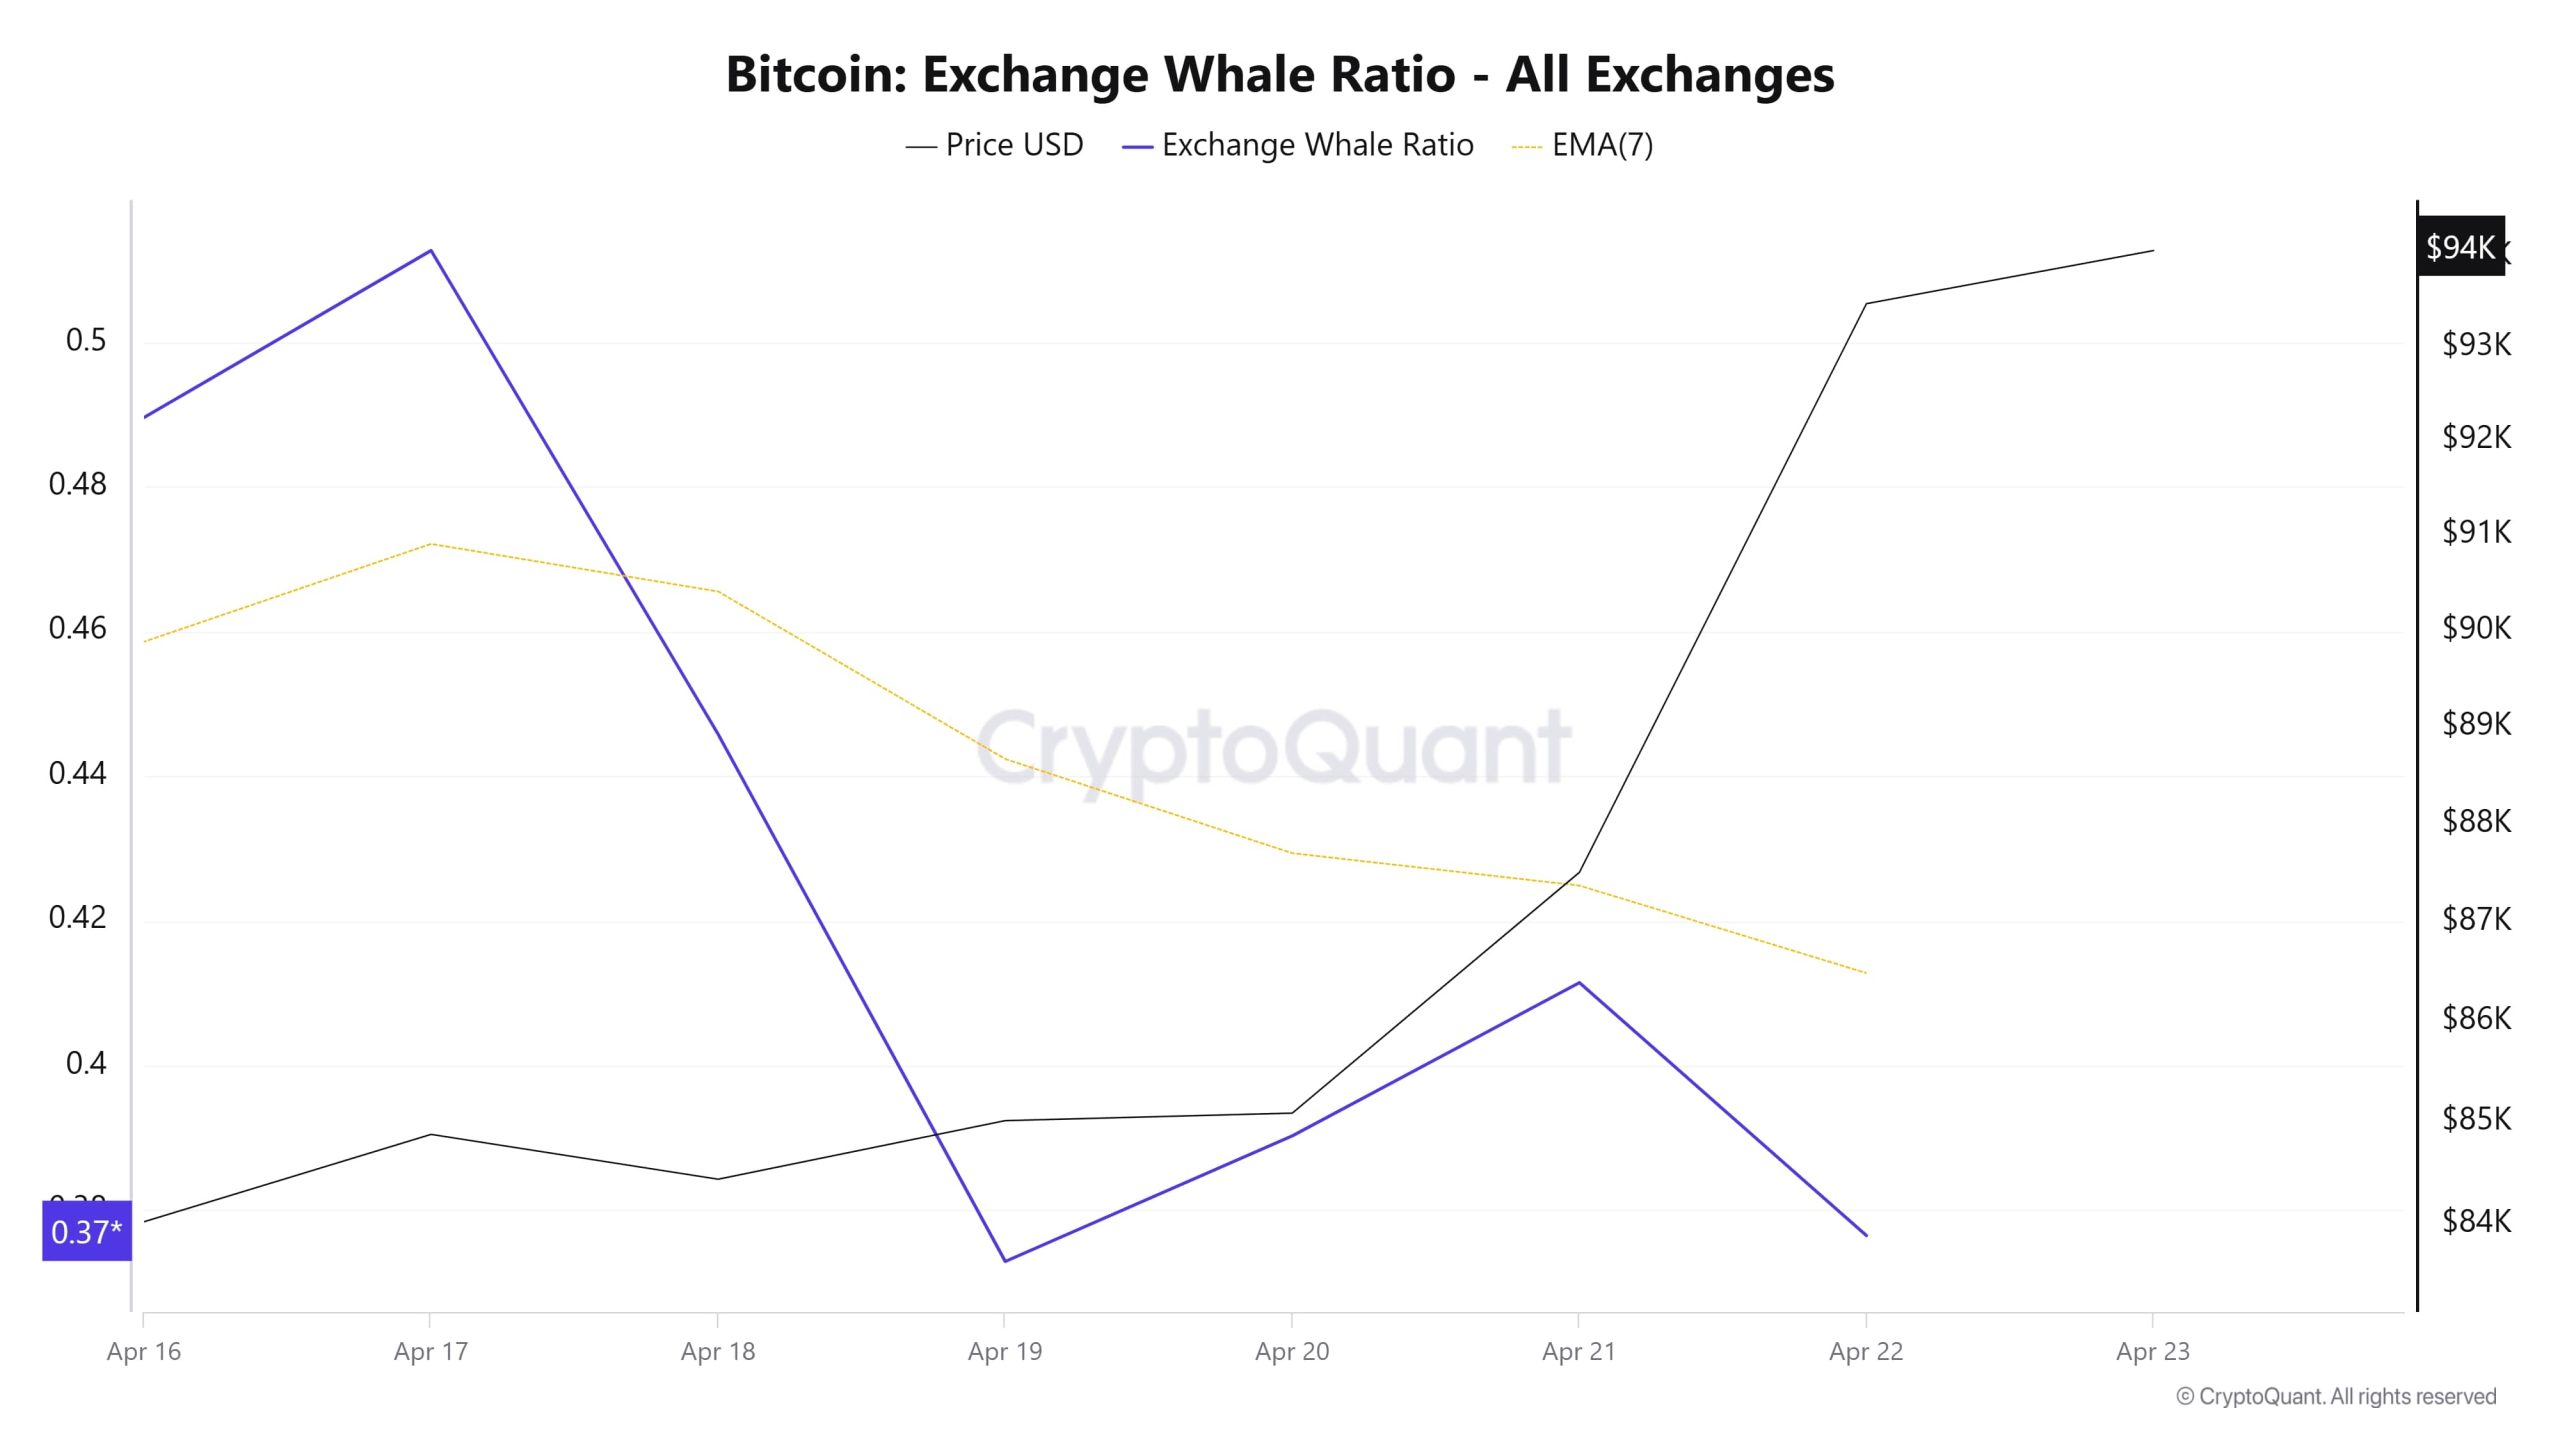
Whales Data
According to the data that attracted attention in the cryptocurrency market in the last 7 days, whale activities on the central exchange showed us that they used the central exchanges a lot at the beginning of the process. Towards the middle of the process, these activities decreased and showed a low level. When we look at the Exchange Whale Ratio metric, the rate of whales using central exchanges at the beginning of the 7-day process was measured as 0.512. At the same time, this ratio peaked on April 17th. When this ratio is above 0.350, it usually means that whales use central exchanges frequently. This measurement decreased in the middle of the process, falling to 0.372 on April 19, which was the low point of the process. The current ratio of 0.376 and BTC’s rise from $84,500 to $94,000 in this process shows that whales are using centralized exchanges by buying. At the same time, total BTC transfers decreased by about 7% compared to last week, with 3,878,668 BTC moving. The data shows that more than 60 new wallets holding 1,000 BTC or more have been added since early March. On the other hand, addresses holding more than 100 BTC increased slightly, reaching 18,026 as of April 20. Wallets holding more than 10,000 BTC continued to accumulate. As a result, we can say that investments in BTC by institutions, funds or early investors with a long-term perspective continue to increase.
BTC Onchain Overall
| Metric | Rise 📈 | Decline 📉 | Neutral ➖ |
|---|---|---|---|
| Active Addresses | ✓ | ||
| Breakdowns | ✓ | ||
| Derivatives | ✓ | ||
| Supply Distribution | ✓ | ||
| Exchange Reserve | ✓ | ||
| Fees and Revenues | ✓ | ||
| Miner Flows | ✓ | ||
| Transaction | ✓ | ||
| Whale Activities | ✓ |
*The metrics and guidance in the table do not, by themselves, describe or imply an expectation of future price changes for any asset. The prices of digital assets may vary depending on many different variables. The onchain analysis and related guidance is intended to assist investors in their decision-making process, and making financial investments based solely on the results of this analysis may result in harmful transactions. Even if all metrics produce a bullish, bearish or neutral result at the same time, the expected results may not be seen depending on market conditions. Investors who review the report should take these warnings into account.
Legal Notice
The investment information, comments and recommendations contained in this document do not constitute investment advisory services. Investment advisory services are provided by authorized institutions on a personal basis, taking into account the risk and return preferences of individuals. The comments and recommendations contained in this document are of a general type. These recommendations may not be suitable for your financial situation and risk and return preferences. Therefore, making an investment decision based solely on the information contained in this document may not result in results that are in line with your expectations.
NOTE: All data used in Bitcoin onchain analysis is based on Cryptoqaunt.
