
Weekly Fundamental Analysis Report
Fear & Greed Index
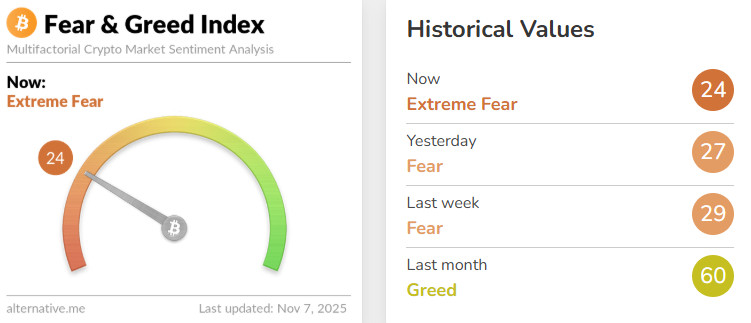
Source: Alternative.me
Change in Fear and Greed Value: -5
Last Week’s Level: 29
This Week’s Level: 24
Sentiment in the crypto market fell into the Extreme Fear zone this week. On the policy front, Donald Trump’s goal of making the US a global leader in crypto and China’s statements about making “huge” investments in Bitcoin and crypto supported short-term sentiment, but cautious tones from Fed members dampened risk appetite. Despite Miran’s emphasis that “we are too restrictive,” Goolsbee’s messages that he is “uncomfortable with an early cut” and “may be reluctant to cut without seeing data” increased uncertainty about the path of cuts. ADP’s figure of 42,000, which exceeded expectations, did not confirm a sudden weakening on the labor front. While the US administration’s move to block Nvidia’s AI chip exports to China kept tensions high in the tech sector, Treasury Secretary Bessent’s description of trade relations between the two countries as “in a good place” partially balanced the tension. The impact slowed price momentum, increased volatility, and reduced risk appetite. In institutional flows, Strategy’s purchase of 397 BTC at an average price of $114,771 and Bitmine’s purchase of 82,353 ETH limited the negative flow by signaling sustained demand countering the declines, but macro uncertainty and caution in policy communication prevailed.
Fund Flows
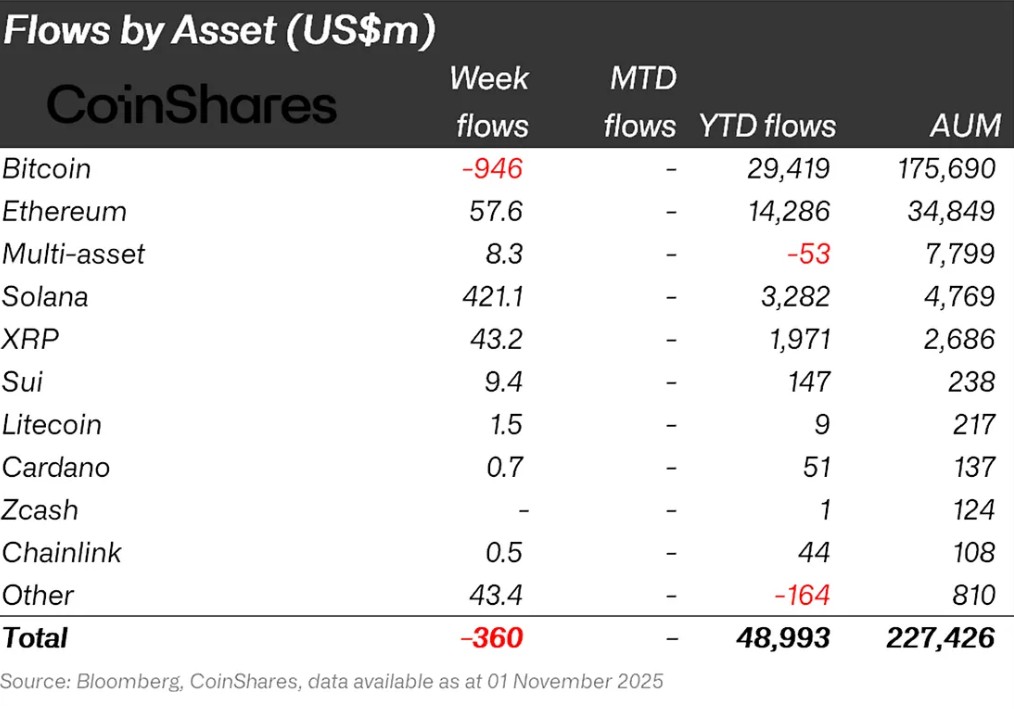
Source: CoinShares
Overview: Cryptocurrency markets started the week with a decline despite the interest rate cut and positive customs agreements with China. As a result of these developments, Bitcoin lost approximately 10% of its value during the week.
Ethereum (ETH): Along with spot ETH inflows, Ethereum saw $57.6 million in inflows this week.
Ripple (XRP): XRP saw $42.2 million in fund inflows this week.
SUI: New stablecoin updates are being discussed for Sui. This situation continued with $9.4 million in inflows into Sui ( ).
Solana (SOL): Solana saw inflows of $421.1 million.
Chainlink (LINK): Chainlink saw an inflow of $0.5 million this week.
Litecoin (LTC): There was an inflow of $1.5 million into LTC coin.
Cardano (ADA): Cardano saw an inflow of $0.7 million this week.
Multi-asset: Inflows were observed in the multi-asset group.
Other: Sector- and project-based increases in altcoins, along with the general market outlook, brought in $43.4 million in fund inflows.
Fund Outflows:
Bitcoin (BTC): Bitcoin experienced outflows from investors this week. Despite the global interest rate cut and the customs agreement with China, Bitcoin-focused funds saw $946 million in outflows.
Altcoin Season Index
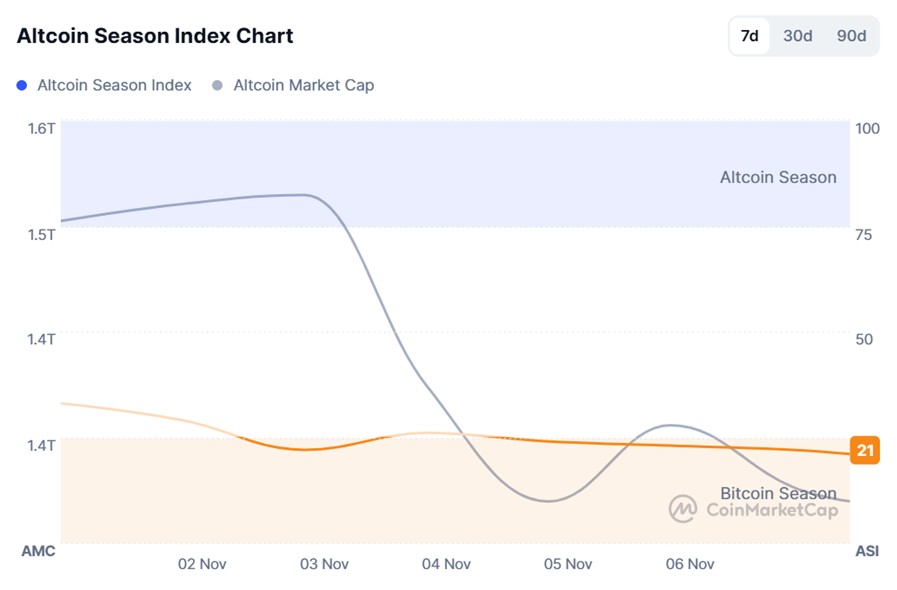
Source: Coinmarketcap
- Last Week’s Index Value: 30/100
- This Week’s Index Value: 21/100
Between October 31 and November 7, 2025, a decline was observed in the correlation between altcoin market dominance (Altcoin Market Cap) and the Altcoin Season Index. The graph shows that this week, on November 7 , the index fell back to 21, with Altcoin Market Cap reaching 1.34T. This indicates a decline in the market dominance of altcoins. When the index rose this week, the top 5 coins leading the rise were Zec, Aster, M, DASH, and OKB. Although the index rose from 22 to 25 on November 3, indicating a short-term upside potential for the altcoin season, the index fell by 5% this week.
Bitcoin Dominance
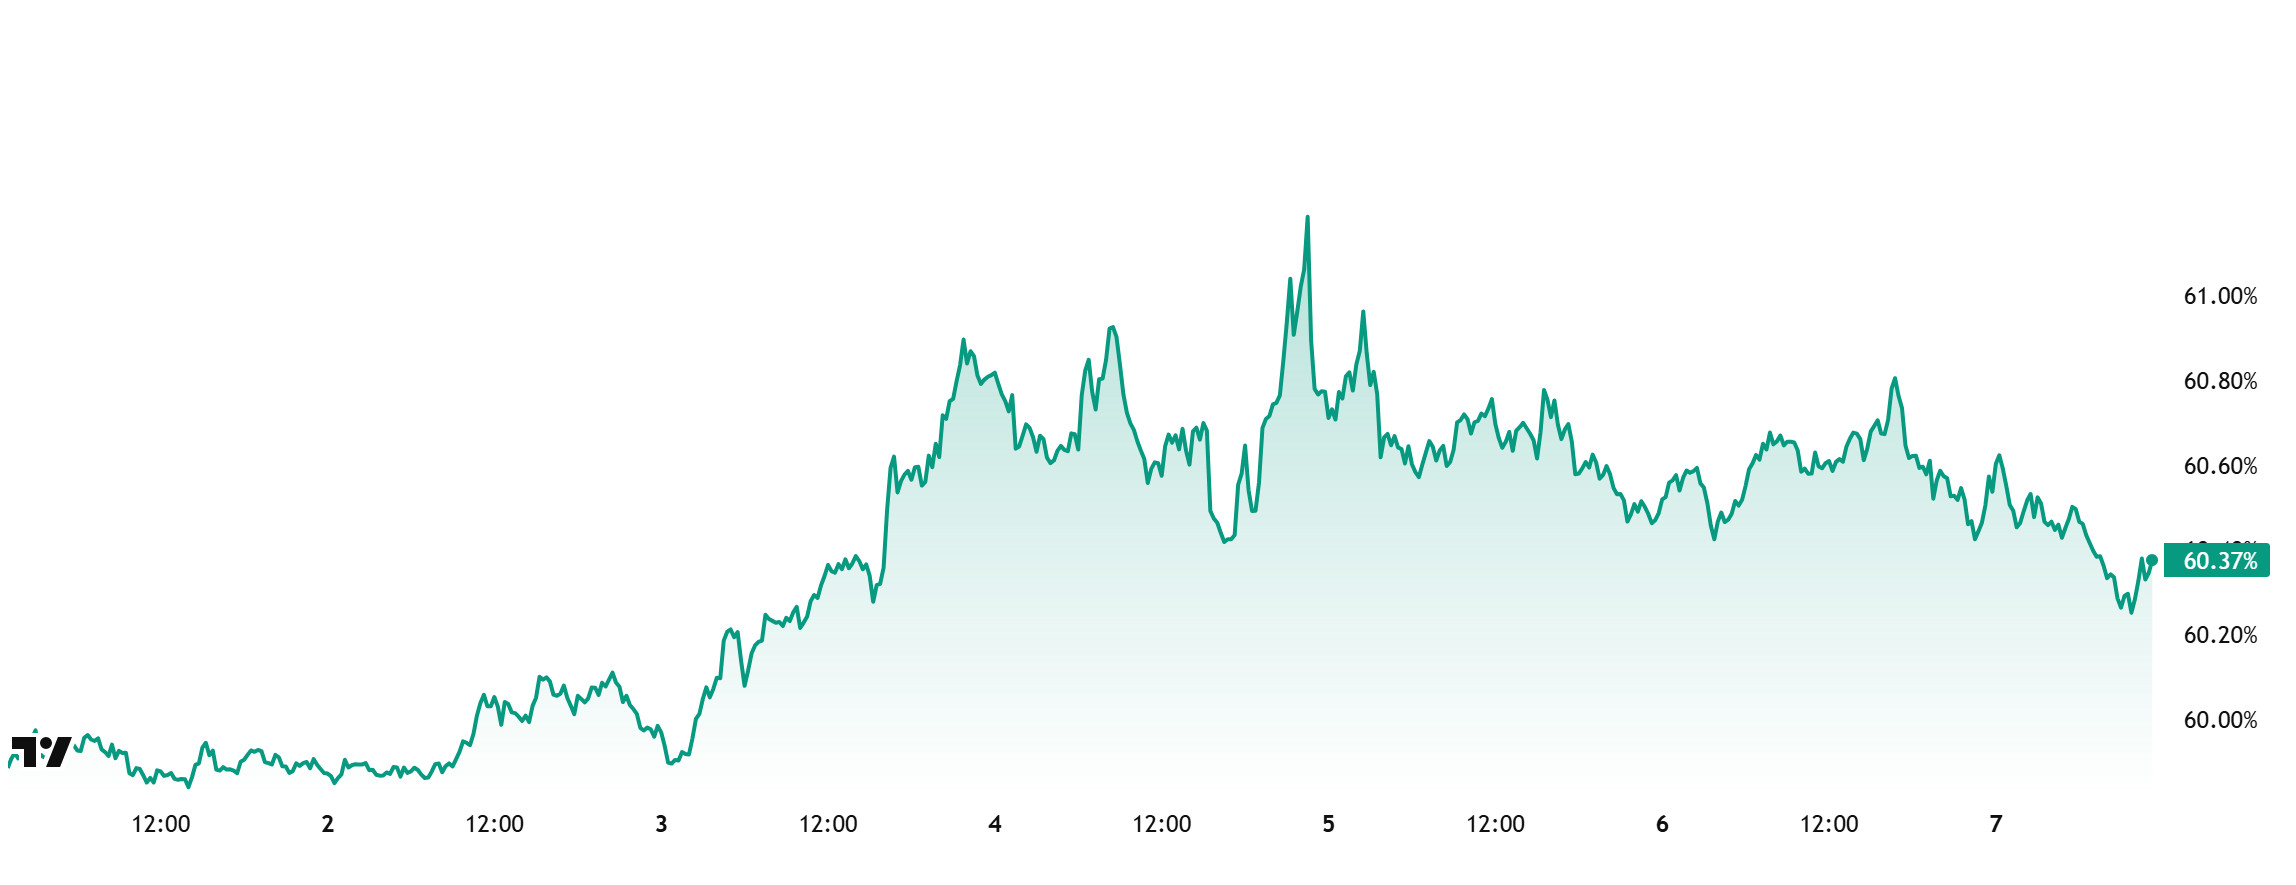
Bitcoin dominance, which started the week at 59.90%, rose to 61.41% during the week but subsequently retreated slightly and is currently at 60.37%.
This week, Strategy purchased 397 Bitcoin, The Smarter Web purchased 4 Bitcoin, and Bitplanet purchased 27 Bitcoin. Data on Bitcoin spot ETFs also shows a net outflow of $661.2 million to date.
The loss of momentum in institutional Bitcoin inflows continued this week, while retail investors trading through ETFs were seen to be more sales-oriented. The uncertain market environment is causing capital inflows into crypto assets to remain weak and limiting the buying momentum on the Bitcoin side. Recent net outflows in spot ETFs keep the risk of increased selling pressure in the short term on the agenda. However, despite all these conditions, Bitcoin is performing stronger in the short term compared to Ethereum and other major altcoins. In the current climate of ongoing uncertainty, if institutional demand increases cautiously, BTC dominance is expected to maintain its dominant structure and continue its horizontal consolidation process in the 58%–61% range.
Ethereum Dominance
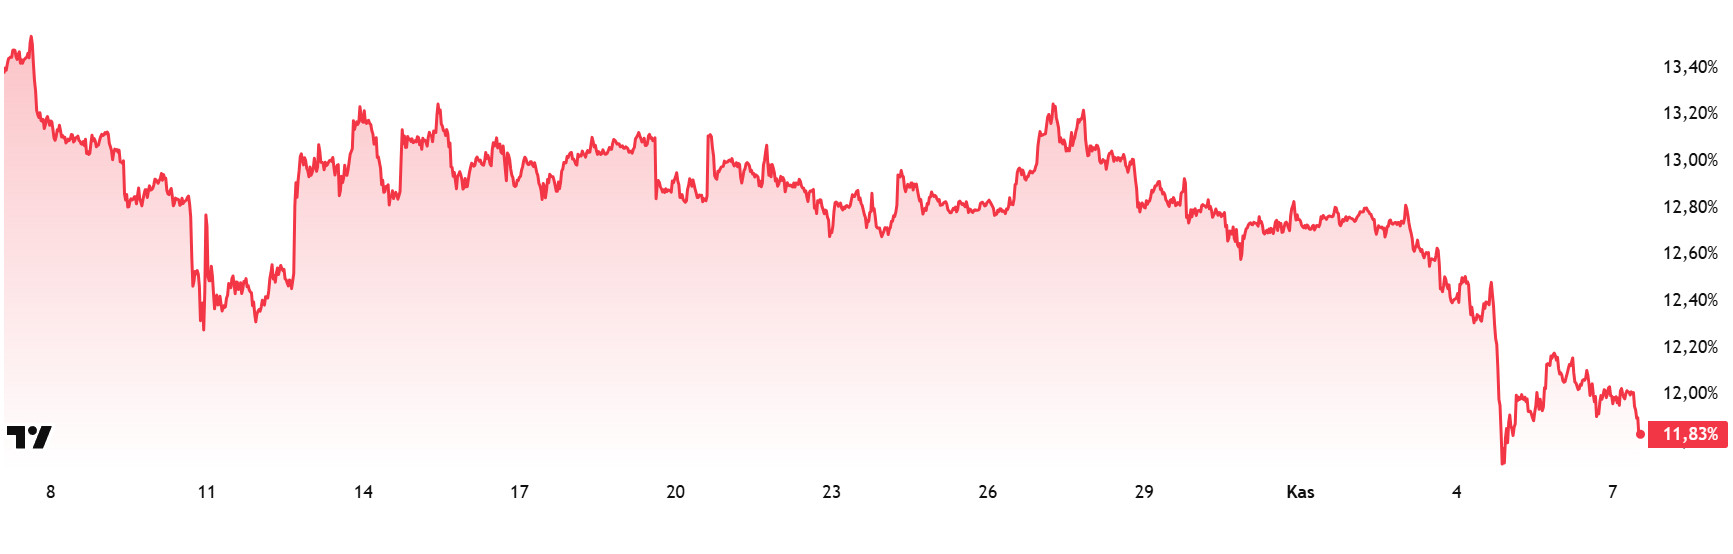
Source: Tradingview
Weekly Change:
- Last Week’s Level: 12.81%
- This Week’s Level: 11.83%
Ethereum dominance, which rose to 15% levels in mid-August, lost momentum in the following period and entered a downward trend, which continues as of this week.
Accordingly, Ethereum dominance ended last week at 12.81%, while current data shows it is trading at approximately 11.83%.
During the same period, Bitcoin dominance has followed a positive trajectory, unlike Ethereum.
The key developments affecting Ethereum dominance are as follows:
According to Lookonchain data, the “anti-CZ whale” closed its short positions and opened a long position worth $109 million in 32,802 ETH. Additionally, according to Onchain Lens data, BlackRock deposited 4,652.87 BTC worth $478.5 million and 57,455 ETH worth $194.86 million into Coinbase in the last 24 hours. This move is seen as part of an institutional liquidity management or reallocation strategy.
Bitcoin Spot ETF
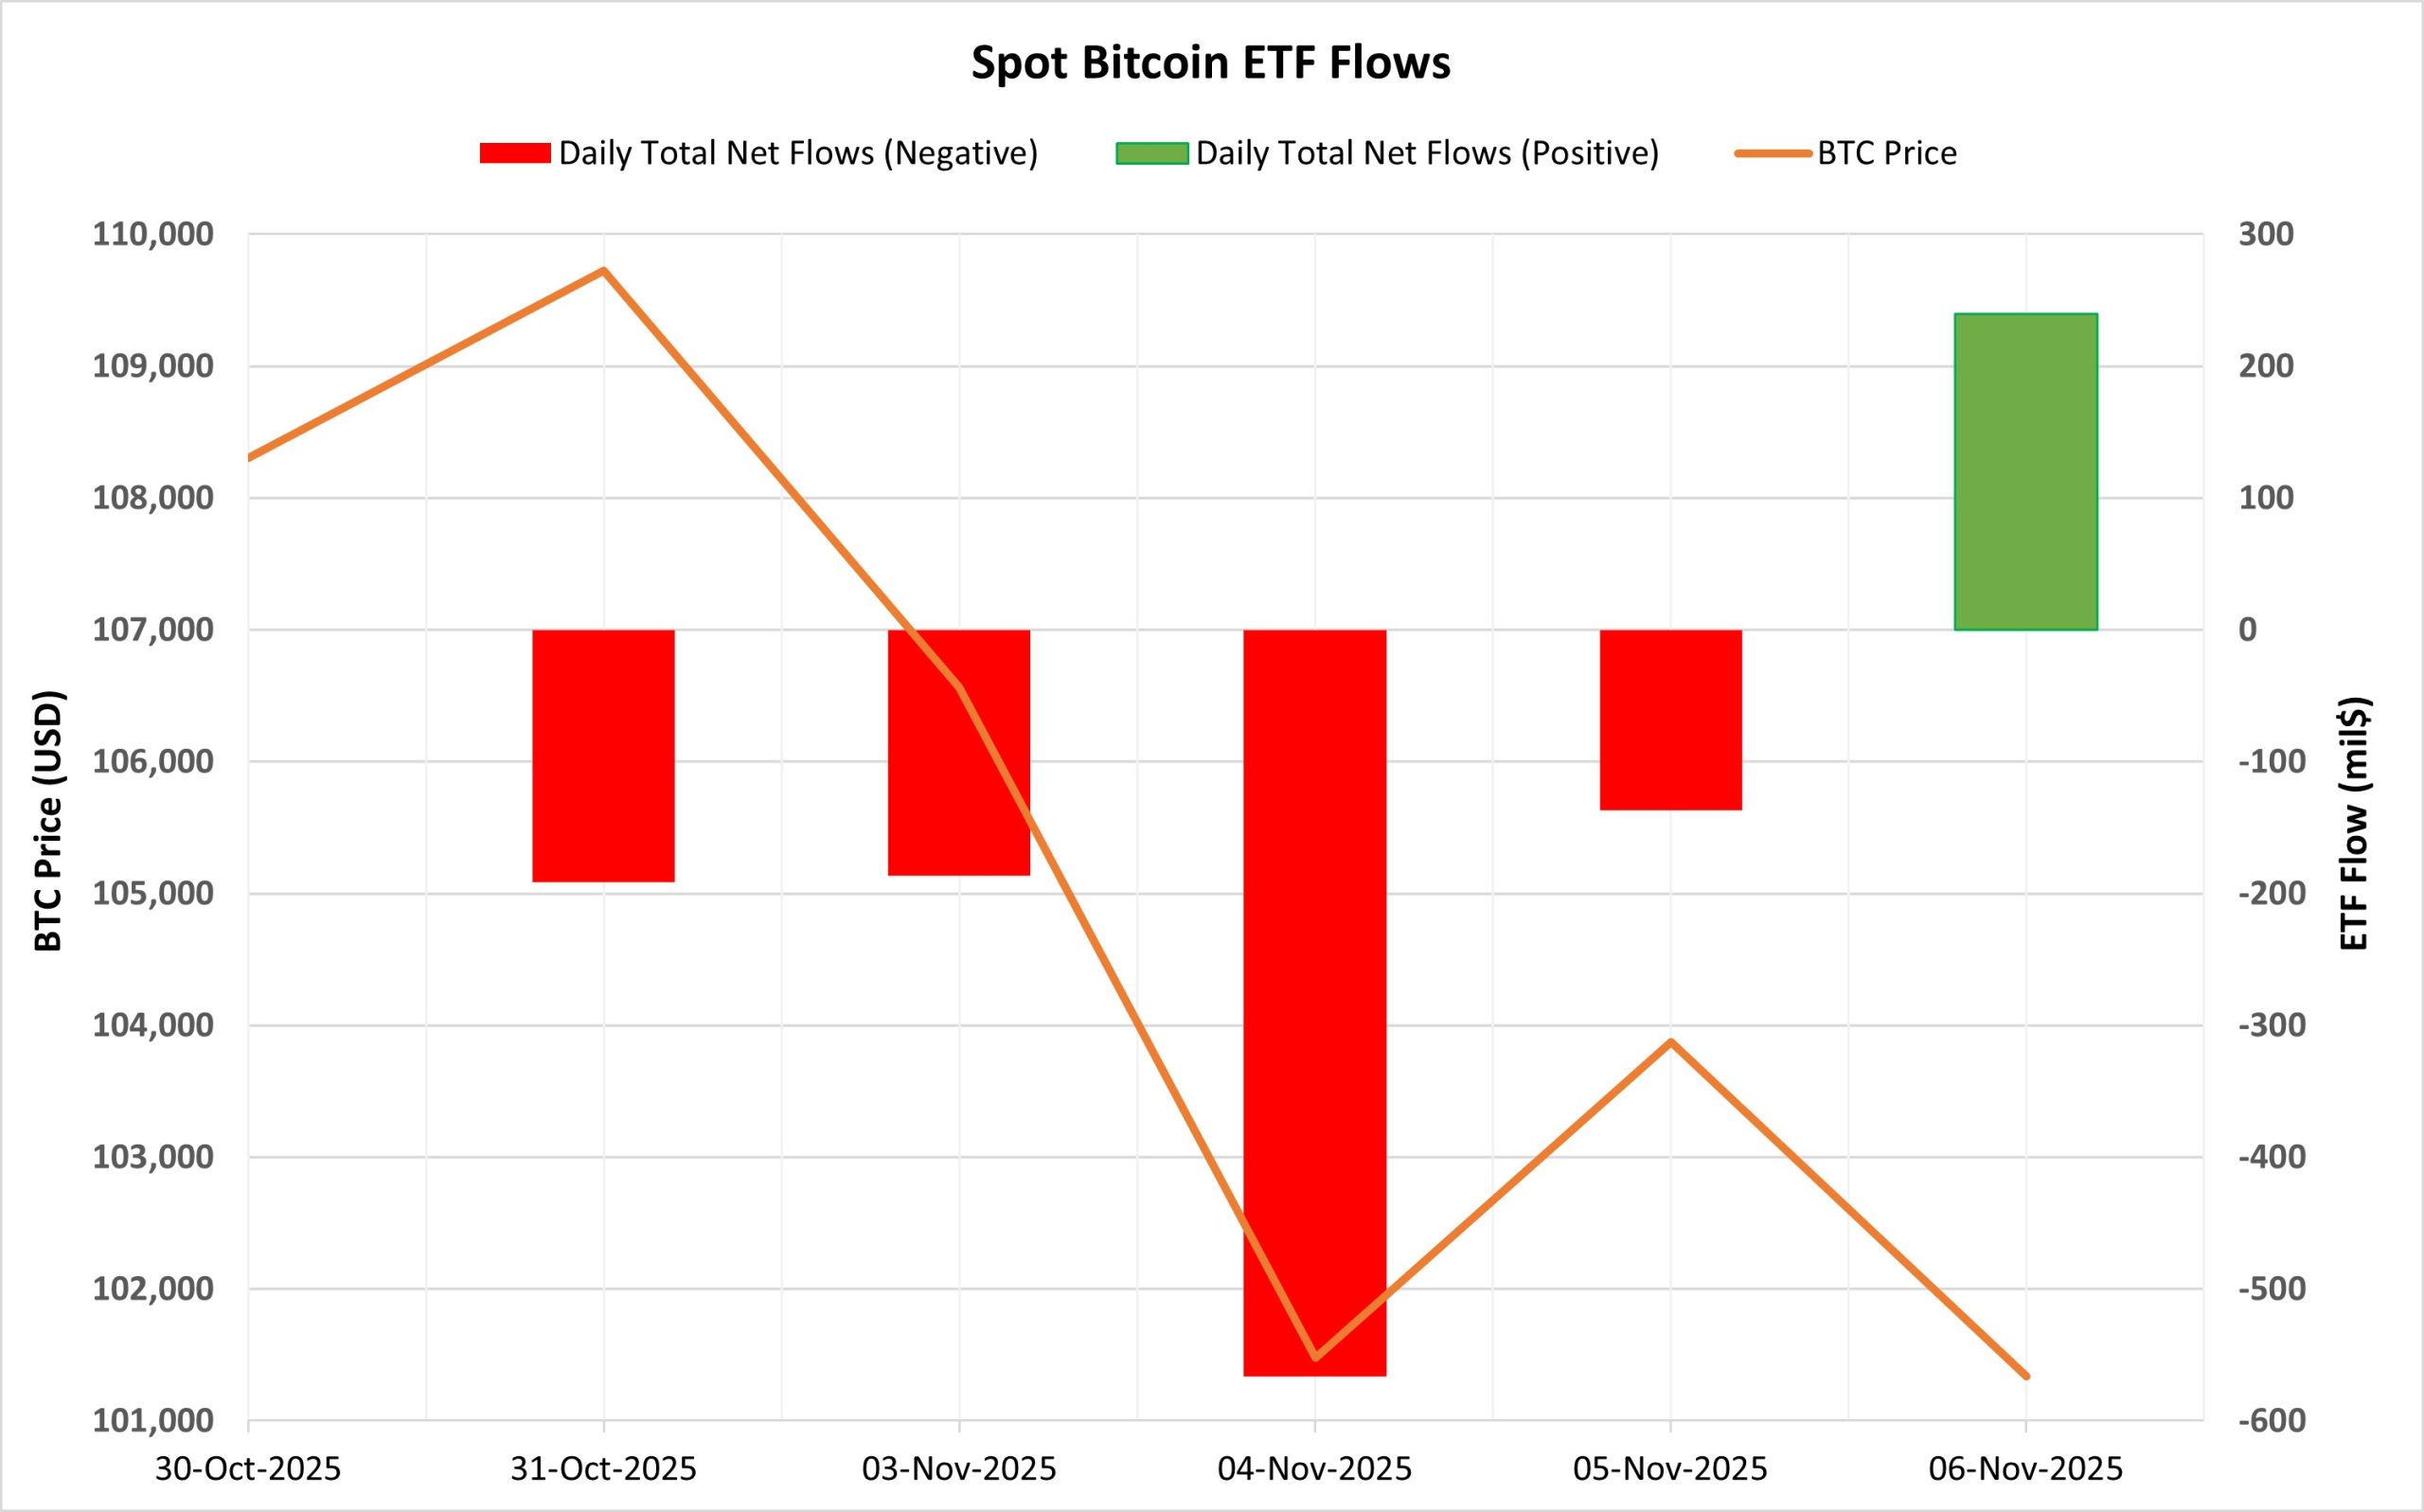
Source: Darkex Research Department
Netflow Status: Between October 31 and November 6, a total of $841.6 million in net outflows occurred from Spot Bitcoin ETFs. After four consecutive days of negative flows, this series ended on November 6 with an inflow of $239.9 million. While outflows from BlackRock IBIT and Fidelity FBTC dominated on a fund basis, inflows on November 6 were primarily through BlackRock IBIT, Fidelity FBTC, and Ark ARKB.
Bitcoin Price: Bitcoin opened at $108,303 on October 31 and closed at $101,338 on November 6. During this period, the BTC price fell by 6.43%. The price decline accelerated, particularly with the significant sell-off seen on November 4.
Cumulative Net Inflow: By the end of the 458th trading day, the cumulative total net inflow into Spot Bitcoin ETFs had declined to $60.50 billion.
| DATE | COIN | PRICE OPEN | PRICE CLOSE | CHANGE % | ETF Flow (mil$) |
|---|---|---|---|---|---|
| October 31, 2025 | BTC | 108,303 | 109,726 | 1.31% | -191.6 |
| November 3, 2025 | BTC | 110,534 | 106,561 | -3.59% | -186.5 |
| November 4, 2025 | BTC | 106,561 | 101,475 | -4.77% | -566.4 |
| November 5, 2025 | BTC | 101,475 | 103,871 | 2.36% | -137.0 |
| November 6, 2025 | BTC | 103,871 | 101,338 | -2.44% | 239.9 |
| Total for October 31 – November 6, 2025 | -6.43% | -841.6 | |||
Outflows on six of the last seven trading days indicated that selling pressure prevailed on the ETF side. The negative flow series highlighted the slowdown in cumulative volume, while weak institutional demand was clearly reflected in this period. In this context, the sharp pullback in prices also progressed in parallel with the flows. The net inflow on November 6 does not mean that the wave of selling has completely ended, but it can be seen as a sign of a search for balance in the short term. In the coming period, a renewed strengthening of inflows could create ground for BTC to recover. On the contrary, if the outflow trend continues, BTC’s attempts to rise may remain limited and selling pressure may increase.
Ethereum spot ETF
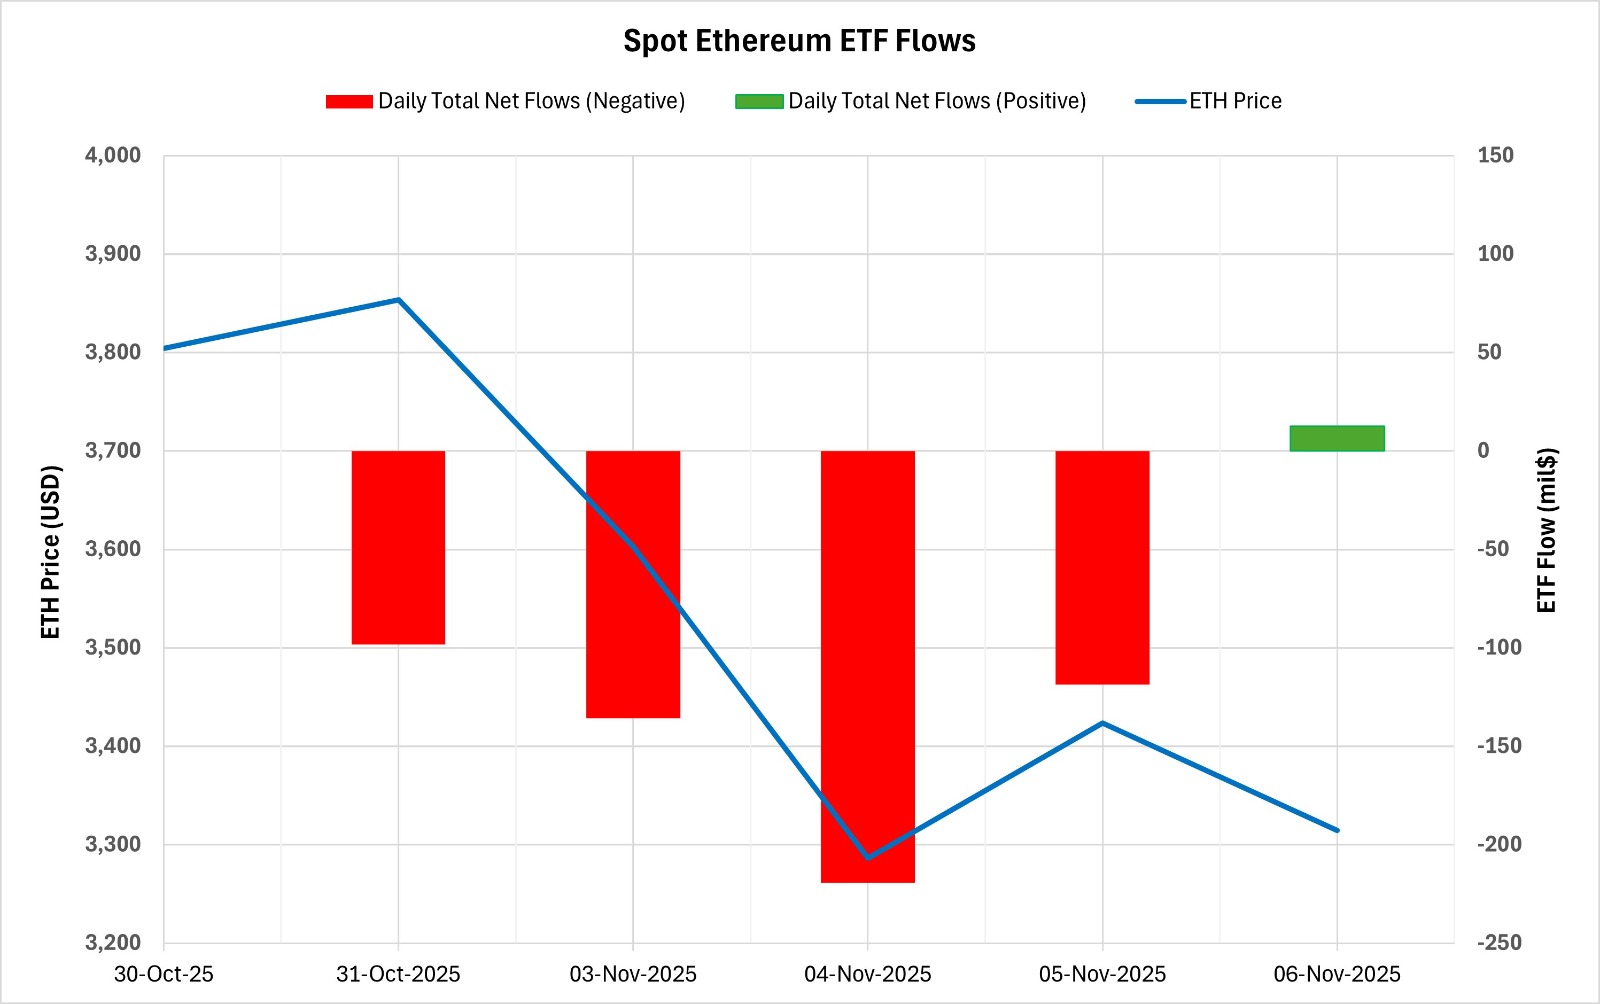
Source: Darkex Research Department
Between October 31 and November 6, 2025, Spot Ethereum ETFs saw a total net outflow of $559.3 million. The six-day series of negative flows ended with a net inflow of $12.5 million into the on November 6. In terms of funds, the largest outflow during this period was seen in BlackRock ETHA, at $370 million. As of the 326th trading day, the cumulative net inflow for Spot Ethereum ETFs has declined to $13.926 billion.
| DATE | COIN | PRICE OPEN | PRICE CLOSE | CHANGE % | ETF Flow (mil$) |
|---|---|---|---|---|---|
| October 31, 2025 | ETH | 3,804 | 3,854 | 1.30% | -98.2 |
| November 3, 2025 | ETH | 3,906 | 3,603 | -7.76% | -135.7 |
| November 4, 2025 | ETH | 3,603 | 3,286 | -8.79% | -219.4 |
| November 5, 2025 | ETH | 3,286 | 3,424 | 4.19% | -118.5 |
| November 6, 2025 | ETH | 3,424 | 3,314 | -3.19% | 12.5 |
| Total for October 31 – November 6, 2025 | -12.87% | -559.3 | |||
The Ethereum price opened at $3,804 on October 31 and closed at $3,314 on November 6. During this period, the ETH price lost 12.87% of its value. The sharp decline in price, coinciding with ETF outflows, signaled a weakening of institutional investors’ risk appetite. The sharp decline in both price and flows, particularly on November 3-4, were key breaking points that increased market pressure. If flows on the Ethereum ETF side turn positive again, the pressure on the price may gradually ease. However, if the current outflow trend continues, it will be difficult for the ETF side to play a supportive role for Ethereum.
Bitcoin Options Distribution
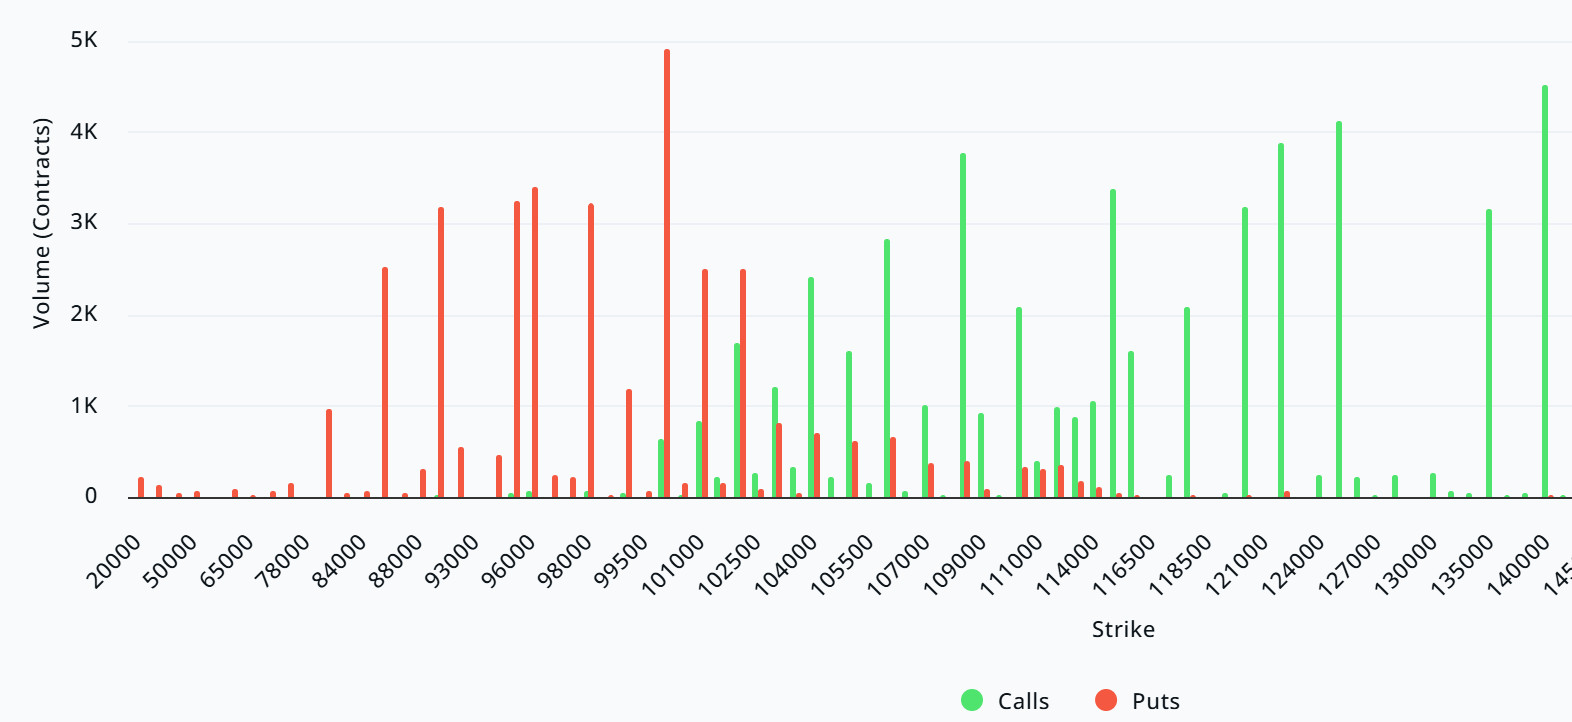
Source: Laevitas
BTC: Notional: $4.53B | Put/Call: 0.83 | Max Pain: $108K
Deribit Data: Deribit data shows that BTC option contracts with a notional value of approximately $4.53 billion expire today. At the same time, looking at the risk transformation over the next week based on the last 24 hours’ data, put options are more dominant than call options in terms of hedging risk. When examining expected volatility (IV), it is below realized volatility (RV). On the other hand, the negative spread metric indicates a decline in market risk appetite and suggests that put options are expensive. Skew values are also pointing downward today and for the coming week.
Laevitas Data: Examining the chart, we see that put options are concentrated in a wide band between $80,000 and $102,000. Call options, on the other hand, are concentrated between $104,000 and $140,000, with concentration decreasing towards the upper levels. At the same time, the $108,000 level appears to be resistance, while the $100,000 level appears to be support. On the other hand, there are 4.91K put options at the $100,000 level, peaking here and showing a decrease in put volume after this level. Furthermore, 4.52K call option contracts peak at the $140,000 level. Looking at the options market, we see that put contracts dominate on a daily and weekly basis.
Option Maturity:
Put/Call Ratio and Maximum Pain Point: Looking at the options in the latest 7-day data from Laevitas, the number of call options increased by approximately 3% compared to last week, reaching 186.79K. In contrast, the number of put options increased by 15% compared to last week, reaching 151.4K. The put/call ratio for options is set at 0.83. This indicates that there is less demand for call options than put options among investors. Bitcoin’s maximum pain point is seen at $108,000. BTC is currently priced at $101,500, and if it fails to break above the pain point of $108,000, a continued decline is foreseeable.
Ethereum Options Distribution
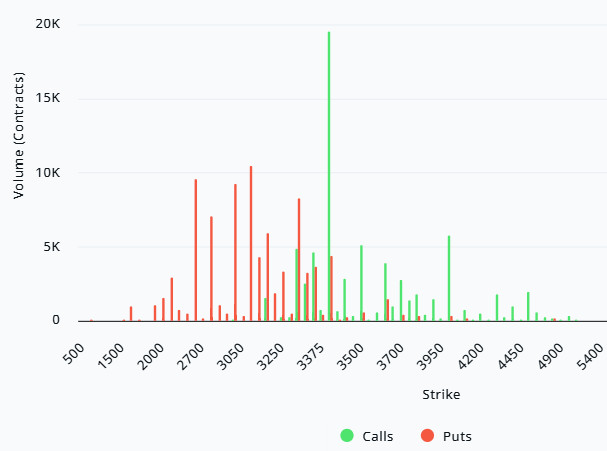
Source: Laevitas
ETH: $0.72 B notional | Put/Call: 0.90 | Max Pain: $3,800
Laevitas Data: Looking at the data in the chart, we see that put options are concentrated in a fairly wide band between the $3,100 and $3,300 price levels. The highest put volume is at the $3,100 level, with approximately 11K contracts. On the other hand, call options show notable concentration between $3,400 and $4,000. The $3,400 level stands out with a high call volume of approximately 20K contracts. This level can be considered an important resistance zone in the market.
Deribit Data: Looking at ATM volatility, we see it at 75.42 and down 7.30% over the last 24 hours. This indicates some short-term easing in option premiums and volatility pricing beginning to calm down compared to previous days. The 25 delta risk reversal (RR) value is at -9.88 and has fallen by 9.88% on a daily basis. This indicates that market demand for put options is still significantly higher than for call options, meaning market players consider short-term downside risks to be significant and are positioning themselves accordingly. Looking at open interest (OI), we see that it stands at $105.66 million and has increased by 45.08%. This increase indicates that the number of market participants and overall trading activity remain strong, and interest continues despite the decline in volatility.
Option Maturity:
Ethereum options with a nominal value of $0.72 billion expired on November 7. The Max Pain level was calculated at $3,800, while the put/call ratio stood at 0.90.
Legal Notice
The investment information, comments, and recommendations contained in this document do not constitute investment advisory services. Investment advisory services are provided by authorized institutions on a personal basis, taking into account the risk and return preferences of individuals. The comments and recommendations contained in this document are of a general nature. These recommendations may not be suitable for your financial situation and risk and return preferences. Therefore, making an investment decision based solely on the information contained in this document may not result in outcomes that align with your expectations.
