
Fear & Greed Index
Source: Alternative.me
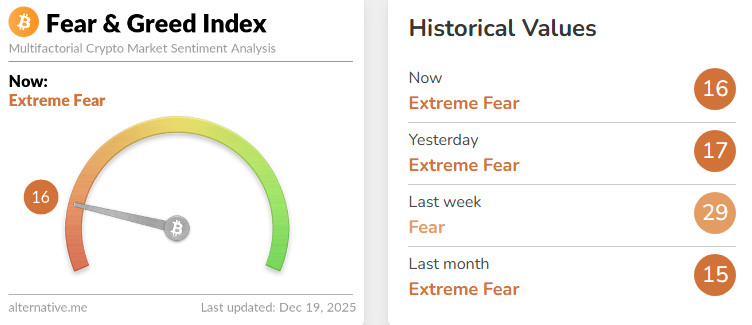
- Change in Fear and Greed Value: -13
- Last Week’s Level: 29
- This Week’s Level: 16
The Fear and Greed Index fell from 29 to 16 this week, signaling a significant deepening of the fear regime. At the beginning of the week, one of the first major triggers that dampened risk appetite was the rapid liquidation of long positions in the leveraged market around the opening of the US session and the total liquidation amount exceeding $132 million in a short period of time. Accompanying this, consecutive strong outflows from the spot Bitcoin ETF in the US, with total outflows reaching $357.6 million in a single day, made risk reduction behavior on the institutional side more visible, increasing pressure on the index. On the US macro front, retail sales remained flat, falling short of expectations, raising questions about consumer momentum, while jobless claims falling to 224,000 showed no sign of a sudden deterioration in the labor market and kept uncertainty about the monetary policy path alive. Furthermore, while nonfarm payrolls increased by 64,000, slightly above expectations, limiting perceptions of a sharp deterioration in the labor market, the rise in the unemployment rate to 4.6% maintained a cautious stance. Towards the end of the week, the November Consumer Price Index coming in below expectations at 2.7% annually provided short-term relief, but warnings about possible measurement distortions due to the government shutdown limited this effect from turning into a lasting risk-on shift. On the crypto side, investors shifting to more cautious positions, combined with increased risk aversion, particularly in segments with high leverage and valuation sensitivity, was decisive in pulling the index down to 16.
Crypto Fund Flows
Source: Coinshares
Overview
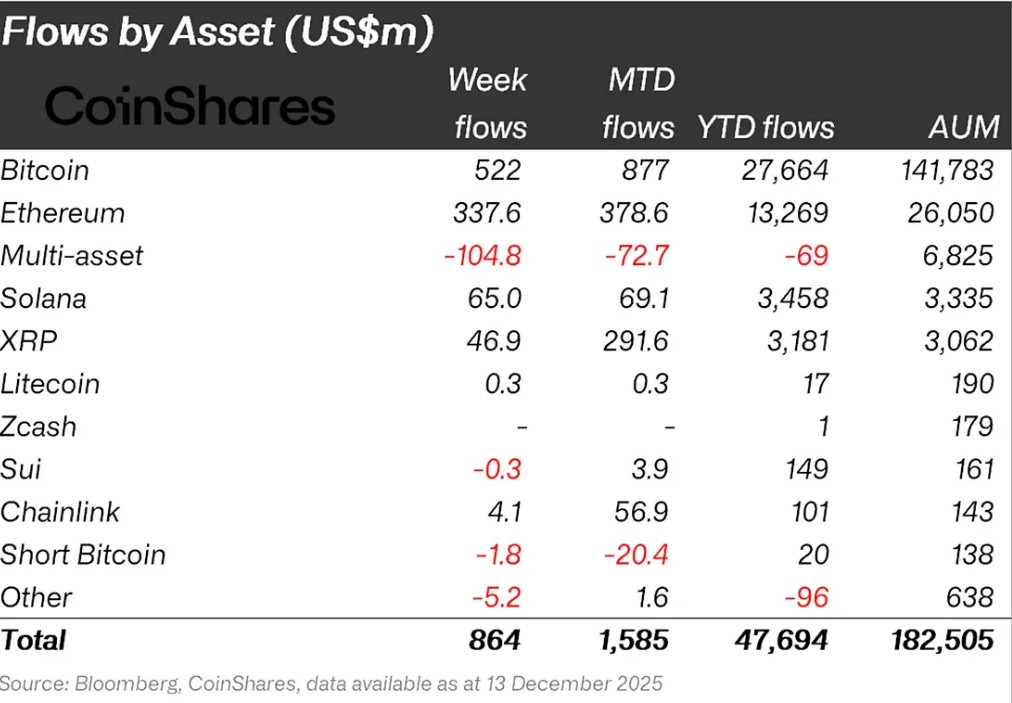
Following the Fed’s 25 basis point interest rate cut, the Bank of Japan announced a 25 basis point interest rate hike. Generally positive statements from Fed and BoJ members kept the market flat, while these developments provided limited support to Bitcoin. As a result, Bitcoin gained approximately 1% in value over the week.
Bitcoin (BTC): Bitcoin continues to see weak inflows from investors this week. Bitcoin-focused funds saw inflows of $522.0 million.
Ethereum (ETH): Along with spot ETH inflows, Ethereum saw $337.6 million in inflows this week.
Solana (SOL): Solana saw inflows of $65.0 million.
Chainlink (LINK): Chainlink saw inflows of $4.1 million.
Litecoin (LTC): Solana saw inflows of $0.3 million.
Ripple (XRP): This week, XRP saw an inflow of $46.9 million.
Fund Outflows:
Short Bitcoin: Short Bitcoin saw an outflow of $1.8 million.
SUI: $0.3 million outflow was observed in SUI.
Other: Sector- and project-based declines in altcoins, along with the general market sentiment, resulted in a $5.2 million outflow in fund flow data.
Multi-asset: Outflows were observed in the multi-asset group.
Total MarketCap
Source: Tradingview
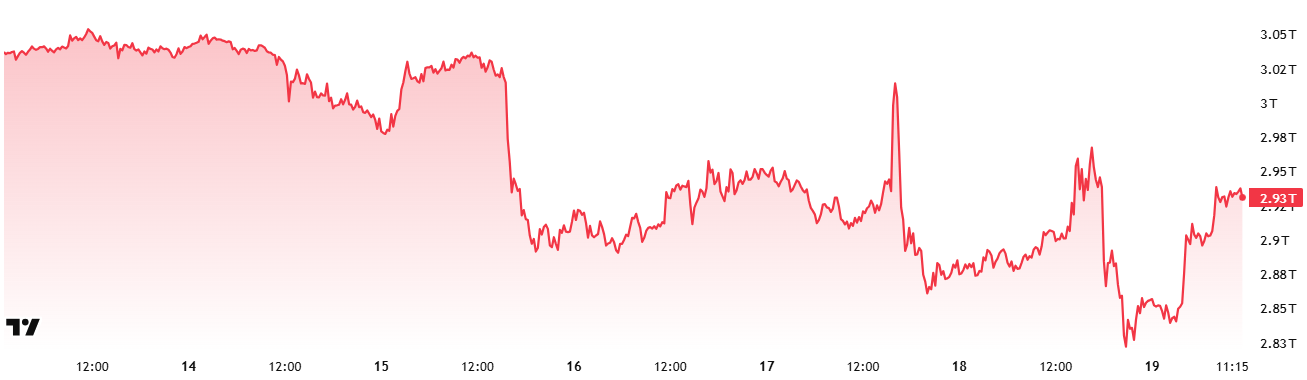
- Last Week’s Market Value: $2.98 Trillion
- This Week’s Market Value:93 Trillion Dollars
This week, the cryptocurrency market recorded a decline of approximately $49 billion, falling 1.65% to a total market value of $2.93 trillion. The week’s high was $3.05 trillion, while the low was $2.82 trillion. Thus, the market was seen to move within a $230 billion band, which translates to 8.18% volatility. Although slightly wider than last week’s 8.06% range, it can be considered within the crypto market’s normal weekly average candle size.
Total 2
Starting the week with a market value of $1.22 trillion, the Total 2 index fell 3.66% during the week, losing approximately $44.635 billion in value and ending the period at around $1.25 trillion. The weekly high was $1.25 trillion, while the low was $1.13 trillion. In other words, the index fluctuated within a range of $119 billion, which corresponds to a volatility of approximately 9.52% for the period.
With this decline, Total 2 is now positioned approximately $600 billion below its all-time high. This means that the required rate of increase to reach its previous peak is approximately 50% from the current level.
Total 3
Total 3 started the week with a total value of $0.851 trillion, shrinking by approximately $30 billion during the week, recording a 3.58% decline and closing the period at $0.820 trillion. Volatility between the week’s highest and lowest values was 8.16%. Thus, Total 3 lost its title as the most stable index, which it had maintained for 5 weeks, to Total.
The index-volatility ranking of Total 2 > Total 3 > Total indicates that volatile price movements intensified first in Ethereum and then in Bitcoin. It also shows that Ethereum’s total market share decreased significantly during this period.
Altcoin Season Index
Source: Coinmarketcap
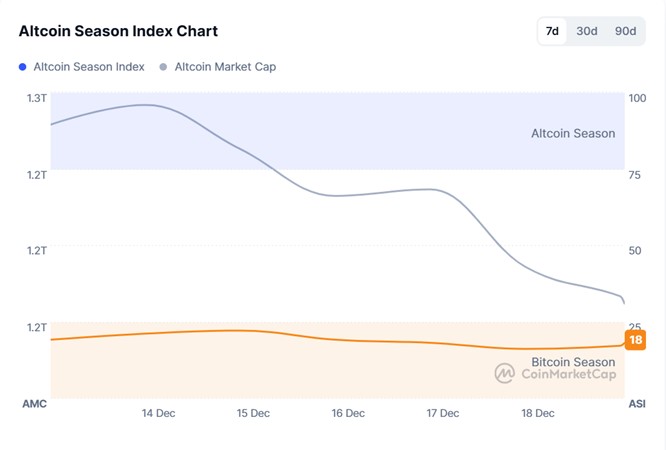
- Last Week’s Index Value: 26/100
- This Week’s Index Value: 18/100
Between December 12 and December 19, 2025, after a slight increase in the correlation between altcoin market dominance (Altcoin Market Cap) and the Altcoin Season Index, a decline occurred again. The graph shows that this week, on December 21 , the index rose to 21, indicating that the Altcoin Market Cap reached 1.27T. The top 5 coins leading the rise when the index rose this week were Beat, Pippin, Zec, Merl, and Dash. On December 14, the index fell from 21 to 18, indicating the potential for a decline in the altcoin season.
Bitcoin Dominance
Source: Tradingview
Weekly Change
- Last Week’s Level:36%
- This Week’s Level:88%
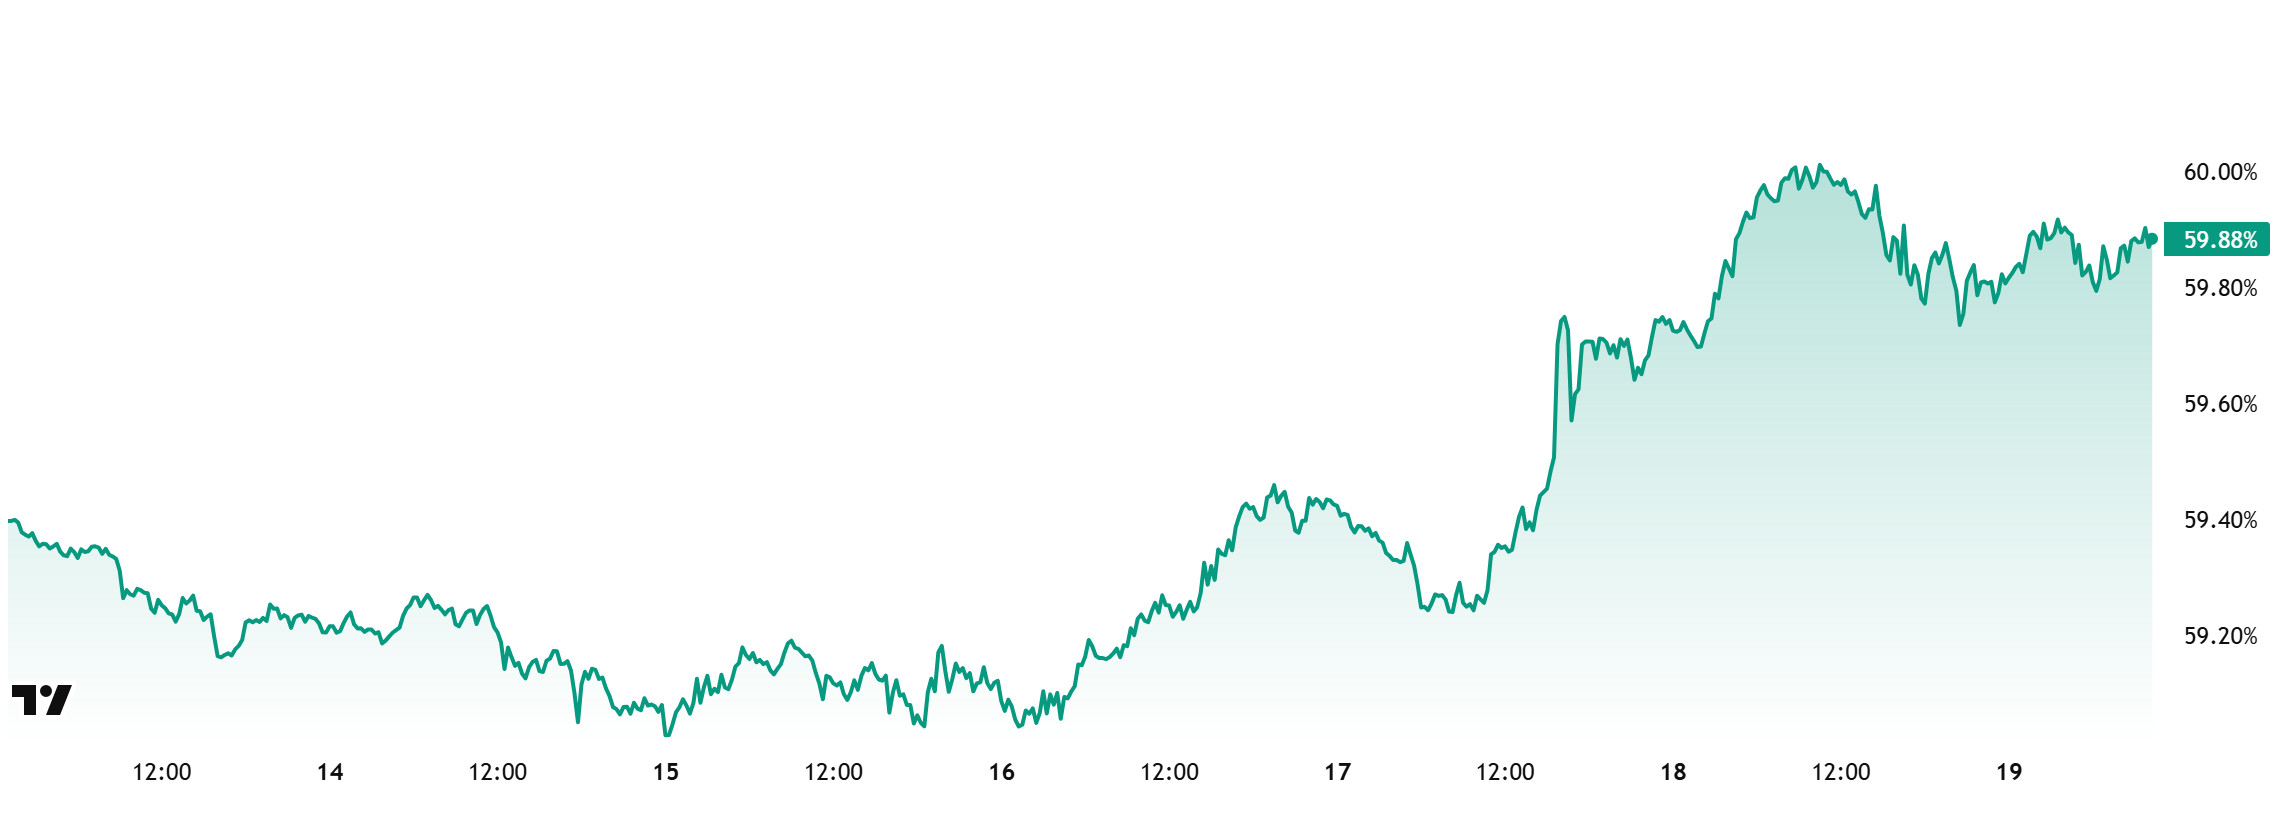
Bitcoin dominance, which started the week at 59.05%, fell to 58.97% during the week but has since risen slightly and is currently at 59.88%.
This week, Strategy purchased 10,645 Bitcoin, ANAP purchased 18.5 Bitcoin, and CIMG purchased 230 Bitcoin. Furthermore, data on Bitcoin spot ETFs shows a net outflow of $338.8 million to date.
Weekly data shows that the limited recovery on the institutional side is mainly driven by Strategy’s purchases, while other institutional companies have yet to show significant buying appetite. Retail investors trading through ETFs ended the week with net outflows, indicating that short-term demand remains weak. Although there has been a partial decrease in uncertainty following the US inflation data and the Bank of Japan meeting, capital inflows into crypto assets remain limited. In this context, demand for Bitcoin remains controlled, while Bitcoin is showing more resilient pricing compared to Ethereum and other major altcoins. As long as the current outlook persists, BTC dominance is expected to remain in the 58%–61% range, even if there is no significant improvement on the demand side.
Bitcoin Spot ETF
Source: Darkex Research Department
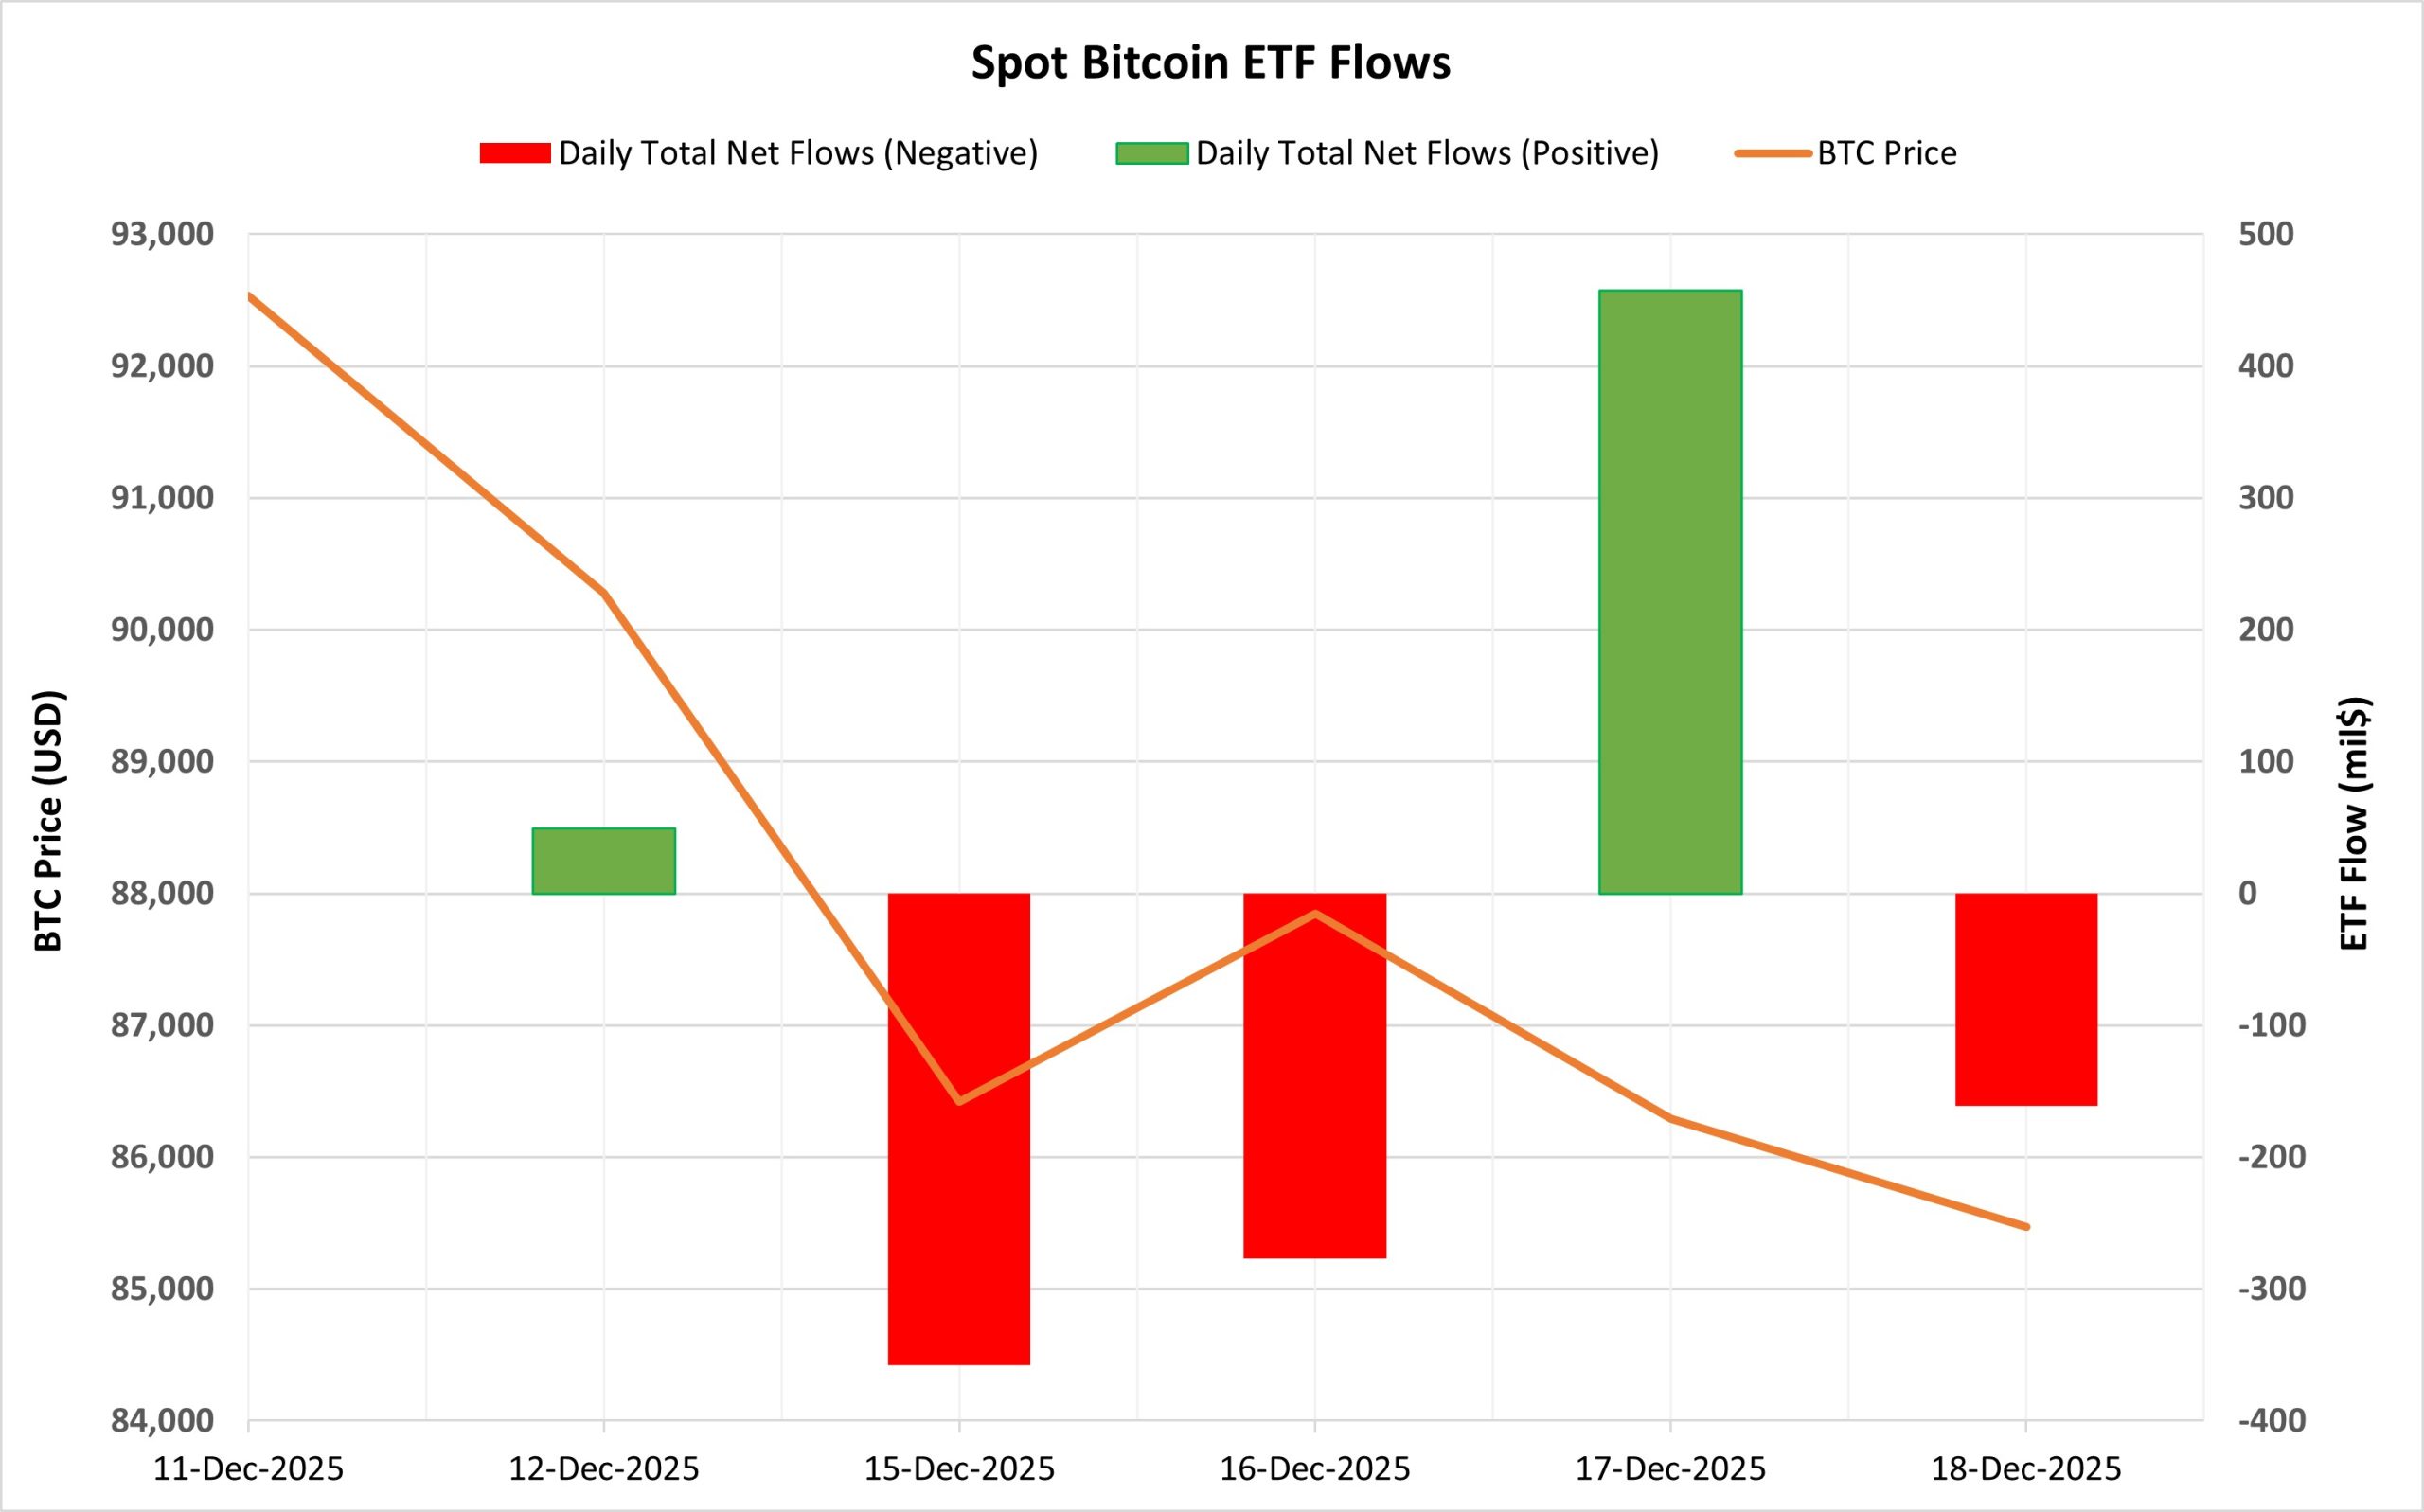
Netflow Status: Between December 12-18, 2025, there was a total net outflow of $289.7 million in Spot Bitcoin ETFs. No positive or negative net flow series formed during this period. Strong outflows observed on December 15 and 16 contributed to the negative trend. While strong inflows on December 17 signaled a short-term recovery, subsequent outflows on the following day limited this effect. Fund-based outflows from Bitwise BITB and Ark ARKB were notable during this period.
Bitcoin Price: Bitcoin opened at $92,533 on December 12 and closed at $85,471 on December 18. During this period, the BTC price lost 7.63% of its value. The simultaneous weakening of the BTC price and ETF flows during this period increased selling pressure.
Cumulative Net Inflow: By the end of the 485th trading day, the cumulative total net inflow of Spot Bitcoin ETFs had declined to $57.547 billion.
| DATE | COIN | Opening Price | Closing Price | Change % | ETF Flow (US$m) |
|---|---|---|---|---|---|
| 12-Dec-2025 | BTC | 92,533 | 90,280 | -2.43% | 49.1 |
| 15-Dec-2025 | BTC | 88,175 | 86,417 | -1.99% | -357.6 |
| December 16, 2025 | BTC | 86,417 | 87,847 | 1.65% | -277.2 |
| December 17, 2025 | BTC | 87,847 | 86,290 | -1.77% | 457.3 |
| December 18, 2025 | BTC | 86,290 | 85,471 | -0.95% | -161.3 |
| Total for Dec 12–18, 2025 | -7.63% | -289.7 |
During this period, Spot Bitcoin ETFs stood out with high volatility and directionlessness. While there was no clear appetite for risk on the institutional side, short-term inflows and outflows failed to create a lasting impact on prices. In the coming days, the re-emergence of steady inflows into ETFs could provide a foundation for balance and recovery in the Bitcoin price. However, if the current choppy and weak flow structure persists, downward pressure and volatility in the BTC price are likely to continue.
Ethereum spot ETF
Source: Darkex Research Department
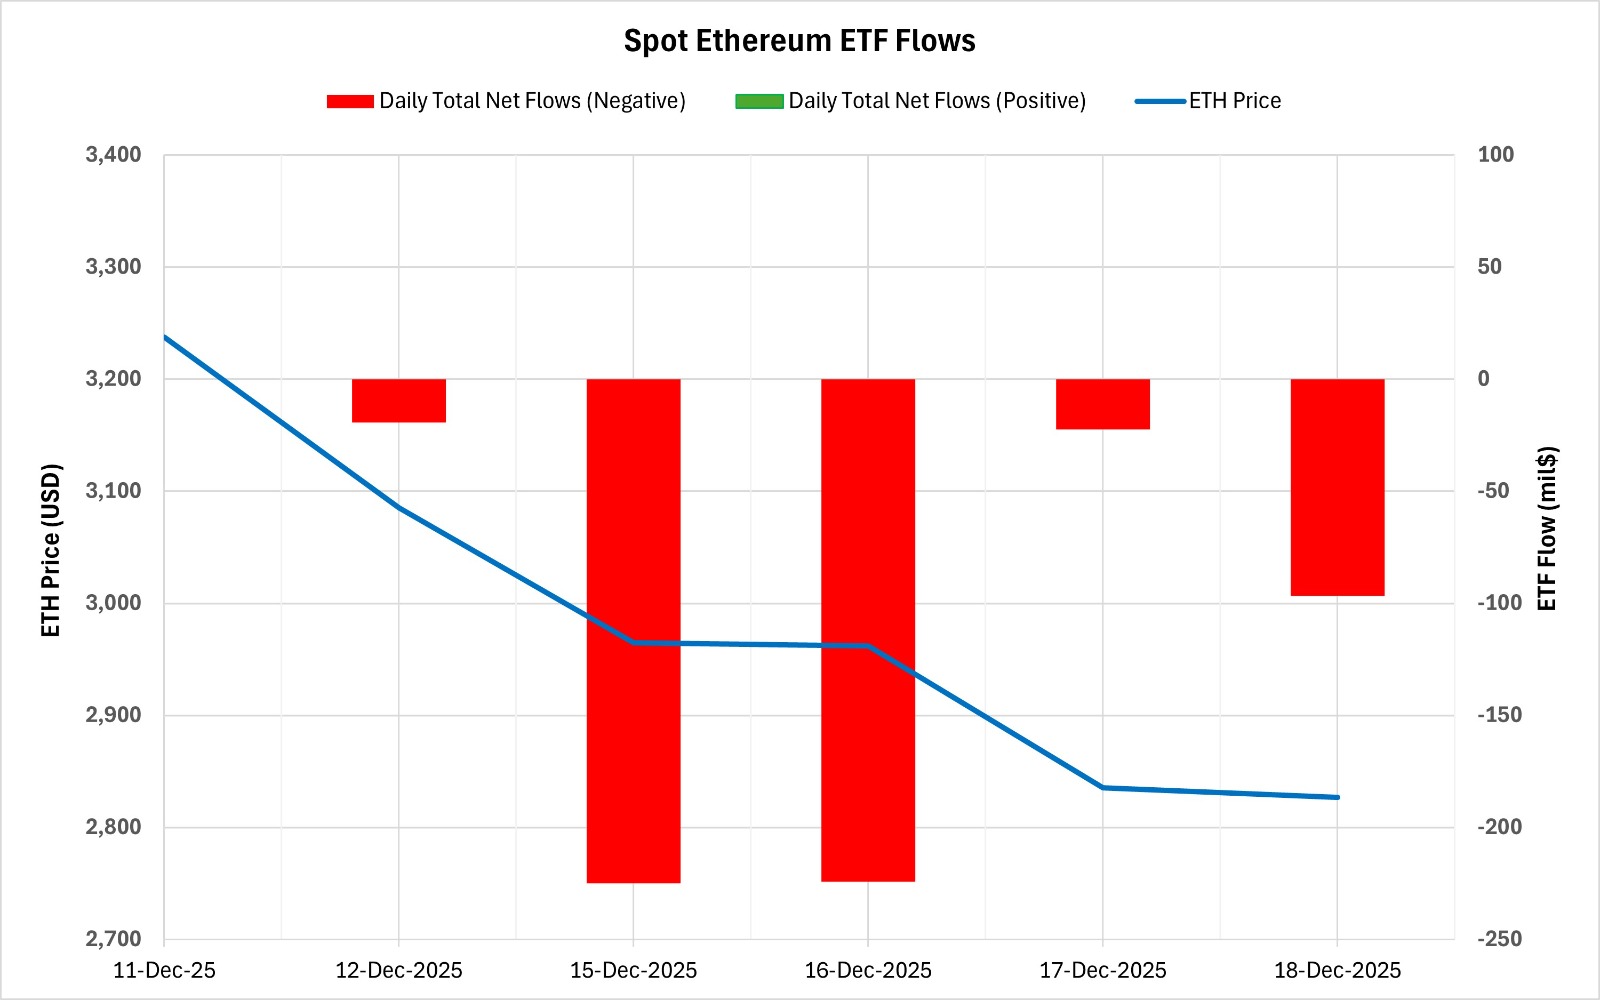
Spot ETH ETFs have seen a negative flow series over the last 5 trading days. A total of $587.4 million in net outflows occurred from spot ETH ETFs during this period. Outflows on December 15 and 16 contributed to the overall negative outlook. Looking at the funds, it appears that the majority of the outflows originated from BlackRock ETHA. As of the 355th trading day, the cumulative total net inflow for spot Ethereum ETFs has declined to $12.54 billion.
| DATE | COIN | Opening Price | Closing Price | Change % | ETF Flow (US$m) |
|---|---|---|---|---|---|
| 12-Dec-2025 | ETH | 3,238 | 3,085 | -4.72% | -19.4 |
| 15-Dec-2025 | ETH | 3,064 | 2,965 | -3.23% | -224.8 |
| December 16, 2025 | ETH | 2,965 | 2,962 | -0.09% | -224.2 |
| 17-Dec-2025 | ETH | 2,962 | 2,835 | -4.27% | -22.4 |
| 18-Dec-2025 | ETH | 2,835 | 2,827 | -0.30% | -96.6 |
| Total for Dec 12–18, 2025 | -12.69% | -587.4 |
Ethereum opened at $3,238 on December 12 and closed at $2,827 on December 18. During this period, the ETH price lost 12.69% of its value. The sharp pullback in price, largely coinciding with ETF outflows, clearly shows a risk-averse trend on the institutional side. The simultaneous pressure on the ETH price and ETF flows strengthened the downward momentum. The impact of ETF flows on the price increased the negativity. In the coming days, if outflows from ETFs slow down or inflows resume, a short-term stabilization in the Ethereum price may be seen. However, if the current negative flow trend continues, the selling pressure on ETH is likely to persist.
Bitcoin Options Distribution

Source: Laevitas
BTC: Notional: $2.72B | Put/Call: 0.81 | Max Pain: $88K
Deribit Data: Deribit data shows that BTC option contracts with a nominal value of approximately $2.72 billion expire today. At the same time, looking at the risk transformation over the next week based on data from the last 24 hours, put options are dominating over call options in terms of risk hedging. However, an increase in call options is seen in the coming days. Today, call options are in high demand. When examining the implied volatility (IV), it is below the realized volatility (RV). On the other hand, the negative spread metric indicates low risk appetite in the market and suggests that put options are expensive. Skew values are pointing downward today and for the coming week.
Laevitas Data: Examining the chart, we see that put options are concentrated in a wide band between $70,000 and $86,000. Call options, on the other hand, are spread across a wide base between $86,000 and $100,000. At the same time, the $90,000 level appears to be resistance, while the $85,000 level appears to be support. On the other hand, there are 4.57K put options at the $85,000 level, peaking here and showing a decrease in put volume after this level. Furthermore, 3.92K call option contracts peak at the $90,000 level. Looking at the options market, we see that put contracts are slightly dominant on a daily and weekly basis.
Option Maturity:
Put/Call Ratio and Maximum Pain Point: Looking at the options in the latest 7-day data from Laevitas, the number of call options increased by approximately 4% compared to last week, reaching 100.56K. In contrast, the number of put options decreased by 4% compared to last week, reaching 90.25K. The put/call ratio for options is set at 0.81. This indicates that there is more demand for call options than put options among investors. Bitcoin’s maximum pain point is seen at $88,000. BTC is currently priced at $87,500, and if it fails to break above the pain point of $88,000, further declines can be anticipated.
Ethereum Options Distribution
Source: Laevitas
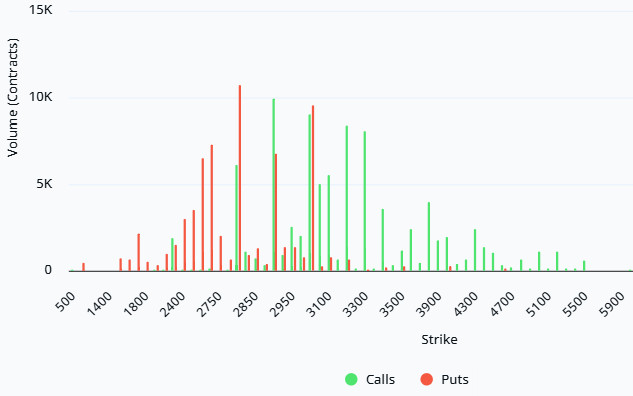
ETH: $0.46 B notional | Put/Call: 1.08 | Max Pain: $3,100
Laevitas Data: Looking at the data in the chart, we see that put options are concentrated in a fairly wide band, particularly at price levels between $2,800 and $3,000. The highest put volume is at the $2,800 level, with approximately 11K contracts. On the other hand, in call options, there is a noticeable concentration between the $2,900 and $3,300 levels. The highest call volume appears to be approximately 10K at the $2,900 level.
Deribit Data: Volatility remains high in the market, but the fact that the risk reversal is in a relatively mild negative zone suggests that market participants have very low expectations of a sharp decline. Volatility expectations are not concentrated in one direction but are spread across both directions. Although call and put volumes are increasing, this increase does not distort the skew, so we can interpret most of the put-side transactions as closing or adjusting existing positions rather than anticipating a new decline. We can say that option players currently see an upward breakout as much more likely than a downward breakout, despite the high volatility.
Option Maturity:
Ethereum options with a nominal value of $0.49 billion expired on December 19. The Max Pain level was calculated at $3,100, while the put/call ratio stood at 1.08.
Legal Notice
The investment information, comments, and recommendations contained in this document do not constitute investment advisory services. Investment advisory services are provided by authorized institutions on a personal basis, taking into account the risk and return preferences of individuals. The comments and recommendations contained in this document are of a general nature. These recommendations may not be suitable for your financial situation and risk and return preferences. Therefore, making an investment decision based solely on the information contained in this document may not result in outcomes that align with your expectations.
