
Weekly Fundamental Analysis Report
Fear & Greed Index
Source: Alternative.me
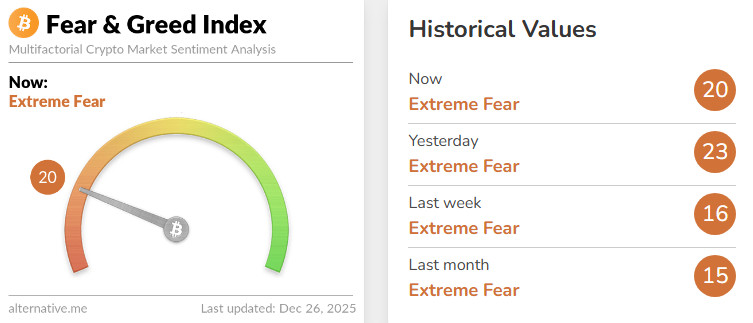
Change in Fear and Greed Value: +4
Last Week’s Level: 16
This Week’s Level: 20
The Fear and Greed Index rose from 16 to 20 this week, signaling a limited recovery within an extreme fear regime. Risk reduction behavior on the institutional side did not completely disappear throughout the week; while there was a net outflow of approximately $188.6 million from spot Bitcoin ETFs before the Christmas holiday, the cumulative outflow over the last week reaching $497.1 million continued to be the main source of pressure on the index. However, the fact that a significant portion of these outflows was linked to calendar effects such as year-end balance sheet adjustments and liquidity tightening limited a return to panic mode in the market and created a small upward breathing space in the index. On the US macro front, while growth remaining strong at an annualized rate of 4.3% provided short-term support for risky assets, consumer confidence falling to 89.1 maintained a cautious tone. Jobless claims remained low at 214,000, while continuing claims rising to 1.923 million kept signs of friction in the labor market alive. On the crypto side, the price being stuck in the $87,000 to $90,000 range increased liquidity sensitivity. An isolated “flash wick” type movement seen on Binance in the BTC USD1 pair, reaching $24,111, brought market structure risks back to the forefront, preventing the recovery in risk appetite from turning into a permanent regime change.
Crypto Fund Flows
Source: Coinshares
Overview:
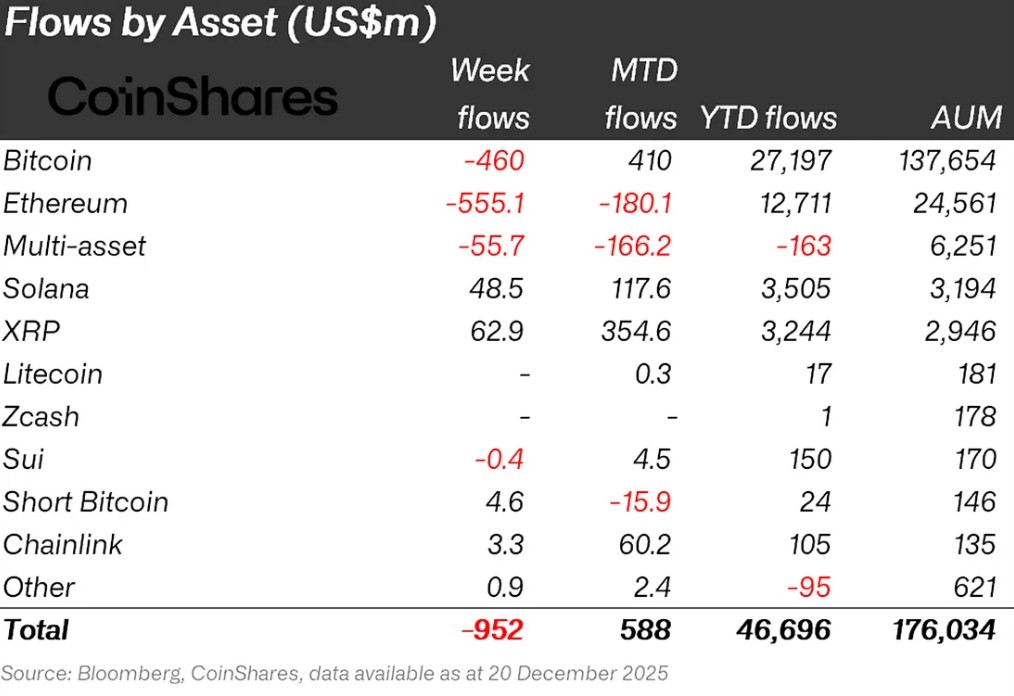
Following the Fed’s 25 basis point interest rate cut, the Bank of Japan announced a 25 basis point interest rate hike. Generally positive statements from Fed and BoJ members kept the market flat this week. As a result, Bitcoin gained approximately 2% in value over the week.
- Solana (SOL): Solana saw an inflow of $48.5 million.
- Chainlink (LINK): Chainlink saw an inflow of $3.3 million.
- Litecoin (LTC): $0.3 million inflow was observed in LTC.
- Ripple (XRP): XRP saw $62.9 million in fund inflows this week.
- Short Bitcoin: Short Bitcoin saw an inflow of $4.6 million.
- Other: Sector-specific and project-based declines in altcoins, along with the overall market sentiment, brought about a $0.9 million inflow in fund flow data.
Fund Outflows:
- Bitcoin (BTC): Bitcoin continues to experience outflows and losses from investors this week. Bitcoin-focused funds saw an outflow of $460.0 million.
- Ethereum (ETH): Alongside spot ETH inflows, there was a $555.1 million outflow from Ethereum this week.
- SUI: Sui saw an outflow of $0.4 million.
- Multi-asset: Outflows were observed in the multi-asset group.
Total MarketCap
Source: Tradingview
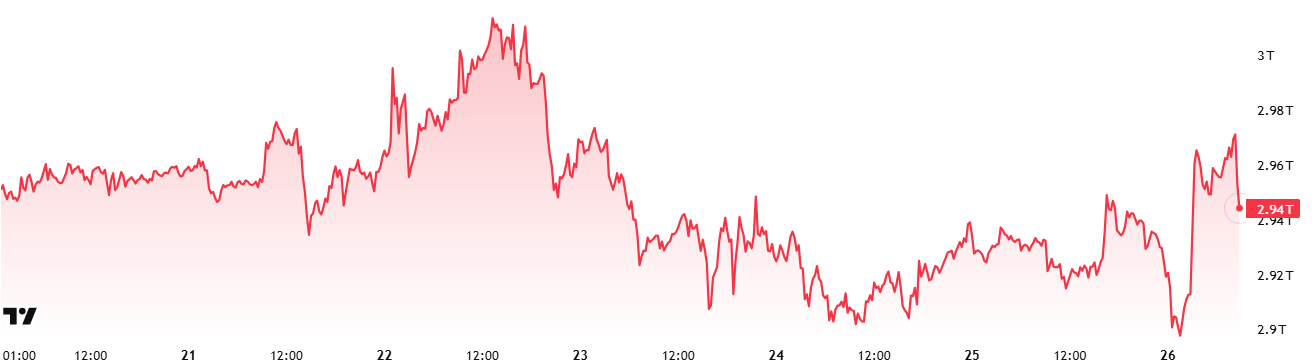
- Last Week’s Market Value: $2.97 Trillion
- This Week’s Market Value:94 trillion Dollars
This week, the cryptocurrency market recorded a decline of approximately $24 billion, falling 0.83% and bringing the total market value down to $2.94 trillion. The week’s high was $3.03 trillion, while the low was $2.89 trillion. Thus, the market was seen to move within a band of 141 billion dollars, which translates to a volatility of 4.89%. Although slightly narrower than last week’s range of 8.18%, it can be considered within the weekly average candle size scale of the cryptocurrency market.
Total 2
Starting the week with a market value of $1.73 trillion, the Total 2 index fell 1.48% during the week, losing approximately $17 billion in value and ending the period at around $1.18 trillion. The weekly high was $1.22 trillion, while the low was $1.16 trillion. In other words, the index fluctuated within a range of $61 billion, which corresponds to a volatility of approximately 5.26% for the period.
With this decline, Total 2 is now positioned approximately $600 billion below its all-time high. This means that the required rate of increase to reach its previous peak is approximately 50% from the current level.
Total 3
Total 3 started the week with a total value of $0.836 trillion, shrinking by approximately $14 billion during the week, recording a 1.67% decline and closing the period at $0.822 trillion. The volatility between the week’s highest and lowest values was 4.77%. Thus, Total 3 successfully maintained its title as the most stable index this week.
The index-volatility ranking of Total 2 > Total > Total 3 shows that volatile price movements were concentrated first in Ethereum and then in Bitcoin. It also shows that there was a significant decrease in Ethereum’s total market share during this period.
Altcoin Season Index
Source: Coinmarketcap
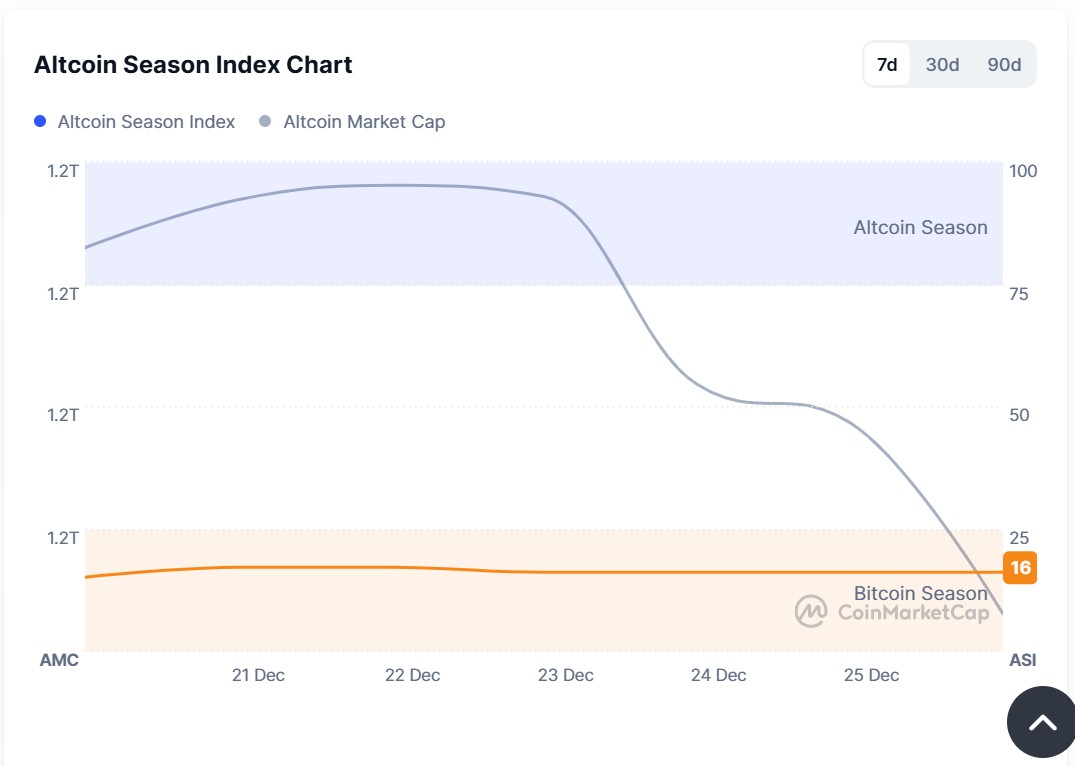
- Last Week’s Index Value: 18/100
- This Week’s Index Value: 16/100
Between December 19 and December 25, 2025, after a slight increase in the correlation between altcoin market dominance (Altcoin Market Cap) and the Altcoin Season Index, a decline occurred again. The graph shows that this week, on December 22 , the index rose to 17, indicating that Altcoin Market Cap reached 1.27T. When the index rose this week, the top 5 coins leading the rise were ZEC, Pippin, H, Dash, and XMR. The Altcoin Index indicates the potential for a decline in the altcoin season this week.
Bitcoin Dominance
Source: Tradingview
Weekly Change
- Last Week’s Level:88%
- This Week’s Level:98%
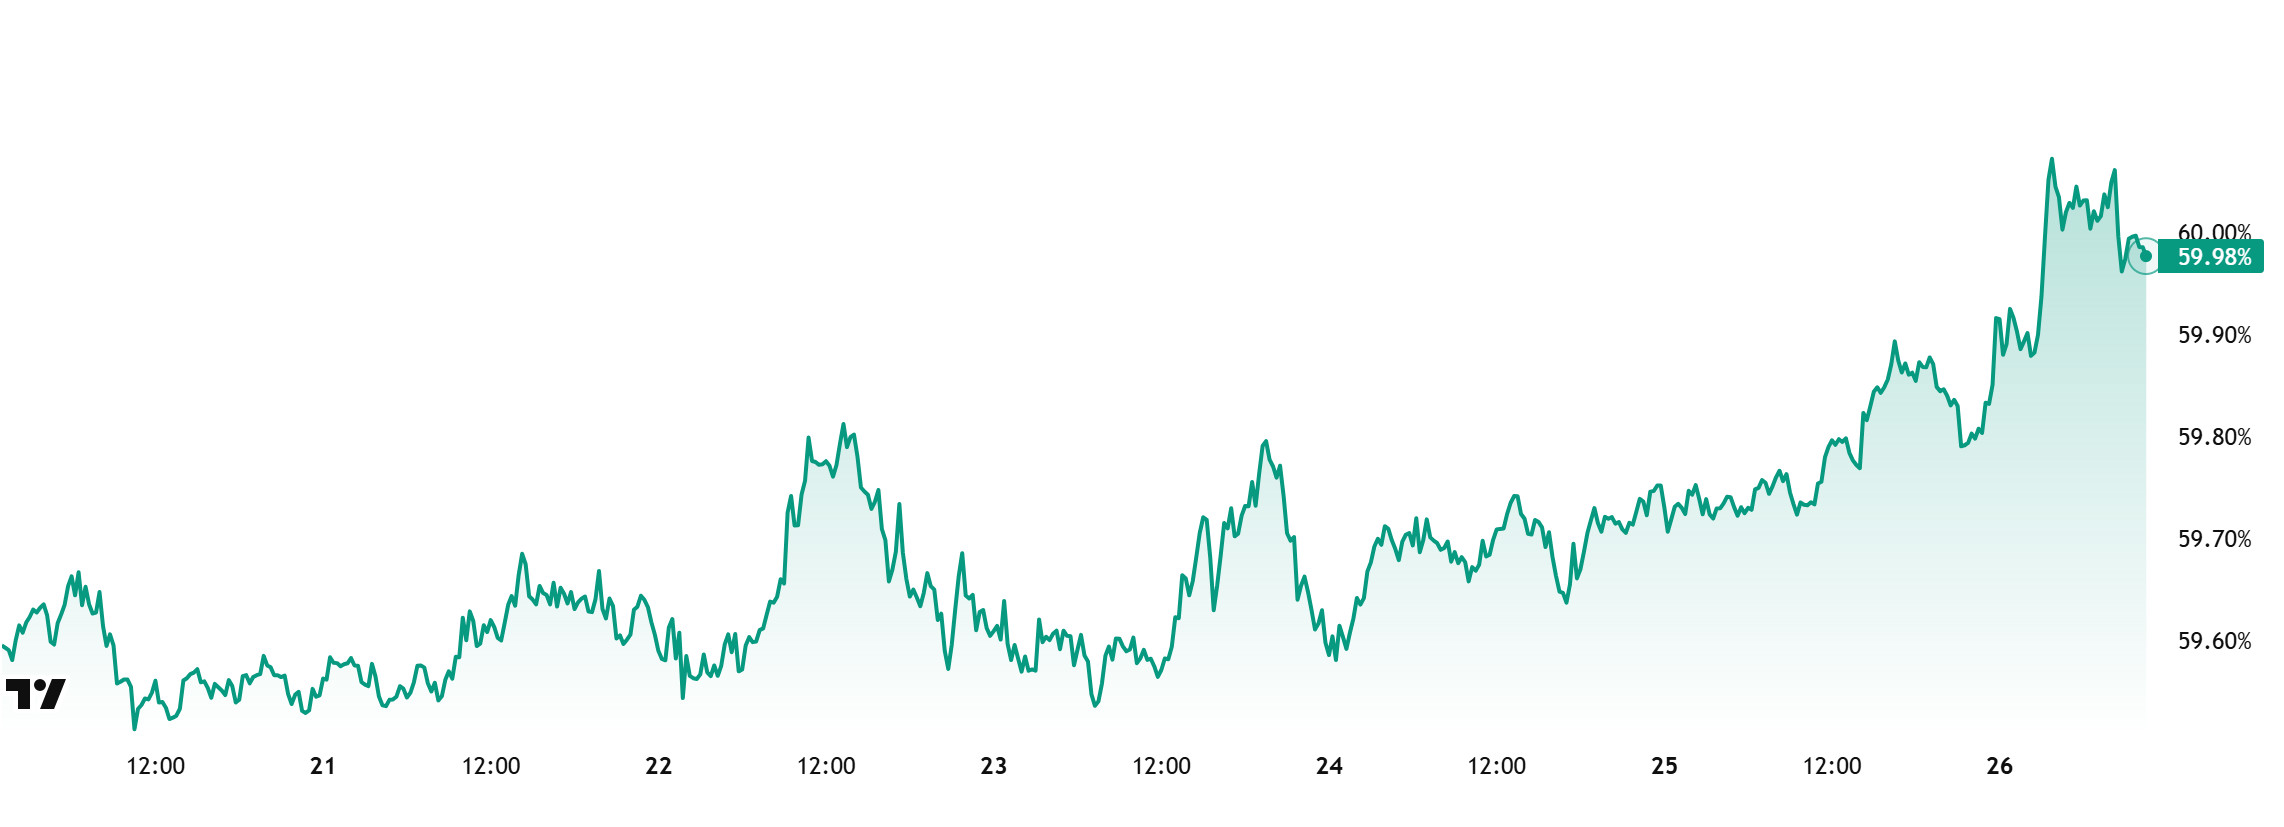
Bitcoin dominance started the week at 59.61%, fell to 59.56% during the week, but then rose and is currently at 59.98%.
This week, Hyperscale Data purchased 15 Bitcoins and ANAP purchased 109 Bitcoins. Furthermore, data on Bitcoin spot ETFs shows a total net outflow of $506.1 million to date.
Weekly data points to a general weakening on the institutional buying side, with Strategy not making any new Bitcoin purchases this week. The limited institutional recovery seen in previous weeks has been replaced by a more cautious stance among companies. On the retail investor side trading through ETFs, the increase in net outflows compared to last week indicates a further weakening of short-term demand. This outlook suggests that demand from both institutional and retail investors will continue to be weak in the short term. The decline in trading volumes as markets enter the pre-holiday period is limiting capital inflows into crypto assets. In this context, demand for Bitcoin appears to be following a controlled path, although Bitcoin is still showing stronger pricing performance compared to Ethereum and other major altcoins. If the current low-volume market conditions persist, BTC dominance is expected to remain flat in the 59%–61% range.
Ethereum Dominance
Source: Tradingview
Weekly Change:
- Last Week’s Level: 12.20%
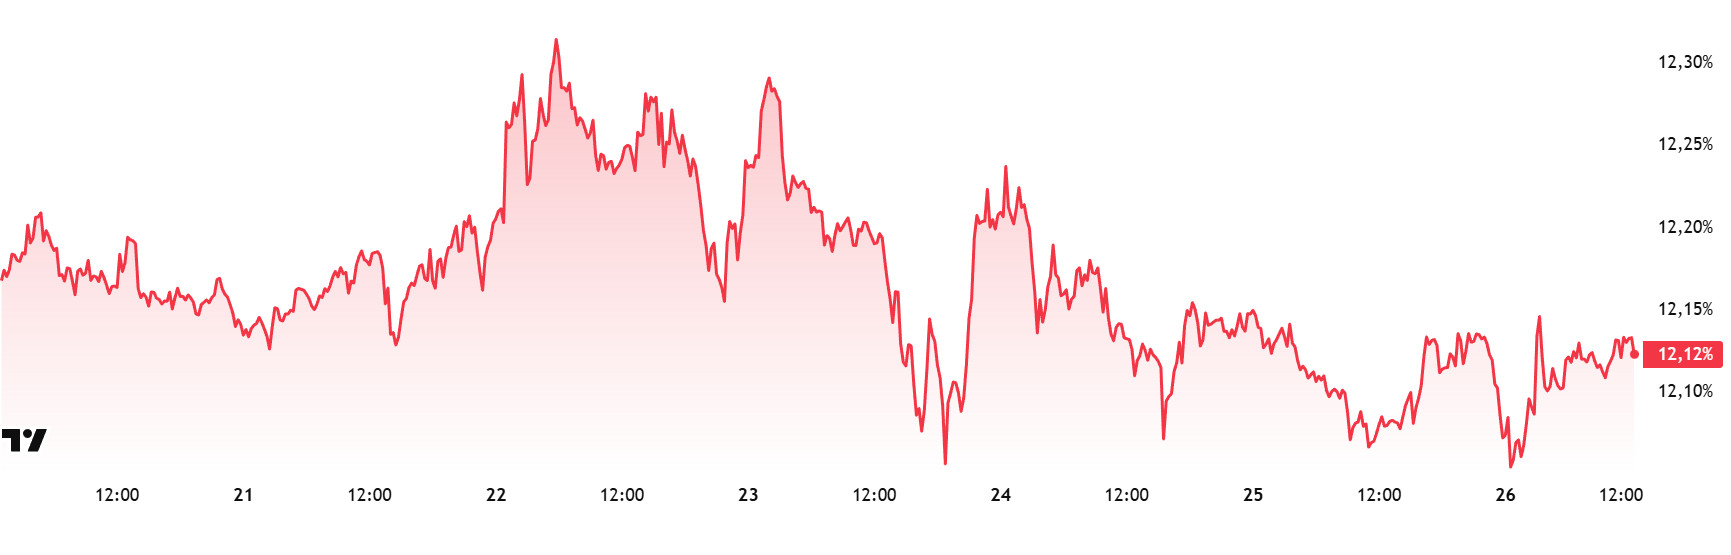
- This Week’s Level: 1 2.12%
Ethereum dominance, which rose to 15% levels in mid-August, lost momentum in the following period and entered a downward trend. Although this negative outlook was partially offset by a limited positive correction until the first week of December, it has reversed direction again in the last two weeks and recorded a pullback.
In this context, Ethereum dominance ended last week at 12.20% and is currently trading at around 12.12%. In contrast to Ethereum dominance, Bitcoin dominance has followed a positive trajectory during the same period.
The key developments affecting Ethereum dominance are as follows:
The Ethereum network is expected to undergo two major hard forks in 2026. The Glamsterdam fork, planned for the middle of the year, and the Heze–Bogota fork, expected to be implemented at the end of the year, contain important updates regarding the network’s scalability and efficiency. The Glamsterdam fork aims to introduce innovations such as Block Access Lists, which will enable parallel processing. This is intended to increase network efficiency without significantly increasing hardware requirements. Raising the gas limit to 200 million is also on the agenda.
Meanwhile, Ethereum treasury company SharpLink announced last week that it earned 460 ETH through staking rewards. The total amount of rewards earned since the company launched its staking strategy has reached 9,701 ETH. This development highlights SharpLink’s long-term and strategic approach to Ethereum, while indicating that staking revenues contribute to the company’s regular cash flow. In this context, interest in ETH staking at the corporate level is observed to be increasing.
Bitcoin Spot ETF
Source: Darkex Research Department
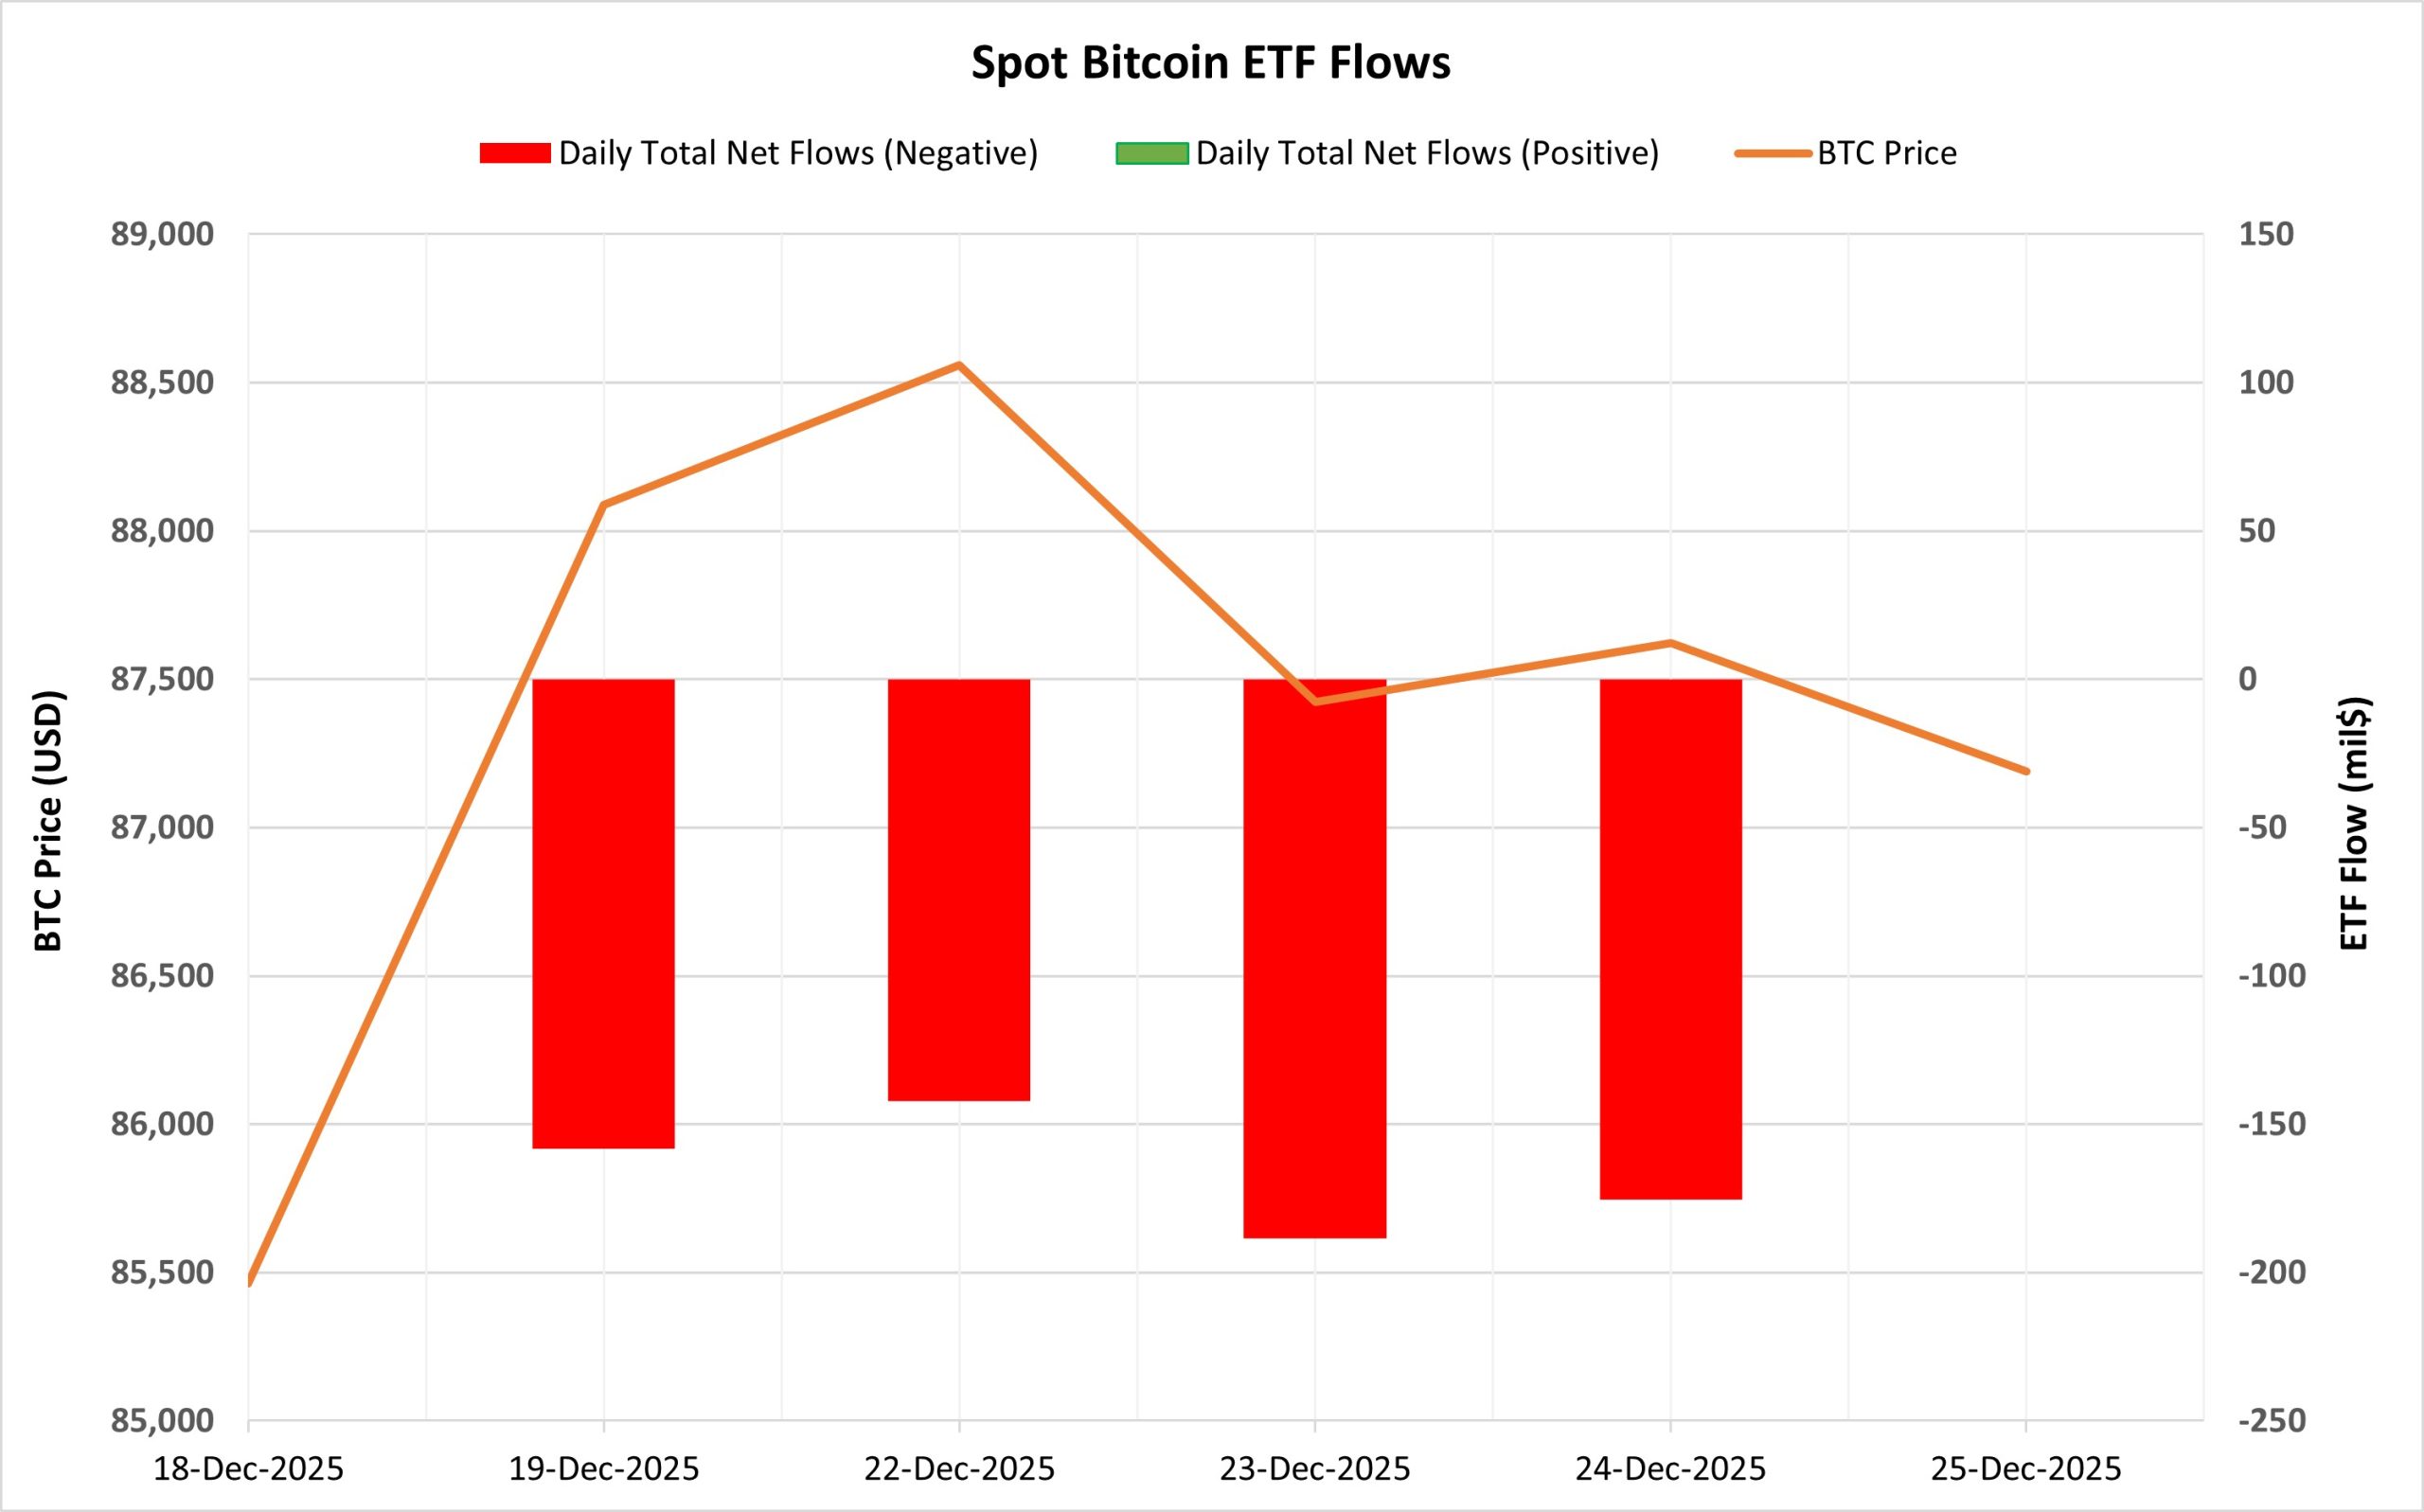
Netflow Status: Between December 19-25, 2025, a total of $664.4 million in net outflows occurred from Spot Bitcoin ETFs. Negative net flows were observed in all of the last five trading days. During the period when the negative net flow series formed, a total of over $800 million in net outflows occurred. In terms of funds, BlackRock IBIT stood out with a net outflow of $416.3 million and was at the forefront of this negative process.
Bitcoin Price: Bitcoin opened at $85,462 on December 19 and closed at $87,189 on December 25. During this period, the BTC price rose by 2.02%. Despite a limited recovery in the BTC price, the continued outflows from ETFs indicated that the rise was largely driven by the spot market.
Cumulative Net Inflow: At the end of the 489th trading day, the cumulative total net inflow of Spot Bitcoin ETFs fell to $56.882 billion.
| DATE | COIN | Opening Price | Closing Price | Change % | ETF Flow (mil$) |
|---|---|---|---|---|---|
| 19-Dec-2025 | BTC | 85,462 | 88,089 | +3.07% | -158.3 |
| December 22, 2025 | BTC | 88,632 | 88,559 | -0.08% | -142.2 |
| December 23, 2025 | BTC | 88,559 | 87,423 | -1.28% | -188.6 |
| December 24, 2025 | BTC | 87,423 | 87,623 | +0.23% | -175.3 |
| December 25, 2025 | BTC | 87,623 | 87,189 | -0.50% | 0 |
| Total for Dec 19–25, 2025 | +2.02% | -664.4 |
During this period, steady outflows from ETFs did not support price movements. Institutional investors continued their risk reduction trend as the year-end approached and kept reducing their ETF positions. This divergence between price and flows raised questions about the sustainability of the rally. In the coming period, if outflows from ETFs slow down or inflows resume, a healthier balance could emerge for the Bitcoin price. Otherwise, continued selling pressure from ETFs could limit upward attempts on the price side.
Ethereum spot ETF
Source: Darkex Research Department
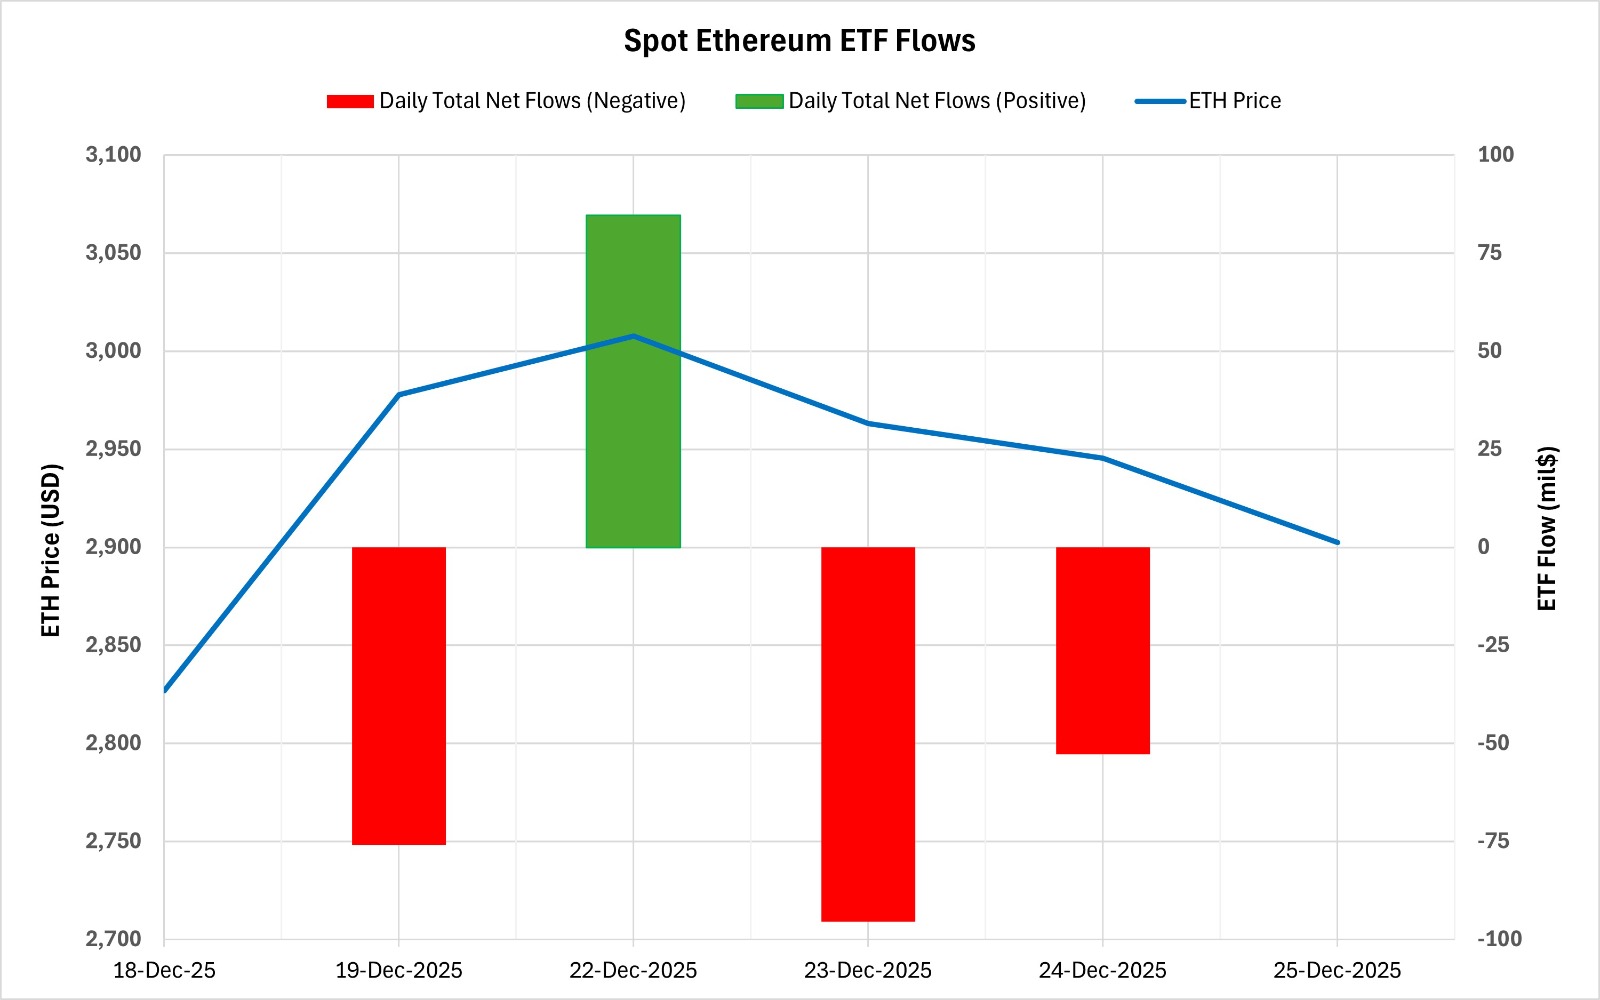
Between December 19-25, 2025, Spot Ethereum ETFs saw a total net outflow of $139.6 million. While ETF flows showed a volatile pattern, the 7-day series of negative net flows ended on December 22 with a net inflow of $84.6 million. Looking at the funds, most of the outflows during this period occurred on the BlackRock ETHA side, while the positive flow on December 22 occurred on the Grayscale side. The cumulative total net inflow of Spot Ethereum ETFs declined to $12.40 billion as of the 359th trading day.
| DATE | COIN | Opening Price | Closing Price | Change % | ETF Flow (mil$) |
|---|---|---|---|---|---|
| December 19, 2025 | ETH | 2,827 | 2,978 | +5.35% | -75.9 |
| December 22, 2025 | ETH | 3,001 | 3,008 | +0.22% | 84.6 |
| December 23, 2025 | ETH | 3,008 | 2,963 | -1.48% | -95.5 |
| December 24, 2025 | ETH | 2,963 | 2,945 | -0.59% | -52.8 |
| December 25, 2025 | ETH | 2,945 | 2,902 | -1.46% | 0 |
| Total for December 19–25, 2025 | +2.67% | -139.6 |
Ethereum opened at $2,827 on December 19 and closed at $2,902 on December 25. During this period, the ETH price rose by 2.67%. In particular, the strong 5.35% increase seen on December 19, despite negative flows on the ETF side, showed that the price reacted in the short term. The net inflow on December 22 signaled a short-term stabilization on the institutional side, but the lack of follow-through revealed that market confidence remains fragile. If stable inflows continue on the ETF side in the coming days, Ethereum prices may see upward attempts. Conversely, if outflows continue, selling pressure on ETH may increase.
Bitcoin Options Distribution
Source: Laevitas
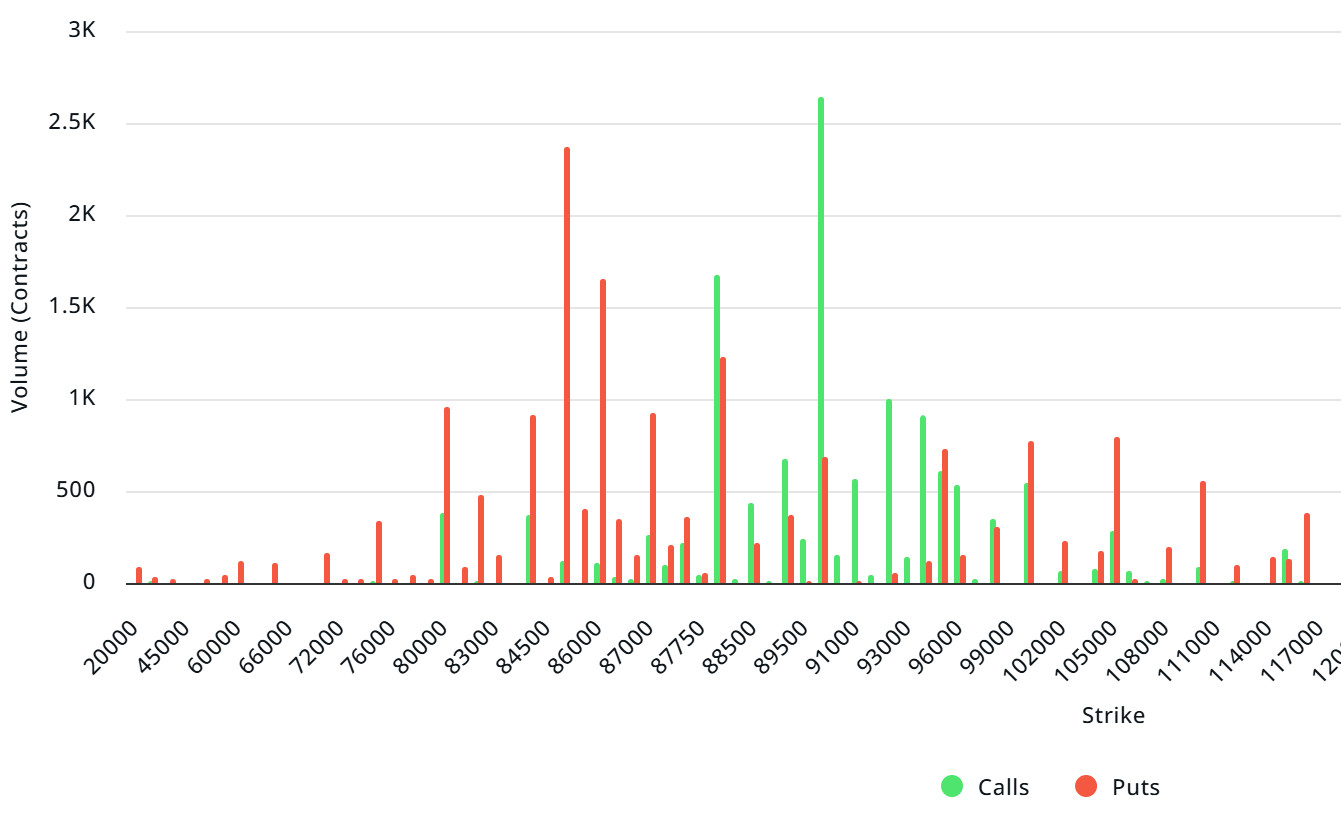
BTC: Notional: $23.40B | Put/Call: 0.36 | Max Pain: $96K
Deribit Data: Deribit data shows that BTC option contracts with a notional value of approximately $23.40 billion expire today. At the same time, looking at the risk transformation over the next week based on the last 24 hours’ data, put options are more dominant than call options in terms of hedging. However, an increase in call options is seen in the coming days. When examining expected volatility (IV), it is above realized volatility (RV). On the other hand, the positive spread metric indicates increased risk appetite in the market and shows that call options are expensive. Skew values are rising today but are expected to decline next week.
Laevitas Data: Examining the chart, we see that put options are concentrated in a wide band between $80,000 and $105,000. Call options, on the other hand, are spread across a wide base between $88,000 and $96,000. At the same time, the $90,000 level appears to be resistance, while the $85,000 level appears to be support. On the other hand, there are 2.37K put options at the $85,000 level, peaking here and showing a decrease in put volume after this level. Furthermore, 2.64K call option contracts peak at the $90,000 level. Looking at the options market, we see that put contracts are slightly dominant on a daily and weekly basis.
Option Maturity:
Call/Put Ratio and Maximum Pain Point: Looking at options in the latest 7-day data from Laevitas, the number of call options decreased by approximately 45% compared to last week, reaching 55.82K. In contrast, the number of put options decreased by 42% compared to last week, reaching 52.65K. The put/call ratio for options is set at 0.36. This indicates that there is more demand for call options than put options among investors. Bitcoin’s maximum pain point is seen at $96,000. BTC is currently priced at $89,000, and if it fails to break above the pain point of $96,000, further declines can be anticipated.
Ethereum Options Distribution
Source: Laevitas
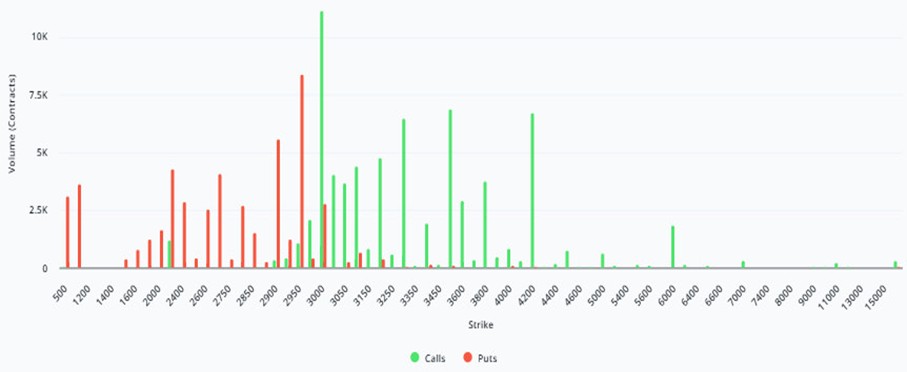
ETH: $3.7 B notional | Put/Call: 0.45 | Max Pain: $3,100
Laevitas Data: Looking at the data in the chart, we see that put options are concentrated in a fairly wide band, particularly between the $2,800 and $2,950 price levels. The highest put volume is at the $2,950 level, with approximately 9K contracts. On the other hand, in call options, there is a noticeable concentration at the $3,000 to $3,300 levels. The highest call volume appears to be approximately 10K at the $3,000 level.
Deribit Data: We can say that volatility is still high in the market. We saw this during the day when prices fell sharply before the Asian markets opened, followed by sharp upward moves after the Asian markets opened. The fact that ATM volatility is currently at around 45 levels, , indicates that the potential for sharp price movements is still high. However, looking at the risk reversal and skew, we see that there is no dominant downward stress. When we evaluate the increase in both call and put volumes together, it indicates that this volume in the market is more of a protective and balancing reflex on the put side, rather than directional fear, and that the call side transactions do not close the door on an upward scenario for the market. To summarize, we conclude that option players have accepted high volatility but are more comfortable pricing in the possibility of a controlled and potentially upward movement rather than a sharp downward break.
Option Maturity:
Ethereum options with a nominal value of $3.7 billion expired on December 26. The Max Pain level was calculated at $3,100, while the put/call ratio stood at 0.45.
Legal Notice
The investment information, comments, and recommendations contained in this document do not constitute investment advisory services. Investment advisory services are provided by authorized institutions on a personal basis, taking into account the risk and return preferences of individuals. The comments and recommendations contained in this document are of a general nature. These recommendations may not be suitable for your financial situation and risk and return preferences. Therefore, making an investment decision based solely on the information contained in this document may not result in outcomes that align with your expectations.
