
Weekly Fundamental Analysis Report – September 26
Fear & Greed Index
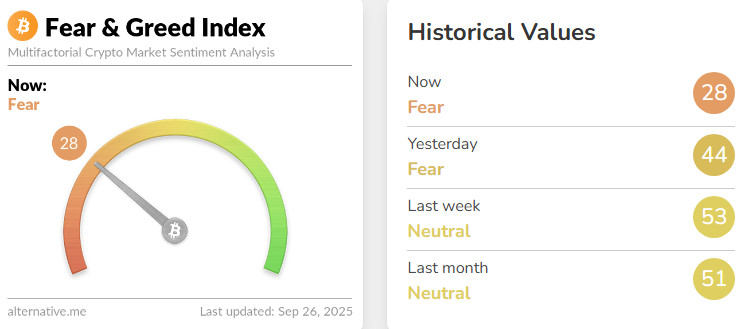
Source: Alternative
Change in Fear and Greed Value: -25
Last Week’s Level: 53
This Week’s Level: 28
The strong opening seen in stocks at the beginning of the week soon turned to profit realization and cautious tone, Powell’s warnings about valuations and uncertainty about the interest rate path weakened the appetite for risk-taking, leveraged position liquidations reached the billion dollar scale with the accelerated sales in crypto since Monday and sentiment slipped into negative territory, Although the SEC’s simplification of crypto ETF approval processes kept the institutional participation expectation alive for the medium term, the retreat in stocks and concerns about funding conditions remained dominant in the short term, the fact that the applications for unemployment benefits in the US came in below the expectation of 233 thousand with 218 thousand and declined from the previous level of 231 thousand weakened the expectations of rapid easing by giving the message that the cooling rate on the employment side is limited.3 with 8.3% above expectations created additional weight on risky assets through the dollar and bond yields, while technology stocks weakened due to the impact of balance sheet and data flow in the middle of the week, while sales in crypto spread widely, Bitcoin could not break the downward pressure despite its efforts to hold at intermediate levels, Ethereum fell more sharply on a percentage basis, while the retreat deepened in BNB and selected altcoins, by the end of the week, the heightened likelihood of a government shutdown in the US and the nearly $23 billion of Bitcoin and Ethereum option expiries piled up in the same week increased volatility and accelerated risk aversion, the cumulative effect of this combination of Fear&This turned into a strong cooling in the Greed index, with the index falling from 53 to the 20s and closing the week with a reading of 28. In the overall picture, macro data flow and policy uncertainty were net negatives in the short term, while news of regulatory simplification and institutional adaptation were only limited stabilizers in the medium term.
Fund Flows
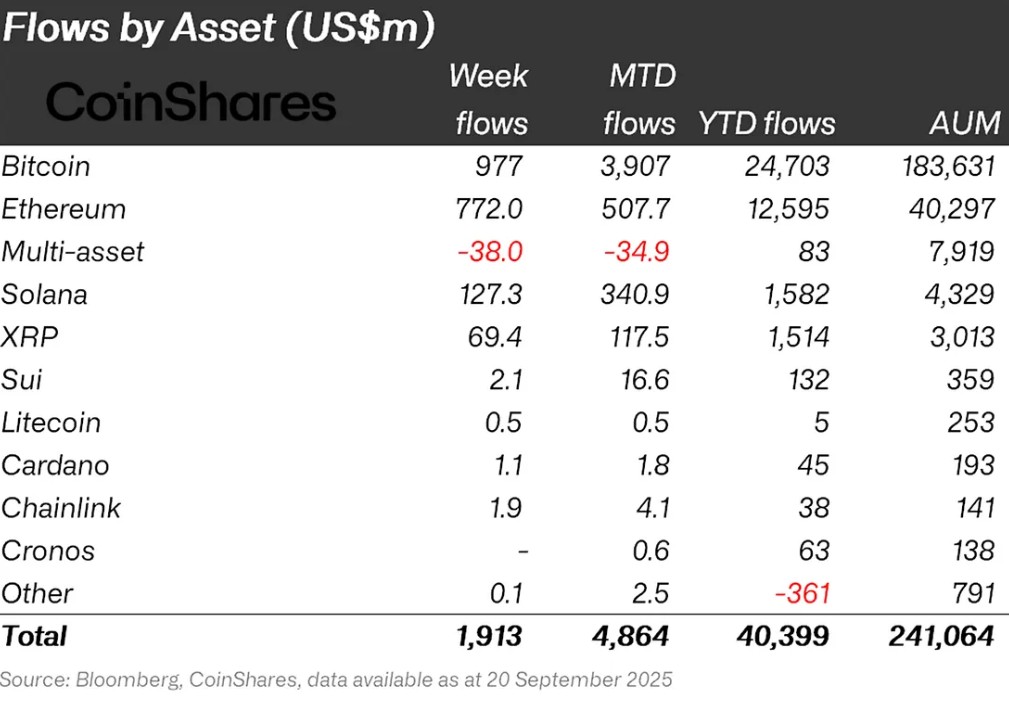
Source: Coin Shares
Overview Cryptocurrency markets entered a week of declines despite the 25 basis point interest rate cut announced by the US Federal Reserve (FED). In particular, US President Donald Trump’s positive statements about the stock markets were not enough and strengthened the bearish environment in the markets. As a result of these developments, Bitcoin lost about 5% of its value during the week.
Bitcoin (BTC): Bitcoin continues to suffer losses at the investor point this week. The interest rate cut in global markets had limited positive impact on crypto markets. In this week alone, Bitcoin-focused funds saw inflows of $977 million.
Ethereum (ETH): This week, Ethereum saw inflows of $772.0 million as spot ETH surged.
Ripple (XRP): Xrp saw fund inflows of $69.4 million this week.
SUI (SUI): Corporate banks’ deals with Sui continue with new ones being added. There was an inflow of approximately 2.1 million dollars from Sui this week.
Solana (SOL): Morgan Stanley announced that it will allow Solana transactions in the first half of 2026 thanks to its partnership with Zerohash. Solana saw inflows of $127.3 million.
Cardano (ADA): Cardano saw inflows of $1.1 million this week.
Chainlink (LINK): Chainlink continues to strengthen its potential by providing reliable data and updates to the Tokenization and DeFi space. Link saw $1.9 million in inflows this week.
Other: Sectoral and project-based rallies in altcoins and general market sentiment led to an inflow of $0.1 million in fund flow data.
Fund Outflows:
Multi-asset: Outflows were observed in the multi-asset group.
Total MarketCap
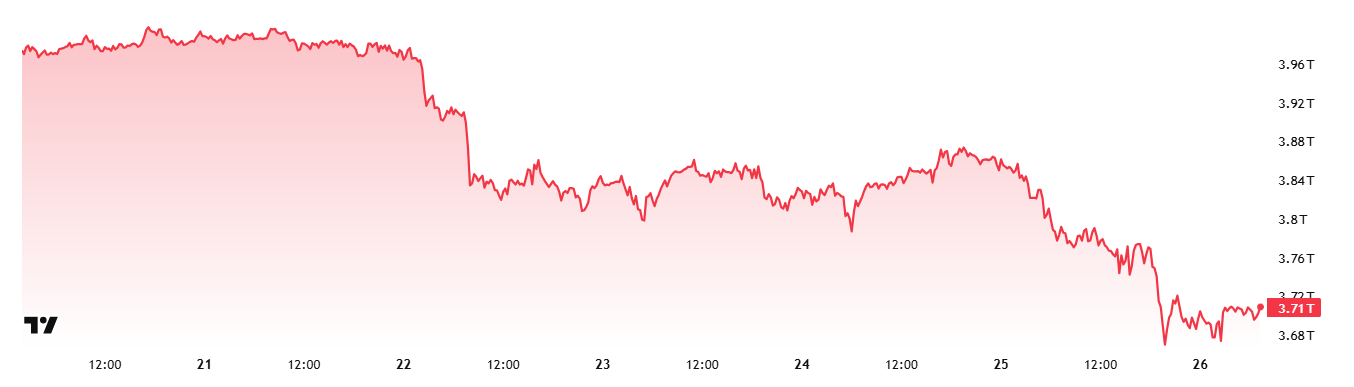
Source: Tradingview
- Market Capitalization Last Week:96 Trillion Dollars
- Market Capitalization This Week:71 Trillion Dollars
The cryptocurrency market lost 6.45% this week, shrinking by about $255 billion, and the total market capitalization fell to $3.71 trillion. During the week, values peaked at $ 3.97 trillion, while the lowest level was recorded as $ 3.66 trillion. Thus, it was seen that the market moved in a band of approximately 320 billion dollars. This picture reveals that volatility has increased even more compared to last week and the uptrend that has been going on for about 2.5 weeks has clearly ended this week. Nevertheless, the Total Market index is still hovering near its 2024 peak.
Total 2
The Total 2 index started the week with a market capitalization of $1.68 trillion and fell 8.57% during the week to $1.52 trillion, down about $142 billion. During the week, the highest value was recorded as 1.67 trillion dollars and the lowest value was recorded as 1.49 trillion dollars. Thus, the index fluctuated within a wide range of 182 billion dollars in total. This table reveals that Total 2 has followed a more volatile course compared to recent weeks. With the recent pullback, the index has fallen below its 2024 peak and remains flat at these levels for now.
Total 3
The Total 3 index started the week with a market capitalization of $1.13 trillion and fell 7.51% to $1.04 trillion, losing around $85 billion during the week. There was a 10.34% difference between the lows and highs during the week. This time, however, Total 3 was not the most volatile index of the week; Total 2 came out on top with a volatility of more than 12%, while Total 3 remained in second place.
Although the overall picture was negative, it was notable that the Total Market index had the strongest performance. This suggests that Bitcoin has regained its prominence and maintained its dominance as the key segment of the market . On the other hand, comparative performances show that Ethereum’s total market share continued to decline significantly this week.
Altcoin Season Index
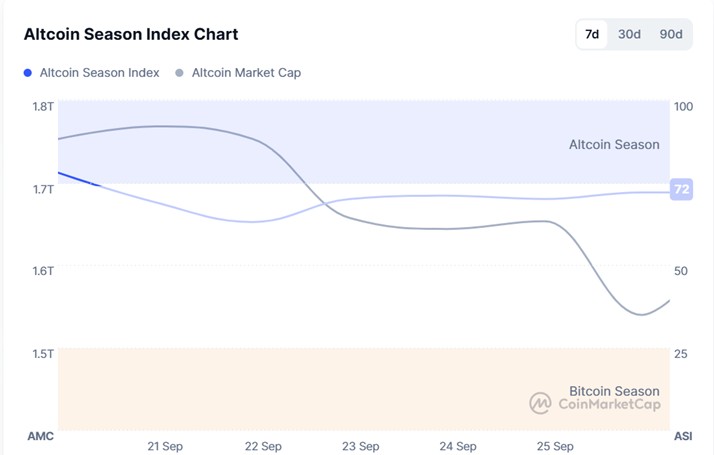
Source: Coin marketcap
- Last Week Index Value: 73/100
- Index Value This Week: 72/100
Between September 19 and September 26, 2025, the correlation between the market capitalization of altcoins (Altcoin Market Cap) and the Altcoin Season Index has been on the rise. The chart shows that this week, the index peaked at 78 on September 20 , with the Altcoin Market Cap reaching 1.72T. This signals a rise in the market dominance of altcoins. The top 5 coins that led the index higher this week were MYX, M, Aster, XPL, OKB. Between September 23 and September 26, the index rose from 63 to 72, indicating that the altcoin season has the potential for a short-term revival and that the total market capitalization of altcoins is experiencing relative progress compared to Bitcoin.
Bitcoin Dominance
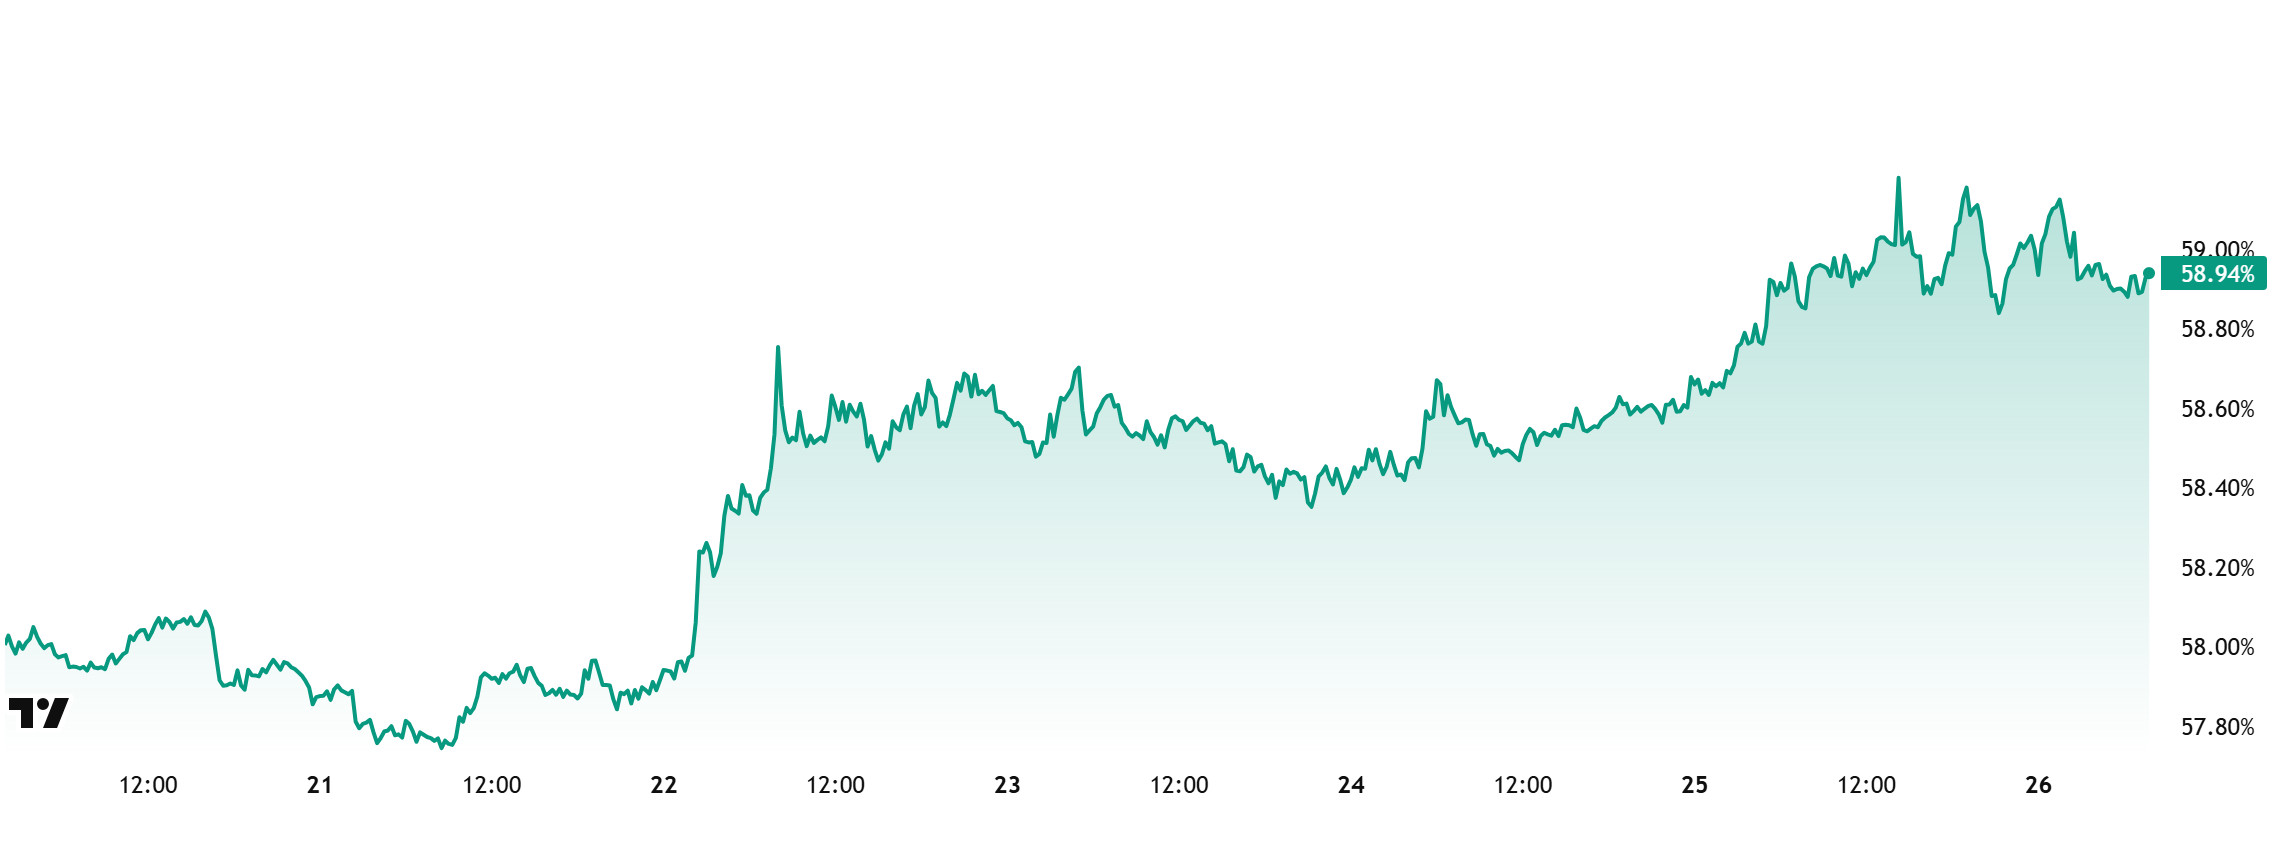
Bitcoin Dominance
Bitcoin dominance, which started the week at 57.96%, increased to 59.24% during the week, but then retreated slightly and is currently at 58.94%.
This week, Strategy bought 850 Bitcoin, Metaplanet bought 5,419 Bitcoin, Capital B bought 551 Bitcoin and The Smarter Web bought 55 Bitcoin.
Data on Bitcoin spot ETFs show a total net outflow of $484.2 million to date.
It was announced that the FED’s expected interest rate cut this year will be 50 basis points. This US-driven development has increased the risk appetite in the markets and paved the way for retail investors in particular to create buying positions in spot ETFs. Meanwhile, capital inflows also continued on the institutional investor side.
Although the overall outlook has been positive recently, not only Bitcoin but also Ethereum and other altcoins have seen some capital outflows. Nevertheless, throughout the week, Bitcoin outperformed Ethereum and other altcoins. This outlook reinforces expectations for an increase in Bitcoin’s market dominance, with BTC dominance expected to consolidate in the range of 58% – 60% in the coming week.
Ethereum Dominance
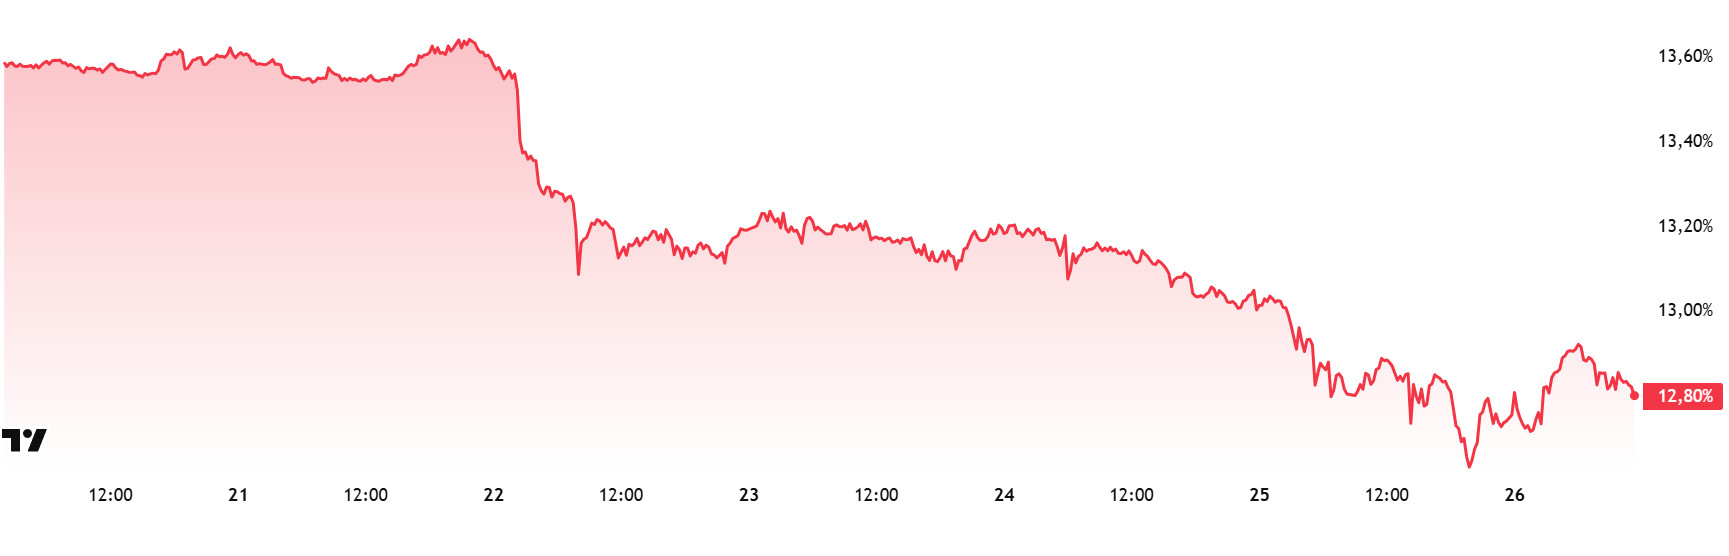
Source: Tradingview
Weekly Change
- Last Week’s Level: 13.55%
- This Week’s Level: 12.80%
Ethereum dominance, which rose to 15% levels in mid-August, lost momentum in the following period, entered a downward trend and retreated towards 12.50%. This negative outlook continued its effect in the current week.
Accordingly, Ethereum dominance completed last week at 13.55%, while it is trading at around 12.80% as of current data. In the same period, Bitcoin dominance, unlike Ethereum, followed a positive trend and exhibited an upward trend.
When the fundamental developments affecting Ethereum dominance are analyzed, the activity on the institutional buying side is noteworthy. In this context, Ethereum-focused treasury company BitMine decided to raise 365 million dollars in funds by selling approximately 5.22 million shares at a price of 70 dollars. In addition, 10.4 million warrants were issued at a strike price of 87.5 dollars. If all of these instruments are redeemed for cash, the total potential proceeds are estimated to reach $1.28 billion. Nasdaq-listed Ethereum treasury company SharpLink announced a 509 ETH staking reward last week. Within the scope of the strategy launched in June 2025, the total amount of ETH staked by the company reached 3,749. SharpLink Gaming also announced that it will issue SBET tokenized stock on Ethereum. This step aims to expand on-chain capital markets in cooperation with Superstate. On the other hand, listed company ETHZilla announced that it will invest approximately 10,600 ETH (approximately $47 million) worth of assets in the Puffer liquidity staking protocol for yield enhancement.
Meanwhile, the Ethereum Foundation launched a new initiative called Ethereum Everywhere to support global communities. This program aims to support community events, developer workshops and innovation hubs. Ethereum founder Vitalik Buterin has stated that the upcoming Fusaka upgrade will support L1 and L2 scaling. In particular, the PeerDAS mechanism will enable block data to be verified without the need for a single node . Vitalik also emphasized that security is a priority and that the number of blobs will be gradually increased.
Bitcoin Spot ETF
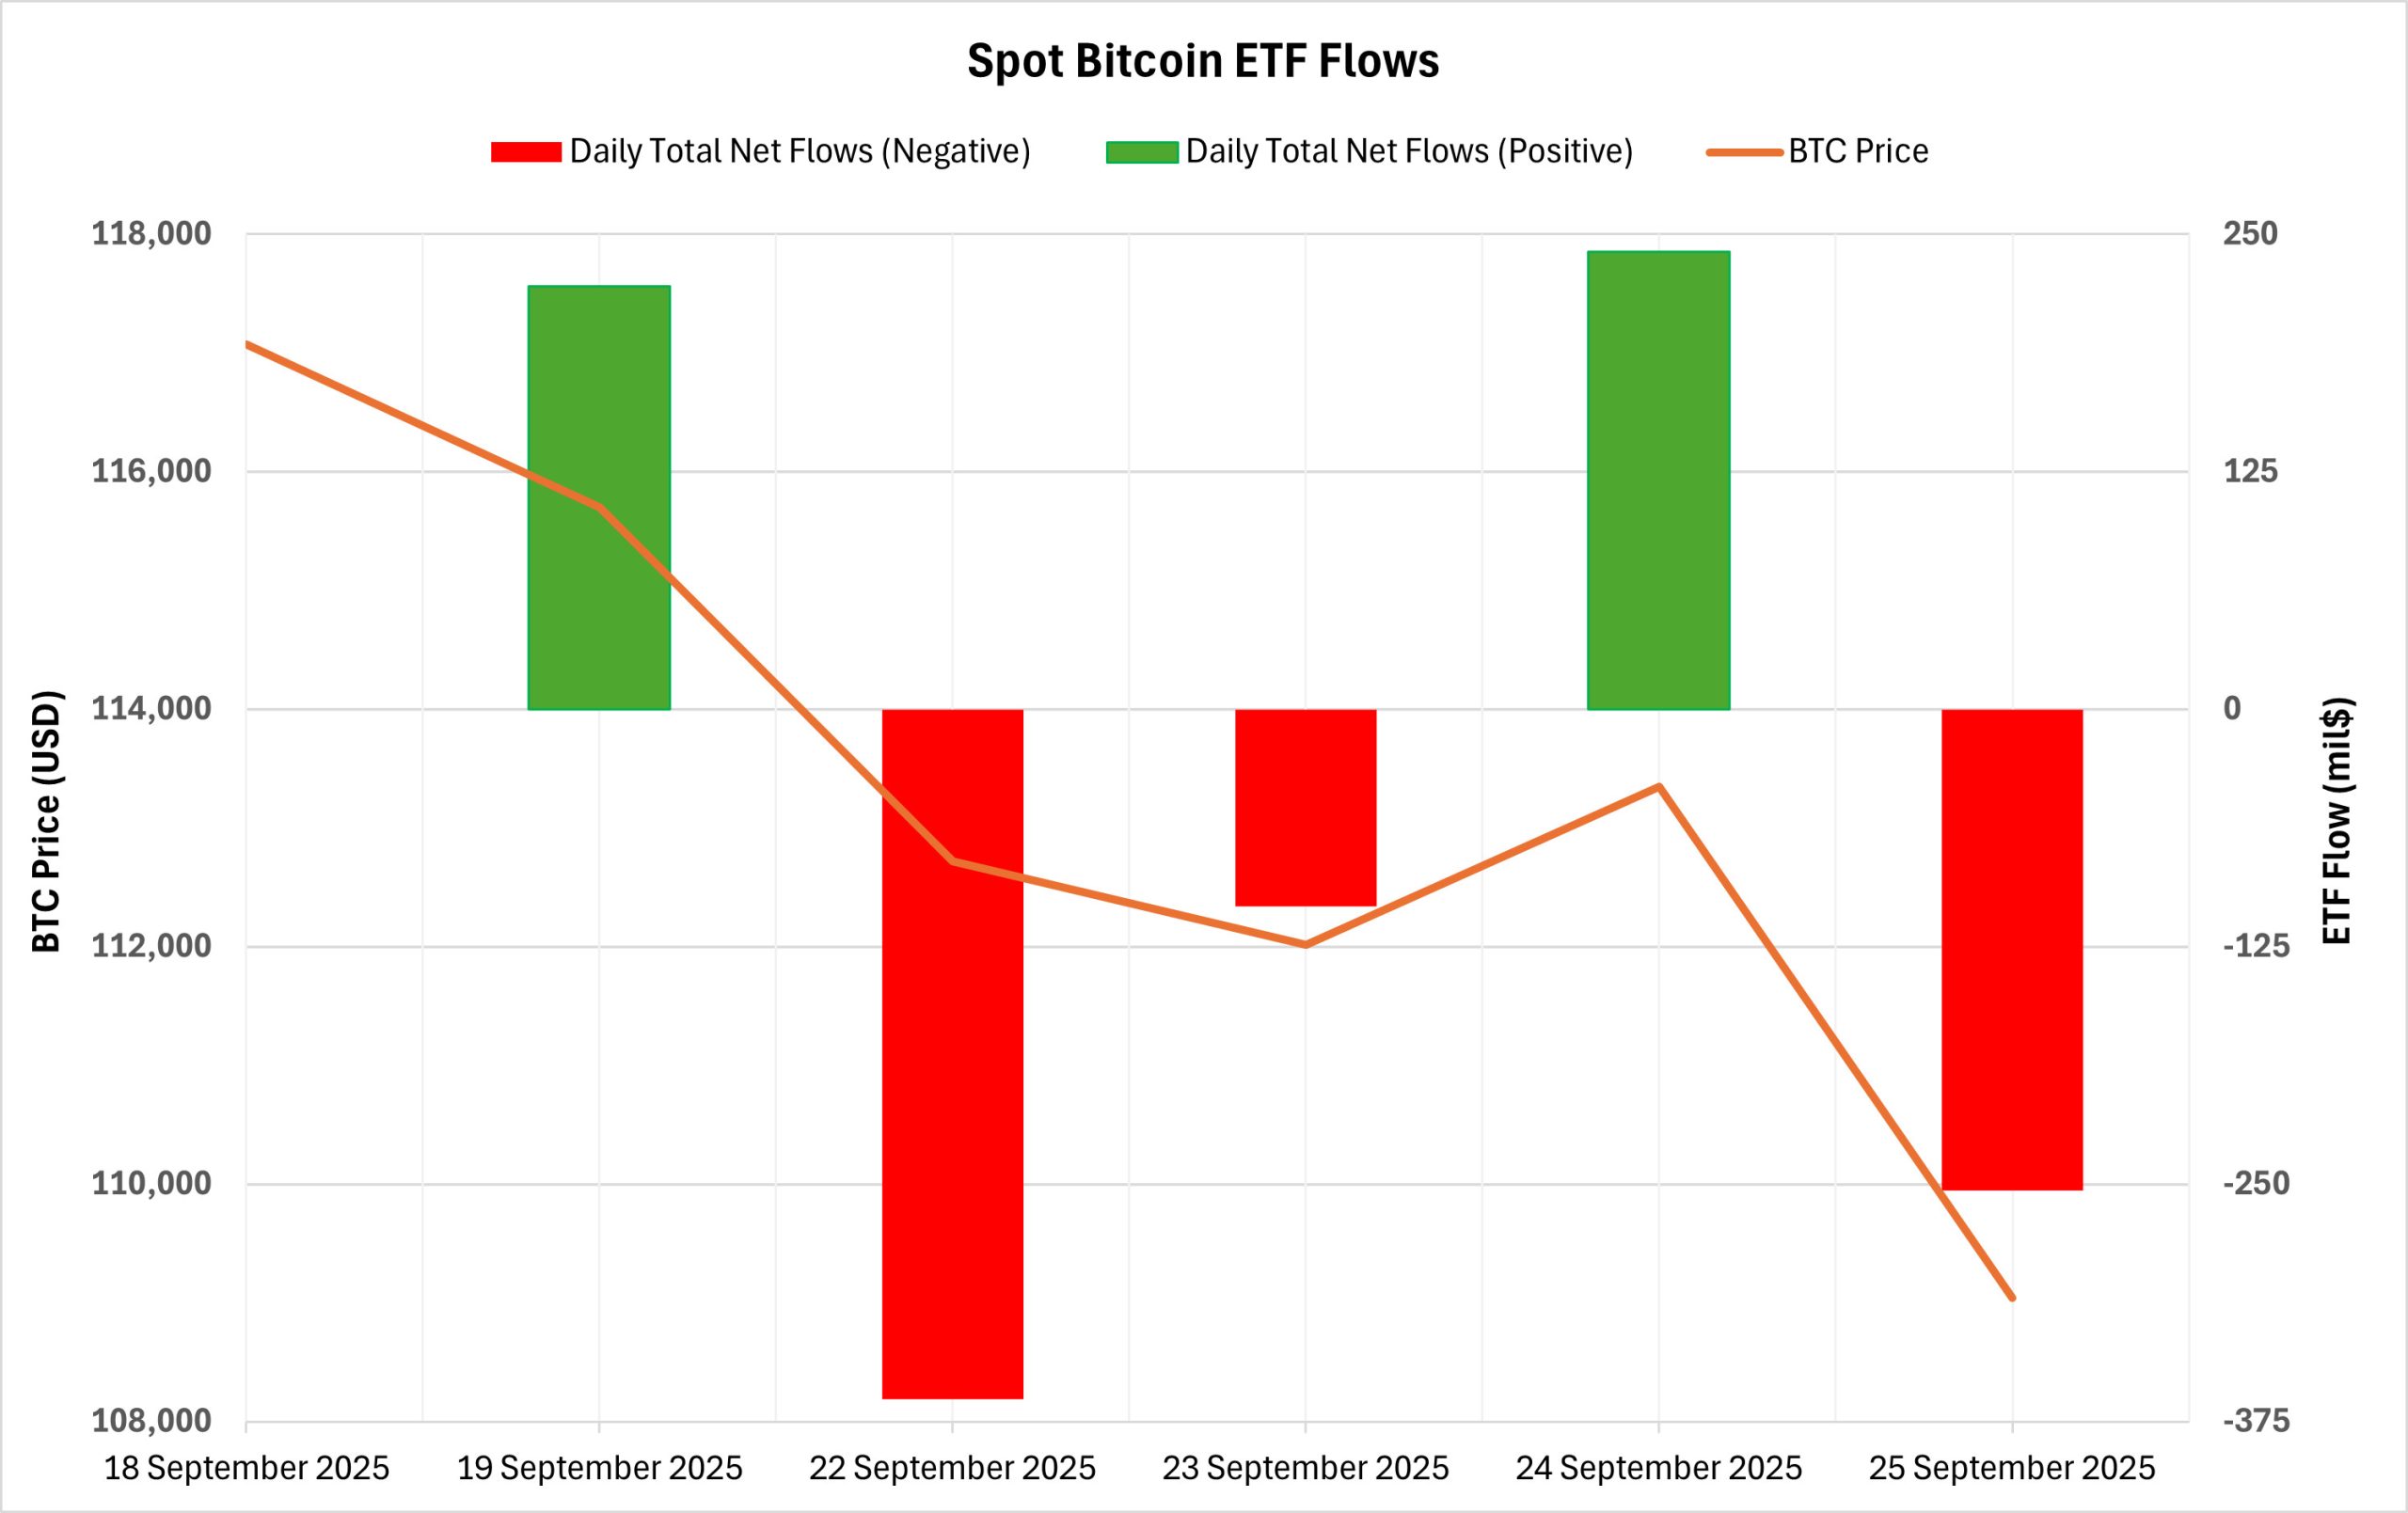
NetFlow Status: Between September 19-25, 2025, Spot Bitcoin ETFs saw a total net outflow of $256.7 million. The sharpest daily outflow was $363.1 million on September 22. On a fund basis, BlackRock IBIT stood out with net inflows of $457.2 million, while Fidelity FBTC stood out with net outflows of $437.4 million and Ark ARKB $105.5 million. There was no clear flow series. Inter-day directional changes reflected the cautious outlook on the institutional side.
Bitcoin Price: Bitcoin, which opened at $ 117,074 on September 19, closed at $ 109,040 on September 25. In this process, the Bitcoin price fell by 6.86%. Especially the weakness on September 22 and September 25 was noteworthy, while the recovery on September 24 could not be permanent.
Cumulative Net Inflows: Spot Bitcoin ETFs’ cumulative net inflows declined to $57.20 billion as of the 428th trading day.
| Date | Coin | Open Price | Close Price | Change (%) | ETF Flow (mil $) |
|---|---|---|---|---|---|
| 19-Sep-25 | BTC | 117,074 | 115,702 | -1.17% | 222.6 |
| 22-Sep-25 | BTC | 115,281 | 112,719 | -2.22% | -363.1 |
| 23-Sep-25 | BTC | 112,719 | 112,014 | -0.63% | -103.8 |
| 24-Sep-25 | BTC | 112,014 | 113,347 | 1.19% | 241.0 |
| 25-Sep-25 | BTC | 113,347 | 109,040 | -3.80% | -253.4 |
| Total for 19–25 September 2025 | -6.86% | -256.7 | |||
No clear direction was seen in ETF flows. IBIT-driven buying was offset by outflows on the FBTC/ARKB/GBTC side. The fact that Bitcoin price closed this period with a significant decline shows that the uncertain flow structure is reflected in the market psychology. If institutional demand strengthens in the coming period, ETF inflows may create an upward support on BTC price in the medium term. On the contrary, continued outflows may limit Bitcoin’s bullish attempts and cause increased selling pressure.
Ethereum spot ETF
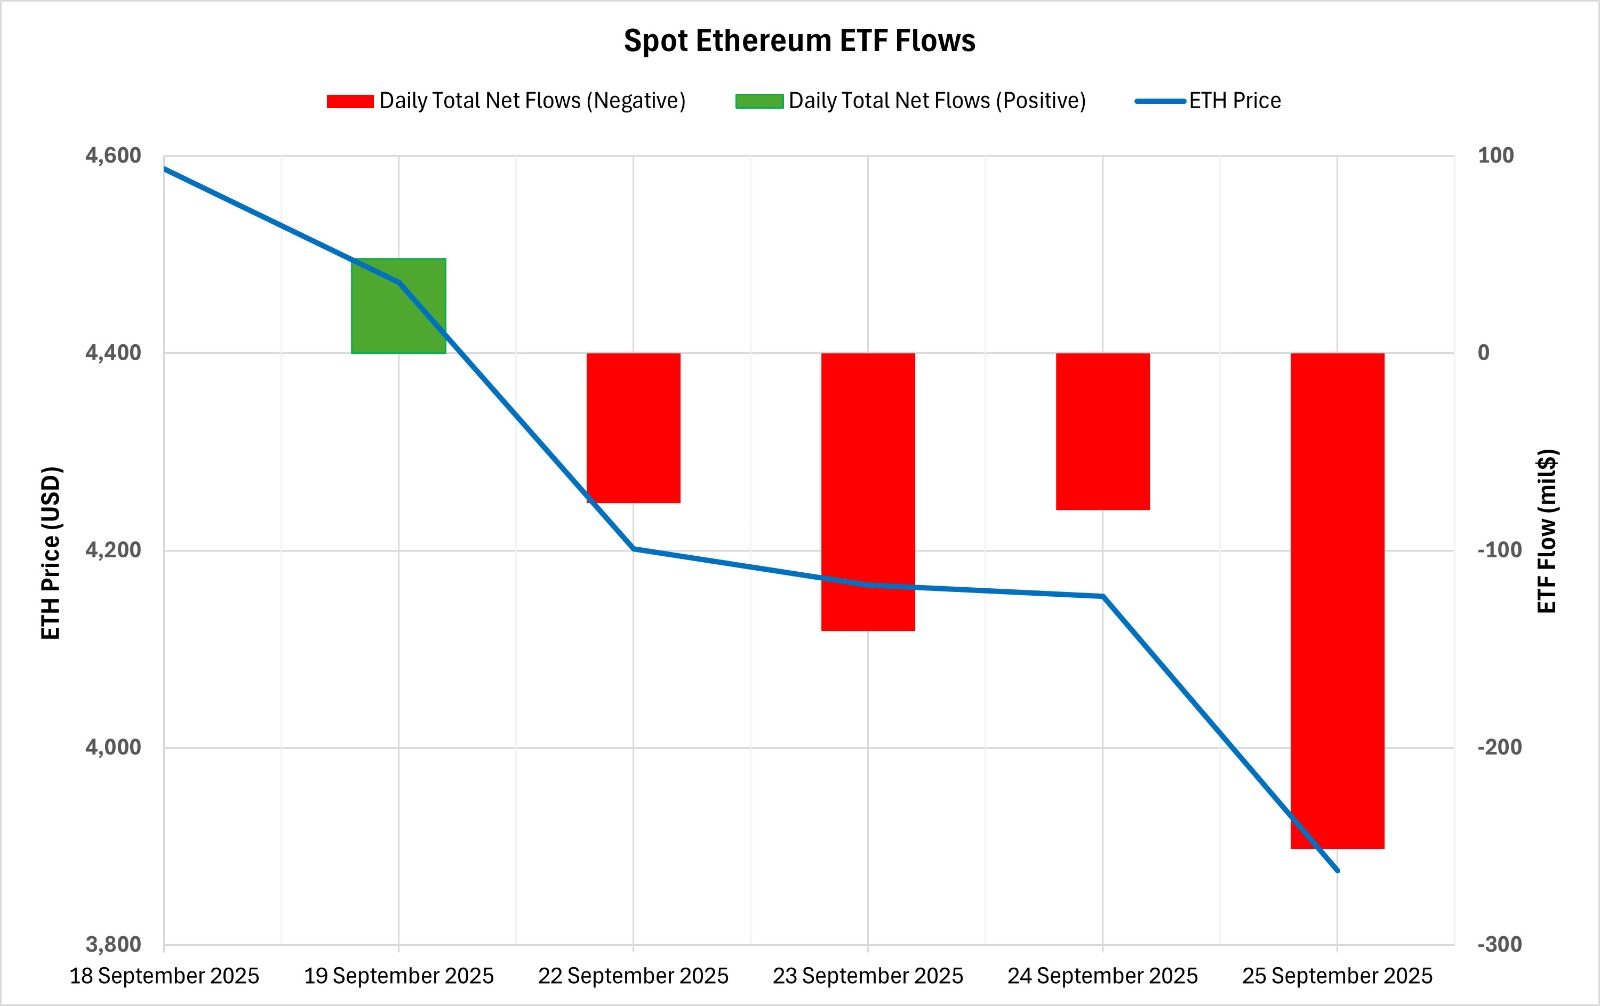
Between September 19-25, 2025, Spot Ethereum ETFs had a total net outflow of $499.6 million. The sharpest outflow on a daily basis was $251.2 million on September 25. On a fund basis, Fidelity FETH stood out with outflows of $ 341.3 million and Bitwise ETHW $ 85.3 million, while only BlackRock ETHA saw a net inflow of $ 102.7 million. Spot Ethereum ETFs’ cumulative net inflows fell to $13.39 billion at the end of the 296th trading day, with negative flows in the last four trading days in a row.
| Date | Coin | Open Price | Close Price | Change (%) | ETF Flow (mil $) |
|---|---|---|---|---|---|
| 19-Sep-25 | ETH | 4,587 | 4,472 | -2.51% | 47.8 |
| 22-Sep-25 | ETH | 4,446 | 4,202 | -5.50% | -76.0 |
| 23-Sep-25 | ETH | 4,202 | 4,165 | -0.87% | -140.8 |
| 24-Sep-25 | ETH | 4,165 | 4,154 | -0.28% | -79.4 |
| 25-Sep-25 | ETH | 4,154 | 3,875 | -6.70% | -251.2 |
| Total for 19–25 September 2025 | -15.51% | -499.6 | |||
Ethereum price started at $4,587 on September 19 and closed at $3,875 on September 25, down 15.51% during the period. The sharp sell-off, especially on September 22 and September 25, along with consecutive outflows on the fund side, increased the pressure on the price. If flows stabilize in the short term, reaction buying may strengthen, but the current picture shows that the weakness in institutional risk appetite continues in sync with the price.
Bitcoin Options Distribution
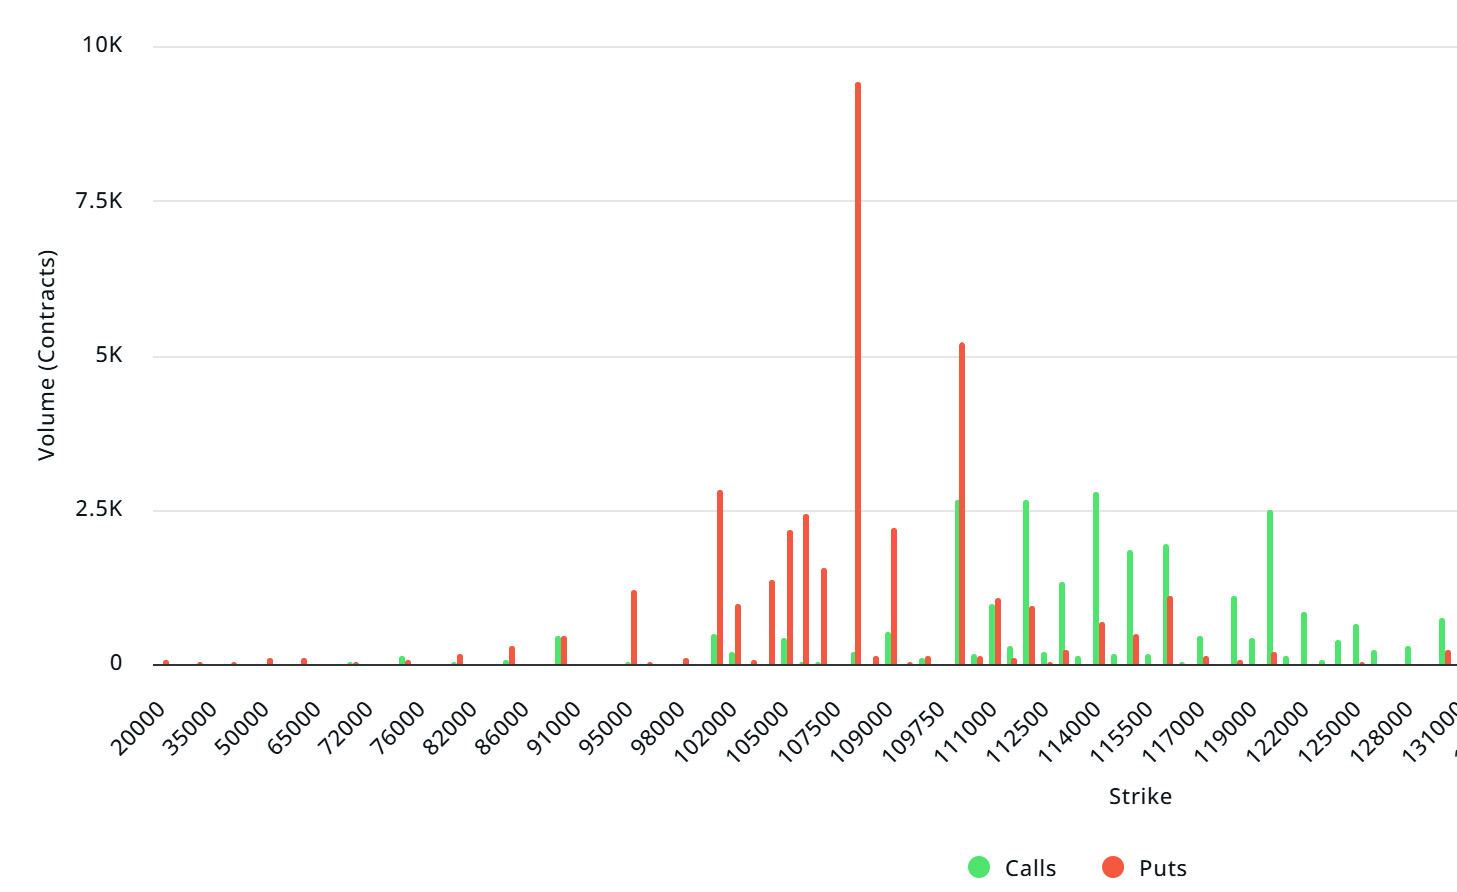
Source: Laevitas
BTC: Notional: $17.06B | Put/Call: 0.76 | Max Pain: $110K
Deribit Data: Deribit data shows that BTC options contracts with a notional value of approximately $17.06 billion expired today. At the same time, according to the data in the last 24 hours, if we look at the risk conversion in the next 1 week, put options are the dominant side in hedging more than call options. When we examine the expected volatility (IV), it is above the realized volatility (RV). On the other hand, the positive course of the spread metric indicates that the market has an appetite. Skew values are bearish today and next week.
Laevitas Data: When we examine the chart, we see that put options are concentrated in a wide band between 96,000 – 110,000 dollars. Call options are concentrated between 110,000 – 120,000 dollars and the concentration decreases towards the upper levels. At the same time, the level of approximately 108,000 dollars is seen as support and 110,000 dollars as resistance. On the other hand, there are 9.42K put options at the $108,000 level, where there is a peak and there is a decrease in put volume after this level. However, it is seen that 2.65K call option contracts peaked at the $112,000 level. When we look at the options market, we see that put contracts are dominant on a daily and weekly basis.
Option Maturity:
Put/Call Ratio and Maximum Pain Point: If we look at the options in the last 7 days data from Laevitas, the number of call options increased by approximately 32% compared to last week and amounted to 145.72K. In contrast, the number of put options increased by 39% compared to last week to 123.46K. The put/call ratio for options was set at 0.76. This indicates that call options are much more in demand among investors than put options. Bitcoin’s maximum pain point is seen at $110,000. BTC is currently priced at $109,500 and it can be predicted that the declines will continue if it does not break the pain point of $110,000 upwards.
Ethereum Options Distribution
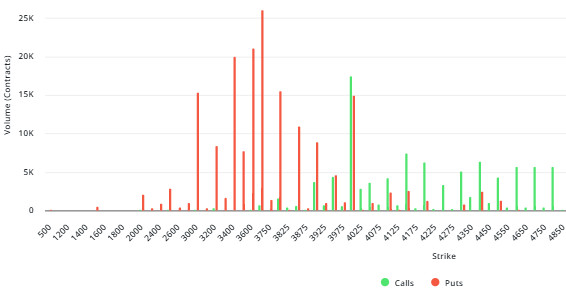
Source: Laevitas
ETH: $5.2 B notional | Put/Call: 0.80 | Max Pain: $3,800
Laevitas Data: Looking at the data in the chart, we see that put options are particularly concentrated at the price levels between $3,600 and $4,000. The highest put volume is at $3,700 with about 26.5K contracts and this level can be considered as a possible support zone. On the other hand, call options are concentrated between $4,000 and $4,400. Especially the $4,000 level stands out with a high call volume of about 15K contracts. This level can be considered as an important resistance zone in the market.
Deribit Data: ATM volatility is at 58.2%, down 11.19% in the last 24 hours. While this decline put pressure on option premiums, it is possible to say that the market’s short-term risk perception has declined to a relatively lower level. With a 25% risk reversal of -6.09%, we see that the demand for put options is significantly ahead of calls. On the volume side, calls and puts totaled $92.38M and $121.27M, respectively, bringing the total 24-hour options volume to $213.65M. The sharp rise in put volume is in line with the negative RR outlook, with open interest (OI) at $181.94M, up 315% on a daily basis, indicating strong new position inflows. However, flows were mainly hedging.
The overall outlook is neutral to slightly bearish. While negative RR and put density increase the downside risk appetite, the decline in ATM vol and the limited increase in butterfly indicate that the market is not in a panic mood and is priced more balanced. For the sustainability of the uptrend, we need to watch for call demand to strengthen, basis to recover and risk reversal to turn positive.
Option Expiry:
Ethereum options with a notional value of $5.2 billion expired on September 26. The Max Pain level is calculated at $3,800, while the put/call ratio stands at 0.80.
Legal Notice
The investment information, comments and recommendations contained in this document do not constitute investment advisory services. Investment advisory services are provided by authorized institutions on a personal basis, taking into account the risk and return preferences of individuals. The comments and recommendations contained in this document are of a general type. These recommendations may not be suitable for your financial situation and risk and return preferences. Therefore, making an investment decision based solely on the information contained in this document may not result in results that are in line with your expectations.
