
Fear & Greed Index
Source: Alternative
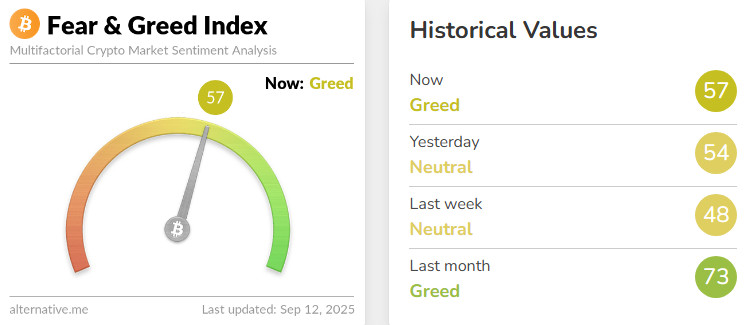
Change in Fear and Greed Value: +9
Last Week’s Level: 48
This Week’s Level: 57
The Crypto Fear & Greed index is at 57 this week, up from 48 last week and in Greed territory. Strategy’s announcement to buy 1,955 BTC at an average of $111,196, amounting to approximately $217.4 million, and Metaplanet’s addition of 136 BTC, bringing its total to 20,136 BTC, pushed demand and flow components up, while Forward Industries’ Solana-focused $1.65 billion in cash and stablecoin commitments strengthened capital breadth in the ecosystem, reinforcing positive sentiment. On the macro side, the European Central Bank left interest rates unchanged and the strengthening of the euro and weakening of the dollar in the initial pricing supported the risk perception, the US CPI was announced as 0.4 mom and 2.9 yoy, unemployment claims rose to 263k, this combination increased volatility in the short term and had an effect limiting excessive greed. On the regulatory front, the SEC postponed some crypto ETF applications, selectivity increased especially on the altcoin side through the uncertainty channel, the total effect of all these components was reflected as the index rose from 48 to 57.
Fund Flows
Source: Coin Shares
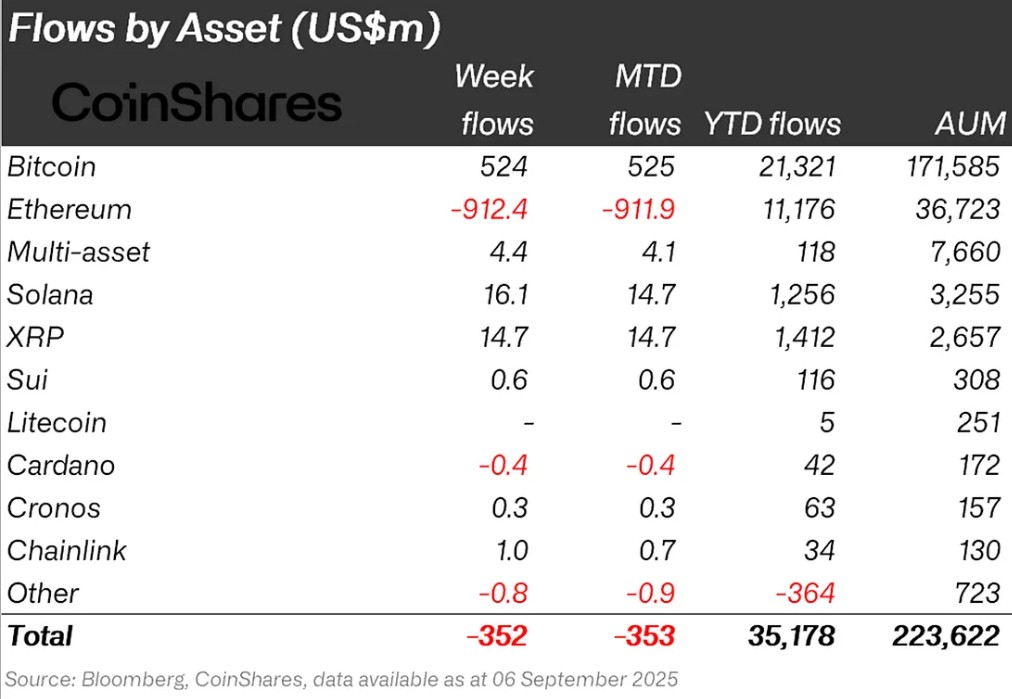
Overview The cryptocurrency market is entering a difficult week with increasing macroeconomic uncertainties and FED statements. In particular, US President Donald Trump’s harsh and ever-changing rhetoric on tariff disputes between countries has led to a loss of confidence in the markets. As a result of all these developments, Bitcoin lost about 3% of its value.
Bitcoin (BTC): Bitcoin continues to garner investor confidence this week. Expectations of interest rate cuts and reduced inflation pressures in global markets had a positive impact on Bitcoin. Especially the positive attitude of institutional investors continues to attract attention. Bitcoin-focused funds received $524 million in inflows this week alone. This shows that the market is showing signs of recovery and long-term confidence in Bitcoin continues.
Ripple (XRP): Xrp saw fund inflows of $14.7 million this week.
SUI (SUI): The general depreciation in the market also affected the Sui coin. There was an outflow of about $0.6 million from Sui this week.
Solana (SOL): DeFi Development Corp. Increased Solana Treasury to $400 Million. Solana saw inflows of $16.1 million.
Chainlink (LINK): Chainlink continues to strengthen its potential to provide trusted data to the Tokenization and DeFi space. Link saw inflows of $1.0 million this week.
Multi-asset: Despite the ETF data, inflows were observed in the multi-asset group.
Fund Outflows:
Ethereum (ETH): There were outflows of $912.4 million into Ethereum this week as spot ETHs weakened.
Cardano (ADA): Cardano saw outflows of $0.4 million this week.
Other: Although sectoral and project-based increases are seen in altcoins. General market sentiment also led to a $0.8 million outflow in fund flow data.
Total MarketCap
Source: Tradingview
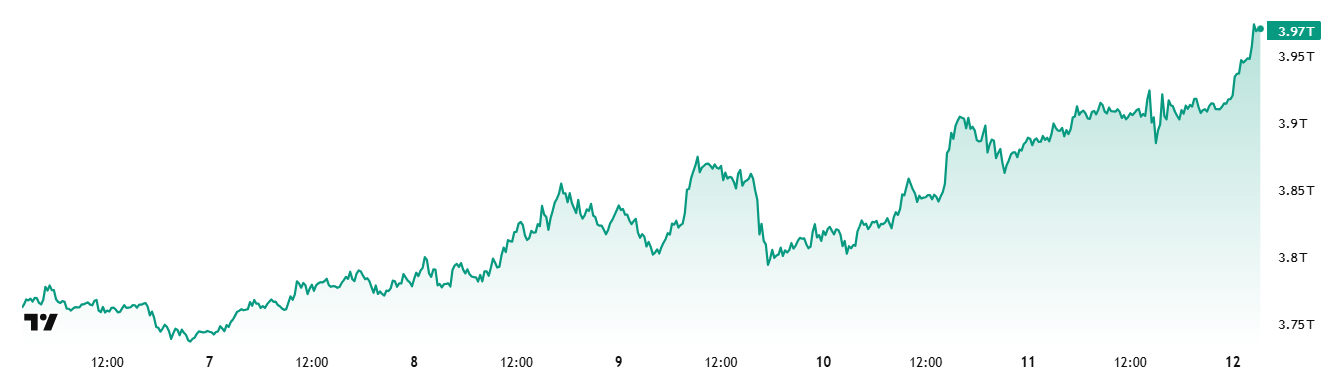
- Market Capitalization Last Week: 79 trillion Dollars
- Market Capitalization This Week: 97 trillion Dollars
The cryptocurrency market increased by 4.8% in total market capitalization to $3.97 trillion this week, with growth of nearly $182 billion. During the week, the market capitalization peaked at $ 3.99 trillion, while the lowest point was recorded as $ 3.77 trillion. Thus, it was seen that the market moved within a band of approximately 220 billion dollars. This outlook suggests that although volatility continues, the market maintains its upside potential and investors continue to position themselves for buying, albeit cautiously.
Total 2
The Total 2 index, which started the week with a market capitalization of $ 1.57 trillion, increased by 5.6% during the week and reached $ 1.66 trillion with an increase of approximately $ 88 billion . The index, which rose up to $ 1.67 trillion during the week, realized its lowest level at $ 1.56 trillion and changed in a band of approximately $ 90 billion. Although it came very close to the all-time high of 1.71 trillion dollars, it has not yet tested its peak. However, with the potential for an approximate 3% appreciation from current levels, the possibility of regaining momentum for a peak attempt remains.
Total 3
While the Total 3 index started the week with a market capitalization of $1.05 trillion, it gained approximately $61 billion during the week, rising by 5.82% and reaching $1.11 trillion. The index, which had a gap of 7.23% between the lowest and highest values during the week, was again the most volatile index of the week.
While a positive picture was observed throughout the market, the strongest performance was seen in the Total 3 index. This situation reveals that the altcoin market has come to the fore again and started to accompany the basic segments of the market. Looking at comparative performances, it can be said that the decline in Ethereum’s total market share has paused this week, but has not yet made a meaningful breakthrough in the overall growth rate.
Altcoin Season Index
Source: Coinmarketcap
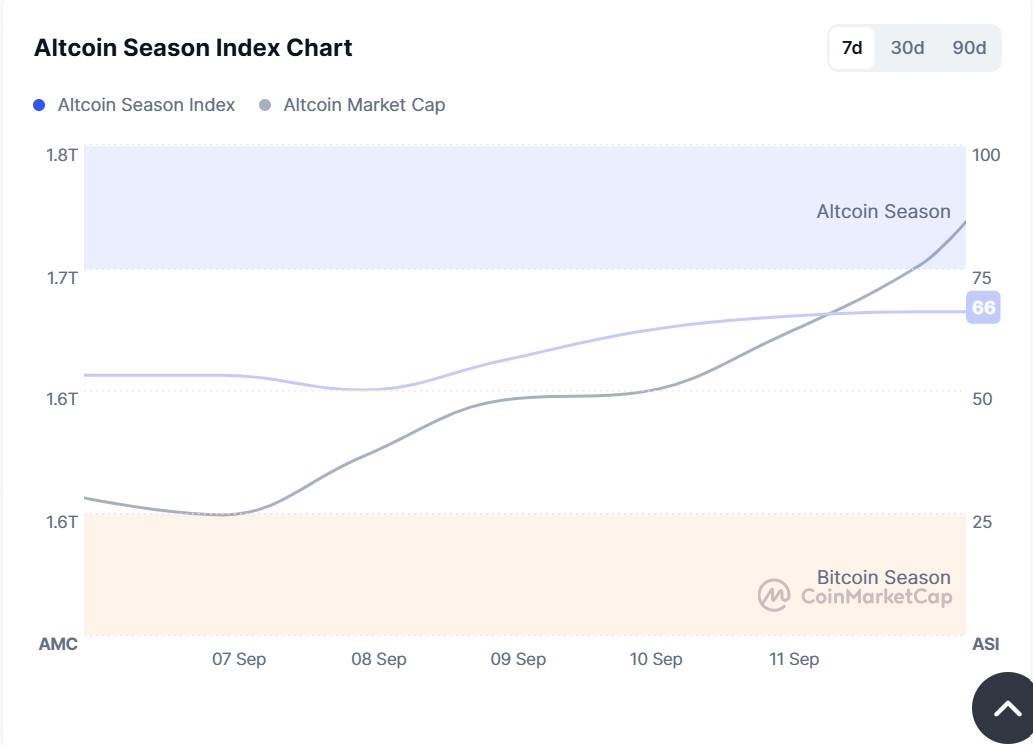
- Last Week Index Value: 50/100
- Index Value This Week: 66/100
Between September 5 and September 12, 2025, the correlation between the market capitalization of altcoins (Altcoin Market Cap) and the Altcoin Season Index has been on the rise. The chart shows that this week, the index peaked at 66 on September 12, with the Altcoin Market Cap reaching 1.70T. This signals a rise in the market dominance of altcoins. The top 5 coins that led the index higher this week were MYX, M, Pengu, OKB, CRO. Between September 9 and 11, the index rose from 56 to 65, indicating that the altcoin season has the potential for a short-lived revival and that the total market capitalization of altcoins is experiencing relative progress compared to Bitcoin.
Bitcoin Dominance
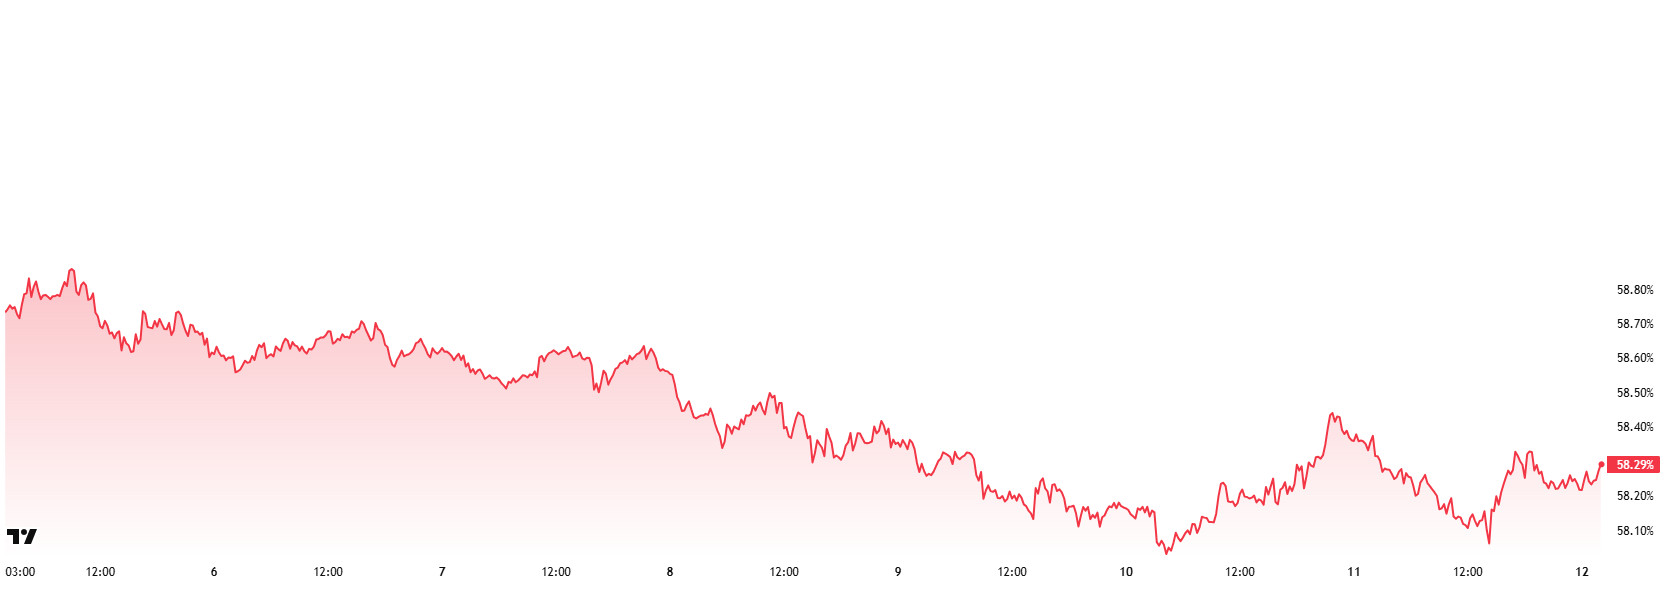
Bitcoin Dominance
Bitcoin dominance, which started the week at 58.46%, fell to 58.08% during the week, but then rose slightly and is currently at 58.29%.
This week, Strategy bought 1,955 Bitcoin, Metaplanet bought 136 Bitcoin, H100 Group bought 21 Bitcoin and The Smarter Web bought 30 Bitcoin. In addition, the CEO of H100 Group announced that they will strive to buy Bitcoin every week, and Capital B announced a €5 million capital increase to continue its Bitcoin treasury company strategy.
Data on Bitcoin spot ETFs shows a total net inflow of $406.6 million to date.
While the probability of a rate cut by the FED in September seems to be 100%, the expectation for the number of possible rate cuts this year has increased to 3. Markets are pricing this situation positively. These developments on the US side have increased the risk appetite of retail investors and increased buying in spot ETFs, while inflows continue on the institutional investor front.
As a result of the recent positive developments, Bitcoin-oriented capital inflows have been increasing. In addition, Bitcoin has been outperforming Ethereum and other altcoins in this process. While BTC dominance is expected to remain strong if institutional investors continue their purchases and ETF inflows continue to increase, a decline in dominance may occur if Ethereum and other altcoins decouple on a price basis. This creates an expectation of a decline in Bitcoin’s market dominance, with Bitcoin dominance expected to hover in the range of 57% – 59% in the coming week.
Ethereum Dominance
Source: Tradingview
“ETH.D Chart Image to be Added”
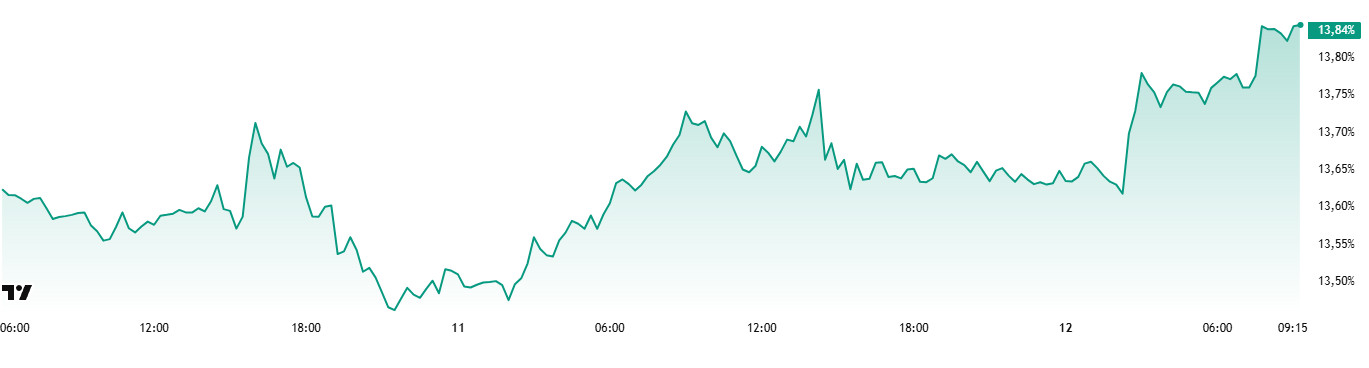
Weekly Change
- Last Week’s Level: 13.73%
- This Week’s Level: 13.84%
Ethereum dominance, which retreated to 11.39% in the last week of August, regained a positive momentum in the next three weeks and exhibited a steady upward trend and rose to 14.98%. However, the pullback in Ethereum price in the past two weeks brought selling pressure and led to a limited decline in the dominance. As of the current week, positive accelerations in dominance are observed again.
Accordingly, Ethereum dominance ended last week at 13.73%, while it is trading at around 13.84% as of current data. In the same period, unlike Ethereum, Bitcoin dominance followed a negative course and exhibited a downward trend.
Looking at the fundamental developments affecting Ethereum dominance, the activity on the institutional buying side is noteworthy. In this context, Onchain Lens reported that Bitmine purchased 46,255 ETH (≈$201 million) from Bitgo. Thus, the company’s total assets reached 2,126,018 ETH (≈$9.24 billion).
On the other hand, according to Validatorqueue data, the number of ETH in the Ethereum PoS network exit queue increased to 2.16 million. This amount is worth approximately $9.35 billion and the waiting time increased to 37 days and 15 hours. There are also 805,678 ETH waiting for network participation.
Bitcoin Spot ETF
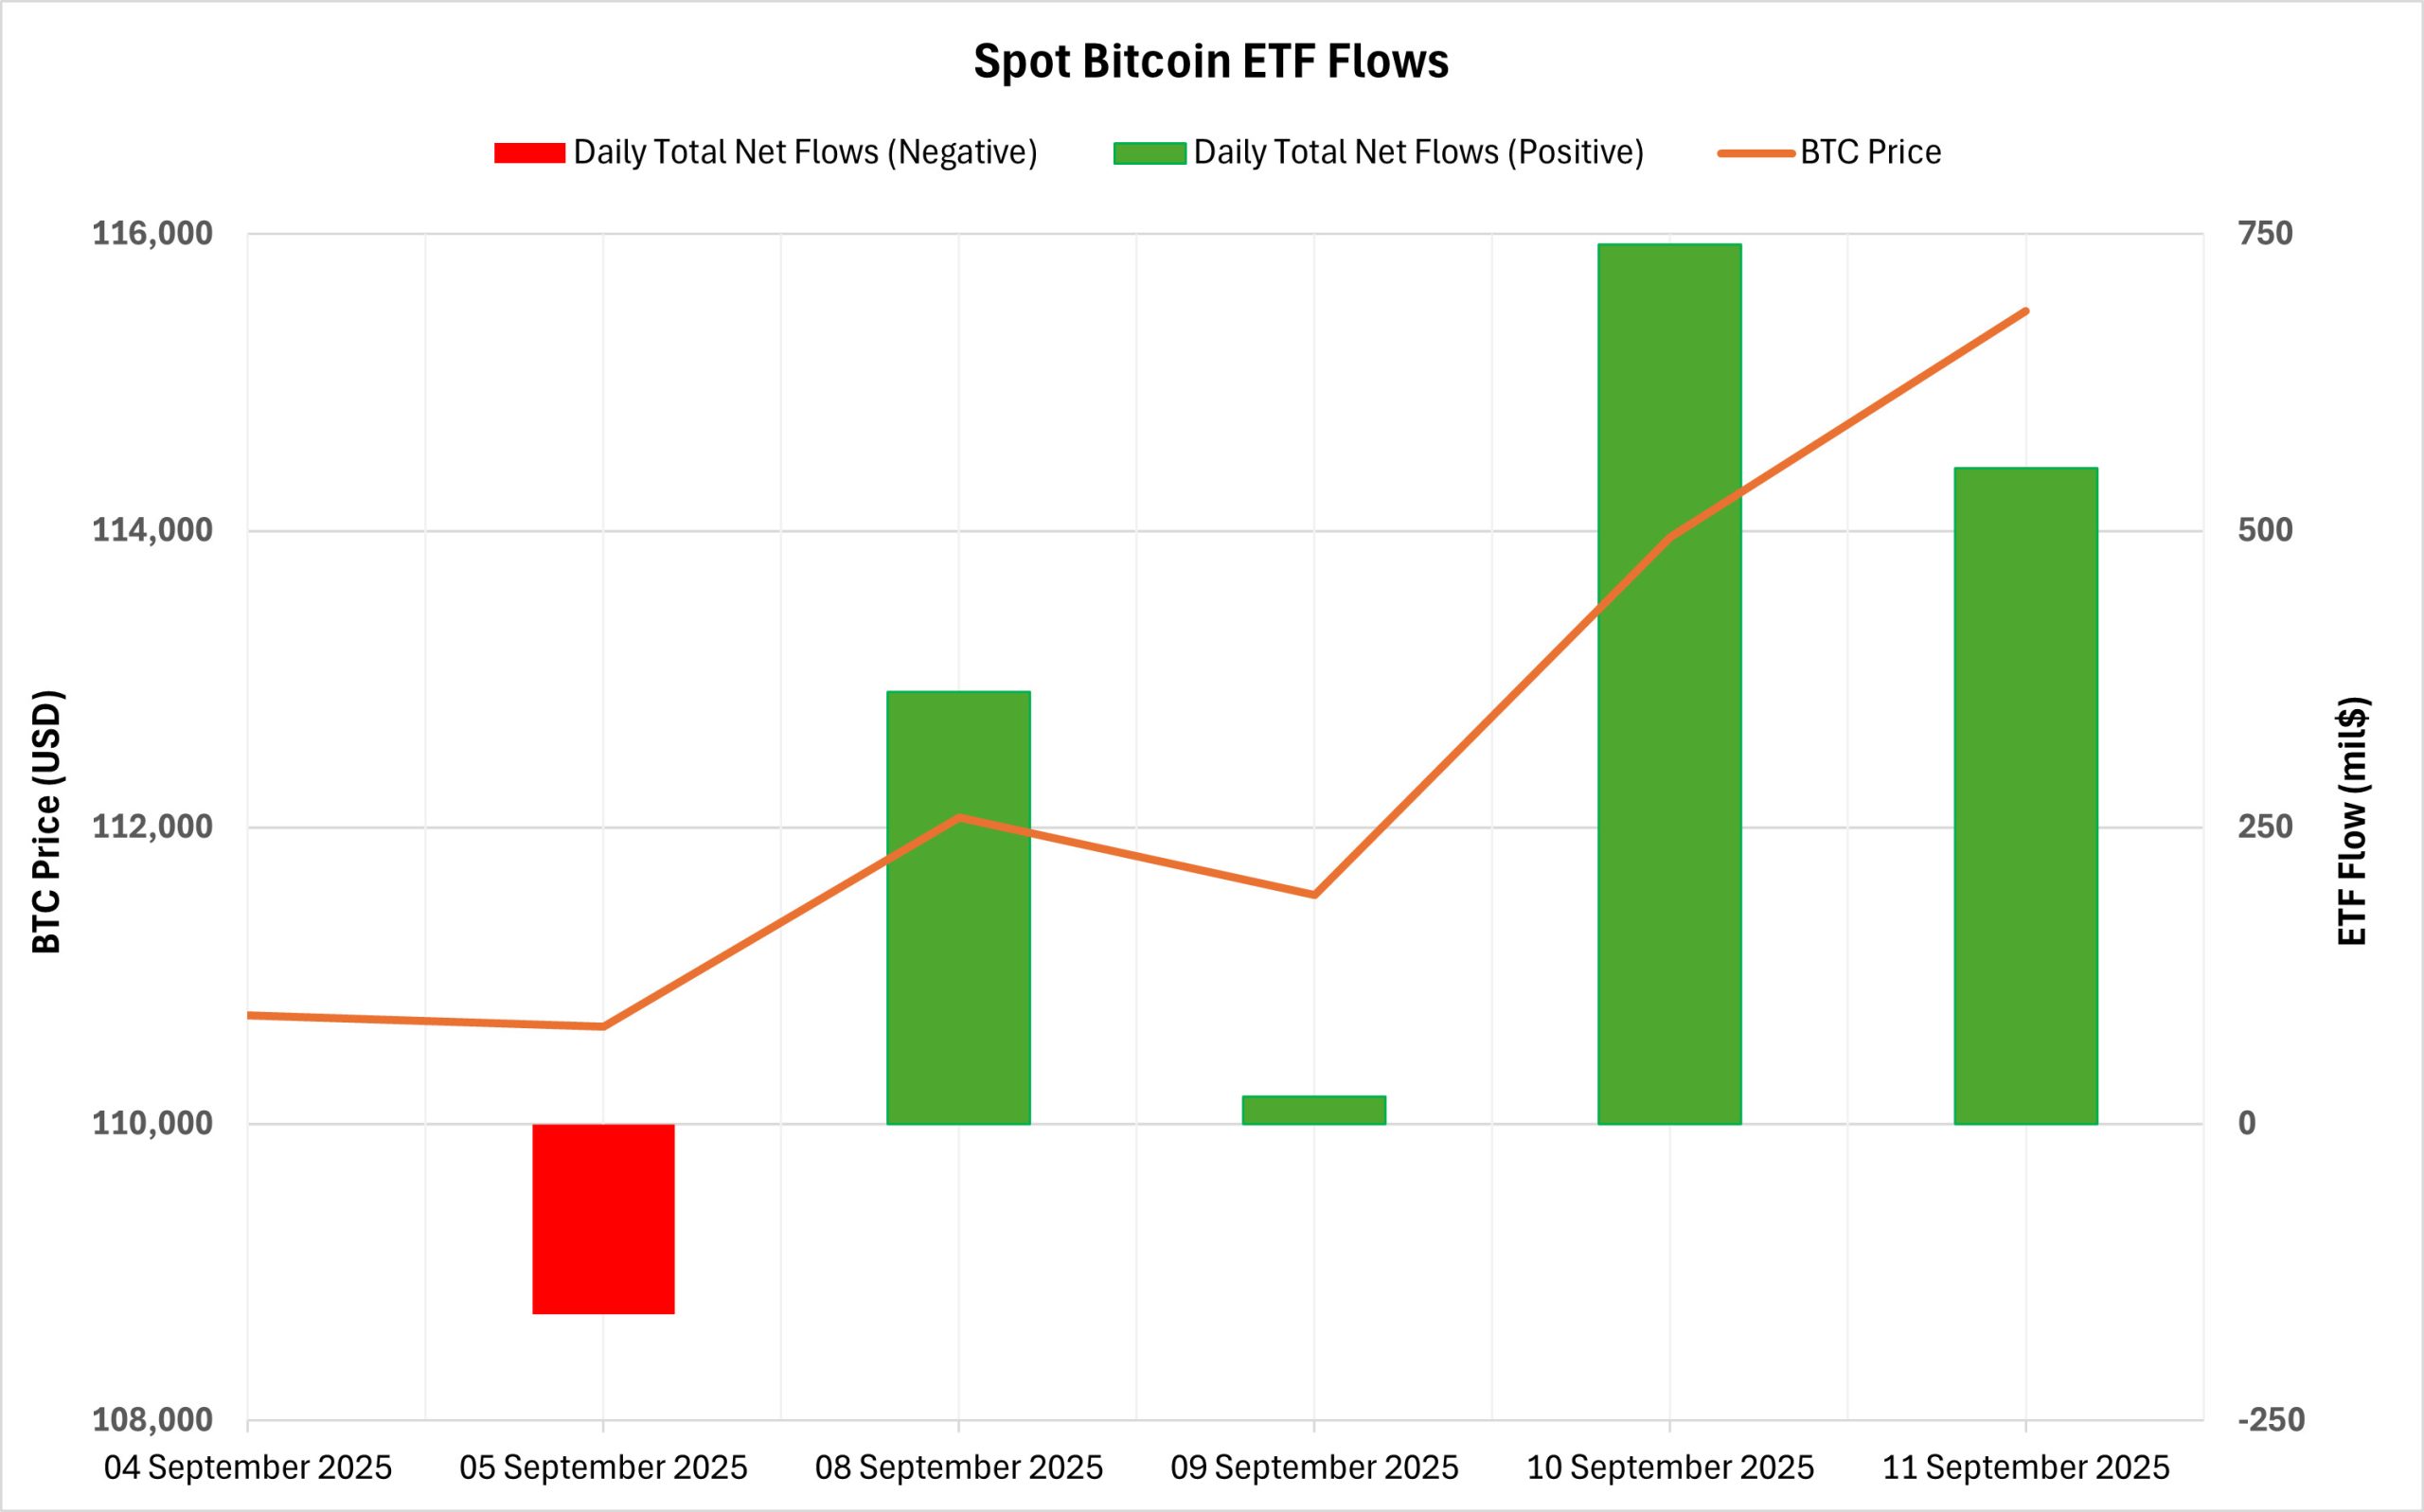
NetFlow Status: There was a total net inflow of $1.521 billion into Spot Bitcoin ETFs between September 05-11, 2025. The strongest daily inflow occurred on September 10 with $741.5 million. On a fund basis, BlackRock IBIT stood out with a net inflow of $709.0 million.
Bitcoin Price: Opening at $110,731 on September 5, Bitcoin closed at $115,482 on September 11. There was a 4.29% increase in this process. Strong ETF inflows, especially on September 10-11, significantly supported the price momentum.
Cumulative Net Inflows: Spot Bitcoin ETFs’ cumulative net inflows rose to $56.15 billion as of the 418th trading day.
| Metrics | Positive 📈 | Negative 📉 | Neutral ➖ |
|---|---|---|---|
| Active Addresses | ✓ | ||
| Total Value Staked | ✓ | ||
| Supply Distribution | ✓ | ||
| Exchange Supply Ratio | ✓ | ||
| Exchange Reserve | ✓ | ||
| Fees and Revenues | ✓ | ||
| Bloks Mined | ✓ | ||
| Transaction | ✓ | ||
| Estimated Leverage Ratio | ✓ |
Ethereum price started at $4,297 on September 5 and closed at $4,458 on September 11. There was a total increase of 3.75% in this process. Despite the outflows in the first two days, the price remained flat, while the momentum turned upwards with the inflows between September 9-11. The re-harmonization of the price with the flows indicates that the selling pressure has eased and demand has recovered. If this positive trend continues, new inflows from the ETF side may continue to support the ETH price.
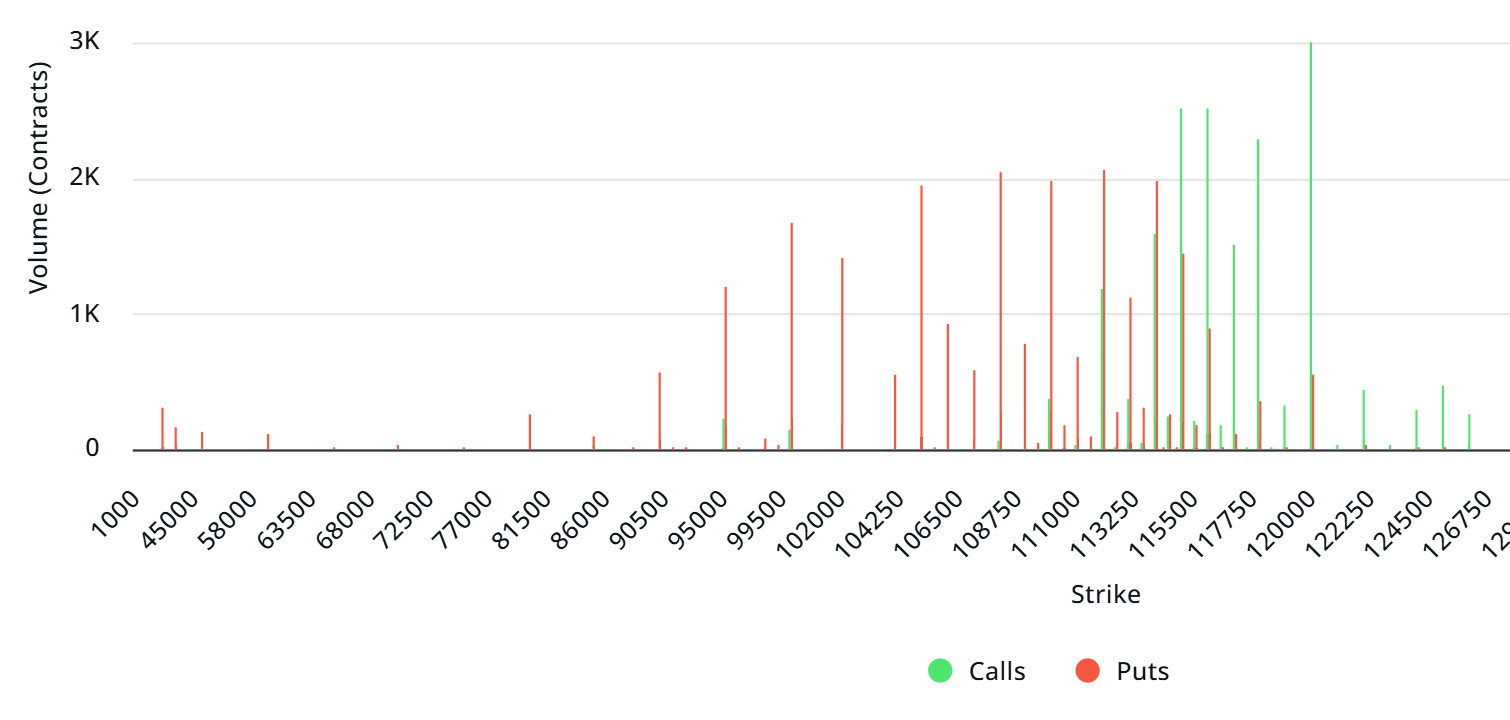
Bitcoin Options Distribution

Source: Laevitas
BTC: Notional: $3.41B | Put/Call: 1.25 | Max Pain: $113K
Deribit Data: Deribit data shows that BTC options contracts with a notional value of approximately $3.41 billion expired today. At the same time, according to the data in the last 24 hours, if we look at the risk conversion in the next 1 week, call options are the dominant side in hedging more than put options. This makes put options cheaper. When we examine the expected volatility, it is above the realized volatility. On the other hand, the positive spread metric indicates that the market has an appetite. Skew values are slightly bearish today and next week.
Laevitas Data: When we analyze the chart, it is seen that put options are concentrated in a wide band between 90,000 – 115,000 dollars. Call options are concentrated between $ 113,000 and $ 120,000 and the concentration decreases towards the upper levels. At the same time, the $ 114,000 level is seen as support and the $ 120,000 level as resistance. On the other hand, there are 2.47K put options at the $ 114,000 level, where there is a peak and there is a decrease in put volume after this level. However, it is seen that 3.69K call option contracts peaked at the $120,000 level. When we look at the options market, we see that put contracts are dominant on a daily and weekly basis.
Option Maturity:
Put/Call Ratio and Maximum Pain Point: If we look at the options in the last 7 days data from Laevitas, the number of call options decreased by about 10% compared to last week and amounted to 92.98K. In contrast, the number of put options stood at 84.41K, down 13% from last week. The put/call ratio for options was set at 1.25. This indicates that put options are much more in demand among investors than call options. Bitcoin’s maximum pain point is seen at $113,000. It can be predicted that BTC is currently priced at $115,100 as of and if it does not break the $113,000 level downwards, which is the pain point, the rises will continue.
Ethereum Options Distribution
Source: Laevitas
ETH: $3.41 B notional | Put/Call: 0.91 | Max Pain: $4,400
Laevitas Data: Looking at the data in the chart, we see that put options are particularly concentrated at the price levels between $4,100 and $4,500. The highest put volume is at $4,100 with around 14K contracts and this level can be considered as a possible support zone. On the other hand, call options are concentrated between $4,500 and $4,800. Especially the $4,500 level stands out with a high call volume of approximately 16.56K contracts. This level can be considered as an important resistance zone in the market.
Deribit Data: ATM volatility is 50.96% and has declined by 4.33% in the last 24 hours. 25 risk reversal of +2.26 indicates that call options are more favorable than puts. 25 butterfly is slightly up at 1.23 and +0.47 points on the day. However, on the daily volume side, call $18.06M, put $17.88M, total 24s options volume $35.94M. The rise in price, together with the positive basis and positive RR, indicates an increased upside risk appetite in the short term. In addition, the decline in ATM vol and the sharp decline in total volume help us infer that momentum is weakening. In short, we can say that the picture is neutral to slightly bullish. However, unless volumes recover, it may be more important to be cautious about the sustainability of the uptrend.
Option Expiration:
Ethereum options with a notional value of $3.41 billion expired on August 29. The Max Pain level is calculated at $4,400, while the put/call ratio stands at 0.91.
Legal Notice
The investment information, comments and recommendations contained in this document do not constitute investment advisory services. Investment advisory services are provided by authorized institutions on a personal basis, taking into account the risk and return preferences of individuals. The comments and recommendations contained in this document are of a general type. These recommendations may not be suitable for your financial situation and risk and return preferences. Therefore, making an investment decision based solely on the information contained in this document may not result in results that are in line with your expectations.
