
Weekly Fundamental Analysis Report
Fear & Greed Index
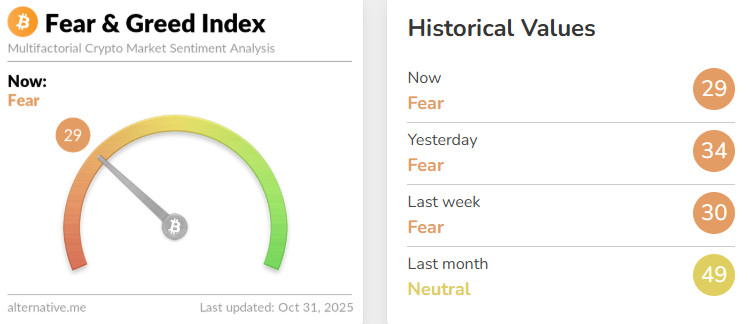
Source: Alternative.me
- Change in Fear and Greed Value: -1
- Last Week’s Level: 30
- This Week’s Level: 29
Sentiment in the crypto market closed the week in the fear zone. Although inflows into spot products brought a brief recovery, the sharp net outflows in the middle reversed this improvement, and the perception of fear resurfaced as Bitcoin tested the $108,000 level. The FOMC’s decision to cut interest rates by 25 basis points provided limited support to pricing, while the lack of guarantees for further cuts in forward-looking messages dampened risk appetite. The US-China leaders’ meeting resulted in a reduction in tariff rates, the removal of barriers to rare earths, dialogue on chip restrictions, and an emphasis on cooperation on fentanyl and Ukraine, reducing the likelihood of tension, weakening safe-haven demand, and opening space for risky assets. On the corporate front, Coinbase’s revenue of $1.87 billion, exceeding expectations, showed that transaction and custody revenues were carried even during periods of weak volume, reducing doubts about the sector’s profitability. Strategy’s revenue of $128.7 million, exceeding consensus, and maintaining its year-end Bitcoin target of $150,000 supported the thesis of institutional demand. On the liquidity side, Bitmine’s purchase of 44,036 ETH during the decline reinforced the perception that the buyer base in Ethereum is strengthening. In summary, flow volatility is dominant, policy communication is cautious, and institutional news flow is balancing; the index is maintaining its near-flat trajectory at the 29 level.
Fund Flows
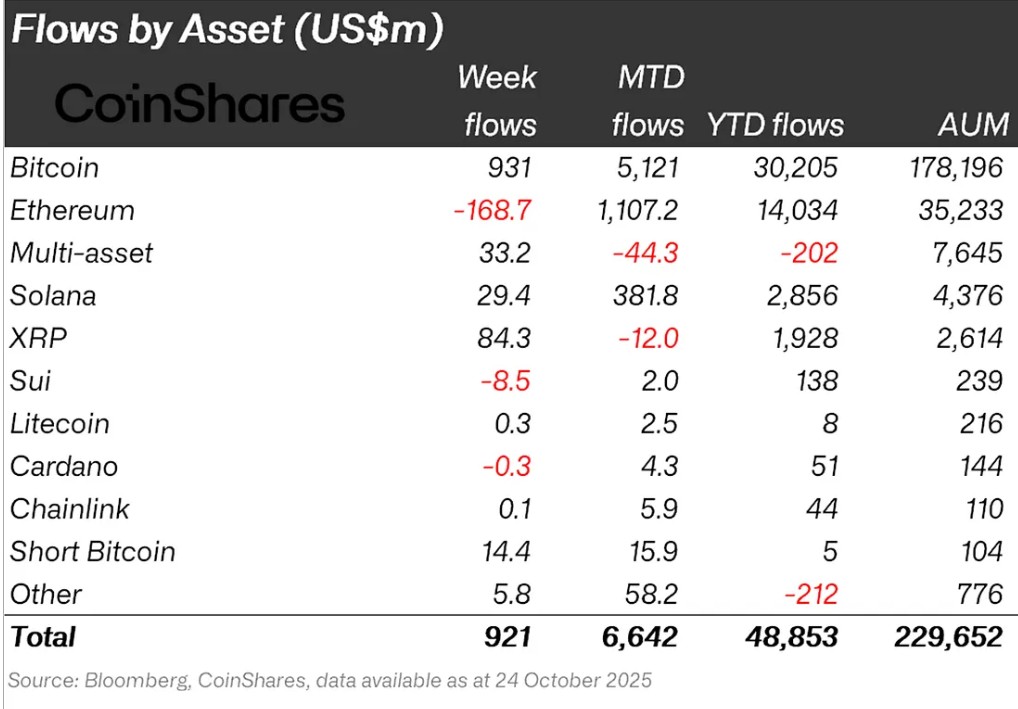
Source: CoinShares
Overview: Crypto markets started the week down despite the interest rate cut, Fed Chair Powell’s positive statements, and positive customs agreements with China. As a result of these developments, Bitcoin lost approximately 7% of its value during the week.
Bitcoin (BTC): Bitcoin saw inflows from investors this week. Although the interest rate cut in global markets, the customs agreement with China, and general market optimism supported inflows into Bitcoin, only $931 million flowed into Bitcoin-focused funds this week.
Ripple (XRP): XRP saw $84.3 million in fund inflows this week.
Solana (SOL): Solana saw inflows of $156.1 million.
Chainlink (LINK): Chainlink continues to strengthen its potential by providing reliable data and updates to the tokenization and DeFi sectors. This week, there was an inflow of $1.8 million into Link.
Litecoin (LTC): LTC saw $1.0 million in inflows.
Short Bitcoin: Short Bitcoin saw $14.4 million in inflows.
Multi-asset: Inflows were observed in the multi-asset group.
Other: Sector-specific and project-based increases in altcoins, along with the general market outlook, brought in $14.6 million in fund flow data.
Fund Outflows:
Ethereum (ETH): Due to spot ETH outflows, there was a $168.7 million outflow from Ethereum this week.
Cardano (ADA): Cardano saw an outflow of $0.3 million this week.
SUI: A token unlock is scheduled for November 1st on Sui. This led to an outflow of approximately $8.5 million from Sui.
Total MarketCap
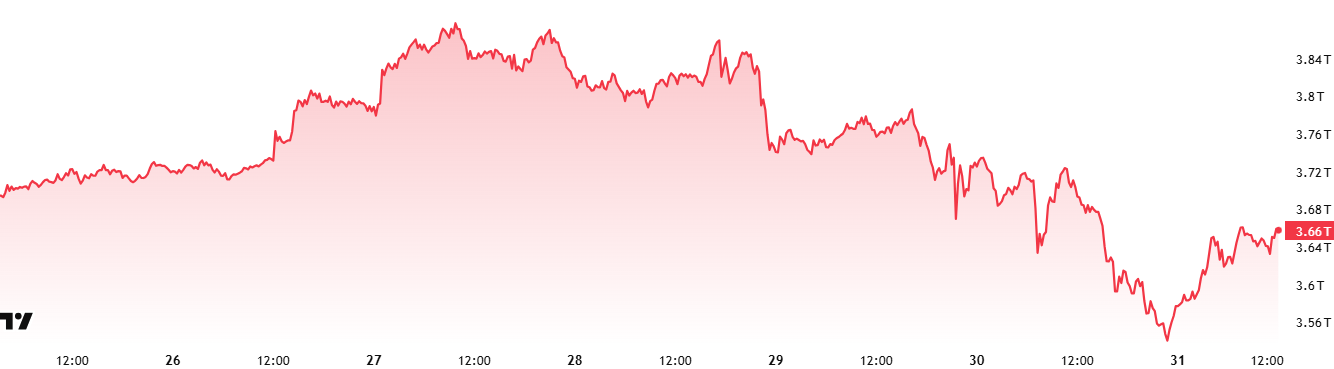
Source: Tradingview
- Last Week’s Market Value: $3.83 Trillion
- This Week’s Market Value: $3.66 Trillion
This week, the cryptocurrency market fell by approximately 169 billion dollars, or 4.41%, and the total market value declined to 3.66 trillion dollars. The weekly peak was recorded at 3.9 trillion dollars, while the lowest level was 3.53 trillion dollars. Thus, the market was observed to move within a band of approximately $368 billion. This indicates volatility within a band of approximately 10% on a weekly basis. This shows that the market moved within a relatively wider range compared to last week’s 8.8% movement band.
Total 2
Starting the week with a market value of $1.55 trillion, Total 2 declined by 5.38% during the week, falling to $1.46 trillion with a loss of approximately $83 billion. The highest level during the week was $1.58 trillion, while the lowest level was $1.41 trillion. Thus, the index moved within a fairly wide band of $168 billion over the period. This shows that Total 2 moved within an 11.97% band during the period, experiencing a more volatile week compared to both the previous week and the Total index.
With the pullback movement that occurred during this period, the Total 2 index is now more than 20% below its all-time high.
Total 3
Starting the week with a market value of $1.04 trillion, Total 3 lost approximately $46 billion in value during the week, falling 4.42% and closing the period at $0.997 trillion. A difference of 10.3% emerged between the highest and lowest values during the week. According to this calculation, Total 3 lost the title of “most volatile index” to the Total 2 index, which showed 11.97% volatility this week, as it did last week .
While the market generally presented a negative outlook, the strongest performance was observed in the Total and Total 3 indices, which showed almost the same rate of change. This picture shows that Ethereum’s weight in the ecosystem has decreased and that the weekly average returns of other altcoins remained stronger compared to Ethereum. Additionally, it is noteworthy that Bitcoin presents a more moderate picture compared to Ethereum. It appears that Ethereum’s market dominance over altcoins has continued to decline this week, as it did in the previous three weeks.
Altcoin Season Index
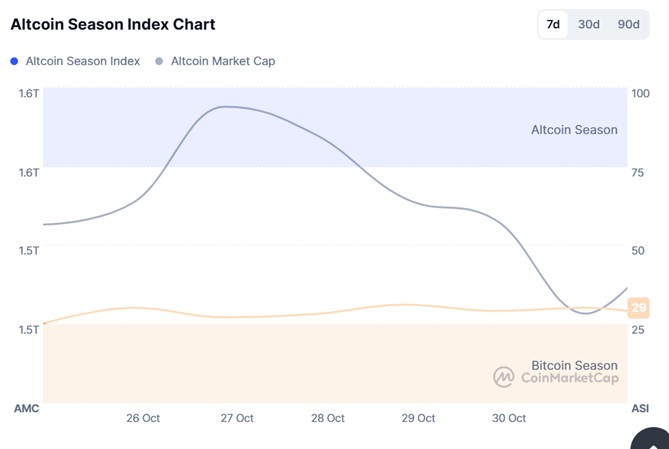
Source: Coinmarketcap
- Last Week’s Index Value: 23/100
- This Week’s Index Value: 30/100
Between October 24 and October 31, 2025, there was an increase in the correlation between altcoin market dominance (Altcoin Market Cap) and the Altcoin Season Index. The graph shows that this week, on October 30 , the index pulled back to 30, with Altcoin Market Cap reaching 1.74T. This indicates an upward trend in the market dominance of altcoins. When the index rose this week, the top 5 coins leading the rise were Aster, Zec, H, M, and OKB. On October 31, the index rose from 23 to 30, indicating a short-term upside potential for the altcoin season.
Bitcoin Dominance
Source: Tradingview
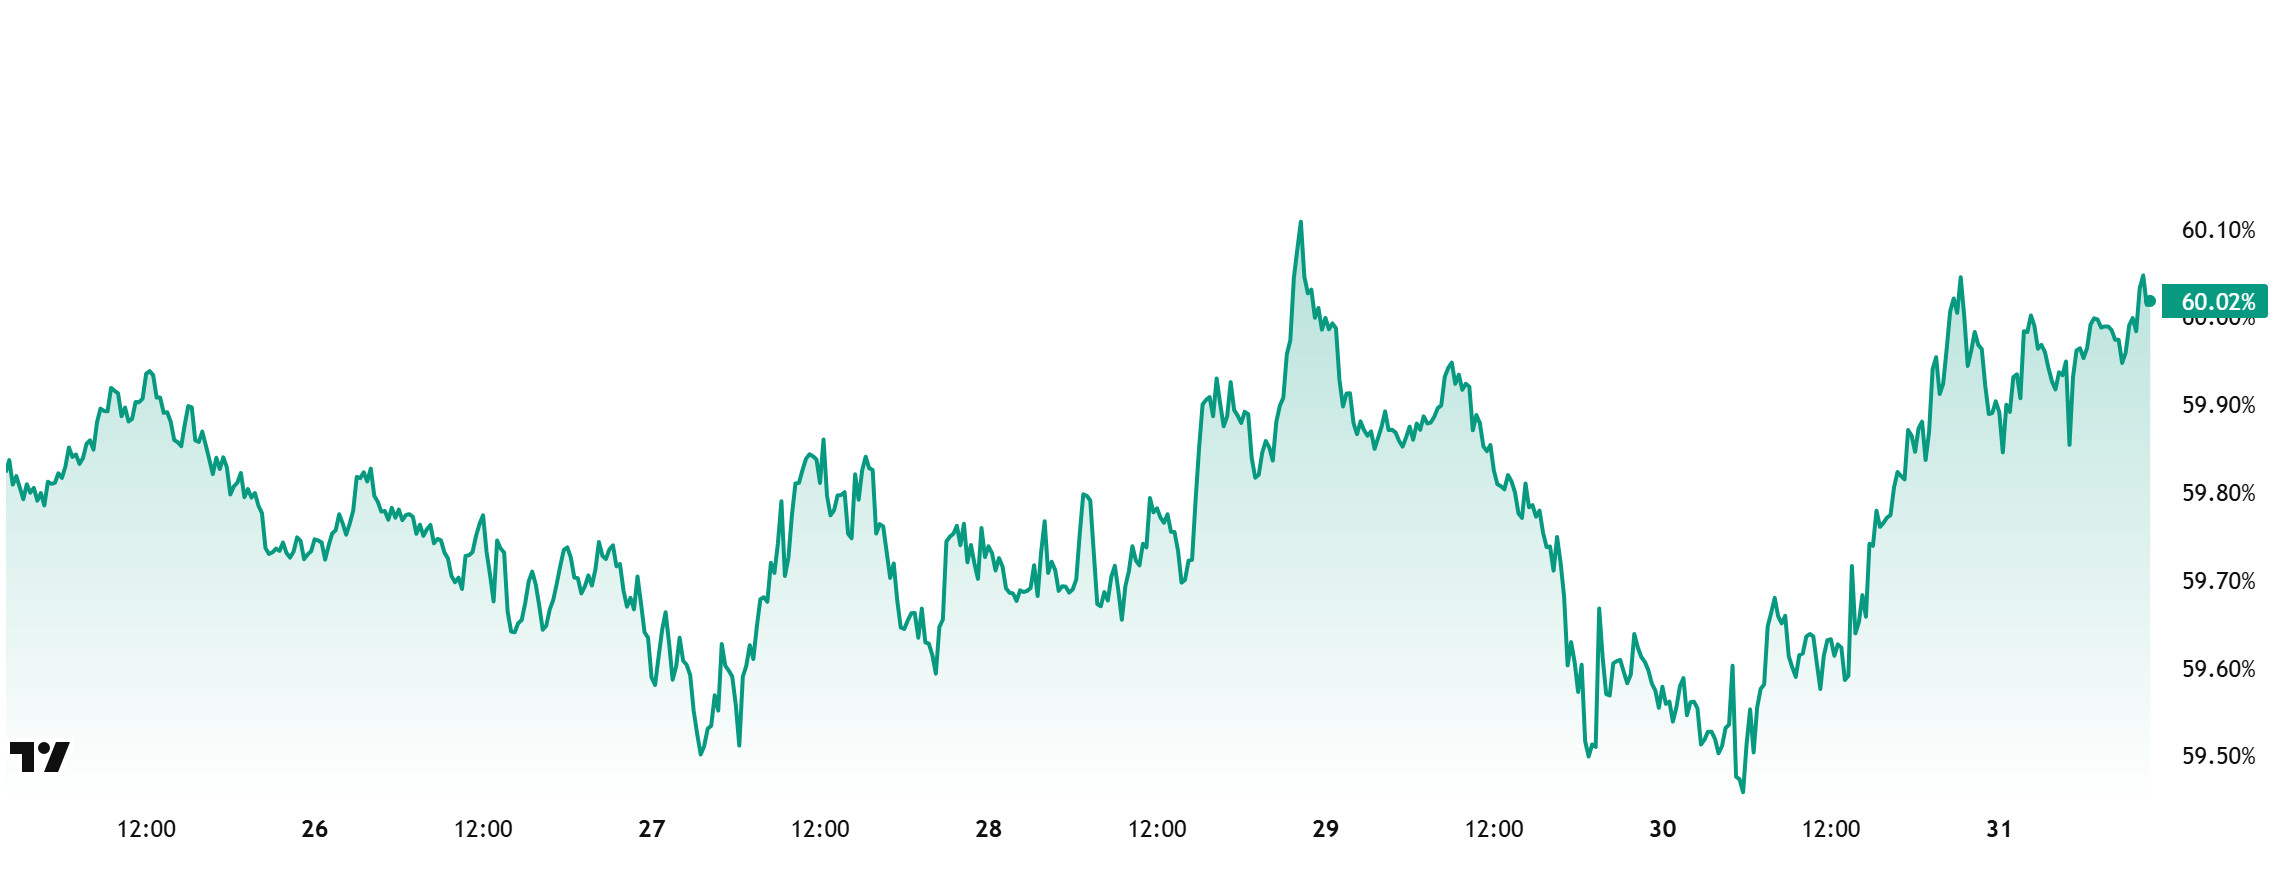
Bitcoin dominance started the week at 59.64% and rose to 60.17% during the week but then fell back slightly and is currently at 60.02%.
This week, Strategy purchased 390 Bitcoin and Strive purchased 72 Bitcoin. Additionally, data on Bitcoin spot ETFs shows a net outflow of $488.4 million to date.
Throughout the week, the weakening of Bitcoin purchases by institutional investors continued, while retail investors trading through the spot ETF channel also showed an increased tendency to close their positions.
The volatile outlook, with markets still searching for direction, is causing a slowdown in capital inflows into Bitcoin. The recent net outflows observed in spot ETFs indicate that selling pressure may increase in the short term. The weak capital inflows are limiting the buying momentum on Bitcoin. However, Bitcoin is showing a more resilient performance in the short term compared to Ethereum and other major altcoins. If institutional demand continues to grow cautiously, BTC dominance is expected to maintain its strong structure. Accordingly, it is predicted that Bitcoin’s market dominance will have limited upside potential in the short term and will continue its consolidation process in the 58%–61% range next week.
Ethereum Dominance
Source: Tradingview
Weekly Change:
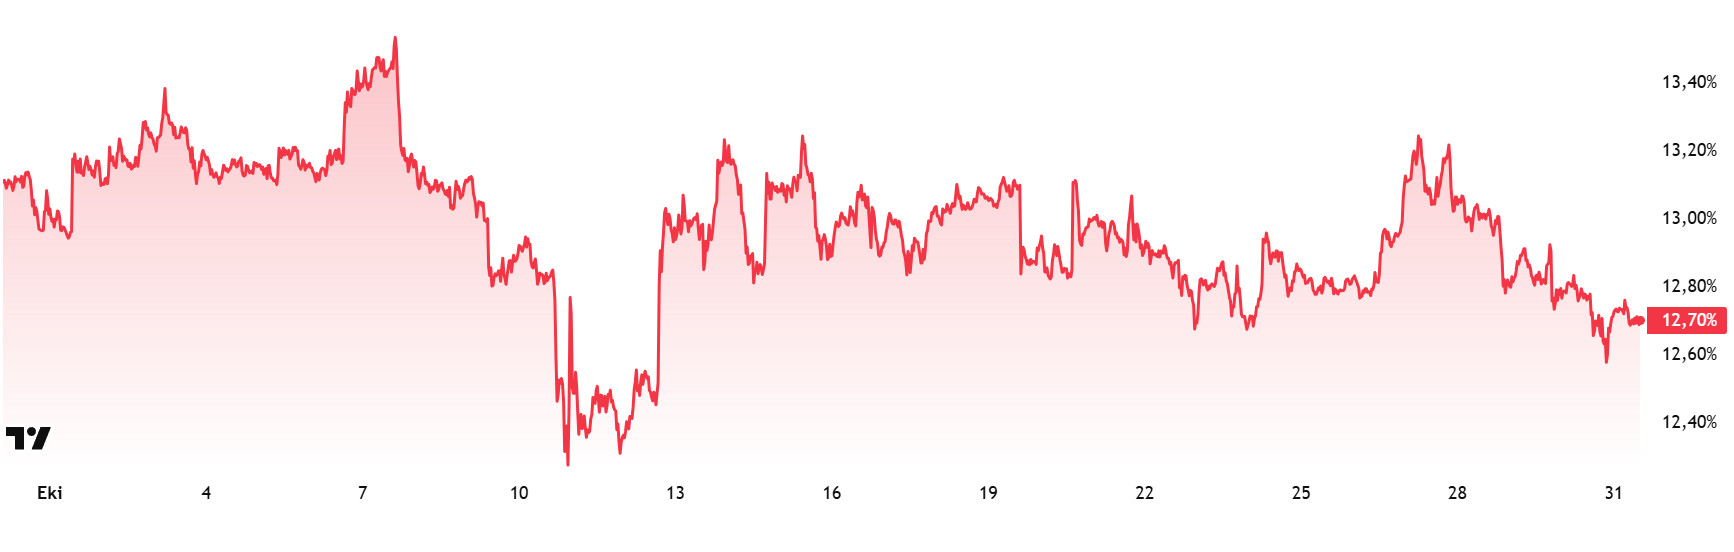
- Last Week’s Level: 13.11%
- This Week’s Level: 12.70%
Ethereum dominance, which rose to 15% levels in mid-August, lost momentum in the following period and entered a downward trend, which continues as of this week.
Accordingly, Ethereum dominance ended last week at 13.11%, and based on current data, it is trading at around 12.70%.
During the same period, Bitcoin dominance followed a positive trend, unlike Ethereum.
The key developments affecting Ethereum dominance are as follows:
The Ethereum Foundation announced December 3, 2025, as the official date for the next mainnet hard fork, “Fusaka.” According to developers, the upgrade will increase efficiency, reduce transaction costs, and strengthen Layer-2 compatibility. Fusaka is considered a critical step in Ethereum’s scalability roadmap. Crypto mining company BitMine announced that it holds 3,313,069 ETH (at an average cost of $4,164).
Bitcoin Spot ETF
Source: Darkex Research Department
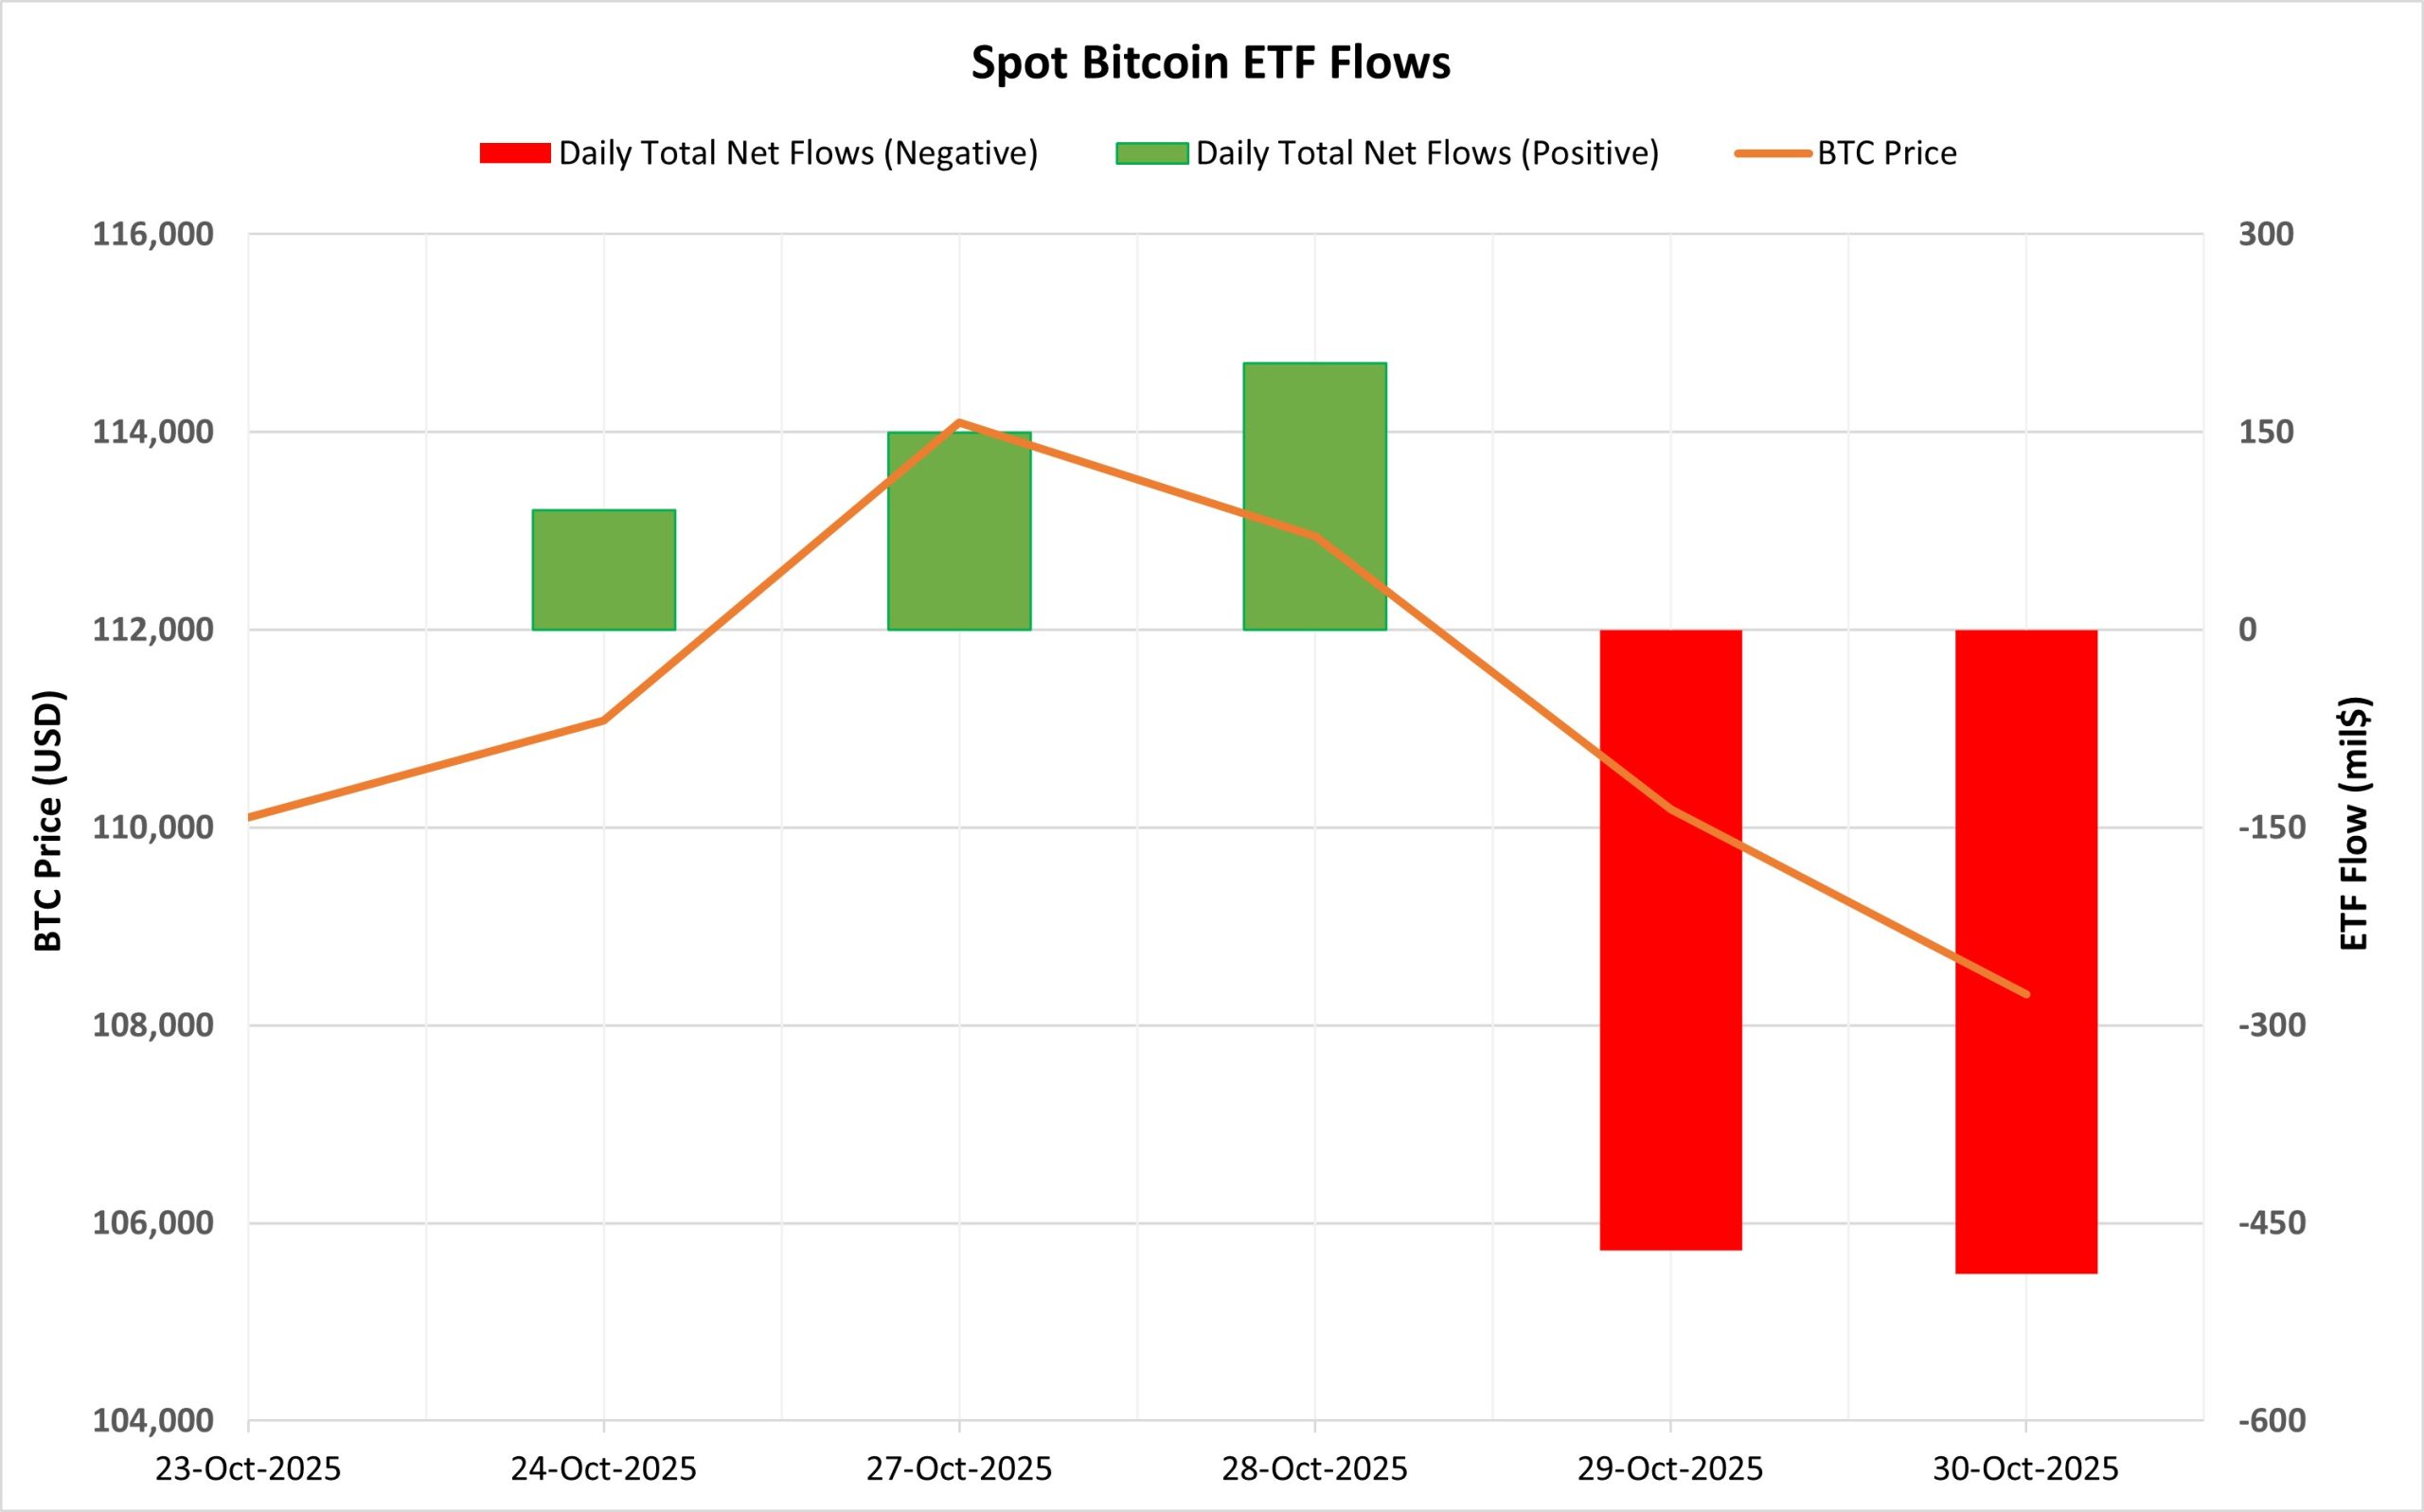
Netflow Status: Between October 24-30, there was a total net outflow of $516.8 million from Spot Bitcoin ETFs. Although flows started positively during this period, gaining momentum briefly with a net inflow of $202.4 million on October 28, the total outflow of $959 million on October 29 and 30 turned the outlook negative. By fund, BlackRock IBIT led with a net outflow of $221.4 million, followed by Fidelity FBTC with a net outflow of $86 million.
Bitcoin Price: Bitcoin opened at $110,105 on October 24 and closed at $108,309 on October 30. During this period, the price declined by 1.63%. The heavy outflows seen in the last two trading days put pressure on the price.
Cumulative Net Inflow: By the end of the 453rd trading day, the cumulative total net inflow into Spot Bitcoin ETFs fell to $61.34 billion.
| DATE | COIN | PRICE | ETF Flow (mil$) | ||
| Open | Close | Change % | |||
| October 24, 2025 | BTC | 110,105 | 111,081 | 0.89 | 90.6 |
| October 27, 2025 | 114,552 | 114,098 | -0.40% | 149.3 | |
| October 28, 2025 | 114,098 | 112,940 | -1.01% | 202.4 | |
| October 29, 2025 | 112,940 | 110,187 | -2.44% | -470.7 | |
| October 30, 2025 | 110,187 | 108,309 | -1.70% | -488.4 | |
| Total for Oct 24-30, 2025 | -1.63% | -516.8 | |||
Between October 24-30, profit-taking and cautious positioning stood out in the ETF market. Short-term inflows seen on October 28 gave way to sharp outflows without signaling a strong recovery. The lack of direction in flows during this period of weakened risk appetite among institutional investors created a temporary cooling in market confidence. If fund inflows recover steadily, Bitcoin’s market outlook could strengthen. However, continued outflows could continue to put pressure on prices in the medium term.
Ethereum spot ETF
Source: Darkex Research Department
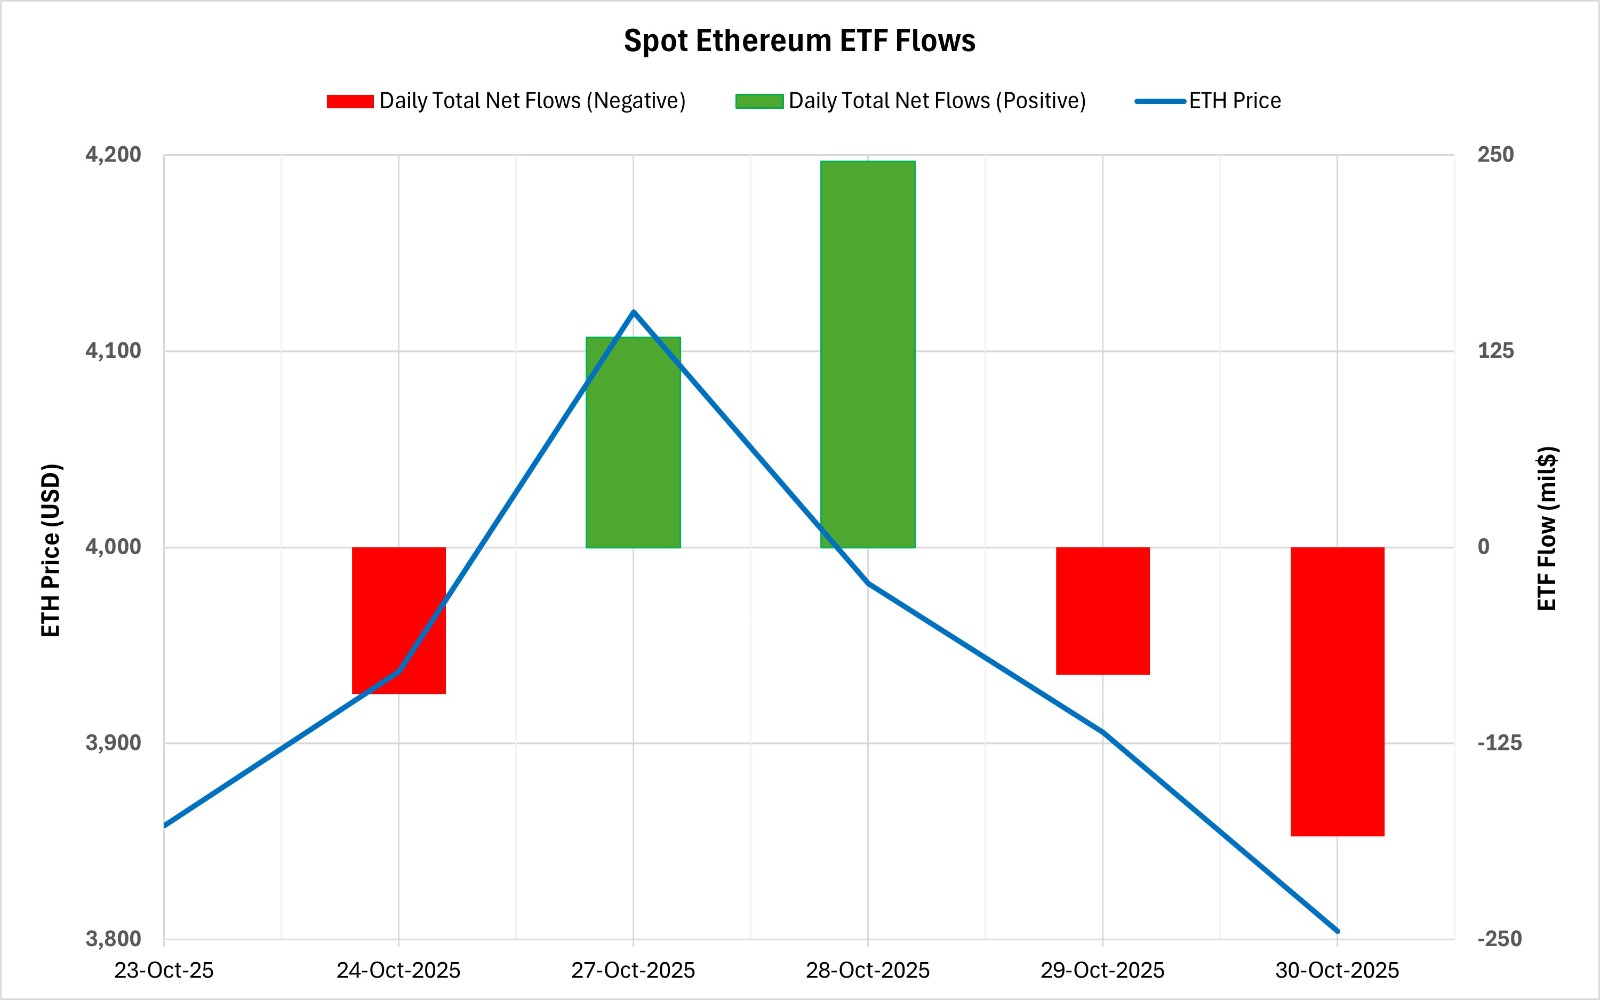
Between October 24-30, 2025, there was a total net inflow of $20.7 million into Spot Ethereum ETFs. The strongest daily inflow occurred on October 28, with $246 million. In terms of funds, BlackRock ETHA saw a net outflow of $48.7 million, while GrayScale ETH saw a net inflow of $75.5 million. No clear direction emerged in the flows, and short-term fluctuations prevailed. At the end of the 321st trading day, the cumulative total net inflow of Spot Ethereum ETFs rose to $14.485 billion.
| DATE | COIN | PRICE | ETF Flow (mil$) | ||
| Open | Close | Change % | |||
| October 24, 2025 | ETH | 3,858 | 3,937 | 2.04% | -93.6 |
| October 27, 2025 | 4,159 | 4,120 | -0.93% | 133.9 | |
| October 28, 2025 | 4,120 | 3,981 | -3.36% | 246 | |
| October 29, 2025 | 3,981 | 3,906 | -1.90% | -81.4 | |
| October 30, 2025 | 3,906 | 3,804 | -2.60% | -184.2 | |
| Total for October 24-30, 2025 | -1.40% | 20.7 | |||
The Ethereum price opened at $3,858 on October 24 and closed at $3,804 on October 30. During this period, the Ethereum price lost 1.40% of its value. The continued volatility in prices paralleled the uncertain nature of ETF flows. In particular, the outflows seen in the last two days of the week showed that investors remained cautious in the short term. Overall, while no clear trend emerged in flows, investor behavior remained cautious. If fund inflows regain steady momentum in the coming weeks, this could support Ethereum’s market outlook. However, if the current volatile structure persists, weak momentum on the ETF side could continue to put pressure on the price.
Bitcoin Options Distribution
Source: Laevitas
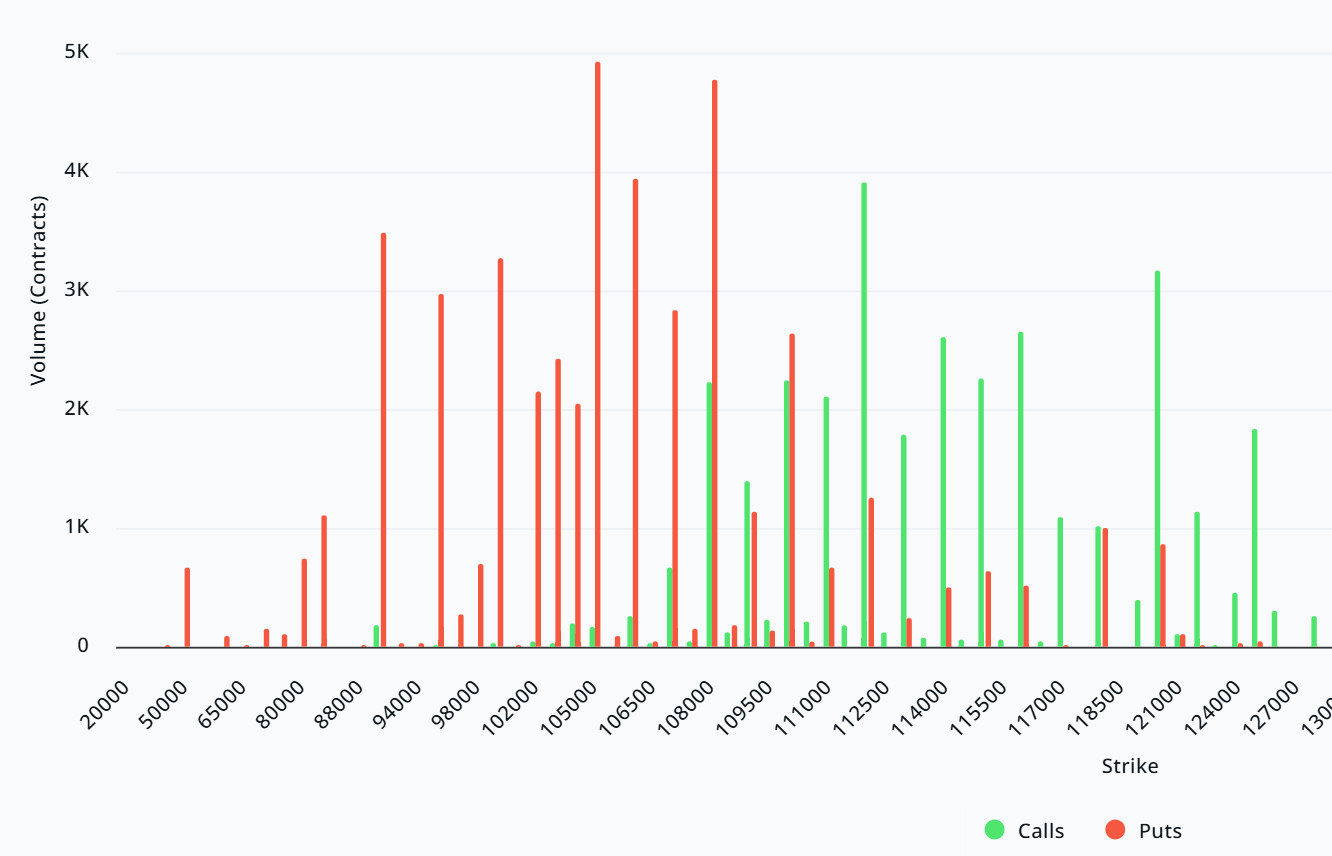
BTC: Notional: $13.38B | Put/Call: 0.73 | Max Pain: $114K
Deribit Data: Deribit data shows that BTC option contracts with a notional value of approximately $13.38 billion expire today. At the same time, looking at the risk transformation over the next week based on data from the last 24 hours, put options are dominating over call options in terms of risk hedging. However, call options have been on the rise recently. Despite the prevailing negative outlook today, call options have been increasing throughout the week. When examining the implied volatility (IV), it is significantly higher than the realized volatility (RV). On the other hand, the positive trend in the spread metric indicates increased risk appetite in the market, suggesting that call options are expensive. Skew values are pointing downward today and for the coming week.
Laevitas Data: Examining the chart, we see that put options are concentrated in a wide band between $90,000 and $110,000. Call options, on the other hand, are concentrated between $108,000 and $120,000, with concentration decreasing towards higher levels. At the same time, the $108,000 level appears to be support, while the $112,000 level appears to be resistance. On the other hand, there are 4.94K put options at the $105,000 level, peaking here and showing a decrease in put volume after this level. Meanwhile, 3.9K call option contracts peak at the $112,000 level. Looking at the options market, we see that put contracts dominate on a daily and weekly basis.
Option Maturity
Put/Call Ratio and Maximum Pain Point: Looking at the options in the latest 7-day data from Laevitas, the number of call options increased by approximately 14% compared to last week, reaching 181.10K. In contrast, the number of put options decreased by 28% compared to last week, reaching 131.65K. The put/call ratio for options is set at 0.73. This indicates that there is less demand for call options than put options among investors. Bitcoin’s maximum pain point is seen at $114,000. BTC is currently priced at $109,500, and if it fails to break above the pain point of $114,000, a continued decline is foreseeable.
Ethereum Options Distribution
Source: Laevitas
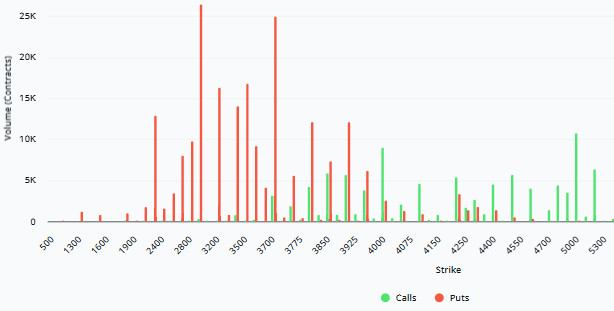
ETH: $2.4 B notional | Put/Call: 0.72 | Max Pain: $4,100
Laevitas Data: Looking at the data in the chart, we see that put options are concentrated in a fairly wide band between the $3,000 and $3,700 price levels. The highest put volume is at the $3,000 level, with approximately 27K contracts. We can understand that the increase in the number of put contracts here is for protection against possible sudden price movements, as the concentration zone is spread over a wide band. Looking at the number of put contracts closest to this level and at the price, the $3,700 level can be considered a support zone with approximately 25K contracts. On the other hand, in call options, there is a noticeable concentration between $3,800 and $4,000. The $4,000 level stands out with a high call volume of approximately 9K contracts. This level can be considered an important resistance zone in the market.
Deribit Data: Looking at ATM volatility, we see it at 61.08 and down 8.30% over the last 24 hours. This indicates some short-term pressure on option premiums and a slight easing in volatility pricing. The 25 delta risk reversal (RR) value is at -4.58, showing a 4.58% decline when evaluated daily. Therefore, it indicates that the market’s demand for put options is still stronger than that for call options, meaning that market players find downside risks quite high in the short term and are managing risk accordingly. Looking at the open interest (OI) side, we see that it is at $92.42 million and has increased by 87.76%. This increase shows that the number of players in the market is still actively rising.
Option Maturity:
Ethereum options with a nominal value of $2.4 billion expired on October 31. The Max Pain level was calculated at $4,100, while the put/call ratio stood at 0.72.
Legal Notice
The investment information, comments, and recommendations contained in this document do not constitute investment advisory services. Investment advisory services are provided by authorized institutions on a personal basis, taking into account the risk and return preferences of individuals. The comments and recommendations contained in this document are of a general nature. These recommendations may not be suitable for your financial situation and risk and return preferences. Therefore, making an investment decision based solely on the information contained in this document may not result in outcomes that align with your expectations.
