
Technical Analysis – January 5, 2026 – Evening
BTC/USDT
The pullback in US Treasury yields signals a reshaping of expectations regarding the interest rate path, while on the political front, attacks on US Vice President J.D. Vance have brought internal security concerns to the forefront. On the crypto asset side, the emphasis on Bitcoin reserves from the Venezuelan opposition, the divergence in institutional investor inflows, and large-scale companies’ Bitcoin accumulation strategies are noteworthy.
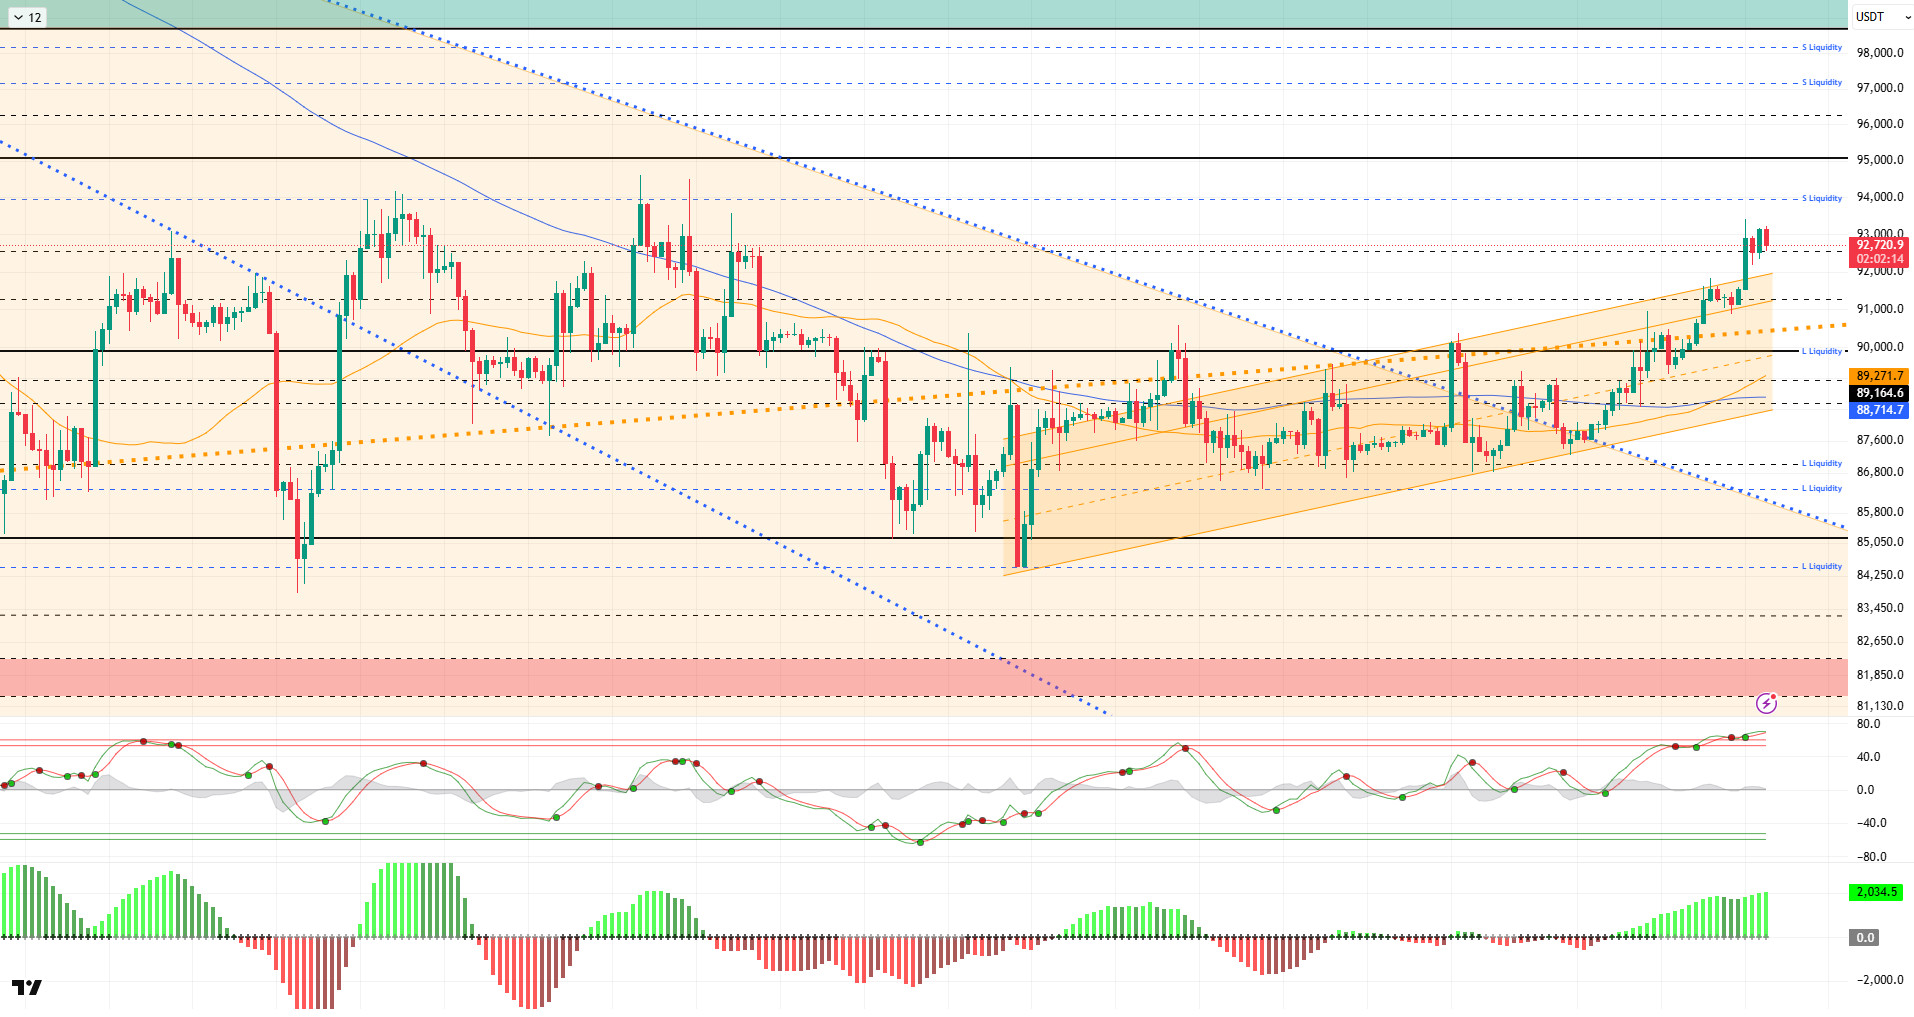
From a technical perspective, BTC finally managed to break through the 90,000 level it had been pushing parallel to its upward channel. The price first broke out of the orange band it had formed since its ATH level, then surpassed the 90,000 level we were tracking as a reference, and finally managed to break through the majorAA uptrend. Maintaining its upward momentum, the price tested the 93,400 level. At the time of writing, BTC continues to trade at the 92,500 level, showing no significant change during the day.
Technical indicators draw attention with the buy/sell signals given by the Wave Trend (WT) oscillator in the overbought zone, while the histogram in the Squeeze Momentum (SM) indicator’s attempt to move back into positive territory was successful and gained momentum. The Kaufman Moving Average (KAMA) has now crossed below the price level at $91.258.
Looking at liquidation data, buy-side transactions have accumulated heavily in the short term at the $90,000 level, with accumulation continuing at the $86,000–$87,000 level. In contrast, sell-side transactions have been liquidated in the short term at the $89,000–$90,000 level. In a broader time frame, long-term trades in the 91,000–93,500 band have been cleared.
In summary, tensions between the US and Venezuela escalated significantly with the capture of President Maduro. Maduro, who is to be tried in the US today, received messages of support from China and Russia on the international stage. Meanwhile, it was claimed that Venezuela was accepting payments in BTC and USDT to avoid sanctions. While negotiations on the Russia-Ukraine front reached an impasse, on the economic front, the BoJ president raised interest rates, while the Fed issued cautious messages. Examining liquidity data, long-term transactions were liquidated following the price breakout after areas of intense short-term trading. In technical terms, BTC started the new year with positive momentum, continuing its parallel movement with the upward channel and rising to the 93,500 level. With limited profit-taking from this point, the price retreated to the 92,600 region. In the next phase, regaining the 92,600 level and hourly closes above this level could support the continuation of the upward trend, paving the way for the price to test the 94,000 resistance. Although technically the upside space is narrowing, the current momentum will continue to be monitored as an important driving force for the price to sustain its rise. In the event of potential selling pressure, the 91,400 support zone will come to the fore in the first stage, and if this level is broken downwards, the 90,000 reference level will be monitored as the next critical support.
Supports: 91,400 – 90,000 – 89,000
Resistances: 92,600 – 94,000 – 95,000
ETH/USDT
Despite continuing its upward trend during the day, the ETH price faced selling pressure at the $3,180 level. The pullback accelerated with the reaction from this area, and the price fell back below the $3,150 band. This movement indicates that the market has entered a natural balancing process after the strong rally seen on Friday and thereafter. The price retreating in a controlled manner rather than a sharp breakdown suggests that sellers are struggling to exert pressure.
There is no significant unwinding accompanying the pullback on the liquidity side. The Chaikin Money Flow (CMF) did not weaken significantly during the decline. This picture shows that despite the price pullback, there has been no strong outflow of money from the market. The fact that liquidity is being preserved supports the view that the current move is not panic-driven and is more of a technical correction.
The momentum front also aligns with this picture. The Relative Strength Index (RSI) is moving downward from the overbought zone it reached during the previous rally. This pullback in the RSI parallels the decline in price and indicates that the overheating is being tempered. The cooling of momentum does not mean that the uptrend has ended, but it does point to a more cautious pricing process in the short term.
The technical outlook remains largely intact from the Ichimoku indicator perspective. Although the loss of the Tenkan level signals short-term weakness, the price is still above the Kumo cloud and the Kijun level remains valid. This structure indicates that the main trend has not yet broken down and that the pullback remains a limited correction. As long as pricing remains above the cloud, the technical picture continues to remain positive.
In the overall assessment, the $3,111 level is a critical threshold in terms of intraday price behavior. As long as it stays above this level, further upward moves can be expected for the price. Conversely, if it falls below $3,111, the correction could turn into a deeper correction. The current outlook indicates that the ETH price is taking a breather after a strong rally but has not yet lost its main direction.
Supports: 3,074 – 3,019 – 2,910
Resistances: 3,227 – 3,368 – 3,478

XRP/USDT
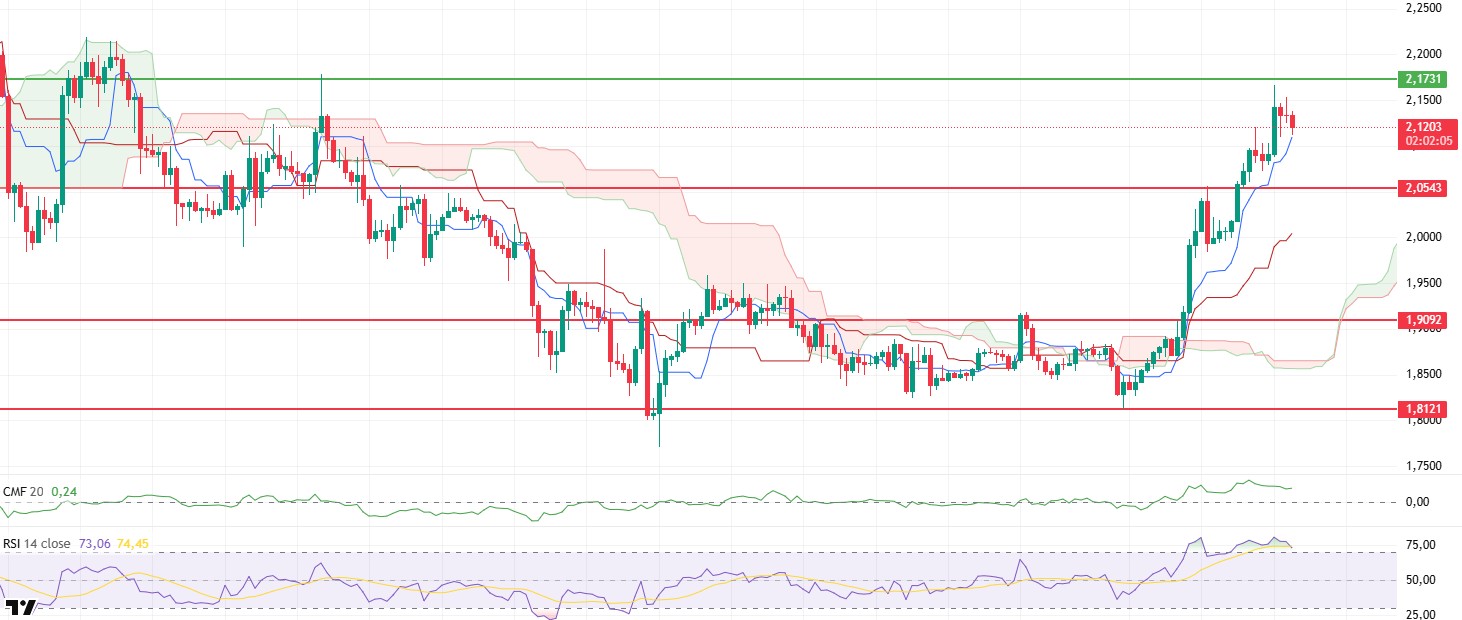
The XRP price failed to hold steady in the areas it tested upward during the day. After encountering selling pressure at the $2.15 level, the price retreated slightly and is currently seeking equilibrium around $2.12. This volatility appears to be a brief pause following a strong move.
The liquidity picture remains supportive. The Chaikin Money Flow (CMF) remains in positive territory despite intraday pullbacks. The slight weakening in the indicator suggests that buying momentum has slowed, but it also indicates that the money entering the market has not completely withdrawn. The preservation of liquidity flow stands out as one of the key reasons why the price remains limited in its downward movements.
On the momentum front, a more cautious outlook has begun to emerge. The Relative Strength Index (RSI) remains in overbought territory but has turned downward. This pattern indicates not that the upward momentum has lost its strength, but that the overheating has been balanced out. This movement in the RSI may pave the way for the price to follow a calmer and more volatile course in the short term.
The technical structure remains positive from the Ichimoku indicator perspective. The price continues to stay above the Kumo cloud, with the Tenkan and Kijun levels below. This outlook indicates that there is no breakdown in the main trend yet and that pullbacks remain within technical correction limits.
The overall assessment remains unchanged. If the price breaks above the $2.17 level again during the day, an upward movement is likely to continue. If there is renewed selling from this level, a pullback towards the $2.05 level is expected due to the current structure of the RSI. The main trend remains upward, but in the short term, the price is likely to move in a more balanced and selective manner.
Supports: 2.0543 – 1.9092 – 1.8121
Resistances: 2.1731 – 2.2729 – 2.3512
SOL/USDT
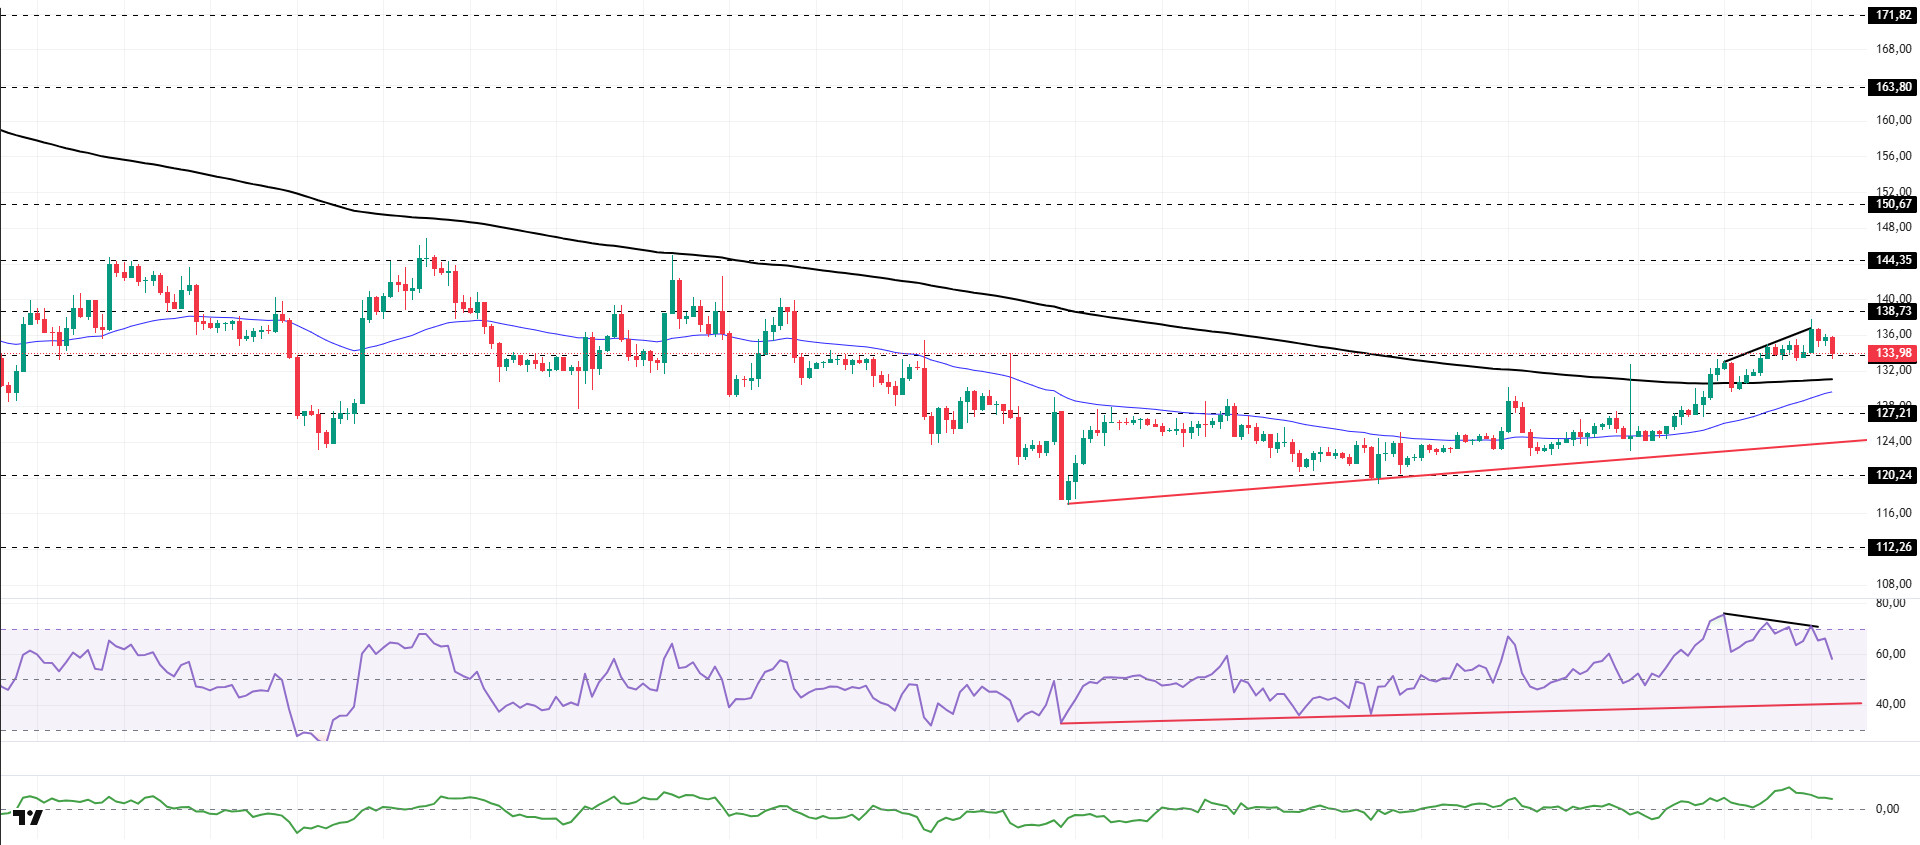
SOL price lost slight value during the day. The asset remained in the upper region of the upward trend that began on December 18. Breaking through the strong resistance level of the 200 EMA (Black Line) moving average, the price continued to rise and remained above the moving average. Currently testing the strong support level of $133.74, the price could test the resistance level of $144.35 if momentum continues. In the event of a pullback, it could test the 200 EMA (Black Line) moving average as support.
On the 4-hour chart, it remained below the 50 EMA (Exponential Moving Average – Blue Line) and 200 EMA (Black Line). This indicates that the medium-term downtrend is continuing. At the same time, the price being above both moving averages indicates that the asset is trending upward in the short term. The Chaikin Money Flow (CMF-20) is in positive territory. However, an increase in money outflows could push the CMF back into negative territory. The Relative Strength Index (RSI-14) has retreated from overbought levels to the middle of positive territory. At the same time, it continues to trade above the rising line that began on December 18. This indicates that buying pressure continues. On the other hand, negative divergence should be monitored. If there is an uptrend due to macroeconomic data or positive news related to the Solana ecosystem, the $150.67 level stands out as a strong resistance point. If this level is broken upwards, the uptrend is expected to continue. In case of pullbacks due to developments in the opposite direction or profit-taking, it may test the $127.21 level. If it retreats to these support levels, an increase in buying momentum may present a potential upside opportunity.
Supports: 133.74 – 127.21 – 120.24
Resistances: 138.73 – 144.35 – 150.67
DOGE/USDT
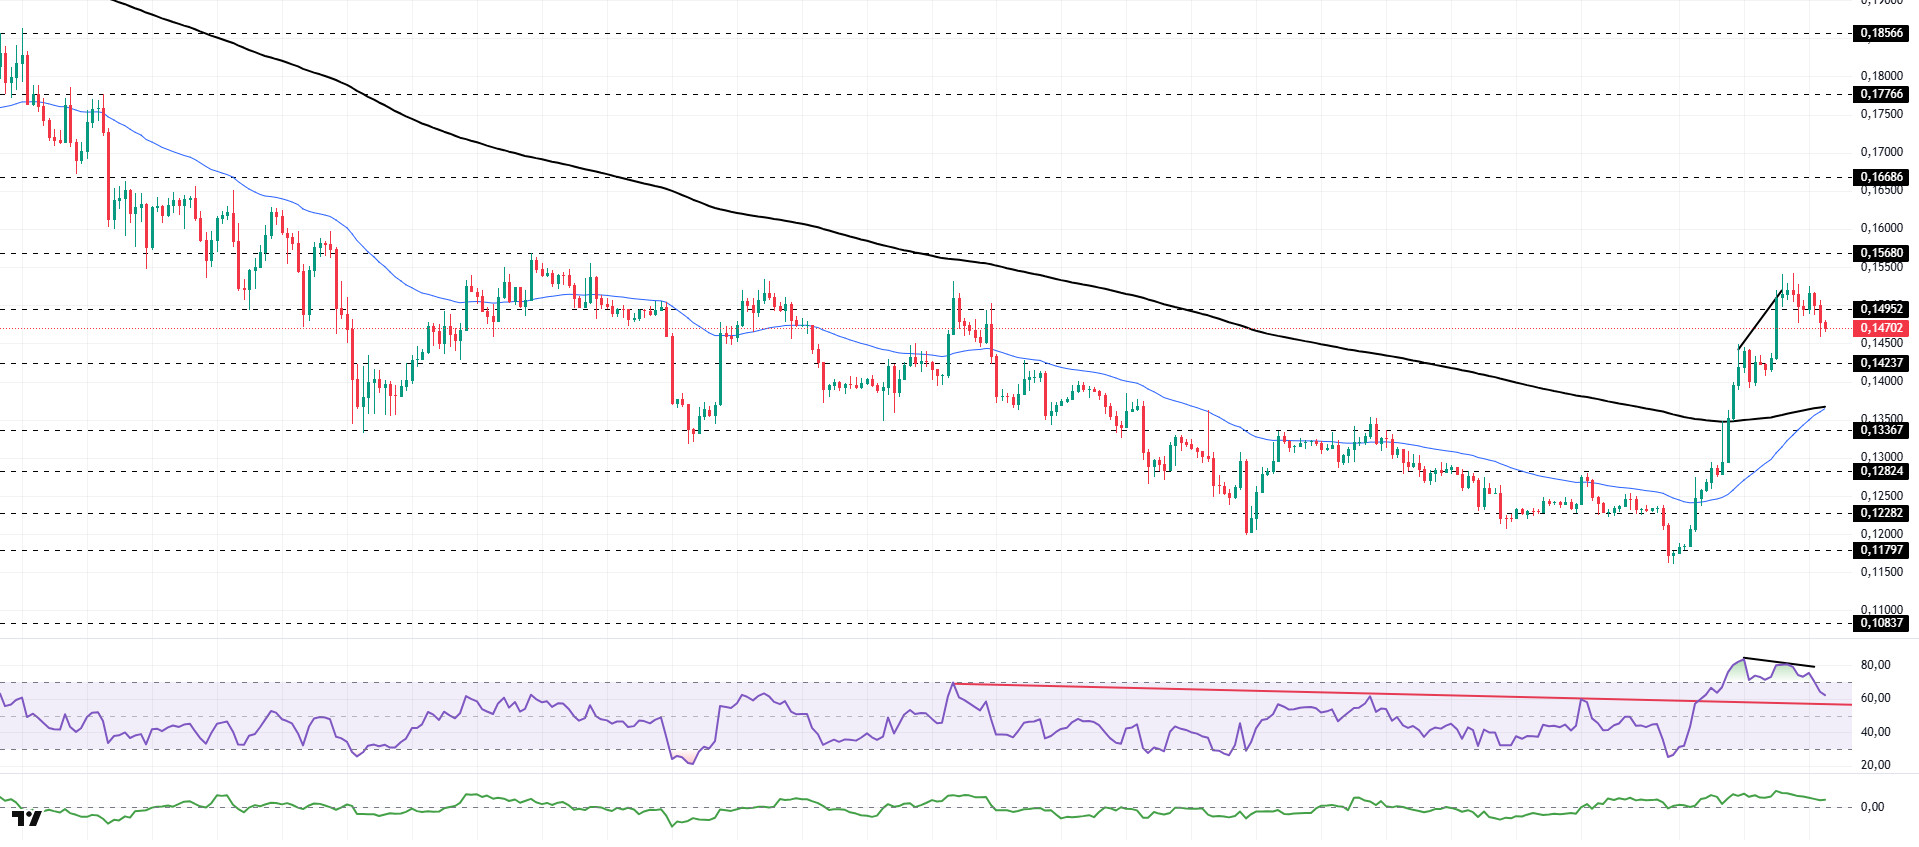
The DOGE price experienced a slight pullback during the day. The asset broke above the 200 EMA (Black Line) moving average, maintaining its momentum. However, the price tested the $0.14952 level as support and moved below it, signaling a decline in momentum. Currently continuing its decline, the price may test the $0.14237 level as support if the pullback continues. If the uptrend resumes, it may test the $0.15680 level as resistance.
On the 4-hour chart, the 50 EMA (Exponential Moving Average – Blue Line) remained below the 200 EMA (Black Line). This indicates that the downtrend may continue in the medium term. The price trading above both moving averages indicates a short-term upward trend. The Chaikin Money Flow (CMF-20) remained in positive territory. Additionally, an increase in money outflows could push the CMF into negative territory. The Relative Strength Index (RSI-14) rose, retreating from the overbought level to the middle of the positive zone. It also continued to remain in the upper region of the downward trend that began on December 9, indicating that it maintained its momentum. On the other hand, negative divergence should be monitored. In the event of a rise due to political developments, macroeconomic data, or positive news flow in the DOGE ecosystem, the $0.16686 level stands out as a strong resistance zone. Conversely, in the event of negative news flow, the $0.13367 level could be triggered. A decline to these levels could increase momentum and initiate a new wave of growth.
Supports: 0.14237 – 0.13367 – 0.12824
Resistances: 0.14952 – 0.15680 – 0.16686
BNB/USDT
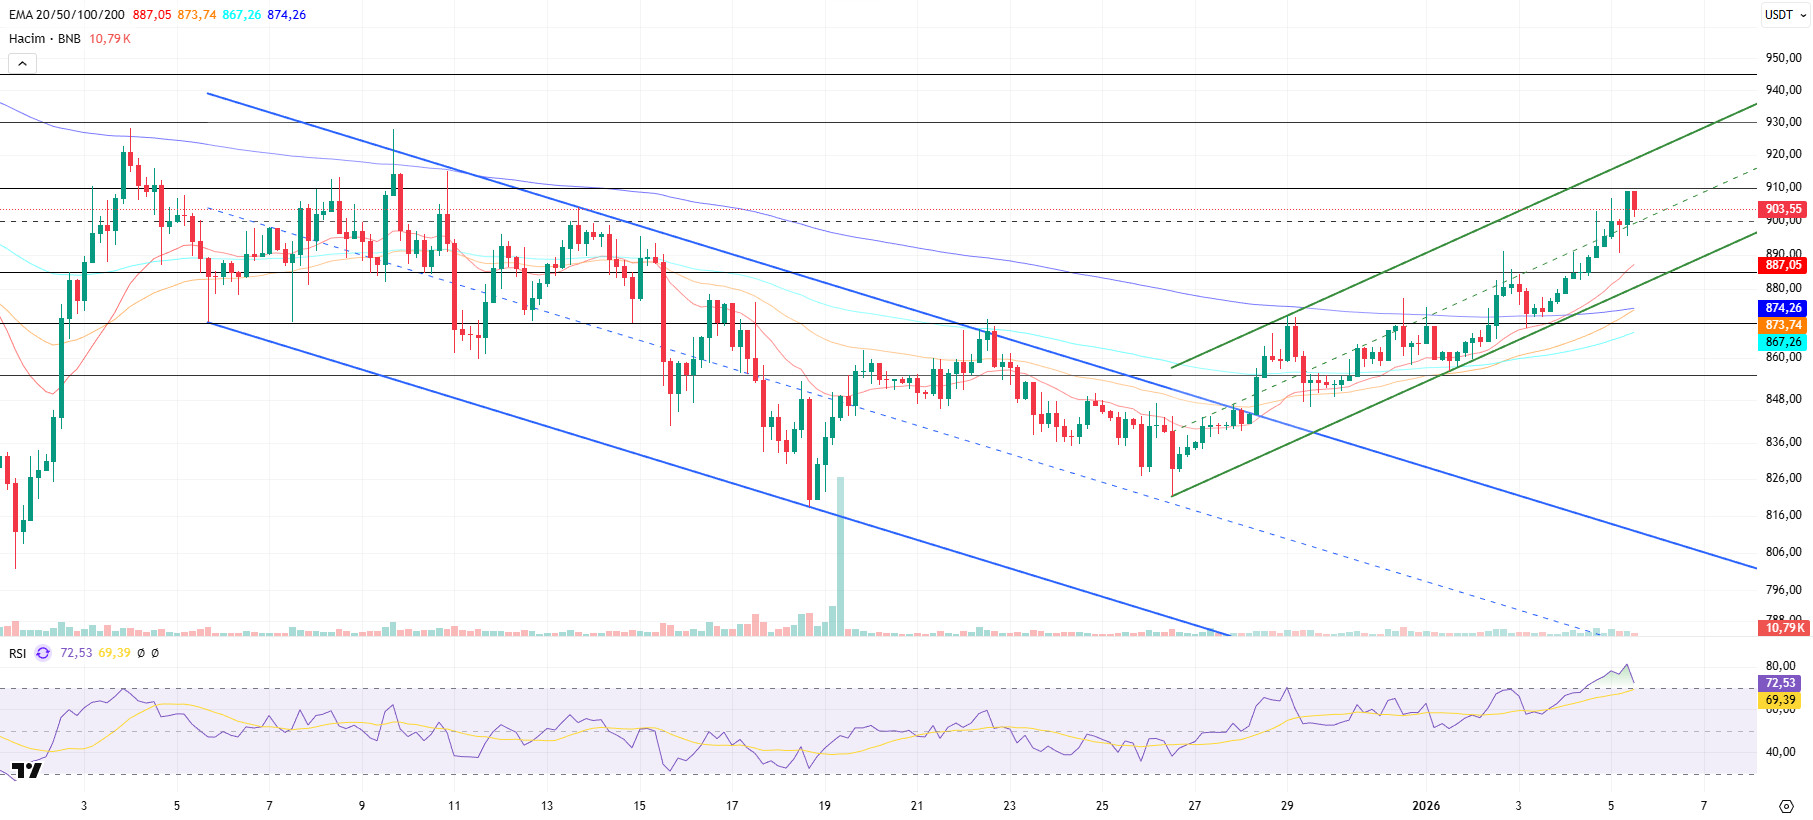
From a technical perspective, BNB/USDT gained positive momentum with the support provided by new candlestick formations and rose to the $930 level; however, intense selling pressure was observed in this region due to general market conditions. Under the influence of this pressure, the asset continued to move within a descending channel formation for some time.
However, BNB, which reversed its direction upward again with the support it received from the middle band of the descending channel, strengthened its upward momentum by breaking the upper band of the channel upward. In this direction, the asset exceeded its previously determined target levels and passed above the $900 level. Although partial pressure is seen at these levels, the asset is considered to have maintained its overall positive structure within the current rising channel.
Currently trading in the $885-$910 range, technical indicators reveal that the asset’s upward momentum is supported by increasing positive trading volume. Additionally, the Relative Strength Index (RSI) rising above the 70 level with the recent increases indicates that a limited correction may begin in the short term.
Within the technical outlook, if selling pressure increases, the price is expected to retest the $885 support level. If this level is broken downward, a pullback towards the $870 and $855 support zones could come into play.
On the other hand, if buying appetite is maintained and market momentum strengthens, BNB is expected to retest the $910 resistance level in the first stage. Breaking above this level could push the price above the downtrend line. If the trend breakout is confirmed and the price manages to hold above this level, a rise towards the $930 and $945 levels is technically possible.
Supports: 885 – 870 – 855
Resistances: 910 – 930 – 945
Legal Notice
The investment information, comments, and recommendations contained herein do not constitute investment advice. Investment advisory services are provided individually by authorized institutions taking into account the risk and return preferences of individuals. The comments and recommendations contained herein are of a general nature. These recommendations may not be suitable for your financial situation and risk and return preferences. Therefore, making an investment decision based solely on the information contained herein may not produce results in line with your expectations.


