
Technical Analysis – January 06, 2026
BTC/USDT
While political and legal developments in Venezuela took center stage, Nicolás Maduro’s first appearance in a federal court in the US took geopolitical tensions to a new level. As the interim administration process takes shape in Caracas, harsh conditional messages from Washington and calculations regarding the energy sector are drawing attention. On the monetary policy front, cautious statements from Fed officials point to continued uncertainty, while diplomatic rapprochement between China and South Korea in Asia has sent important signals regarding regional balances.
From a technical perspective, BTC continued its upward trend with increased momentum compared to the previous analysis, testing the 94,800 level just below the next reference point of 95,000. The price then retreated to the 93,200 level after encountering profit-taking again. BTC, which sustained its upward movement with corrections by drawing a “V” shape after gaining momentum with the breakout of the orange band, appears to be attempting to form a flag pattern, while a cup pattern stands out in the broader chart. In this context, our rising trend line will be monitored as a critical area in terms of maintaining a positive position.
Technical indicators, notably the Wave Trend (WT) oscillator, have been drawing attention with its buy signals in the overbought zone, but it has recently shifted to a sell signal. The histogram on the Squeeze Momentum (SM) indicator has begun to lose momentum within the positive zone. The Kaufman Moving Average (KAMA) has now crossed below the price level at $93.112.
Looking at liquidation data, buy-side transactions have seen heavy accumulation in the short term at the 89,000 – 90,000 level, with accumulation continuing at the 86,000 – 87,000 level. In contrast, sell orders were liquidated in the short term at the 89,000 – 90,000 level. In a broader time frame, long-term trades in the 91,000 – 93,500 and 95,000 bands were cleared.
In summary, Maduro, who was captured on the US-Venezuela border, was brought before a federal court and denied all charges. Venezuelan Vice President Delcy Rodríguez assumed the role of interim head of state in Nicolás Maduro’s absence. Although the Venezuelan interim government called on the US to establish a joint development and cooperation agenda, the Trump administration put forward harsh conditions. Meanwhile, on the economic front, Fed members continued to make cautious statements, while Japanese bonds faced heavy selling. Looking at liquidity data, after a surge in short-term trading, the price broke through, leading to the liquidation of long-term positions and a shift toward buying. In technical terms, BTC started the new year with positive momentum, continuing its parallel movement with the upward channel and rising to 94,800 levels. With limited profit-taking from this point, the price retreated to the 93,200 region.In the next phase, 92,600 stands out as a critical support area, and the major uptrend will be followed with the cup and flag pattern that has formed. Closings above this line will allow the technical structure to regain strength, while the breakout will determine whether it will hold above the 90,000 reference area.
Supports: 92,600 – 91,400 – 90,000
Resistances: 94,000 – 95,000 – 98,000

ETH/USDT
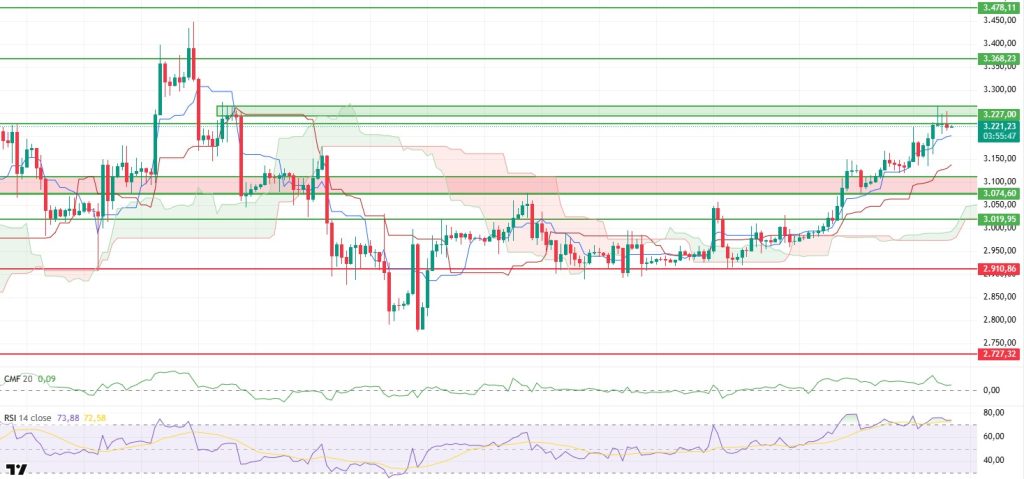
The ETH price continued its upward trend yesterday evening, first breaking through the $3,227 resistance level and then climbing to the area highlighted by the green box on the chart. With the onset of selling in this area, there was a brief pullback. These successive attempts show that buyers’ appetite remains strong and that upward momentum has not yet dissipated.
There is no significant change in the liquidity outlook. Chaikin Money Flow (CMF) maintains its previous trend and indicates that there is no strong outflow of money from the market despite pullbacks. The fact that liquidity flow remains intact suggests that the pullbacks are largely occurring within the price’s own tempo.
On the momentum side, there is a noteworthy picture. The Relative Strength Index (RSI) continues to remain in the overbought zone while maintaining its upward movement. This structure reveals that buyers are still strong. However, the indicator being overly inflated also reminds us that the price could face a short-term correction at any moment. Momentum is strong but should be interpreted cautiously at this point.
The technical structure remains positive from the Ichimoku indicator perspective. The recovery of the Tenkan level strengthens the short-term outlook, while the price remaining above the Kumo cloud confirms that the main trend is still upward. The Kijun level remaining below also indicates that sellers have not yet gained the upper hand in technical terms.
The overall picture has not changed significantly. Upward attempts for the price may continue throughout the day. However, due to the current structure in the RSI, intermediate pullbacks should be considered normal. As long as the $3,111 level holds downwards, the bullish scenario remains on the table. If the price falls below the $3,111 level, the risk of the correction gaining a deeper character may increase.
Below the Form
Supports: 3,227 – 3,074 – 3,019
Resistances: 3,368 – 3,478 – 3,657
 “
“
XRP/USDT
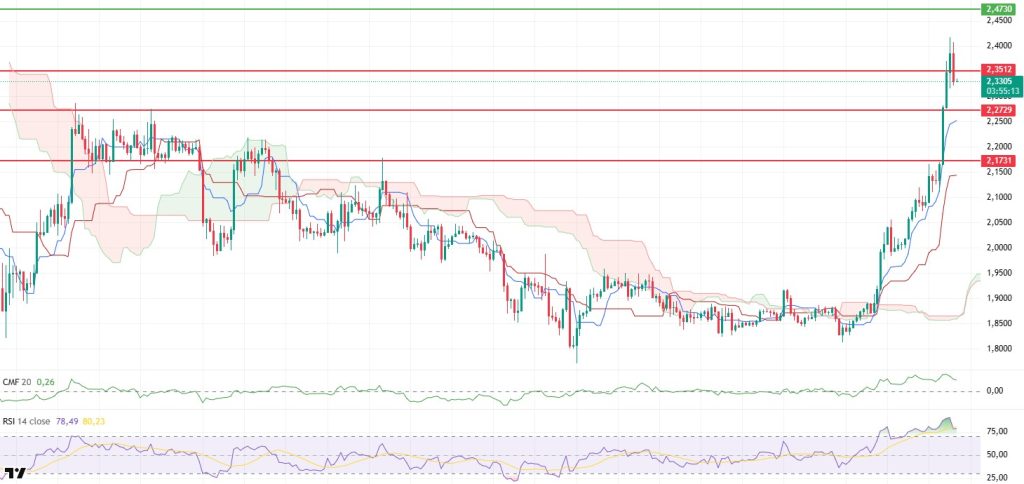
The XRP price continued its upward movement from yesterday evening and managed to break through the $2.35 level, which has been the focus of the market for a long time. With the breakout of this region, the rise gained momentum, but the price failed to hold above this level.
One of the most important factors supporting price movement is the spot market table. While Chaikin Money Flow (CMF) remains positive, Cumulative Volume Delta (CVD) data also indicates that spot purchases are continuing. The fact that the rise is occurring not only through leveraged transactions but also through direct spot demand suggests that the movement is based on a healthier foundation. Continued liquidity inflows are paving the way for limited pullbacks.
On the momentum side, the picture is strong but requires caution. The Relative Strength Index (RSI) remains in overbought territory. While this confirms strong buying pressure, it also keeps the possibility of a short-term correction alive. This level on the RSI could make it difficult for the price to continue unabated and may cause occasional pullbacks.
The technical outlook remains intact from the Ichimoku indicator perspective. The price continues to stay above the Kumo cloud, with the Tenkan and Kijun levels below. This structure indicates that there is no breakdown in the main trend at this stage and that the uptrend maintains its technical validity.
The focus in the overall assessment is on the $2.27 level. As long as the price remains above this level during the day, upward movement is expected to continue. However, if there is a return below this level, a limited correction towards the $2.17 region may occur. The main trend remains upward in the current chart, but occasional price pullbacks should be considered normal due to the structure of the RSI.
Supports: 2.3512 – 2.2729 – 2.1731
Resistances: 2.4730 – 2.5614 – 2.6513
“ “
“
SOL/USDT
Solana treasury company DeFi Development (DFDV), listed on Nasdaq, announced last month that it had increased its SOL holdings by over 25,000 tokens. Solana Staking Protocol Jito launched IBRL Explorer for enhanced block visibility.
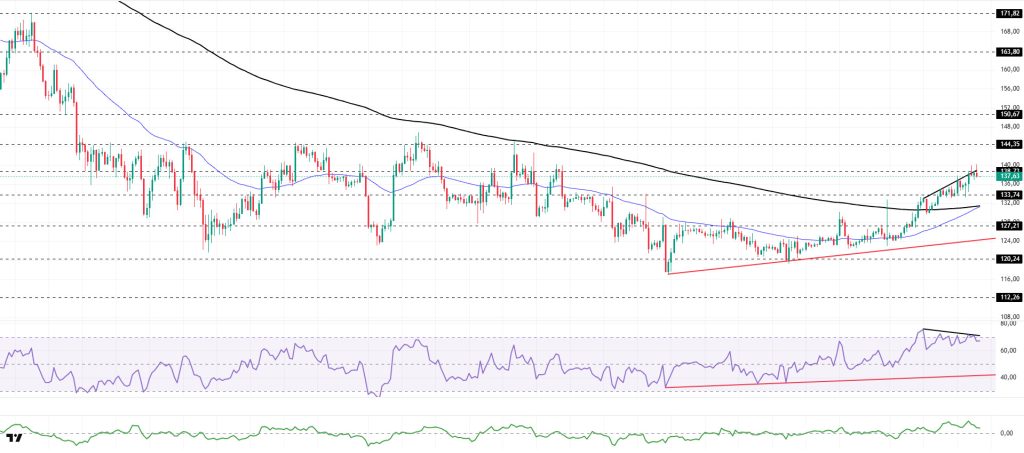
The SOL price remained flat. The asset continued to trade in the upper region of the upward trend that began on December 18. Breaking through the strong resistance level of the 200 EMA (Black Line) moving average, the price is currently testing the strong resistance level of $138.73. If it closes above this level, it could test the $144.35 level as resistance. In the event of a pullback, it could test the 200 EMA (Black Line) moving average as support.
On the 4-hour chart, it continues to remain below the 50 EMA (Exponential Moving Average – Blue Line) and 200 EMA (Black Line). This indicates that the downtrend is continuing in the medium term. At the same time, the price being above both moving averages indicates that the asset is trending upward in the short term. The Chaikin Money Flow (CMF-20) is in positive territory. However, an increase in money inflows could push the CMF to the upper levels of the positive zone. The Relative Strength Index (RSI-14) remained in overbought territory. It also continued to trade above the rising line that began on December 18. This signaled that buying pressure was continuing. On the other hand, negative divergence should be monitored. If there is an uptrend due to macroeconomic data or positive news related to the Solana ecosystem, the $150.67 level stands out as a strong resistance point. If this level is broken upwards, the uptrend is expected to continue. In case of pullbacks due to developments in the opposite direction or profit-taking, it may test the $127.21 level. A decline to these support levels may increase buying momentum, presenting a potential upside opportunity.
Supports: 133.74 – 127.21 – 120.24
Resistances: 138.73 – 144.35 – 150.67
“ ”
”
DOGE/USDT
The DOGE price traded sideways. The asset broke above the 200 EMA (Black Line) moving average, maintaining its momentum, and continued to trade above the strong support level of $0.14952. Currently maintaining its sideways trend, the price may test the $0.14237 level as support in case of a pullback. If the uptrend resumes, it may test the $0.15680 level as resistance.
On the 4-hour chart, the 50 EMA (Exponential Moving Average – Blue Line) crossed above the 200 EMA (Black Line). This indicated that an uptrend could begin in the medium term. The price being above both moving averages indicates that the price is trending upward in the short term. Chaikin Money Flow (CMF-20) remained in positive territory. Additionally, an increase in money inflows could push the CMF to the upper levels of the positive zone. The Relative Strength Index (RSI-14) retreated from the overbought level to the positive zone. At the same time, it continued to remain in the upper region of the downward trend that began on December 9, indicating that it maintained its momentum. On the other hand, negative divergence should be monitored. In the event of a rise due to political developments, macroeconomic data, or positive news flow in the DOGE ecosystem, the $0.16686 level stands out as a strong resistance zone. Conversely, in the event of negative news flow, the $0.13367 level could be triggered. A decline to these levels could increase momentum and initiate a new wave of growth.
Supports: 0.14952 – 0.14237 – 0.13367
Resistances: 0.15680 – 0.16686 – 0.17766
“ “
“
BNB/USDT
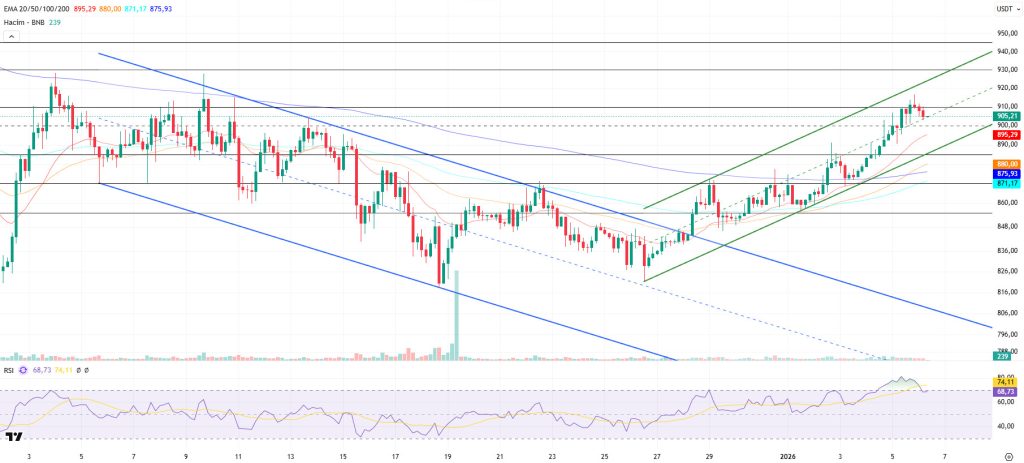
From a technical perspective, BNB/USDT gained positive momentum with the support provided by new candlestick formations and rose to the $930 level; however, intense selling pressure was observed in this region due to general market conditions. Under the influence of this pressure, the asset continued to move within a descending channel formation for some time.
However, BNB, which reversed its direction upward again with the support it received from the middle band of the descending channel, strengthened its upward momentum by breaking the upper band of the channel upward. In this direction, the asset exceeded its previously determined target levels and passed above the $900 level. Although partial pressure is seen at these levels, the asset is considered to have maintained its overall positive structure within the current rising channel.
Currently trading in the $885-$910 range, technical indicators reveal that the asset’s upward momentum is supported by increasing positive trading volume. Additionally, the Relative Strength Index (RSI) rising above the 70 level with the recent increases indicates that a limited correction movement may continue in the short term.
Within the technical outlook, if selling pressure increases, the price is expected to retest the $900 support level. If this level is broken downward, a pullback towards the $885 and $870 support zones could come into play.
On the other hand, if buying appetite is maintained and market momentum strengthens, BNB is expected to retest the $910 resistance level in the first stage. Breaking above this level could potentially lead to a move above the descending trend line. If the trend breakout is confirmed and the price manages to hold above this level, a rise towards the $930 and $945 levels is technically possible.
Supports: 900 – 885 – 870
Resistances: 910 – 930 – 945
 “
“
Legal Notice
The investment information, comments, and recommendations contained herein do not constitute investment advice. Investment advisory services are provided individually by authorized institutions taking into account the risk and return preferences of individuals. The comments and recommendations contained herein are of a general nature. These recommendations may not be suitable for your financial situation and risk and return preferences. Therefore, making an investment decision based solely on the information contained herein may not produce results in line with your expectations.

