
Technical Analysis – January 6, 2026 – Evening
BTC/USDT
While the focus on monetary policy remains in global markets, messages from central banks point to a cautious normalization process. In the US, Fed officials emphasized “fine-tuning” the inflation-employment balance, while China reiterated its determination to maintain a controlled and supportive monetary policy stance. On the Asian front, Japan’s implementation of the CARF regulation on crypto assets brought financial transparency and regulation back to the top of the agenda.
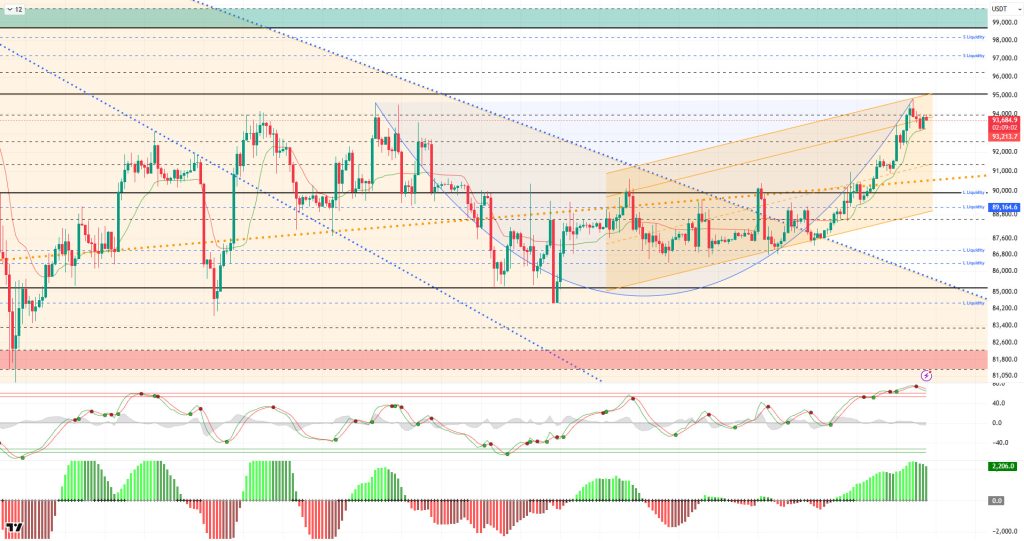
From a technical perspective, BTC has not recorded any significant change compared to the previous analysis, while efforts to hold above the 93,000 level continue. With the breakout of the orange band, BTC continues its upward trend, and the price appears to be attempting to form a flag pattern, while a cup pattern stands out on the broader chart. In this context, our rising trend line and the closes above it will be monitored as a critical area for holding in the positive zone.
Technical indicators, such as the Wave Trend (WT) oscillator, which had been signaling buy/sell signals in the overbought zone, have recently shifted to a sell signal. The histogram on the Squeeze Momentum (SM) indicator has begun to lose momentum within the positive zone. The Kaufman Moving Average (KAMA) has now crossed below the price level at $93,213.
When examining liquidation data, buy-side transactions show intense accumulation at the 89,000 – 90,000 level in the short term, while accumulation continues at the 86,000 – 87,000 level in the long term. In contrast, sell orders were liquidated in the short term at the 90,000 – 95,000 level. In the monthly time frame, intense sell clusters continue above the 97,000 level.
In summary, Maduro, who was captured on the US-Venezuela border, was brought before a federal court and denied all charges. Venezuelan Vice President Delcy Rodríguez assumed the role of interim head of state in Nicolás Maduro’s absence. Although the Venezuelan interim government called on the US to establish a joint development and cooperation agenda, the Trump administration put forward tough conditions. Meanwhile, on the economic front, Fed members continued to make cautious statements, while Japanese bonds faced heavy selling. Looking at liquidity data, after a surge in short-term trading, the price breakout led to the liquidation of long-term positions, and the buying phase gained momentum in the short term. In technical terms, BTC started the new year with positive momentum, continuing its parallel movement with the upward channel and rising to 94,800 levels. With limited profit-taking from this point, the price retreated to the 93,200 region.In the next phase, 92,600 stands out as a critical support area, and the major uptrend will be followed with the cup and flag pattern that has formed. Closings above this line will allow the technical structure to regain strength, while the breakout will determine whether it will hold above the 90,000 reference area.
Supports: 92,600 – 91,400 – 90,000
Resistances: 94,000 – 95,000 – 98,000
ETH/USDT
The ETH price tested the resistance area highlighted in green on the chart once again during the day but faced selling pressure from this region. With the upward attempt failing to gain traction, the price pulled back to around $3,230 and is currently trying to stabilize at these levels. The fact that the same area has been tested repeatedly without being broken shows that, despite buyers’ enthusiasm, selling pressure remains strong in this region.
On the liquidity side, the picture remains intact despite the price pullback. Although the Chaikin Money Flow (CMF) showed a brief weakening during the day, it has started to move upward again. This pattern suggests that the amount of money entering the market is increasing and that the recent decline was caused more by the price’s natural reaction than by liquidity outflows. The continued vitality of liquidity flow is paving the way for downward movements to remain limited for now.
On the momentum side, we are at a point where caution is warranted. The Relative Strength Index (RSI) remains in overbought territory. While this confirms strong buying pressure, it also indicates that the price is vulnerable to a near-term correction. The saturation in the RSI could lead to a slowdown in upward momentum or trigger pullbacks.
The technical structure remains strong from the Ichimoku indicator perspective. The price is above the kumo cloud, and the Tenkan and Kijun levels are below. This positioning indicates that there is no breakdown in the main trend at this stage and that buyers still have the technical advantage.
In the overall assessment, short-term risks coexist with a medium-term positive structure. While the CMF and Ichimoku indicators support the upward trend, the repeated failure to break through the resistance area and the overbought condition in the RSI increase the likelihood of the price retreating below the $3,227 level. Conversely, closes above the $3,265 level could reduce this correction risk and allow upward momentum to regain speed. In the current picture, the ETH price continues to remain in a strong trend, but the possibility of a volatile course in the short term appears high.
Supports: 3,227 – 3,074 – 3,019
Resistances: 3,265 – 3,368 – 3,478
![ETHUSDT[90]](https://academy.darkex.com/wp-content/uploads/2026/01/ETHUSDT90-1024x437.jpg)
XRP/USDT
Although the XRP price briefly fell below the $2.35 level during the day, it quickly recovered from this area and rose back above the same level. This recovery shows that the sell-off was not permanent and that buyers continue to defend this area. The price regaining momentum suggests that the upward trend is spreading throughout the day and that momentum has not completely dissipated.
The spot market outlook continues to support price movements. While the Chaikin Money Flow (CMF) remains in positive territory, the Cumulative Volume Delta (CVD) data also indicates that spot buying is still active. The fact that the rise is primarily driven by spot demand suggests that the movement is taking place on more solid ground. Continued liquidity inflows contribute to downward attempts remaining short-lived.
Momentum is holding steady, but we are at a point that requires careful reading. The Relative Strength Index (RSI) remains in overbought territory. This structure indicates that buyer pressure is continuing, while also keeping the risk of short-term volatility alive. The RSI staying at these levels may cause the price to pull back and regain strength from time to time, rather than moving in a straight line.
The technical structure has not changed from the perspective of the Ichimoku indicator. The price continues to trade above the Kumo cloud, while the Tenkan and Kijun levels remain below. This positioning indicates that the current upward structure is still technically valid and that there is no break in the main trend.
In general, the $2.35 level remains the center of attention. As long as the price stays above this level during the day, upward movement is expected to continue. On the other hand, if it falls below this level again, a limited correction towards the $2.27 band may be seen. The current chart shows that the main direction remains upward, but due to high momentum, it seems normal for the price to take a breather.
Supports: 2.3512 – 2.2729 – 2.1731
Resistances: 2.4730 – 2.5614 – 2.6513
![XRPUSDT[42]](https://academy.darkex.com/wp-content/uploads/2026/01/XRPUSDT42-1024x442.jpg)
SOL/USDT
Morgan Stanley Solana Trust has filed an S-1 application.
SOL experienced a slight increase in price during the day. The asset continued to trade in the upper region of the upward trend that began on December 18. Gaining momentum from the strong support level of $133.74, the price continued to rise and is currently trading above the strong resistance level of $138.73. If it manages to stay above this level, it could test the $144.35 level as resistance. In the event of a pullback, it could test the 200 EMA (Black Line) moving average as support.
On the 4-hour chart, it remained below the 50 EMA (Exponential Moving Average – Blue Line) and 200 EMA (Black Line). This indicates that the medium-term downtrend is continuing. At the same time, the price being above both moving averages indicates that the asset is trending upward in the short term. The Chaikin Money Flow (CMF-20) is in positive territory. However, the balance of money inflows and outflows may continue to keep the CMF in positive territory. The Relative Strength Index (RSI-14) remained in overbought territory. It also continued to trade above the rising line that began on December 18. This signaled that buying pressure was continuing. On the other hand, negative divergence should be monitored. If there is an uptrend due to macroeconomic data or positive news related to the Solana ecosystem, the $150.67 level stands out as a strong resistance point. If this level is broken upwards, the uptrend is expected to continue. In case of pullbacks due to developments in the opposite direction or profit-taking, it may test the $127.21 level. A decline to these support levels may increase buying momentum, presenting a potential upside opportunity.
Supports: 138.73 – 133.74 – 127.21
Resistances: 144.35 – 150.67 – 163.80
![SOLUSDT[73]](https://academy.darkex.com/wp-content/uploads/2026/01/SOLUSDT73-1024x453.jpg)
DOGE/USDT
The DOGE price continued its sideways movement during the day. The asset broke above the 200 EMA (Black Line) moving average and remained above the strong support level of $0.14952. Currently maintaining its sideways trend, the price may test the $0.14237 level as support in case of a pullback. If the uptrend resumes, it may test the $0.15680 level as resistance.
On the 4-hour chart, the 50 EMA (Exponential Moving Average – Blue Line) remained above the 200 EMA (Black Line). This indicated that an uptrend could begin in the medium term. The price being above both moving averages indicates that the price is trending upward in the short term. Chaikin Money Flow (CMF-20) remained in positive territory. Additionally, an increase in cash inflows could push the CMF to the upper levels of the positive zone. The Relative Strength Index (RSI-14) retreated from the overbought level to the positive zone. At the same time, it continued to remain in the upper region of the downward trend that began on December 9, indicating that it maintained its momentum. On the other hand, negative divergence should be monitored. In the event of a rise due to political developments, macroeconomic data, or positive news flow in the DOGE ecosystem, the $0.16686 level stands out as a strong resistance zone. Conversely, in the event of negative news flow, the $0.13367 level could be triggered. A decline to these levels could increase momentum and initiate a new wave of growth.
Supports: 0.14952 – 0.14237 – 0.13367
Resistances: 0.15680 – 0.16686 – 0.17766
![DOGEUSDT[78]](https://academy.darkex.com/wp-content/uploads/2026/01/DOGEUSDT78-1024x451.jpg)
BNB/USDT
From a technical perspective, BNB/USDT gained positive momentum with the support provided by new candlestick formations in recent days, rising to the $930 level. However, it was observed that selling pressure intensified in this region due to general market conditions, and as a result of this pressure, it continued its movement within a falling channel formation for some time.
However, BNB, which reversed its direction upward with support from the middle band of the descending channel, strengthened its upward momentum by breaking above the upper band of the channel. In this direction, the asset exceeded its previously determined target levels and rose above the $900 level. The asset, which continues to trade above these levels, is observed to maintain its overall positive structure within the current ascending channel.
Trading in the $885-$920 range at present, technical indicators reveal that the asset’s upward momentum is supported by increasing positive trading volume. In addition, the Relative Strength Index (RSI) rising above the 70 level with the recent increases indicates that a limited correction may occur in the short term.
Within the technical outlook, if buying appetite is maintained and market momentum strengthens, BNB is expected to retest the $920 resistance level in the first phase. Breaking above this level could potentially lead to a move above the descending trend line. If the trend breakout is confirmed and the price manages to hold above this level, a rise towards the $930 and $945 levels is technically possible.
On the other hand, if selling pressure increases, the price is expected to retest the $900 support level. If this level is broken downward, a pullback towards the $885 and $870 support zones may come into play.
Supports: 900 – 885 – 870
Resistances: 920 – 930 – 945
![BNBUSDT[63]](https://academy.darkex.com/wp-content/uploads/2026/01/BNBUSDT63-1024x463.jpg)
Legal Notice
The investment information, comments, and recommendations contained herein do not constitute investment advice. Investment advisory services are provided individually by authorized institutions taking into account the risk and return preferences of individuals. The comments and recommendations contained herein are of a general nature. These recommendations may not be suitable for your financial situation and risk and return preferences. Therefore, making an investment decision based solely on the information contained herein may not produce results in line with your expectations.

