
Technical Analysis
BTC/USDT
The UK plans to include the crypto market in a comprehensive legal framework by 2027 with the goal of full integration into the current financial system, aiming to address licensing, oversight, and political financing risks simultaneously. On the Russian front, the focus is more on control and sanctions; the criminalization of illegal crypto mining with heavy penalties reflects the state’s desire to increase its control over energy and capital flows. In Asia, South Korea is positioning major crypto exchanges as systemically critical infrastructure, taking steps to limit ownership concentration and reduce governance risks.
From a technical perspective, BTC appears to be attempting to erase yesterday’s decline during the day, converting its downward trend into a horizontal band. The price, which first formed a “W” pattern and then a double top, struggled to break through the major uptrend. At the time of writing, BTC is trading at the 88,000 level, approaching the upper resistance point within the orange band and attempting to break through it. As mentioned earlier, BTC, which is attempting to close 2025 in negative territory, is heading into the last day of the year with a 5.87% decline.
Technical indicators show that the Wave Trend (WT) oscillator is giving a buy signal again at the channel midband, while the histogram on the Squeeze Momentum (SM) indicator briefly moved into positive territory before losing momentum again. The Kaufman Moving Average (KAMA) has now crossed above the price level at $88.537.
When examining liquidation data, short-term buy levels are being liquidated at around 88,000, while the next sell level maintains its accumulation at 86,000.In contrast, while short-term sell levels are being liquidated at the 90,000 level, the 91,000 level stands out as a liquidity zone in a broader time frame.
In summary, while there are no developments expected to impact prices during the day, regulatory steps taken by countries are drawing attention. Later in the day, the FOMC minutes will be the focus of the markets. Looking at liquidity data, it appears that short-term trading has intensified, while long-term selling levels have not yet been tested. After this stage, the short-term resistance level of 88,500 stands out as the level needed for the price to regain momentum.Closes and pricing above this level could enable the 90,000 reference area to be tested once again with renewed momentum. If selling pressure deepens, 87,000 will emerge as a short-term support area, while 86,000 will be monitored as another liquidity area.
Supports: 86,300 – 85,000 – 84,000
Resistances: 88,500 – 89,000 – 90,000
ETH/USDT
With the positive outlook that emerged in the morning, the ETH price rose as expected. As buying gained momentum, the price rose to around $2,990. The rise is not aggressive, but the fact that the price was able to hold at higher levels in a short period of time suggests that the market has started to turn upward.
The positive picture on the money entering the market is maintained. Chaikin Money Flow (CMF) remains in positive territory while continuing its upward trend. This shows that the rise is not just a price movement, but is backed by real liquidity support. The continued flow of liquidity paves the way for any potential pullbacks to remain limited.
The momentum also appears healthy. The Relative Strength Index (RSI) continues to advance in positive territory and is not producing any negative divergence at this stage. This RSI outlook indicates that buyers remain in control and the upward momentum has not yet weakened. The continuation of this momentum provides a significant advantage in terms of the price potentially challenging higher levels.
On the technical side, the Ichimoku indicator has started to produce noteworthy signals. With the price rising above the kumo cloud and the Tenkan and Kijun levels also being surpassed, this strengthens the possibility of a transition to a new positive phase from a technical perspective. This structure is giving the first signs that the short-term recovery could turn into a medium-term trend.
The overall outlook is more constructive compared to previous hours. The $3,020 level stands out as a critical threshold to the upside. If this region is breached, the uptrend is likely to continue. On the downside, the $2,910 level remains the main support. As long as it stays above this level, the current positive structure could remain valid. On the ETH side, a controlled but increasingly strong upward trend is noteworthy at this stage.
Supports: 2,910 – 2,727 – 2,625
Resistances: 3,019 – 3,074 – 3,227

XRP/USDT
Since the morning hours, both the price flow and technical indicators for XRP have been moving in the same direction. While the price continues to hover around $1.86, there has been no significant move up or down. The low trading volume indicates that the wait-and-see approach persists in the market and that participants are reluctant to take risks. The price behavior during the day suggests that balance has been maintained following the reaction seen overnight.
The picture hasn’t changed on the money entering the market side either. Chaikin Money Flow (CMF) remains in positive territory but hasn’t gained upward momentum. This outlook shows that liquidity outflows have stopped but buyer appetite hasn’t increased significantly either. CMF’s horizontal trend at current levels clearly explains why the price is moving within a narrow band.
There is also a similar calmness in terms of momentum. The Relative Strength Index (RSI) remains flat below the 50 level. This RSI outlook indicates that buyers have not yet gained momentum and that reactionary buying remains weak. Unless there is a change in momentum, it seems unlikely that the price will break out of its current range.
The Ichimoku indicator has not produced a new signal either. The price remains below the Kumo cloud and is trading below the Tenkan and Kijun levels. This structure indicates that the downward pressure persists from a technical perspective and upward movements remain limited. The outlook suggests an effort to maintain equilibrium rather than a strong recovery in the short term.
In the overall picture, the intraday outlook for XRP has not changed significantly since this morning. The $1.90 level remains the main threshold for upward movement. Unless this level is breached, the price is expected to continue fluctuating within the current range. On the downside, the $1.84 region continues to serve as a short-term equilibrium zone. The current structure indicates that no clear direction has emerged in the market and that the process is continuing sideways.
Supports: 1.8121 – 1.6224 – 1.5146
Resistances: 1.9092 – 2.0543 – 2.1731

SOL/USDT
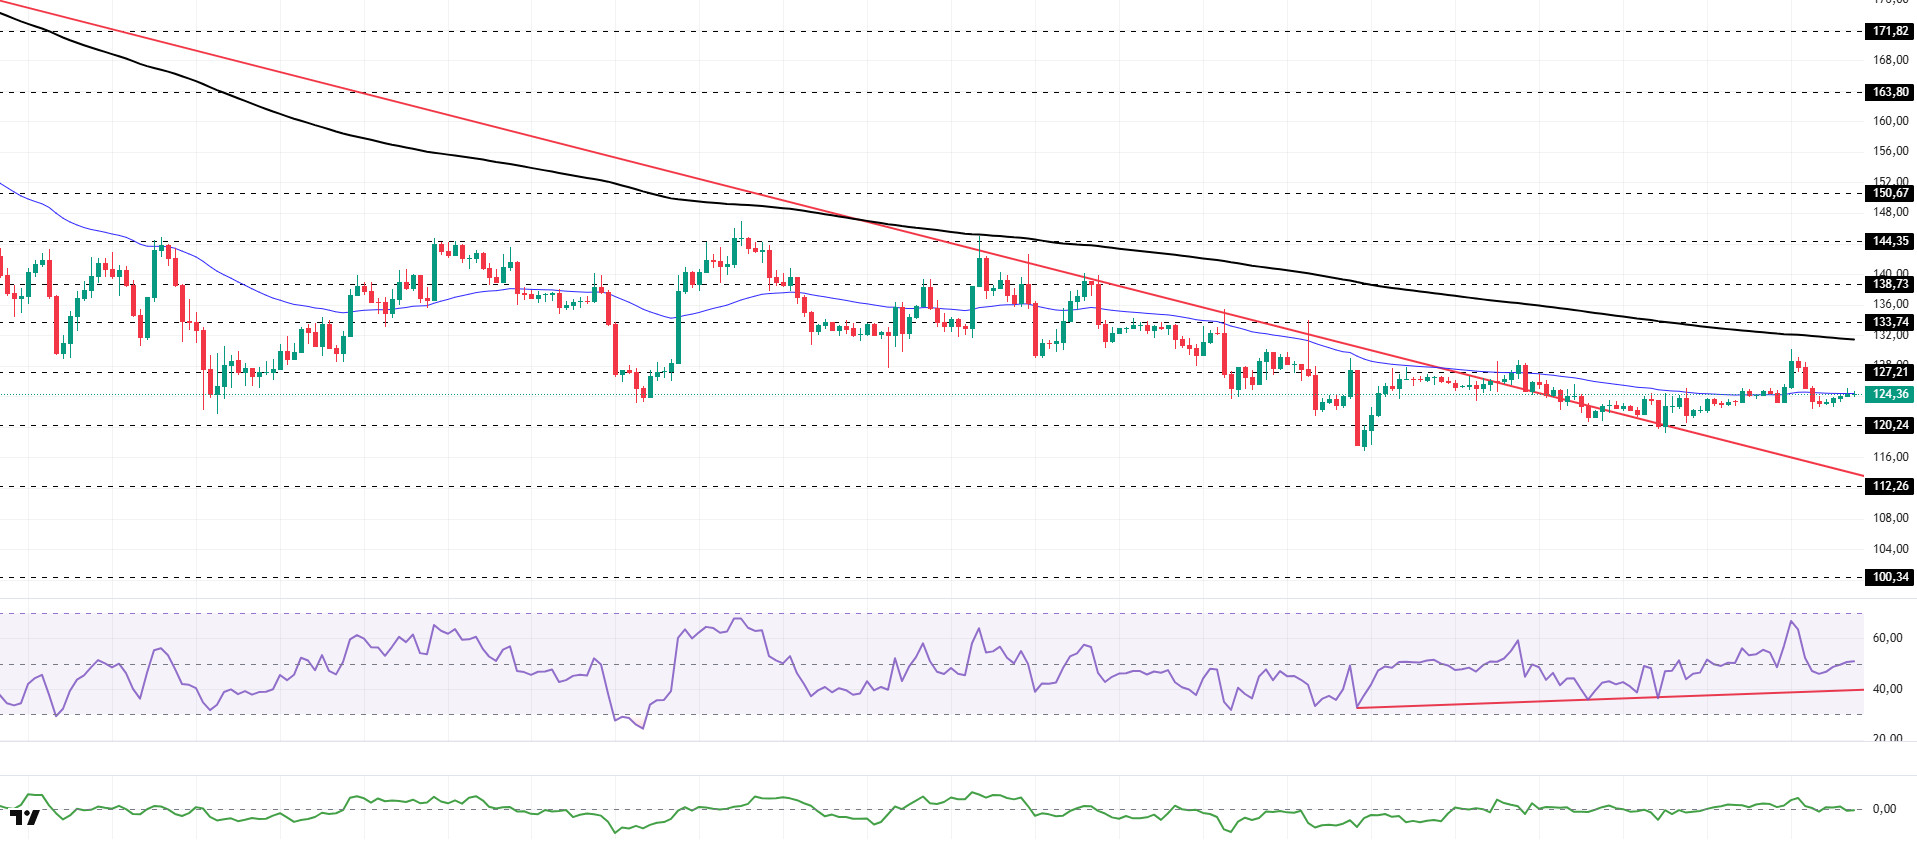
The SOL price remained flat during the day. The asset continued to trade in the upper region of the downtrend that began on October 8. Testing the strong resistance level of $127.21, the price moved below the 50 EMA (Blue Line) moving average. Currently testing the 50 EMA (Blue Line) as resistance, the asset could test the 200 EMA (Black Line) as resistance if it closes above this level. If the pullback continues, the $120.24 level could act as support.
On the 4-hour chart, it remained below the 50 EMA (Exponential Moving Average – Blue Line) and 200 EMA (Black Line). This indicates that the downtrend continues in the medium term. At the same time, the price being below both moving averages indicates that the asset is trending downward in the short term. The Chaikin Money Flow (CMF-20) has retreated to a neutral level. However, an increase in money inflows could push the CMF into positive territory. The Relative Strength Index (RSI-14) remained at a neutral level. At the same time, it continued to trade above the rising line that began on December 18. This signaled that buying pressure was continuing. In the event of an uptrend driven by macroeconomic data or positive news related to the Solana ecosystem, the $138.73 level stands out as a strong resistance point. If this level is broken upwards, the uptrend is expected to continue. In the event of pullbacks due to developments in the opposite direction or profit-taking, the $112.26 level could be tested. A decline to these support levels could increase buying momentum, presenting a potential opportunity for an upward move.
Supports: 120.24 – 112.26 – 100.34
Resistances: 127.12 – 133.74 – 138.73
DOGE/USDT
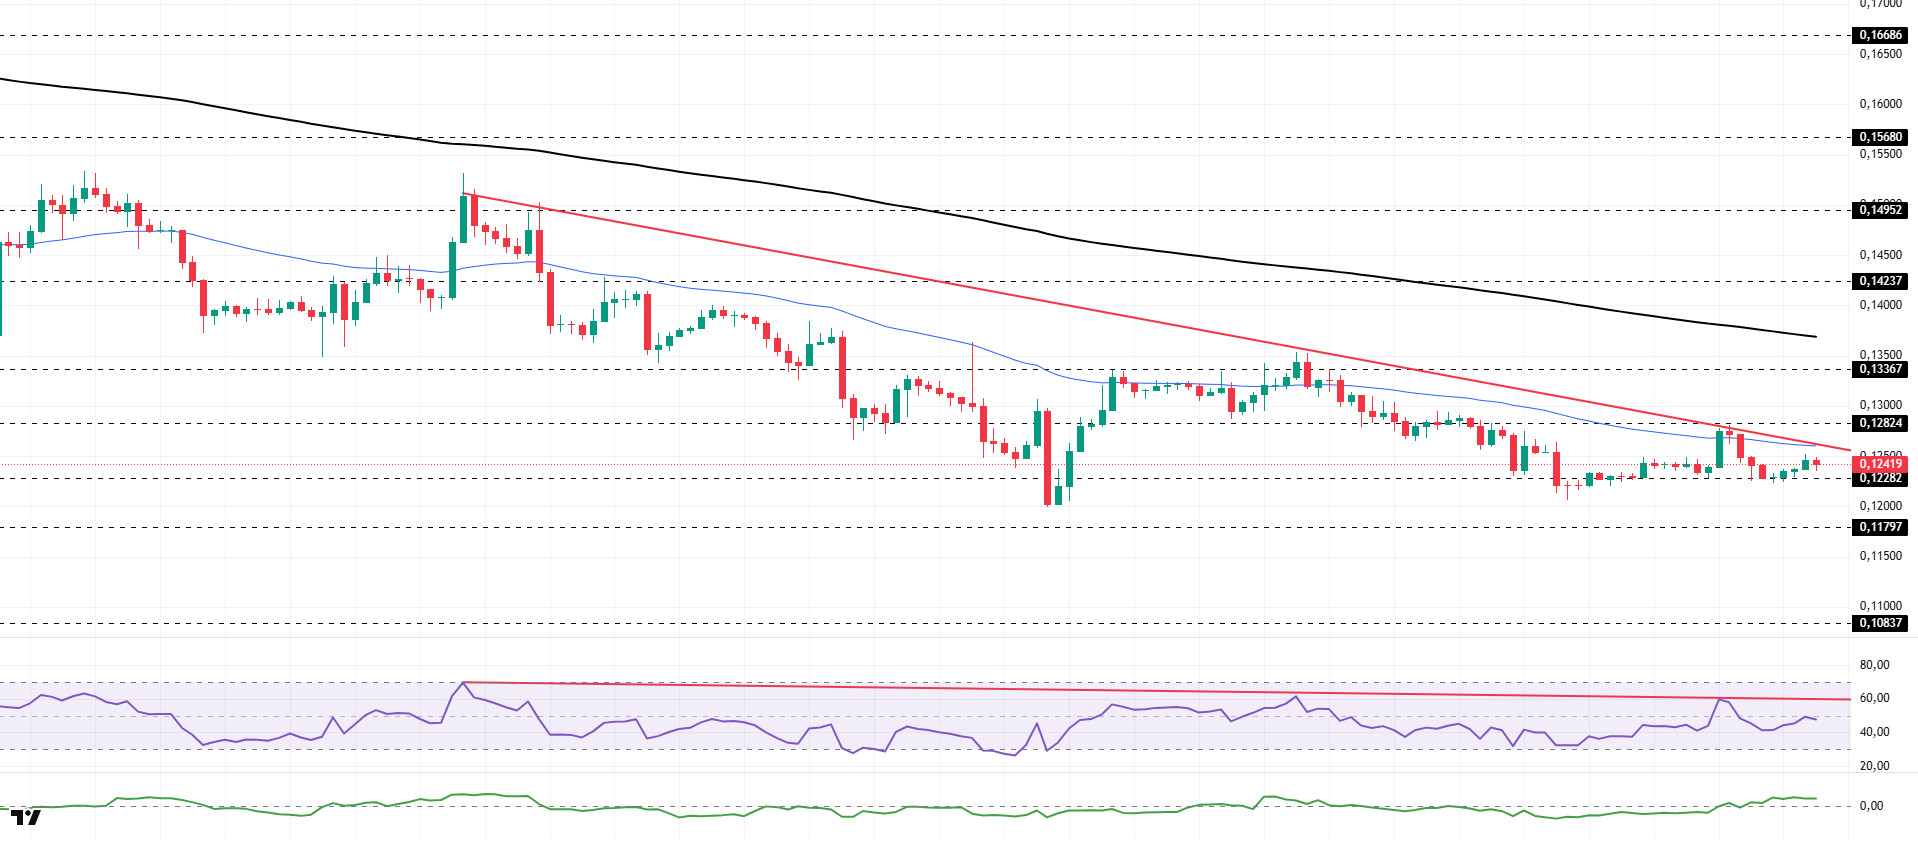
The DOGE price traded sideways during the day. The asset tested the 50 EMA (Blue Line) moving average and the descending trend line that began on December 9 as resistance but failed to hold and retreated. Currently testing the $0.12282 level as support, the price may retest the 50 EMA (Blue Line) moving average and the downward trend as resistance if it closes above this level. If the pullback continues, the $0.11797 level may act as support again.
On the 4-hour chart, the 50 EMA (Exponential Moving Average – Blue Line) remained below the 200 EMA (Black Line). This indicates that the downtrend may continue in the medium term. The price being below both moving averages indicates a downward trend in the short term. The Chaikin Money Flow (CMF-20) remained in positive territory. Additionally, an increase in cash inflows could push the CMF to the upper levels of the positive zone. The Relative Strength Index (RSI-14) experienced slight buying pressure, rising to the negative part of the neutral level. At the same time, it continued to remain below the downward trend that began on December 9. This signaled that selling pressure was continuing. In the event of potential increases driven by political developments, macroeconomic data, or positive news flow within the DOGE ecosystem, the $0.14237 level stands out as a strong resistance zone. Conversely, in the event of negative news flow, the $0.11797 level could be triggered. A decline to these levels could increase momentum and initiate a new wave of growth.
Supports: 0.12282 – 0.11797 – 0.10837
Resistances: 0.12824 – 0.13367 – 0.14237
BNB/USDT
From a technical perspective, BNB/USDT gained positive momentum with the support provided by new candles and rose to the $930 level; however, increased selling pressure was observed in this region depending on market conditions. With the effect of increased selling pressure, the asset appears to have continued its movement within a declining channel for some time.
However, BNB, which turned upward with the support it received from the middle band of the descending channel, gained positive momentum by breaking the upper band of the channel upward. In this direction, the asset rose above the previously determined target level of $860 and reached the $870 level. Although partial pressure is seen at these levels, the overall technical outlook is considered to maintain its positive structure.
Currently trading in the $850–870 range, technical indicators for BNB show that low trading volume is limiting the upward momentum. Additionally, the RSI indicator reaching the 70 level with the recent rises and reacting from this level indicates that a limited correction movement may continue in the short term.
Within the technical outlook, if buying appetite is maintained and market momentum strengthens, BNB is expected to retest the $870 resistance level in the first stage. Breaking above this level could potentially lead to a move above the descending trend line. If the trend breakout is confirmed and the price manages to hold above this level, a rise towards the $900 and $930 levels is technically possible.
On the other hand, if selling pressure increases, the price is expected to retest the $850 support level. If this level is broken downward, a pullback towards the $835 and $820 support zones may come into play.
Supports: 850 – 835 – 820
Resistances: 870 – 900 – 930

Legal Notice
The investment information, comments, and recommendations contained herein do not constitute investment advice. Investment advisory services are provided individually by authorized institutions taking into account the risk and return preferences of individuals. The comments and recommendations contained herein are of a general nature. These recommendations may not be suitable for your financial situation and risk and return preferences. Therefore, making an investment decision based solely on the information contained herein may not produce results in line with your expectations.

