
Technical Analysis
BTC/USDT
The Fed’s December FOMC minutes showed that uncertainties regarding monetary policy persist and that officials disagree on the timing of interest rate cuts. Rising employment risks supported a 25-basis-point cut in December, while inflation remaining above target signaled a cautious stance against more aggressive easing. The Fed emphasized that the policy rate is approaching its neutral level, noting that potential steps in 2026 will be data-dependent and that short-term Treasury purchases could be deployed if necessary.
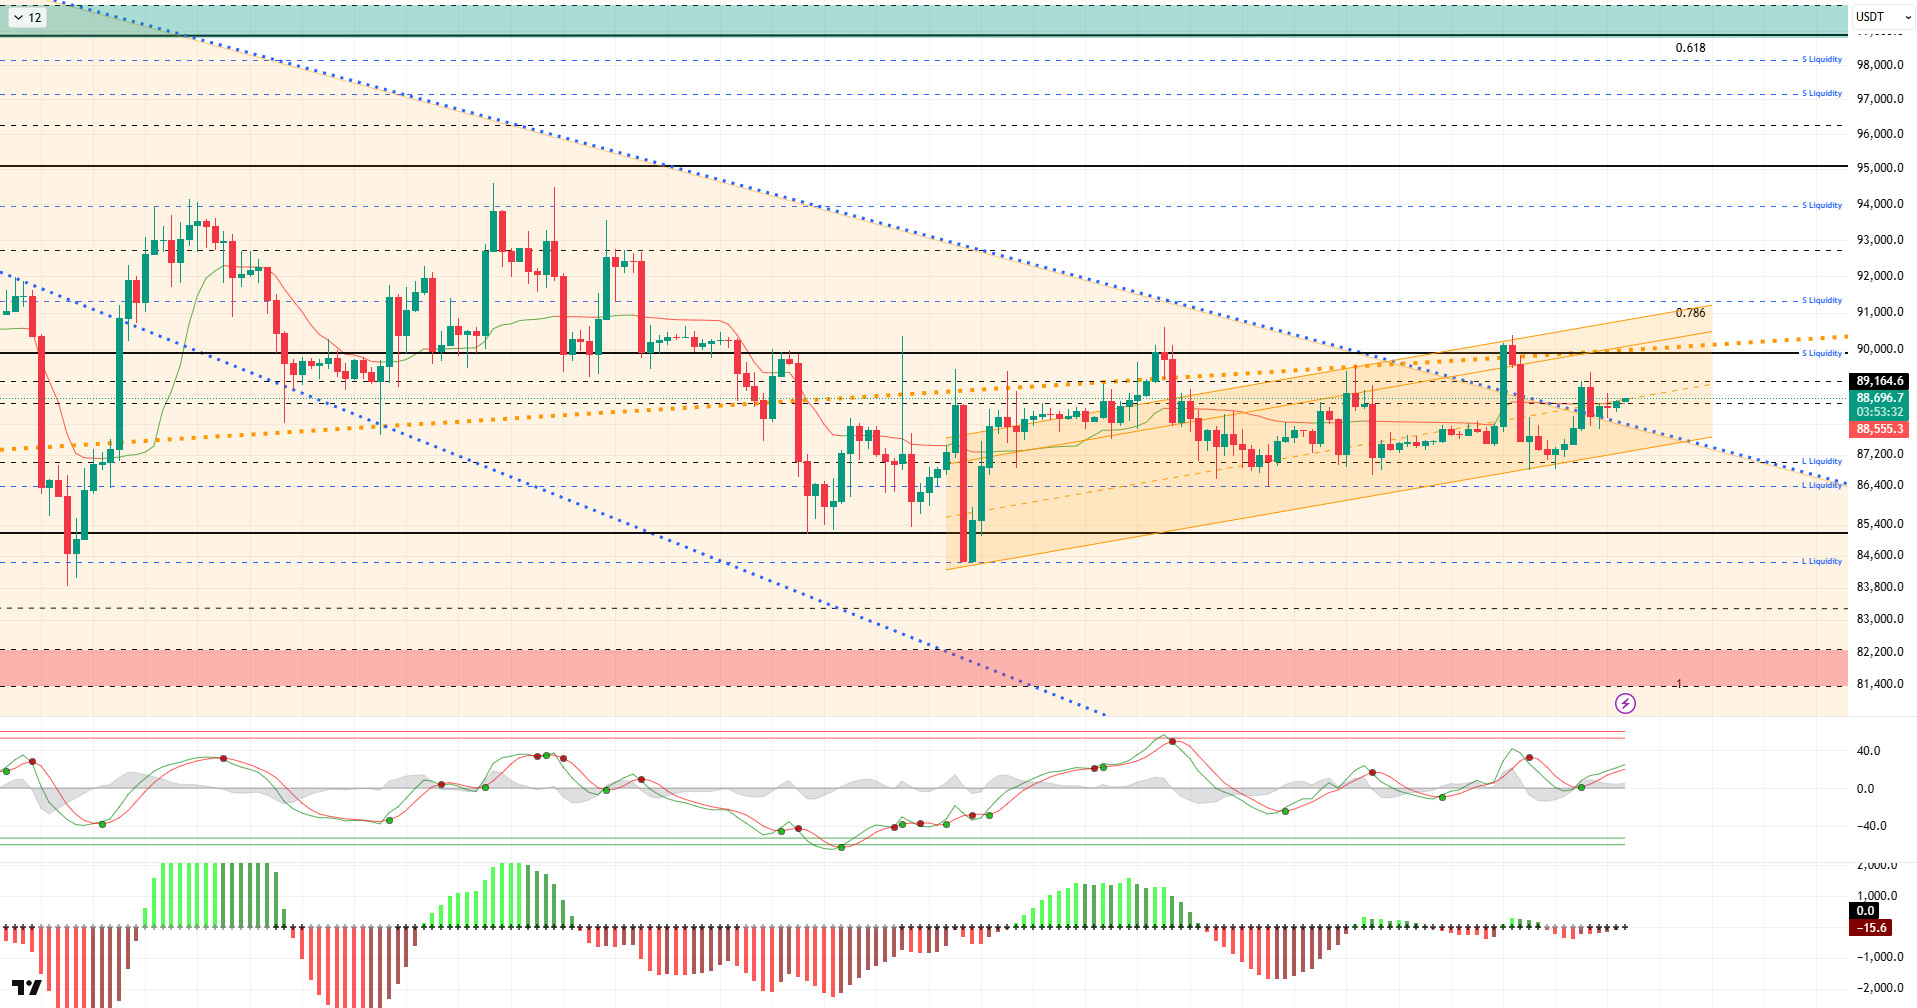
From a technical perspective, BTC continues to recover after testing the reference point of 90,000 and recording a significant decline. The price, which first fell and then entered a horizontal band, appears to be attempting to form a minor upward channel. Indeed, the price, which broke out of the falling orange band it started since the ATH level, continues to use this area as support. As BTC prepares to close the year negatively with a 5.28% decline on the last day of the year, we will follow whether the price breaks through the 90,000 barrier in the first days of the new year.
Technical indicators show the Wave Trend (WT) oscillator giving a buy signal again at the channel’s middle band, while the histogram on the Squeeze Momentum (SM) indicator is attempting to move back into positive territory. The Kaufman Moving Average (KAMA) is currently at $88,554, just below the price.
Looking at liquidation data, buy-side transactions are concentrated at the $86,000 level. In contrast, sell-side transactions have re-accumulated at the $90,000 level in the short term, while the $91,000 level stands out as a liquidity zone in the broader time frame.
In summary, the FOMC minutes highlighted uncertainty and data-driven action, reflecting differences of opinion among Fed members. Liquidity data shows that areas of concentrated short-term trading are being targeted, while long-term sell orders have yet to be tested.After this stage, the 88,500 level stands out as a short-term resistance area for the price to regain momentum.Closes and pricing above this level could enable the 90,000 reference area to be tested once again with renewed momentum. In the event of potential selling pressure, 87,000 stands out as a short-term support area, while 86,000 will be monitored as another liquidity area.
Supports: 86,300 – 85,000 – 84,000
Resistances: 88,500 – 89,000 – 90,000
ETH/USDT
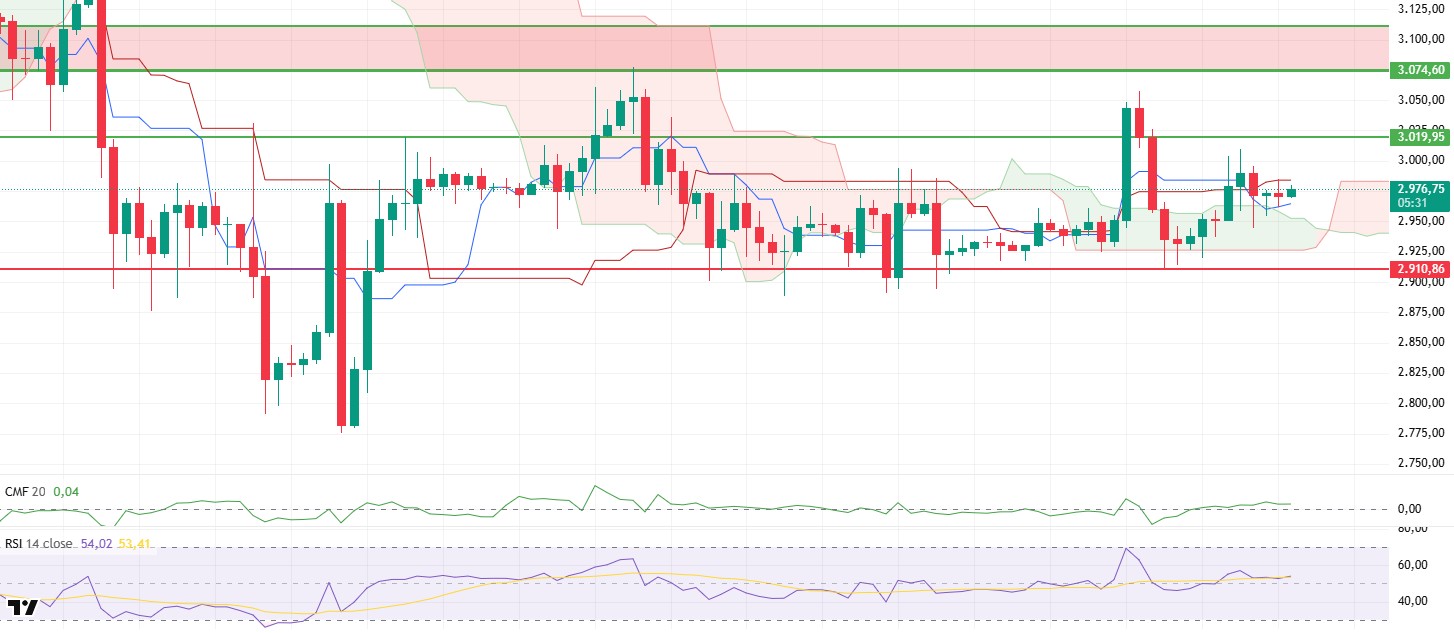
Last night, ETH’s upward movement met resistance at the $3,009 level, and the price retreated with selling pressure from this area. The decline continued to $2,945, but with selling pressure weakening at this level, a rebound began. The price is currently seeking equilibrium around $2,975. This price behavior during the day shows that buyers have not completely retreated, but that the area above $3,000 is still challenging.
Looking at liquidity flow, the picture has not deteriorated compared to this morning. Chaikin Money Flow (CMF) remains in positive territory. Although the upward slope has slowed, there is no significant outflow of money from the market. This suggests that the pullback is not panic-driven but rather shaped by short-term profit-taking. The CMF staying in positive territory helps the price hold more comfortably at lower levels.
Momentum is balanced. The Relative Strength Index (RSI) is moving sideways above the 50 level. This RSI stance indicates that buyers have not completely lost their advantage but also lack the strength to generate new momentum. The preservation of momentum prevents the price from falling sharply but shows that a new trigger is needed for the upward movement to accelerate.
Technically, the Ichimoku indicator remains positive. The price is above the kumo cloud, and the Tenkan and Kijun levels are holding. This structure suggests that the medium-term outlook remains intact and that the recent pullback is within technical limits. As long as the price stays above the kumo, the main trend can be said to remain upward.
Looking at the overall picture, the outlook is calmer than the previous day but still positive. The $3,020 level remains the main resistance to be broken to the upside. It seems difficult for the rally to gain momentum without breaking through this area. On the downside, the $2,910 level maintains its position as the main support. As long as it stays above this area, the current pullbacks can be interpreted more as a consolidation movement ( ). Although ETH continues to point upwards, a volatile pricing process is prominent in the short term.
Below the Form
Supports: 2,910 – 2,727 – 2,625
Resistances: 3,019 – 3,074 – 3,227
XRP/USDT
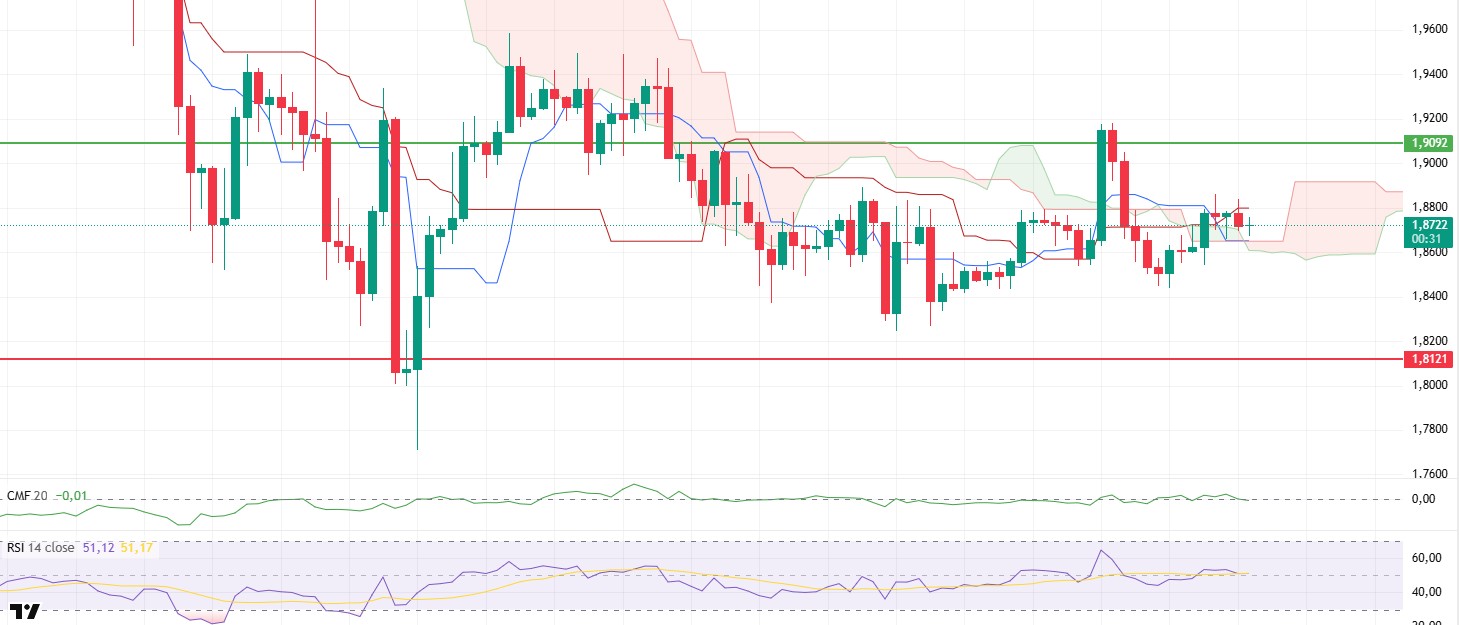
The price remained calm throughout the day on the XRP side and continued its movement within a narrow band, holding around $1.87. Neither upward attempts gained momentum nor did sales become apparent. This picture shows that a wait-and-see mood still prevails in the market and that no strong decision has been made in the short term. Low volume also supports this stagnation.
There is no significant change in cash flow compared to the previous outlook. Although Chaikin Money Flow (CMF) remains in positive territory, it is not gaining any noticeable momentum. This suggests that cash inflows into the market have not completely dried up, but they are not strong enough to drive a new rally. This limited liquidity explains why prices continue to hover at their current levels.
The picture is largely the same on the RSI side. The indicator is moving sideways and is not producing a clear direction around the 50 level. This outlook shows that buyers are not strong enough to take control, while sellers are reluctant to push the price down. With no significant change in momentum, price behavior is also stuck in a narrow range.
From a technical perspective, Ichimoku shows a relatively more positive detail. The price rising above the kumo cloud indicates that pressure has eased in the short term. However, there is no clear superiority established with regard to the Tenkan and Kijun levels. Therefore, although there is an improvement in the technical outlook, it is too early to talk about a strong trend.
Overall, there is no significant change in direction compared to previous days. The $1.90 level remains the main area to overcome on the upside. Until this area is breached, upward attempts are likely to remain limited. On the downside, the $1.84 level retains its importance. Under current conditions, the outlook for XRP suggests a continuation of a sideways and cautious trend.
Supports: 1.8121 – 1.6224 – 1.5146
Resistances: 1.9092 – 2.0543 – 2.1731
SOL/USDT
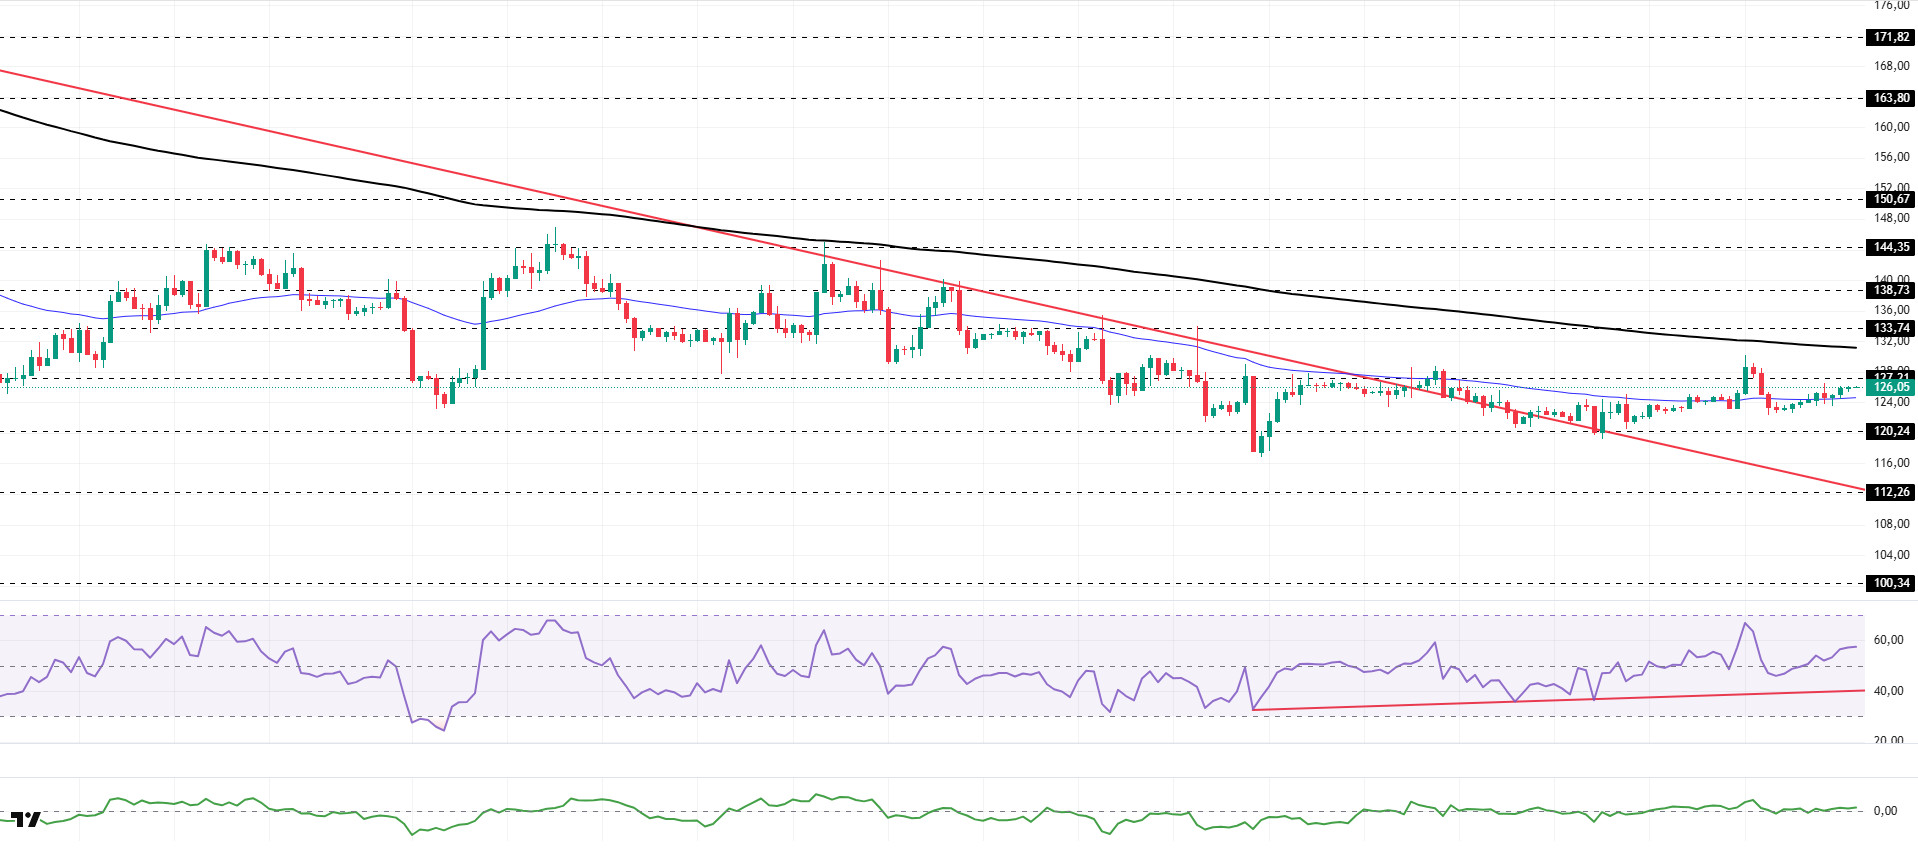
The SOL price showed a slight increase. The asset continued to trade in the upper region of the downward trend that began on October 8. Testing the strong resistance level of $127.21, the price moved to the lower region of the 50 EMA (Blue Line) moving average but has now risen from there and started trading above the 50 EMA moving average. If the rise continues, the 200 EMA (Black Line) moving average may act as resistance. In case of a pullback, the $120.24 level may act as support.
On the 4-hour chart, the price remained below the 50 EMA (Exponential Moving Average – Blue Line) and 200 EMA (Black Line). This indicates that the medium-term downtrend is continuing. At the same time, the price being between the two moving averages indicates that the asset is in a decision phase in the short term. The Chaikin Money Flow (CMF-20) is in positive territory. However, a decrease in money inflows could push the CMF into negative territory. The Relative Strength Index (RSI-14) rose from neutral to positive levels. It also remained above the upward trend that began on December 18. These indicate that buying pressure continues. In the event of an uptrend driven by macroeconomic data or positive news related to the Solana ecosystem, the $138.73 level stands out as a strong resistance point. If this level is broken upwards, the uptrend is expected to continue. In the event of pullbacks due to developments in the opposite direction or profit-taking, the $112.26 level could be tested. A decline to these support levels could increase buying momentum, presenting a potential opportunity for an upward move.
Supports: 120.24 – 112.26 – 100.34
Resistances: 127.12 – 133.74 – 138.73
DOGE/USDT
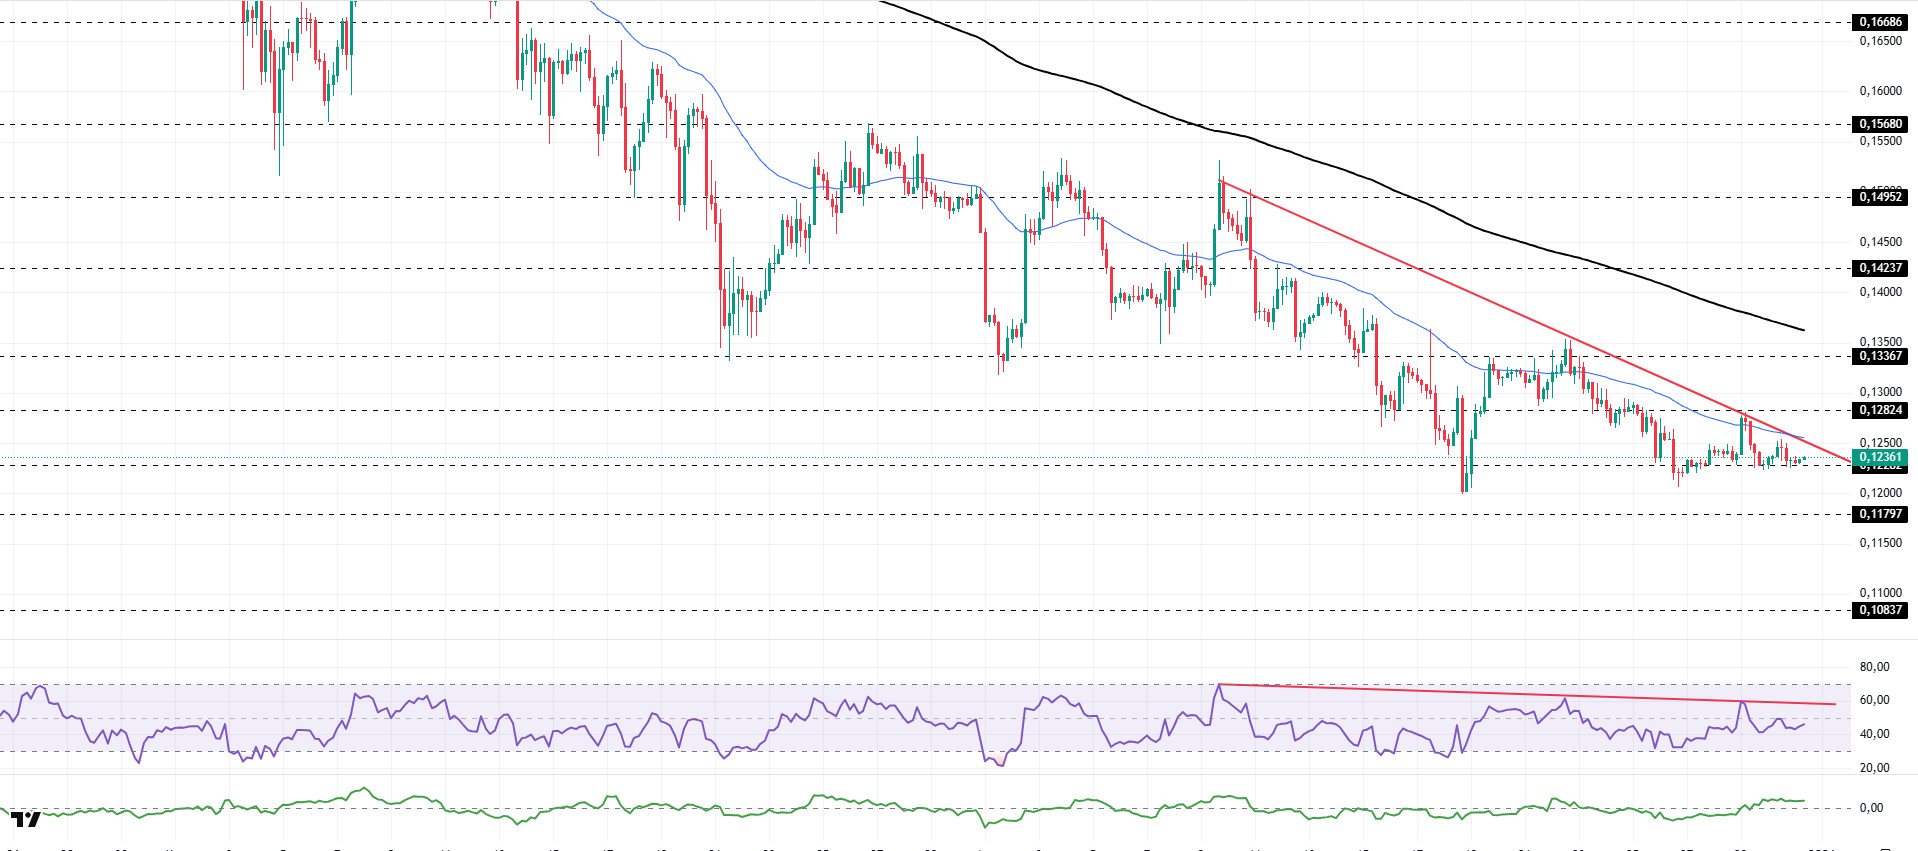
The DOGE price showed a slight decline. The asset tested the 50 EMA (Blue Line) moving average and the descending trend line that began on the 9th as resistance but failed to hold here and experienced a pullback. Currently testing the $0.12282 level as support, the price may retest the 50 EMA (Blue Line) moving average and the downward trend as resistance if it closes above this level. If the pullback continues, the $0.11797 level may act as support again.
On the 4-hour chart, the 50 EMA (Exponential Moving Average – Blue Line) remained below the 200 EMA (Black Line). This indicates that the downtrend could continue in the medium term. The price being below both moving averages indicates a downward trend in the short term. The Chaikin Money Flow (CMF-20) remained in positive territory. Additionally, a decrease in cash inflows could push the CMF into negative territory. The Relative Strength Index (RSI-14) experienced slight selling pressure and retreated to the middle of the negative zone. It also remained below the downward trend line that began on December 9. This signaled that selling pressure was continuing. In the event of potential increases driven by political developments, macroeconomic data, or positive news flow within the DOGE ecosystem, the $0.14237 level stands out as a strong resistance zone. Conversely, in the event of negative news flow, the $0.11797 level could be triggered. A decline to these levels could increase momentum and initiate a new wave of growth.
Supports: 0.12282 – 0.11797 – 0.10837
Resistances: 0.12824 – 0.13367 – 0.14237
BNB/USDT
From a technical perspective, BNB/USDT gained positive momentum with the support provided by the new candles and rose to the $930 level; however, increased selling pressure was observed in this region depending on market conditions. With the effect of increased selling pressure, the asset appears to have continued its movement within a declining channel for some time.
However, BNB, which turned upward with the support it received from the middle band of the descending channel, gained positive momentum by breaking the upper band of the channel upward. In this direction, the asset rose above the previously determined target level of $860 and reached the $875 level. Although partial pressure is seen at these levels, the overall technical outlook is considered to maintain its positive structure.
Currently trading in the $850–875 range, technical indicators for BNB show that low trading volume is limiting the upward momentum. Additionally, the RSI indicator reaching the 70 level with the recent rises and reacting from this level indicates that a limited correction movement may continue in the short term.
Within the technical outlook, if buying appetite is maintained and market momentum strengthens, BNB is expected to retest the $875 resistance level in the first stage. Breaking above this level could potentially lead to a move above the descending trend line. If the trend breakout is confirmed and the price manages to hold above this level, a rise towards the $900 and $930 levels is technically possible.
On the other hand, if selling pressure increases, the price is expected to retest the $850 support level. If this level is broken downward, a pullback towards the $835 and $820 support zones may come into play.
Supports: 850 – 835 – 820
Resistances: 875 – 900 – 930

Legal Notice
The investment information, comments, and recommendations contained herein do not constitute investment advice. Investment advisory services are provided individually by authorized institutions taking into account the risk and return preferences of individuals. The comments and recommendations contained herein are of a general nature. These recommendations may not be suitable for your financial situation and risk and return preferences. Therefore, making an investment decision based solely on the information contained herein may not produce results in line with your expectations.

