
Technical Analysis
BTC/USDT
Important developments are taking place in the US economy and crypto markets. The Trump administration plans to make limited trade agreements with some countries to avoid tariffs. On the other hand, the “American Bitcoin” initiative linked to the Trump family received an investment of 220 million dollars. Political interest in crypto was not limited to these developments; Trump’s “great and beautiful” bill was delayed in the Senate due to the crypto tax cuts that were wanted to be included in it. At the same time, Trump’s official stores now accept payment in TRUMP coins, while Elon Musk’s past subsidies were also on Trump’s agenda. Today, eyes will be on Fed Chairman Powell’s statements on the interest rate inflation cycle.
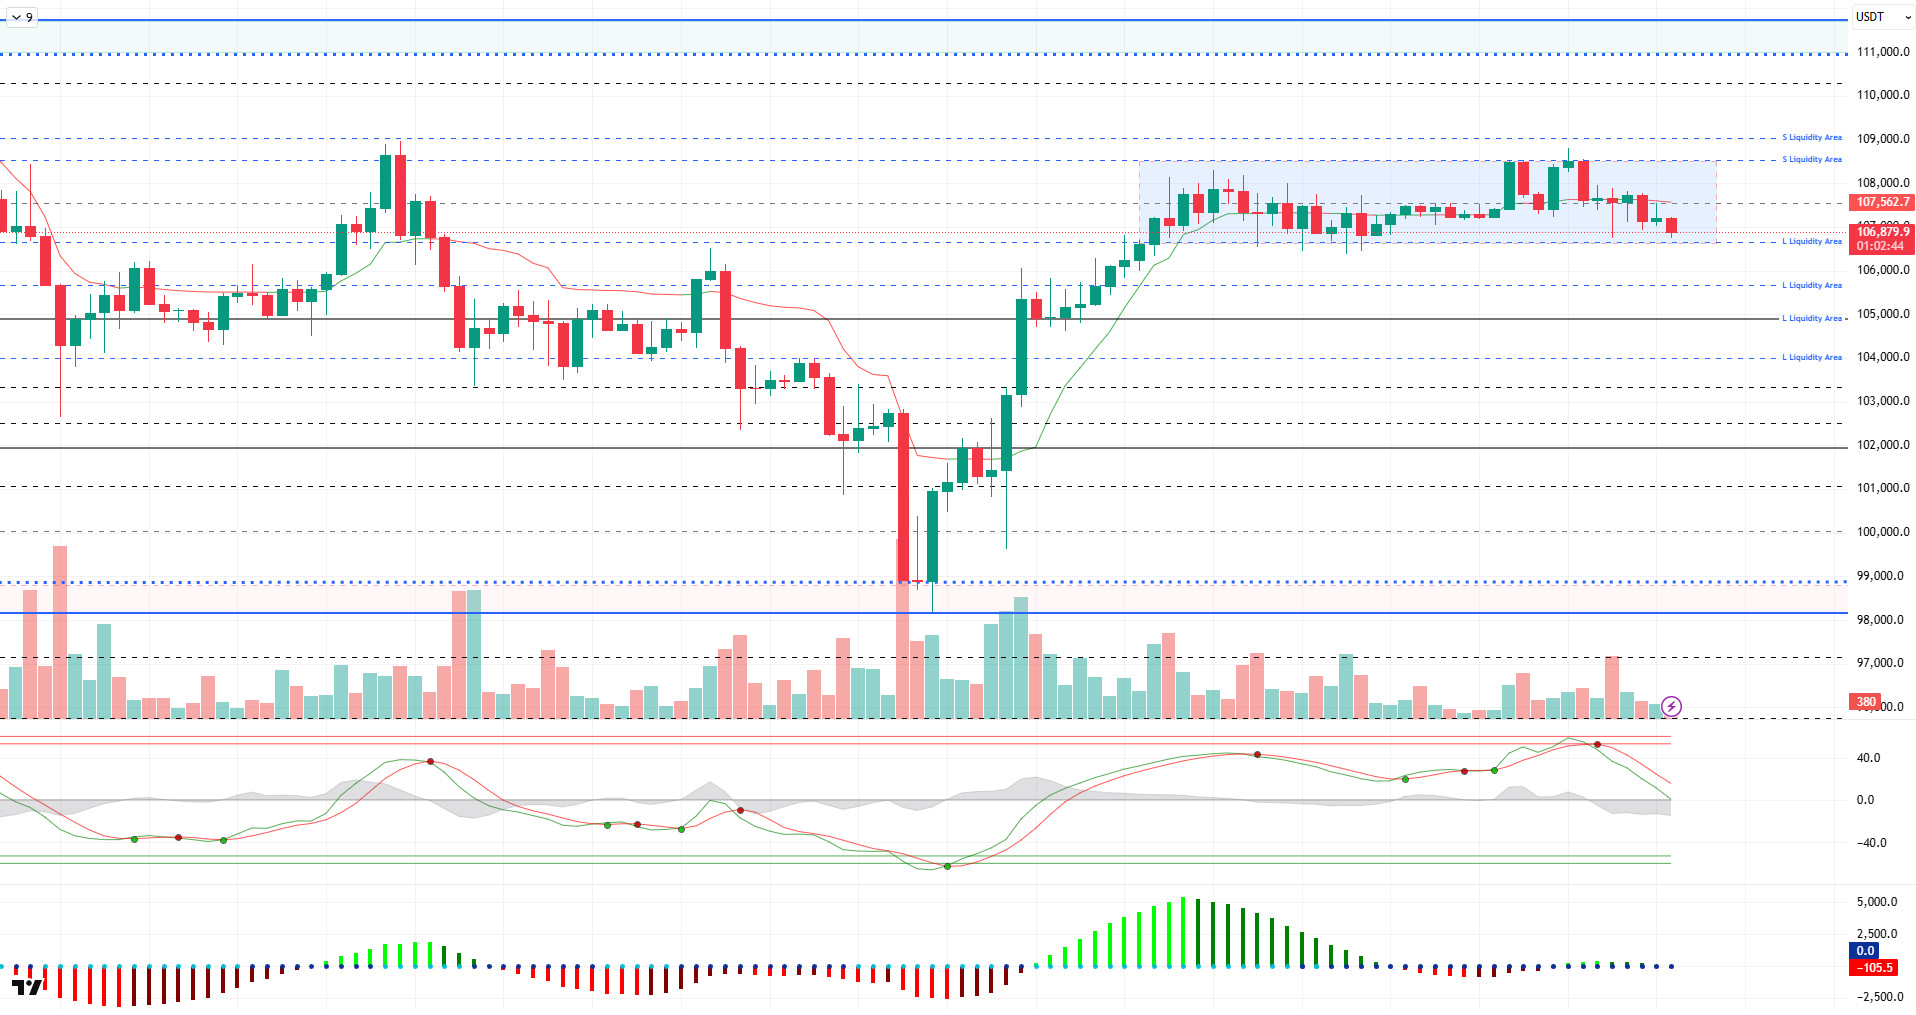
Looking at the technical outlook, BTC is trading at 106,800 at the time of writing, while continuing its horizontal price movements in a slightly sellers image.
On the technical indicators front, Wave Trend (WT) confirms the short-term decline by hitting the channel mid-band. The histogram on the Squeeze Momentum (SM) indicator has moved back into negative territory, while low volume and volatility continue. The Kaufman moving average is above the price at 107,500, another factor confirming the falling price action.
Analyzing the liquidity data, short-term buy and sell trades started to reappear. While the sell side has liquidated somewhat at 109,000, the buy side is in a wide band between 103,000 and 107,000. While the short-term buying level is 106,300, this level can be followed as support in the continuation of the decline.
As a result, while fundamental developments continue to be a catalyst for pricing, technical and liquidity data continue to be the reason for the price to experience short-term pullbacks. In case the selling pressure deepens, the 105,000 level appears as a reference point. On the other hand, if the optimistic atmosphere created by fundamental developments becomes dominant again, 107,500 will be monitored as the resistance level, while we can follow the 109,000 level in case it is exceeded.
Supports 106,000 – 105,000 – 103,300
Resistances 107,500 – 109,000 – 110,000
ETH/USDT
ETH price made a short-term rise yesterday evening, rising above the $2,520 level with the purchases coming in the evening hours. However, with the selling pressure coming from this region, it is seen that the price has turned its direction down again and retreated to the kijun support at $2,455.
On the technical indicators side, the double top formation on the Relative Strength Index (RSI) is noteworthy. This pattern indicates that buyers are losing strength and the upside momentum is weakening. In addition, the RSI remains below the based moving average line, indicating that the negative pressure on the price continues. The momentum indicator also supports this picture, the weak trend continues and does not produce a clear signal of a new momentum formation.
When the Ichimoku indicator is analyzed, the fact that the price is still pricing above the kumo cloud shows that the general trend remains positive. However, in the short term, it is especially important to maintain the kijun support at the $2,455 level. Closes below this level could pave the way for the market to test the previous support zone at the $2,400 level again. On the other hand, if it stays above this level, it is possible to experience short-term reaction rises.
Although the Chaikin Money Flow (CMF) indicator is still moving in positive territory, it shows a downward trend, indicating that liquidity outflows have started in the market, albeit limited. This points to a structure where buying pressure has weakened but not completely ended.
In summary, as of the current technical structure, the kijun support at the level of $2,455 is a decisive threshold in terms of short-term price movements. While pricing that may occur below this level may cause deeper retracements, this support must first be maintained and then the resistance of $2,533 must be exceeded for the continuation of upward movements.
Top of Form
Below the Form
Supports 2,329 – 2,130 – 2,029
Resistances 2,533 – 2,736 – 2,857

XRP/USDT
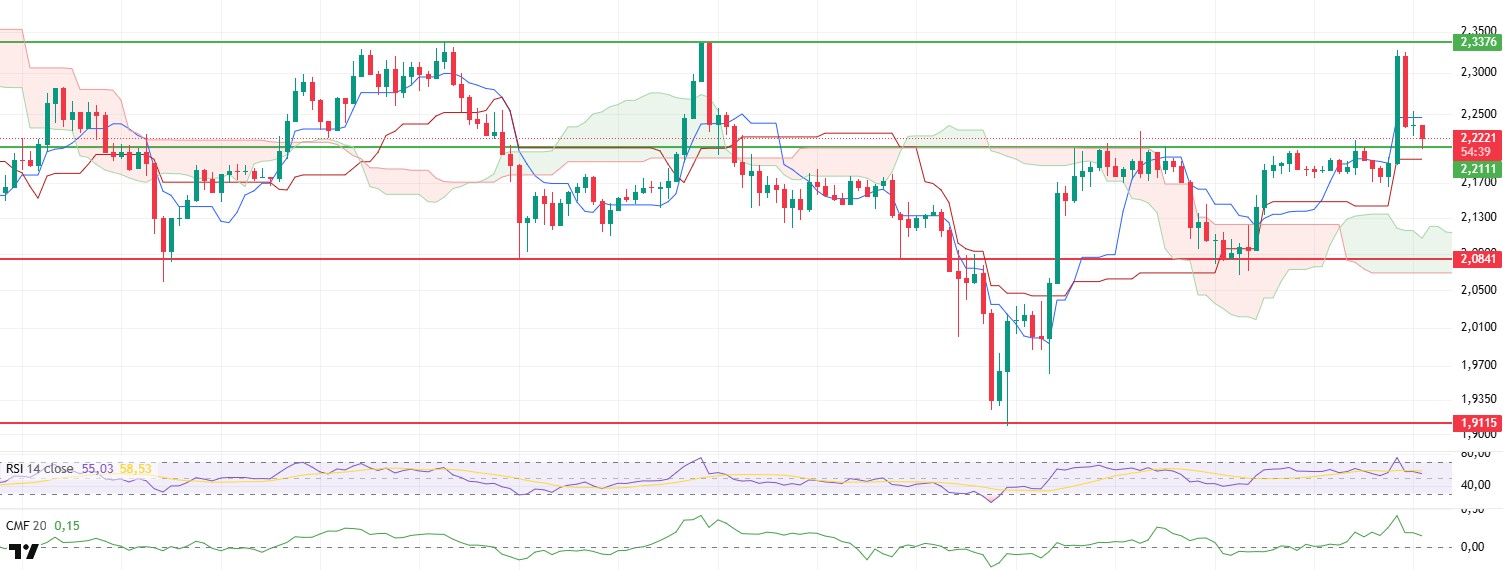
XRP gained a strong bullish momentum yesterday evening, breaking through the critical resistance zone at the $2.21 level and climbing as high as $2.33 with this move. However, with the effect of the general selling pressure in the cryptocurrency market, these gains could not be permanent and the price retreated back to the $2.21 level. This movement shows that volatility and uncertainty in the market continues.
When technical indicators are analyzed, the ichimoku indicator continues to present a positive picture for XRP in the short term. The fact that the price is still holding above the kijun level indicates that the short-term positive outlook continues. In addition, the fact that the price is positioned on the kumo cloud and the cloud tends to expand upwards indicates that the general trend is in favor of buyers and the upside potential is maintained.
On the other hand, some signals of weakness are also noteworthy. In particular, the sharp pullback in the Chaikin Money Flow (CMF) indicator indicates a significant outflow of liquidity from the market. This outlook suggests that the uptrend is not supported by a strong capital inflow and the current buying appetite is starting to weaken. The Relative Strength Index (RSI) indicator has also exhibited a similar trend and has switched to a bearish structure with a sharp pullback. This confirms that market momentum is weakening in the short term.
As a result, it is critical for the XRP price to hold on to the kijun support at the level of $2.21 and just below the level of $2.1970 during the day. If these regions are maintained, the price may enter a recovery trend again. However, the loss of these supports may pave the way for the start of a new wave of technical decline and the testing of lower support zones. Therefore, price reactions that may occur at current levels will be decisive in terms of determining the short-term direction.
Supports 2.2111 – 1.0841 – 1.9115
Resistances 2.3376 – 2.4788 – 2.5900
SOL/USDT
Some centralized exchanges are launching tokenized Coinbase and Nvidia stocks on Solana.
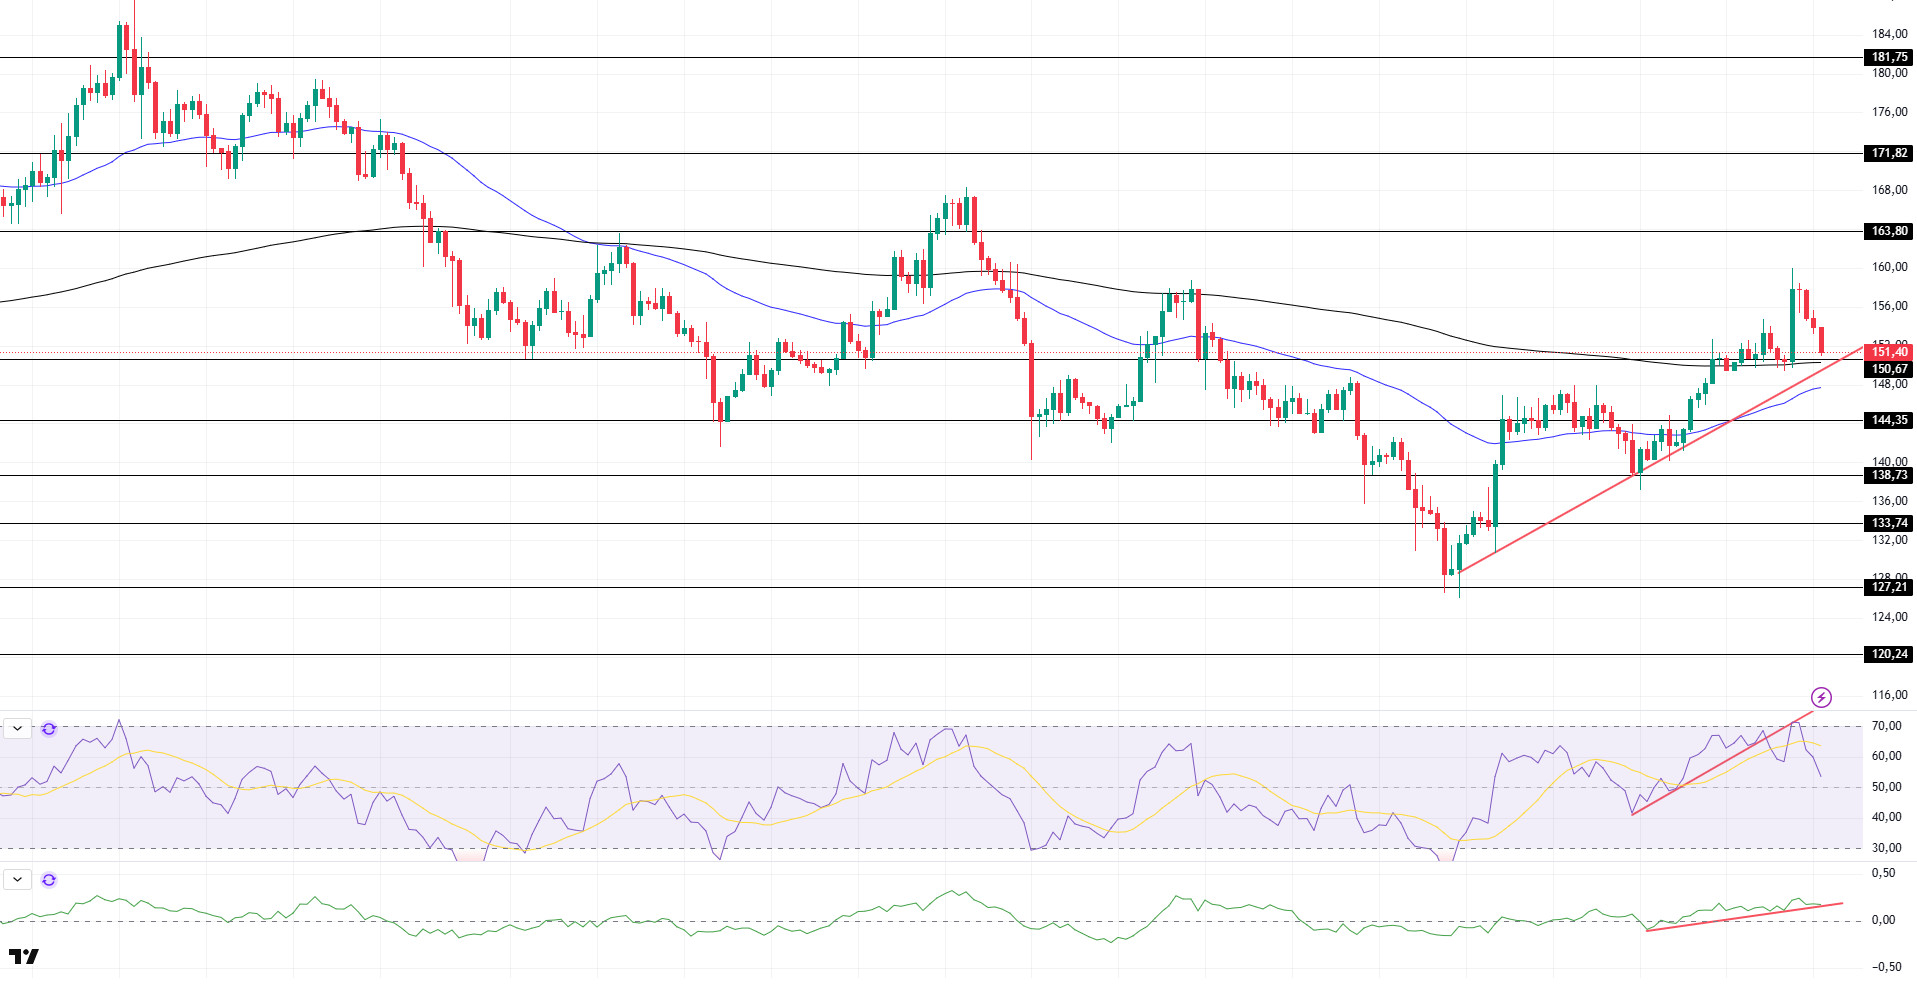
SOL price was bullish. The asset continued to be above the 200 EMA (Black Line) moving average, which is a strong resistance location. If the price continues to stay above the moving average, the $163.80 level is an important resistance level. On candle closes below the 200 EMA moving average, the support level of the uptrend that started on June 22 and the 50 EMA (Blue Line) should be followed.
On the 4-hour chart, the 50 EMA continued to be below the 200 EMA. This suggests that the bearish trend may continue in the medium term. At the same time, the fact that the price is above both moving averages suggests that the market is currently bullish in the short term. Chaikin Money Flow (CMF-20) continued to be in positive territory; in addition, a decline in inflows could push it back into negative territory. At the same time, it is currently testing the uptrend that started on June 27 as support. Relative Strength Index (RSI-14) is in positive territory. On the other hand, it broke the uptrend that started on June 26 to the downside and tested it as resistance but failed to break it. This may bring a decline. In case of an uptrend on the back of macroeconomic data or positive news on the Solana ecosystem, the $163.80 level stands out as a strong resistance point. If this level is broken upwards, the rise can be expected to continue. If there are pullbacks due to contrary developments or profit realizations, the $144.35 level can be tested. In case of a decline to these support levels, the increase in buying momentum may offer a potential bullish opportunity.
Supports 150.67 – 144.35 – 138.73
Resistances 163.80 – 171.82 – 181.75
DOGE/USDT
SEC postponed its decision on 21Shares spot Dogecoin ETF.
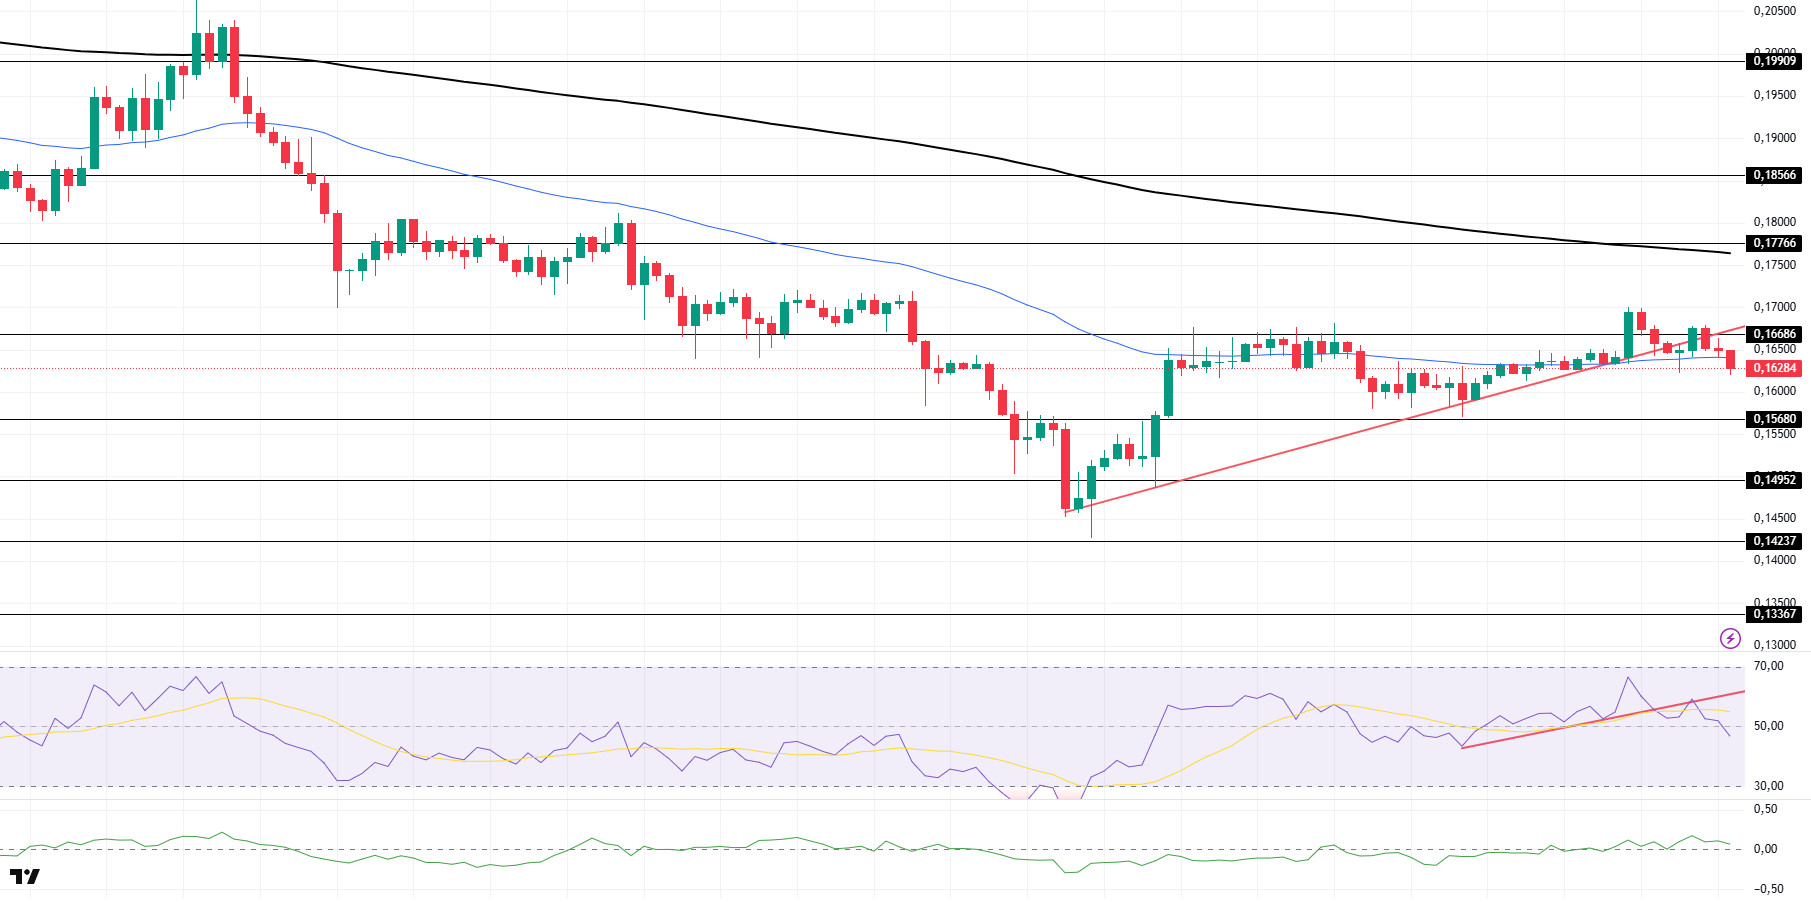
DOGE price continued its horizontal movements. Supported by the uptrend that started on June 22 and the 50 EMA moving average, the asset failed to hold above the uptrend and retreated. The asset, which is currently testing the 50 EMA moving average as support, may test the $0.15680 level on candle closes below this support level. If the price continues to rise, the $0.17766 level should be followed as a strong resistance place.
On the 4-hour chart, the 50 EMA (Blue Line) continues to be below the 200 EMA (Black Line). This suggests that the asset is bearish in the medium term. The fact that the price is between the two moving averages suggests that the asset is in the decision phase in the short term. Chaikin Money Flow (CMF-20) continues to be in positive territory. In addition, negative money inflows may move CMF into negative territory. Relative Strength Index (RSI-14) fell to neutral. However, it broke the uptrend that started on June 27 to the downside. This may deepen the decline. The $0.17766 level stands out as a strong resistance zone in case of a possible rise in line with political developments, macroeconomic data or positive news flow in the DOGE ecosystem. In the opposite case or possible negative news flow, the $0.15680 level may be triggered. In case of a decline to these levels, the momentum may increase and a new bullish wave may start.
Supports 0.15680 – 0.14952 – 0.14237
Resistances 0.16686 – 0.17766 – 0.18566
Legal Notice
The investment information, comments and recommendations contained herein do not constitute investment advice. Investment advisory services are provided individually by authorized institutions taking into account the risk and return preferences of individuals. The comments and recommendations contained herein are of a general nature. These recommendations may not be suitable for your financial situation and risk and return preferences. Therefore, making an investment decision based solely on the information contained herein may not produce results in line with your expectations.

