
TECHNICAL ANALYSIS
BTC/USDT
Treasury Secretary Benson announced that President Trump’s “Great and Beautiful Bill” will be voted on today; he also indicated that the Fed may be delayed in cutting interest rates. The Senate removed the ban on AI regulation from the same bill, paving the way for regulation in the field of artificial intelligence. On the crypto front, MARA Holdings announced that it produced 211 BTC in June and its total reserve reached 49,940 BTC. Today, Fed chairman Powell will be followed by the US senate vote, and we can say that negative pricing continues in US futures.
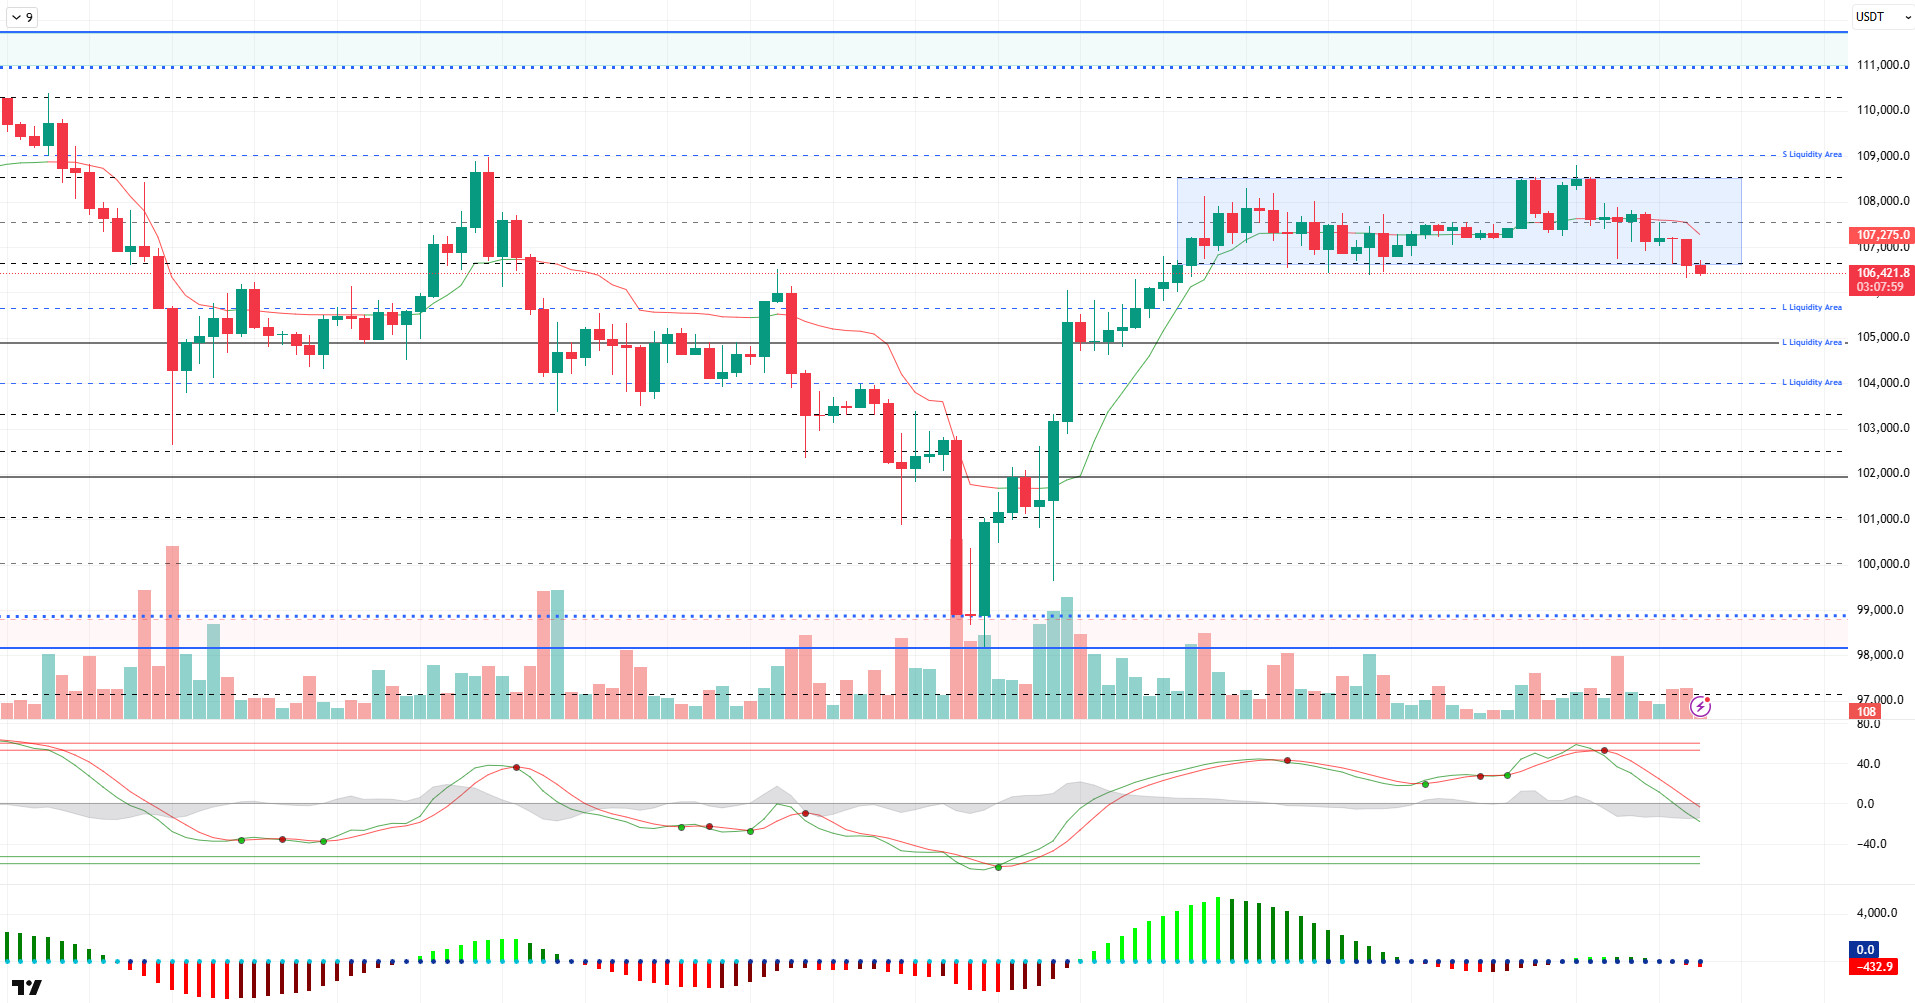
When we look at the technical outlook, BTC continues its horizontal price movements in a slightly sellers image, although there is no change compared to the previous analysis, and at the time of writing the analysis, it fell to 106,400 below the support level of 106,600.
On the technical indicators front, Wave Trend (WT) confirms the short-term decline by coming to the channel mid-band. The histogram on the Squeeze Momentum (SM) indicator has moved back into negative territory, while low volume and volatility continue. The Kaufman moving average is above the price at 107,300, another factor confirming the falling price action.
Analyzing the liquidity data, short-term buy and sell trades started to reappear. While the sell side has been liquidated at 109,000, the buy side is in a wide band between 103,000 and 106,000. The short-term buying level at 106,300 was liquidated during the day.
In conclusion, while fundamental developments continue to be the catalyst for pricing, technical and liquidity data continue to be the reason why the price is experiencing short-term pullbacks. In this context, while the price fell to 106,300, the 105,500 – 105,000 band can be followed as the region expected to receive a reaction in the continuation of the downward pressure. On the other hand, closures above the 107,500 level will be followed in a possible new upward movement.
Supports 106,000 – 105,000 – 103,300
Resistances 107,500 – 109,000 – 110,000
ETH/USDT
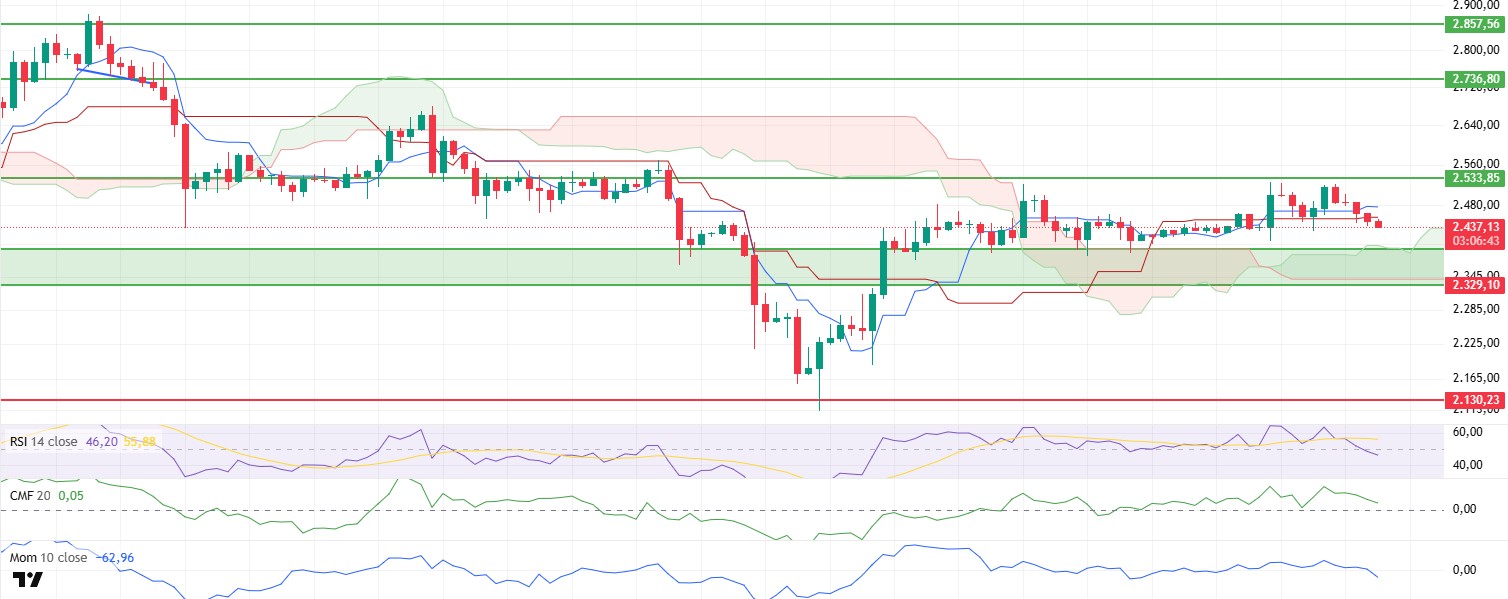
ETH continued its weak course during the day, dipping below the kijun level, an important threshold on the ichimoku indicator. This technical breakout signals a significant deterioration in the short-term outlook for the price, while simultaneously, other technical indicators are also showing significant downside signals.
Although the Chaikin Money Flow (CMF) indicator still remains in positive territory, the double top pattern formed in its last move and the sharp retracement that followed clearly indicates that liquidity outflows from the market have begun. This structure of CMF supports that buyer interest is waning and selling pressure is starting to increase. At the same time, the Cumulative Volume Delta (CVD) spot data also showed a notable decline. This data confirms the CMF data by showing that the volume-based buyer-seller balance in spot markets has shifted towards selling.
Weakness is also evident on the futures front. The sharp decline in the aggregated predicted funding rate and the decline in open interest indicate that long positions have started to close. This indicates that the market has turned cautious in general and bullish expectations have weakened.
The rapid decline in Relative Strength Index (RSI) and momentum indicator also confirms that the current technical weakness continues. Both indicators maintain their negative bias and signal that the pressure on the price may continue in the short term.
The outlook for the Ichimoku indicator is similarly negative. The price dipped below both the tenkan and kijun levels, indicating that the short-term structure has broken down. In this context, it is technically possible for ETH to pull back to the upper band of the kumo cloud at $2,400. However, the fact that the price is still positioned above the ichimoku cloud indicates that the positive outlook for the main trend continues. So, the current bearish move can be considered as a correction of the main uptrend for now.
As a result, if the ETH price continues to stay below the kijun resistance at $2,455 towards the evening hours, a gradual pullback to the $2,400 levels seems likely. On the other hand, the price regaining the $2,455 level could reduce short-term risks and set the stage for a new bullish momentum on the market.
Supports 2,329 – 2,130 – 2,029
Resistances 2,533 – 2,736 – 2,857
XRP/USDT
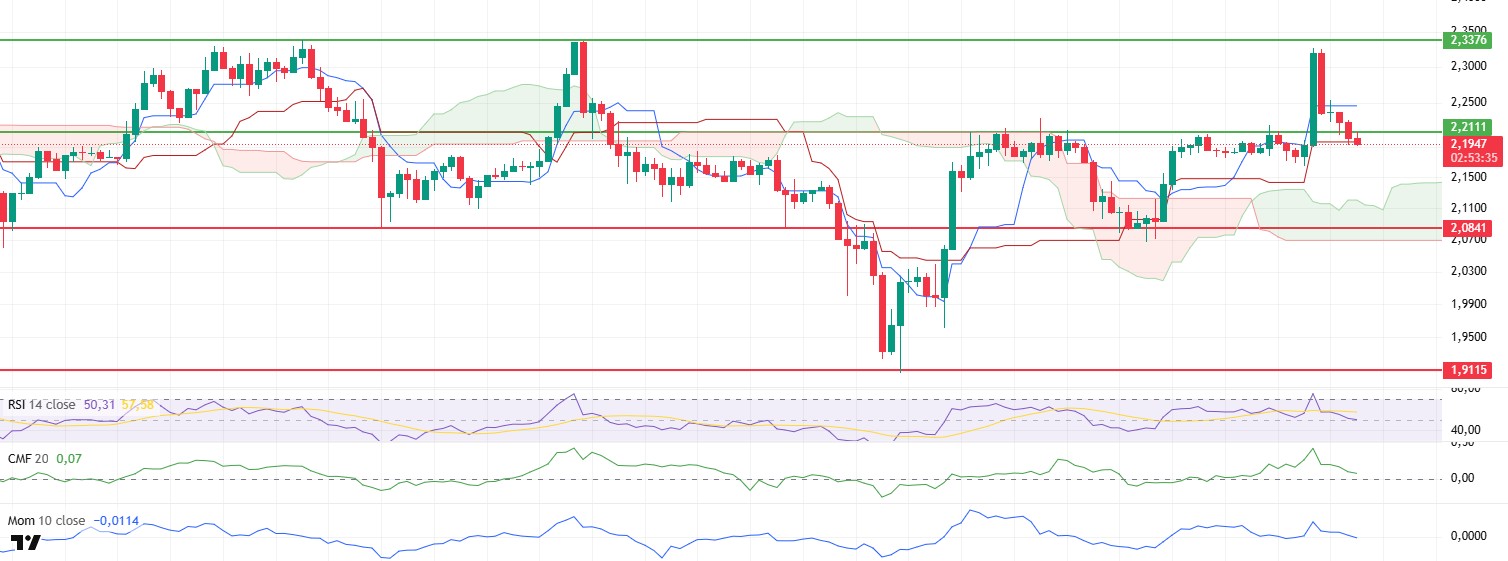
As mentioned in the analysis in the morning hours, XRP continued its decline due to the weak outlook in technical indicators and fell to the kijun level on the ichimoku indicator. Although there is limited support in this region as buyers step in, it is noteworthy that weakness continues across technical indicators.
The Chaikin Money Flow (CMF) indicator continued to decline significantly during the day, maintaining its negative trend. This situation reveals that liquidity outflows from the market have increased and the weakness on the buy side continues. In particular, the deepening of CMF in the negative zone indicates that the selling pressure is gaining strength in technical terms.
Relative Strength Index (RSI) and momentum indicators are also continuing their bearish trend by breaking their support levels downwards. This breakdown in both indicators suggests that upside reactions in XRP price may remain weak and the selling trend will remain dominant in the short term. The fact that the RSI has fallen below the 50 threshold level is an important signal that supports the weakening trend strength.
As for the Ichimoku indicator, the price is still pricing above the kumo cloud. This shows that the long-term structure remains on the positive side and the general trend has not yet broken. However, daily closes below the kijun level at $2.19 may increase short-term bearish risks. This level is critical for determining the short-term direction.
In summary, the general weakness in technical indicators and the acceleration of liquidity outflows continue to put pressure on XRP. If the closes below $2.19 continue, the potential for a deeper correction may come to the agenda, while maintaining above this level will keep the possibility of price recovery alive.
Supports 2.0841 – 1.9115 – 1.7226
Resistances 2.2111 – 2.3928 – 2.5900
SOL/USDT
PancakeSwap launched v3 liquidity pools in Solana.
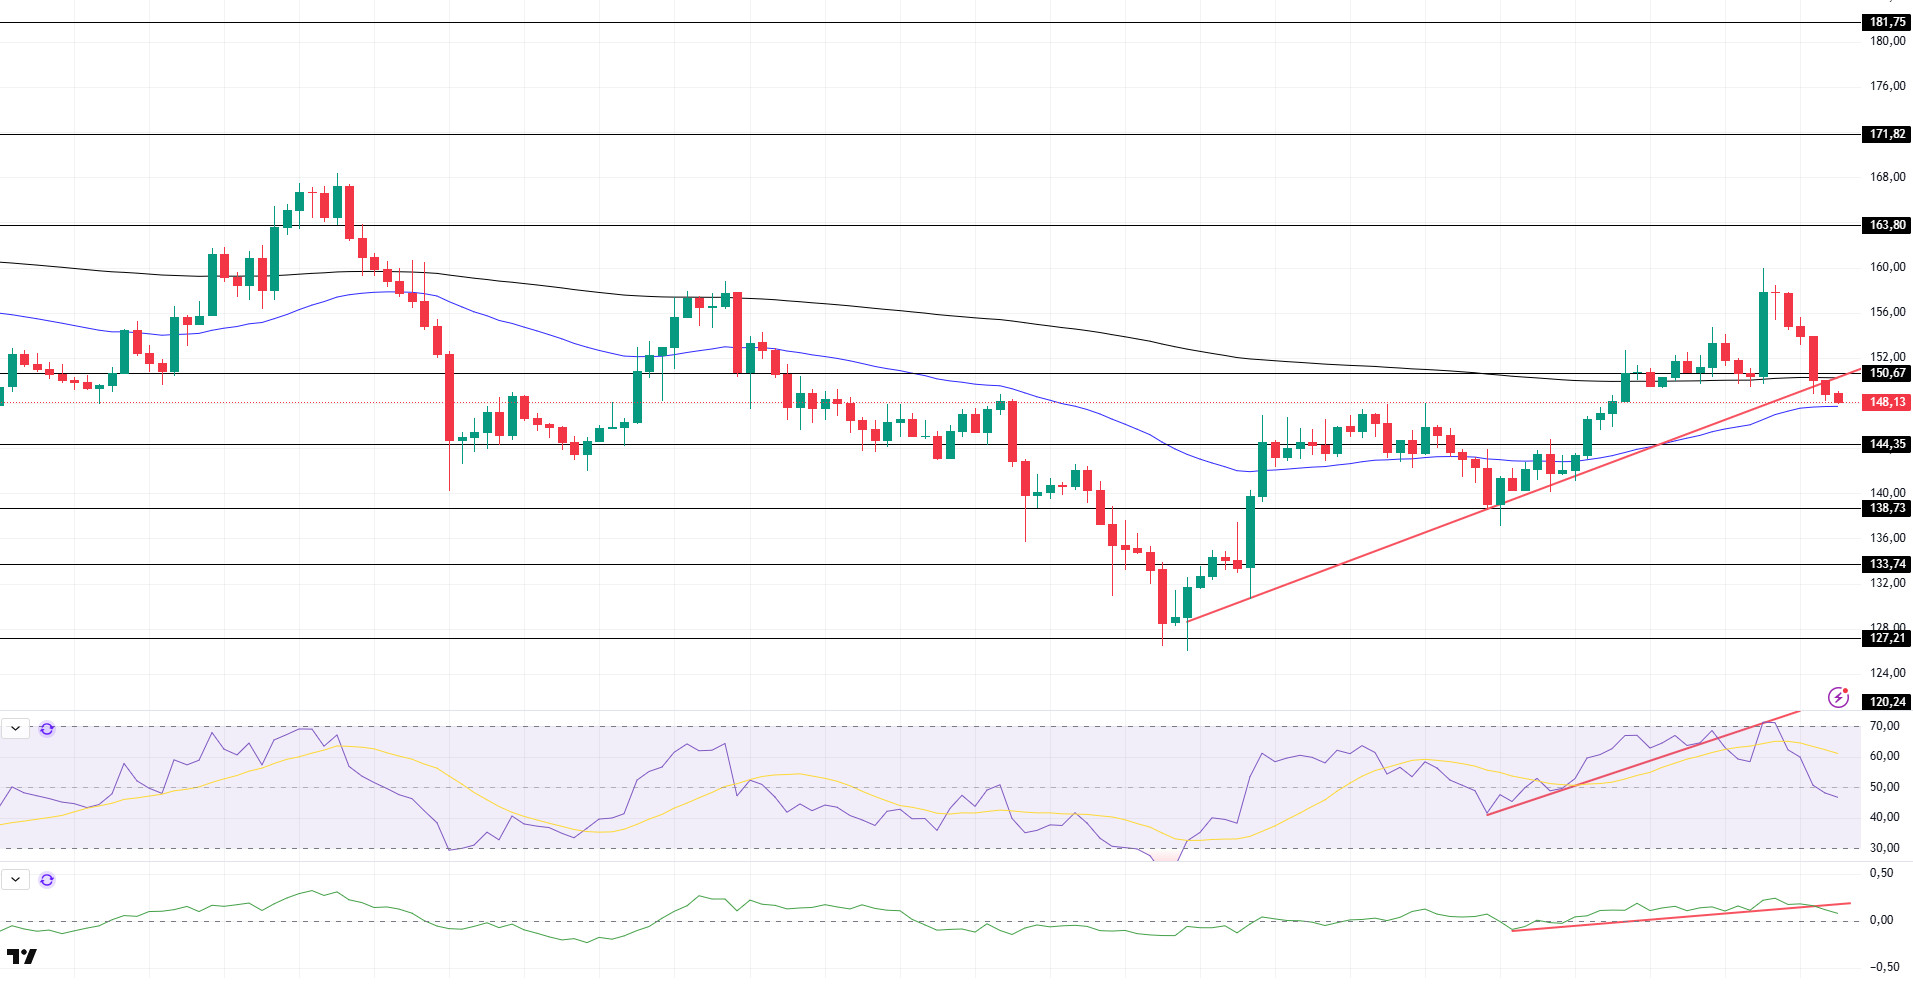
SOL price continued its decline during the day. The asset broke the 200 EMA (Black Line) moving average, which is a strong support and the uptrend to the downside, deepening its decline. If the price continues to stay below the moving average, the $144.35 level and the 50 EMA (Blue Line) moving average are important support levels. In the upward acceleration, the 200 EMA and the base level of the uptrend may work as resistance.
On the 4-hour chart, the 50 EMA continued to be below the 200 EMA. This suggests that the bearish trend may continue in the medium term. At the same time, the fact that the price is between both moving averages suggests that the market is currently in a short-term decision phase. Chaikin Money Flow (CMF-20) continued to be in positive territory; in addition, a decline in inflows could push CMF back into negative territory. It has also broken the uptrend that started on June 27 to the downside. This could deepen the decline. Relative Strength Index (RSI-14) moved from positive to negative territory. On the other hand, it continued to be below the uptrend that started on June 26, indicating that selling pressure continues. The $150.67 level stands out as a strong resistance point in case of an uptrend due to macroeconomic data or positive news on the Solana ecosystem. If this level is broken upwards, the rise can be expected to continue. If there are pullbacks due to contrary developments or profit realizations, the $ 144.35 level can be tested. In case of a decline to these support levels, the increase in buying momentum may offer a potential bullish opportunity.
Supports 144.35 – 138.73 – 133.74
Resistances 150.67 – 163.80 – 171.82
DOGE/USDT
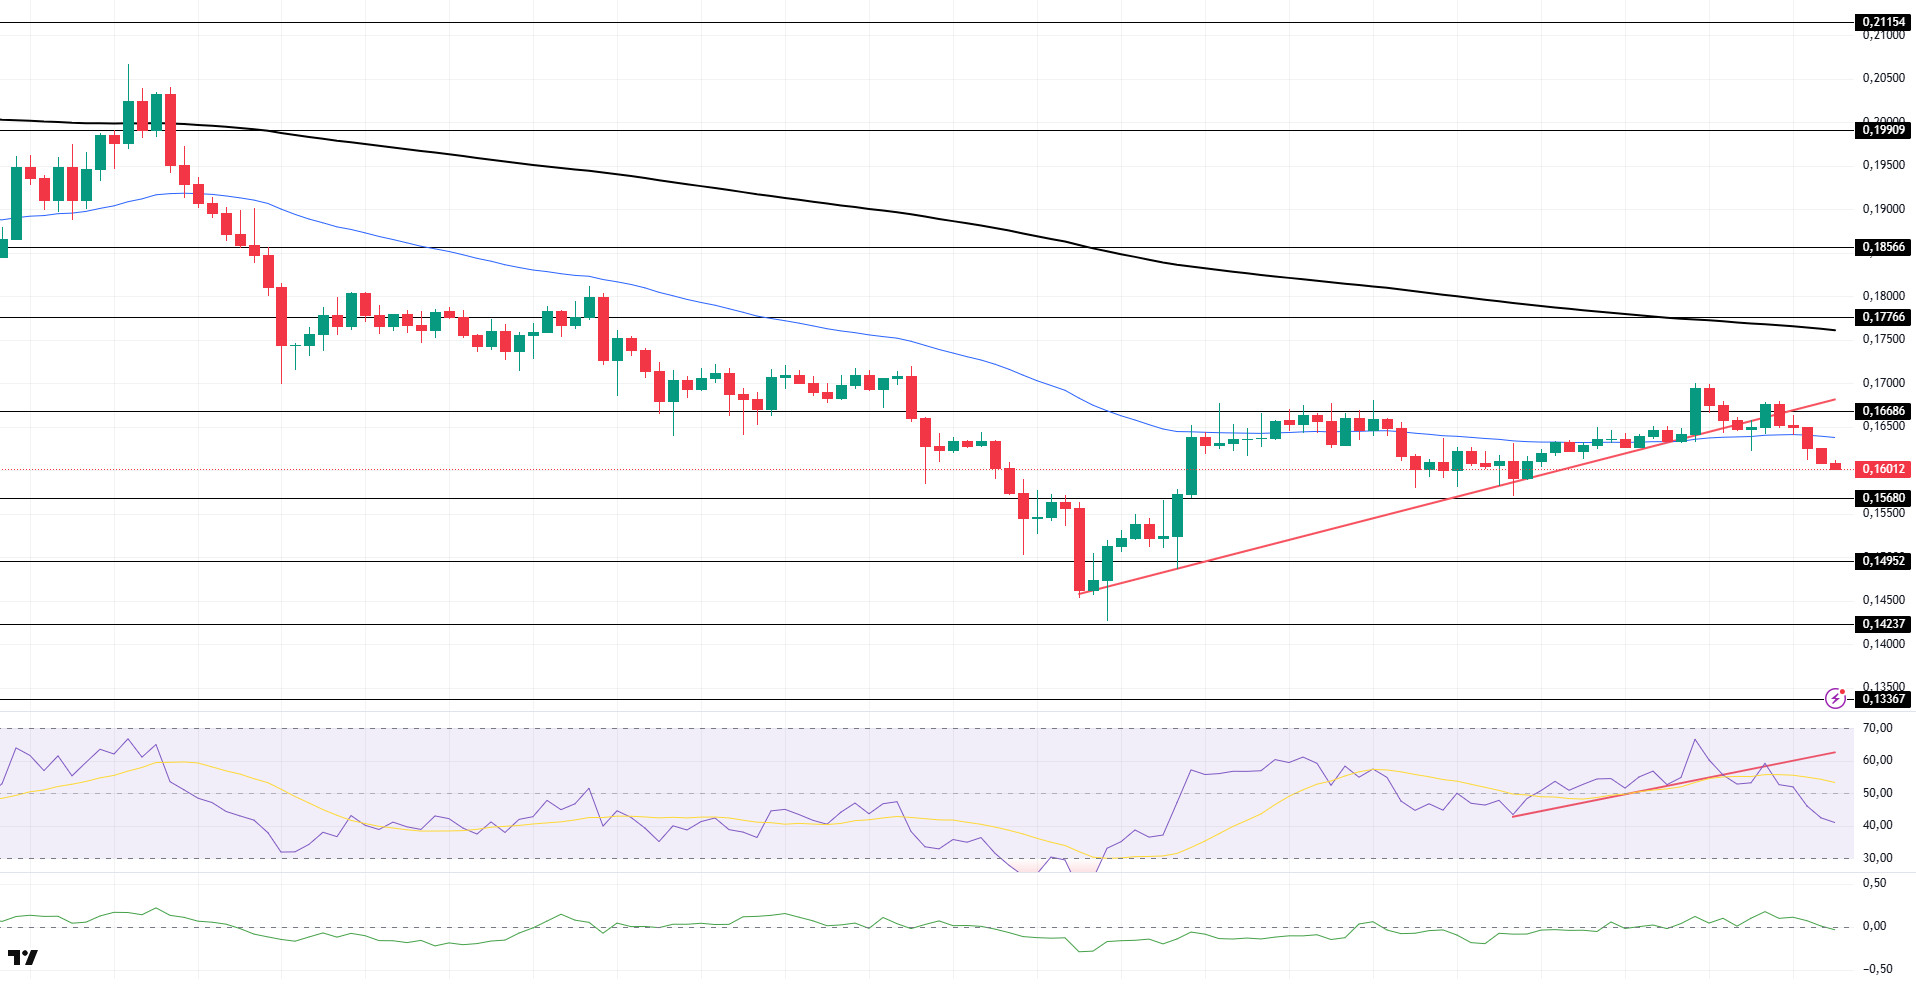
DOGE price continued its decline during the day. Supported by the uptrend that started on June 22 and the 50 EMA (Blue Line) moving average, the asset failed to hold above the uptrend and may continue its retreat and retreat to the level of $ 0.15680. If the price accelerates, it may test the 50 EMA moving average as resistance.
On the 4-hour chart, the 50 EMA (Blue Line) continues to be below the 200 EMA (Black Line). This suggests that the asset is bearish in the medium term. The fact that the price is below both moving averages suggests that the asset is bearish in the short term. Chaikin Money Flow (CMF-20) started to be at a neutral level. In addition, negative money inflows may move CMF into negative territory. Relative Strength Index (RSI-14) also moved into negative territory. However, it tested the uptrend that started on June 27 as resistance but failed to break it and the decline deepened. The $0.16686 level stands out as a strong resistance zone in case of a possible rise in line with political developments, macroeconomic data or positive news flow in the DOGE ecosystem. In the opposite case or possible negative news flow, the $0.15680 level may be triggered. In case of a decline to these levels, the momentum may increase and a new bullish wave may start.
Supports 0.15680 – 0.14952 – 0.14237
Resistances 0.16686 – 0.17766 – 0.18566
Legal Notice
The investment information, comments and recommendations contained herein do not constitute investment advice. Investment advisory services are provided individually by authorized institutions taking into account the risk and return preferences of individuals. The comments and recommendations contained herein are of a general nature. These recommendations may not be suitable for your financial situation and risk and return preferences. Therefore, making an investment decision based solely on the information contained herein may not produce results in line with your expectations.

