Crypto Exchange Charts
Cryptocurrency exchange charts are indispensable tools for traders and investors. They help market participants navigate price data by providing vital information such as price movements, trading volumes, and other key metrics that influence decision-making. Understanding how to read and analyze these charts is critical, whether you are a beginner or an experienced trader—it can truly be a make-or-break skill.
What Is a Crypto Exchange Chart?
Price Movements
Crypto charts display how the price of a cryptocurrency changes over time, allowing traders to identify trends and market direction.
Trading Volume
Trading volume shows how many tokens are traded within a specific period, helping traders gauge market interest and momentum.
Indicators and Patterns
Technical tools such as moving averages, RSI, and candlestick patterns are used to anticipate potential future trends and market behavior.
Using Darkex Charts
After logging in to your Darkex account, follow these steps:
-
Click on Futures at the top of the page.
-
Select the asset you want to trade from the list on the left.
-
The chart displayed will track real-time price movements of the selected asset.
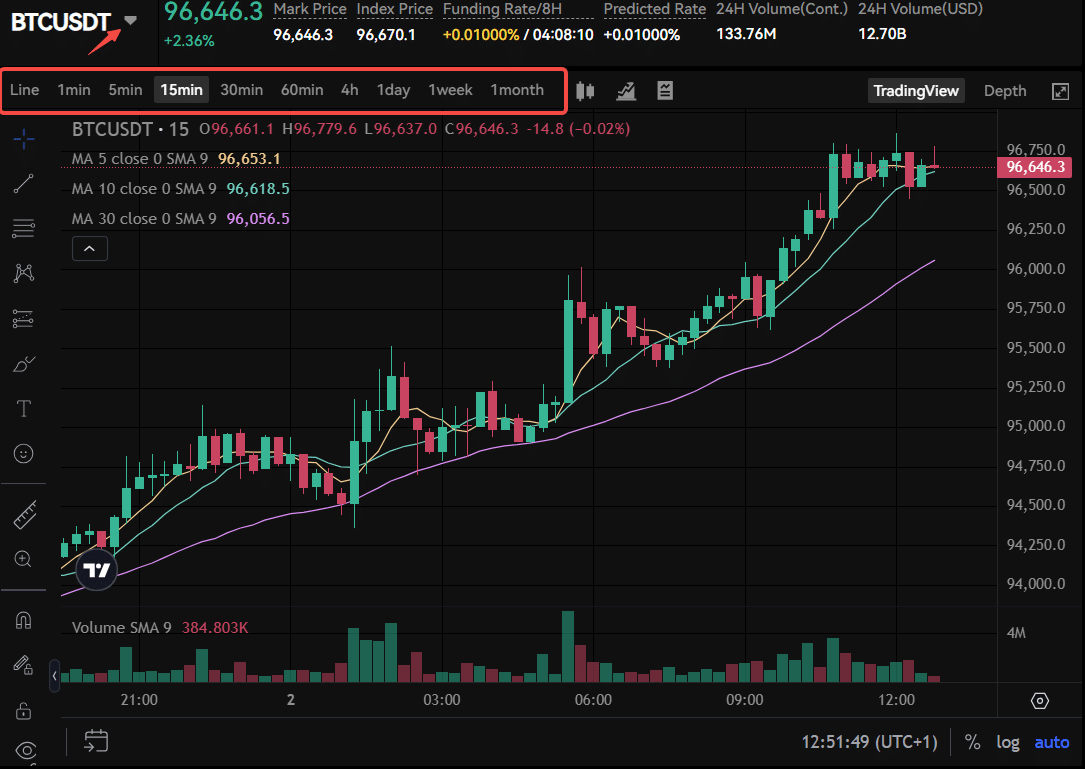
By selecting short or long time frames from the chart’s top bar, you can analyze market behavior across periods ranging from 1 minute to 1 month, helping you make more informed trading decisions.
Key elements of Crypto Exchange Chart
- Current Price
When an asset engages the market transactions sometime after the present time, the current price reflects these latest trades between buyers and sellers. It is what most attracts traders and investors because victory or ruin can be seen here at any given moment. On trading platforms, you can catch sight of this number in a special way.
You’ll see it in the upper left-hand corner of the chart.
- Moving Average (MA)
Moving averages (MAs) are technical indicators that help to smooth out the price fluctuations of an asset, and work better in identifying trends. They are composed by averaging the price of an asset over a certain number of periods:
- Short-Term Moving Average (e.g. MA 5):
This follows price changes that are quickly made and offers insight into the immediate trend.
- Medium-Term Moving Average (e.g. MA 10 or MA 20):
Typically, medium-term moving averages balance both the short-term volatility of markets as well as longer trends. They can present a better overall picture than shorter periods when there is no major upward or downward bias in direction.
- Long-Term Moving Average (e.g. MA 50 or MA 200):
This gives a steadier view of the market’s general direction, with daily noise filtered out.
Moving averages are widely used for research into trend reversals, support and resistance levels.
- The Peak Price
The peak price refers to the highest value an asset reaches within a given time period. It is commonly viewed as a resistance level, where selling pressure may increase.
For this reason, traders closely monitor peak price levels to identify potential breakouts or trend reversals. The peak price also provides insight into market momentum and overall investor sentiment.
- Volume
Volume measures the total number of trades executed within a specific time frame. It is a crucial indicator for understanding market activity and participation.
- High Volume
Indicates strong market interest and often confirms the reliability of price movements.
- Low Volume
Suggests weak interest, meaning price movements should be treated with caution as they may be less reliable.
Volume is typically displayed as bar charts, where green bars represent stronger buying pressure and red bars indicate increased selling pressure.
- Funding Rate
The funding rate is a unique mechanism used in perpetual futures markets. Its primary purpose is to keep futures contract prices aligned with the spot price of the underlying asset. It also serves as a key indicator of market sentiment.
Positive Funding Rate:
Indicates that buyers (long positions) dominate the market and are paying sellers (short positions).
Negative Funding Rate:
Shows that sellers (short positions) are in control and are paying buyers (long positions).
Funding rates are important metrics for evaluating leverage conditions and overall market positioning.
- Predicted Rate
The predicted rate is an estimate of the upcoming funding rate for the next funding interval in perpetual futures contracts.
It helps traders anticipate future funding costs, prepare for changing market conditions, and manage risk more effectively when holding leveraged positions.

Disclaimer
Cryptocurrency trading involves a high level of risk as a result of market fluctuations. This guide is for information purposes only and does not constitute financial advice. Always do thorough research or consult with professionals before trading.
You can find more detailed information about trading in Darkex in the Darkex Guide tab.