Crypto Exchange Charts
What Is a Crypto Exchange Chart?
- Price Movements
- Trading Volume
- Indicators and Patterns
Using Darkex Charts
After logging in to your Darkex account, follow these steps:
-
Click on Futures at the top of the page.
-
Select the asset you want to trade from the list on the left.
-
The chart displayed will track real-time price movements of the selected asset.
By selecting short or long-time frames from the chart’s top bar, you can analyze market behavior across periods ranging from 1 minute to 1 month, helping you make more informed trading decisions.
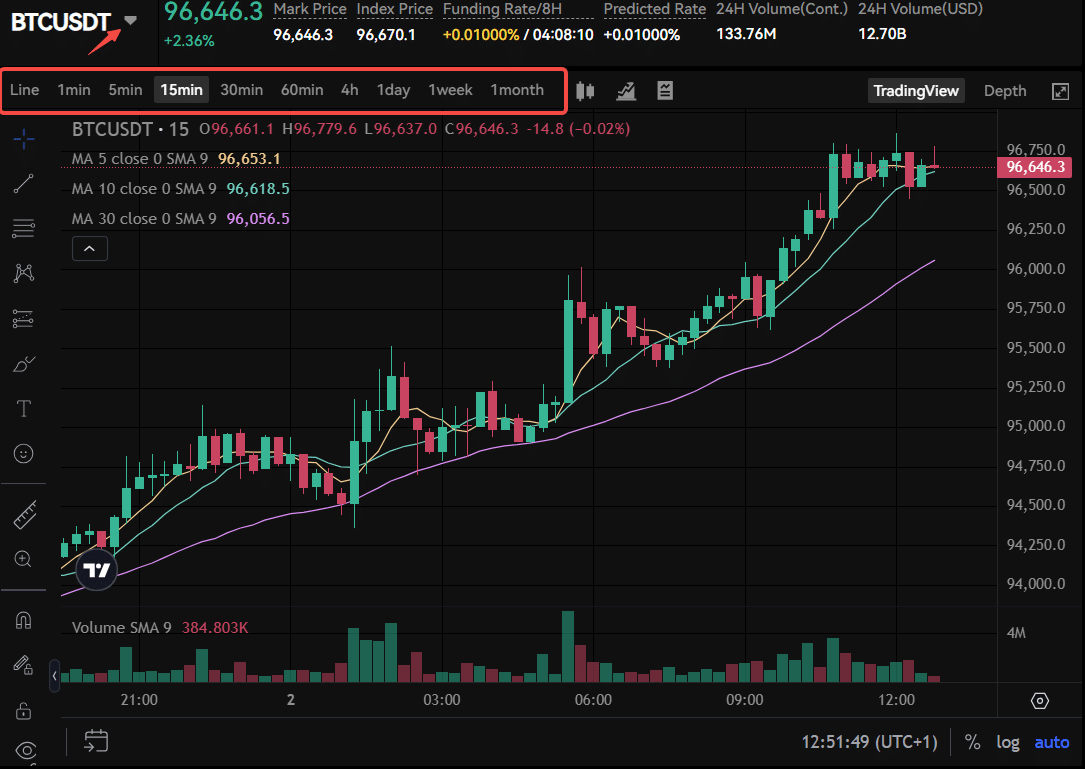
Key elements of Crypto Exchange Chart
- Current Price
- Moving Average (MA)
Moving averages (MAs) are technical indicators that help smooth out price fluctuations of an asset and provide better results in identifying trends.
They are calculated by taking the average of the asset’s price
- Short-Term Moving Average
It tracks rapid price changes and provides insight into the current trend.
- Medium-Term Moving Average
Generally, medium-term moving averages balance both the short-term volatility of markets and longer-term trends. When there is no significant upward or downward trend, they can provide a better overall picture than shorter periods.
- Long-Term Moving Average
Long-Term Moving Average
It provides a more stable view of the market’s overall direction by filtering out daily fluctuations.
- Moving averages
- Trend reversals
- Support and resistance levels
are commonly used.
- Peak Price
The peak price represents the highest value an asset has reached within a specific time frame.
It is generally seen as a resistance level where selling pressure may increase.
Potential breakouts the peak point should be considered when identifying trend reversals. The peak price also provides insight into market momentum and overall investor sentiment.
- Volume
Volume measures the total number of transactions executed within a specific time period.
- High Volume
Indicates high market interest and often tests how reliable price movements are.
- Low Volume
Indicates low interest levels; price movements should be evaluated seriously.
Volume is typically displayed using bar charts; green bars indicate stronger buying pressure, while red bars indicate increasing selling pressure.
- Funding Rate
The funding rate is a unique mechanism used in perpetual futures markets.
Its primary purpose is to keep the futures contract price aligned with the spot price of the underlying asset. It also serves as an important indicator of market sentiment.
Positive Funding Rate:
Indicates that buyers (long positions) dominate the market and pay sellers (short positions).
Indicates that sellers (short positions) have taken control and pay buyers (long positions).
Funding rates are important ratios for assessing leverage conditions and the overall market position.
- Expected Rate
The expected rate is the forecast of the funding rate for the next funding period in perpetual futures contracts.
It enables investors to anticipate future financing costs, prepare for changing market conditions, and manage risks in leveraged positions more effectively.

Disclaimer
The information contained herein is for educational and informational purposes only and does not constitute investment advice. Cryptocurrency markets may be highly volatile, and prices may change significantly within a short period of time. The explanations, chart interpretations, and technical indicators provided herein are not sufficient on their own for investment decisions.
Investment decisions should be evaluated within the scope of investment advisory services provided by authorised institutions on an individual basis, taking into account individuals’ risk and return preferences. Darkex cannot be held liable for any losses arising from transactions made based on the information contained herein.
Leveraged and futures trading may involve high risk. Therefore, it is recommended that you carefully research the market and make your own assessments before investing.
You can find more detailed information about trading in Darkex in the Darkex Guide tab.