
Weekly Ethereum Onchain Report
Active Addresses
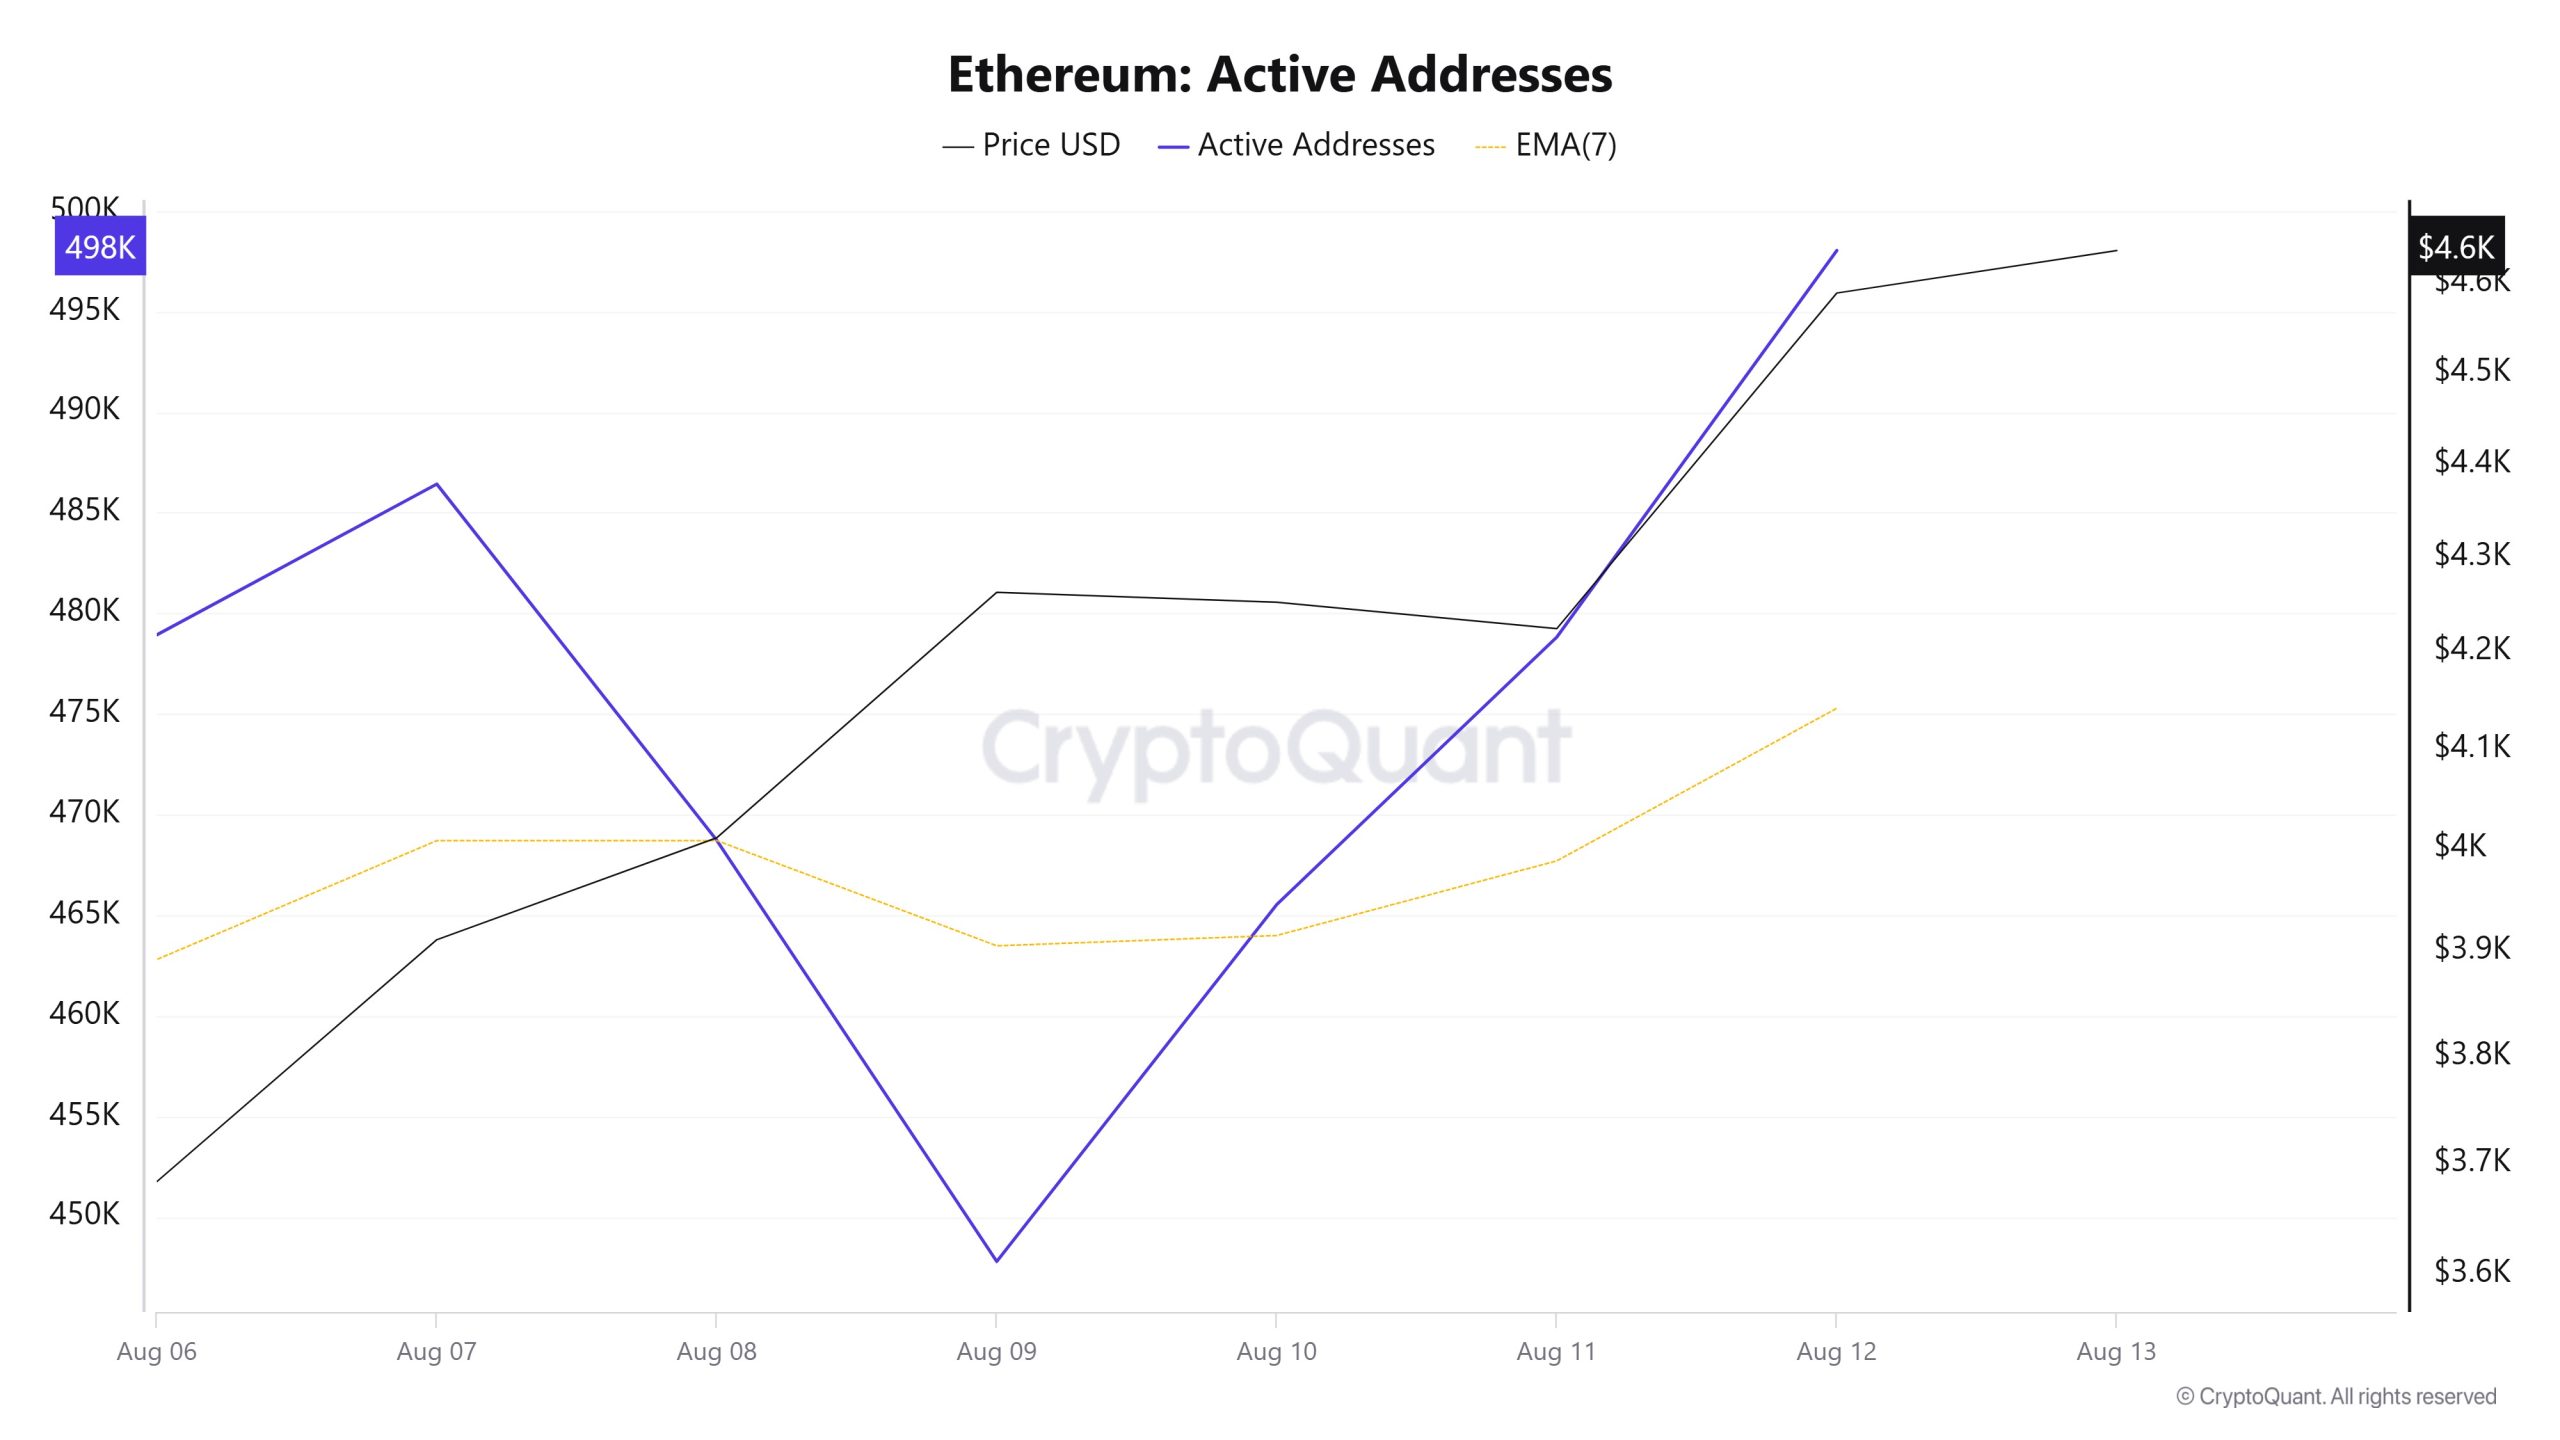
Between August 6 and August 13, a total of 498,034 active addresses were recorded on the Ethereum network. During this period, the Ethereum price rose from $3,683 to $4,638. Notably, on August 8, at the point where the price and the number of active addresses intersected, while the price continued to rise, there was a significant decline in the number of active addresses. This suggests that, despite the subsequent price increase, short-term participation decreased and transactions among existing investors likely gained prominence. When examining the 7-day simple moving average (SMA), a general upward trend in the Ethereum price is observed.
Active Sending Addresses
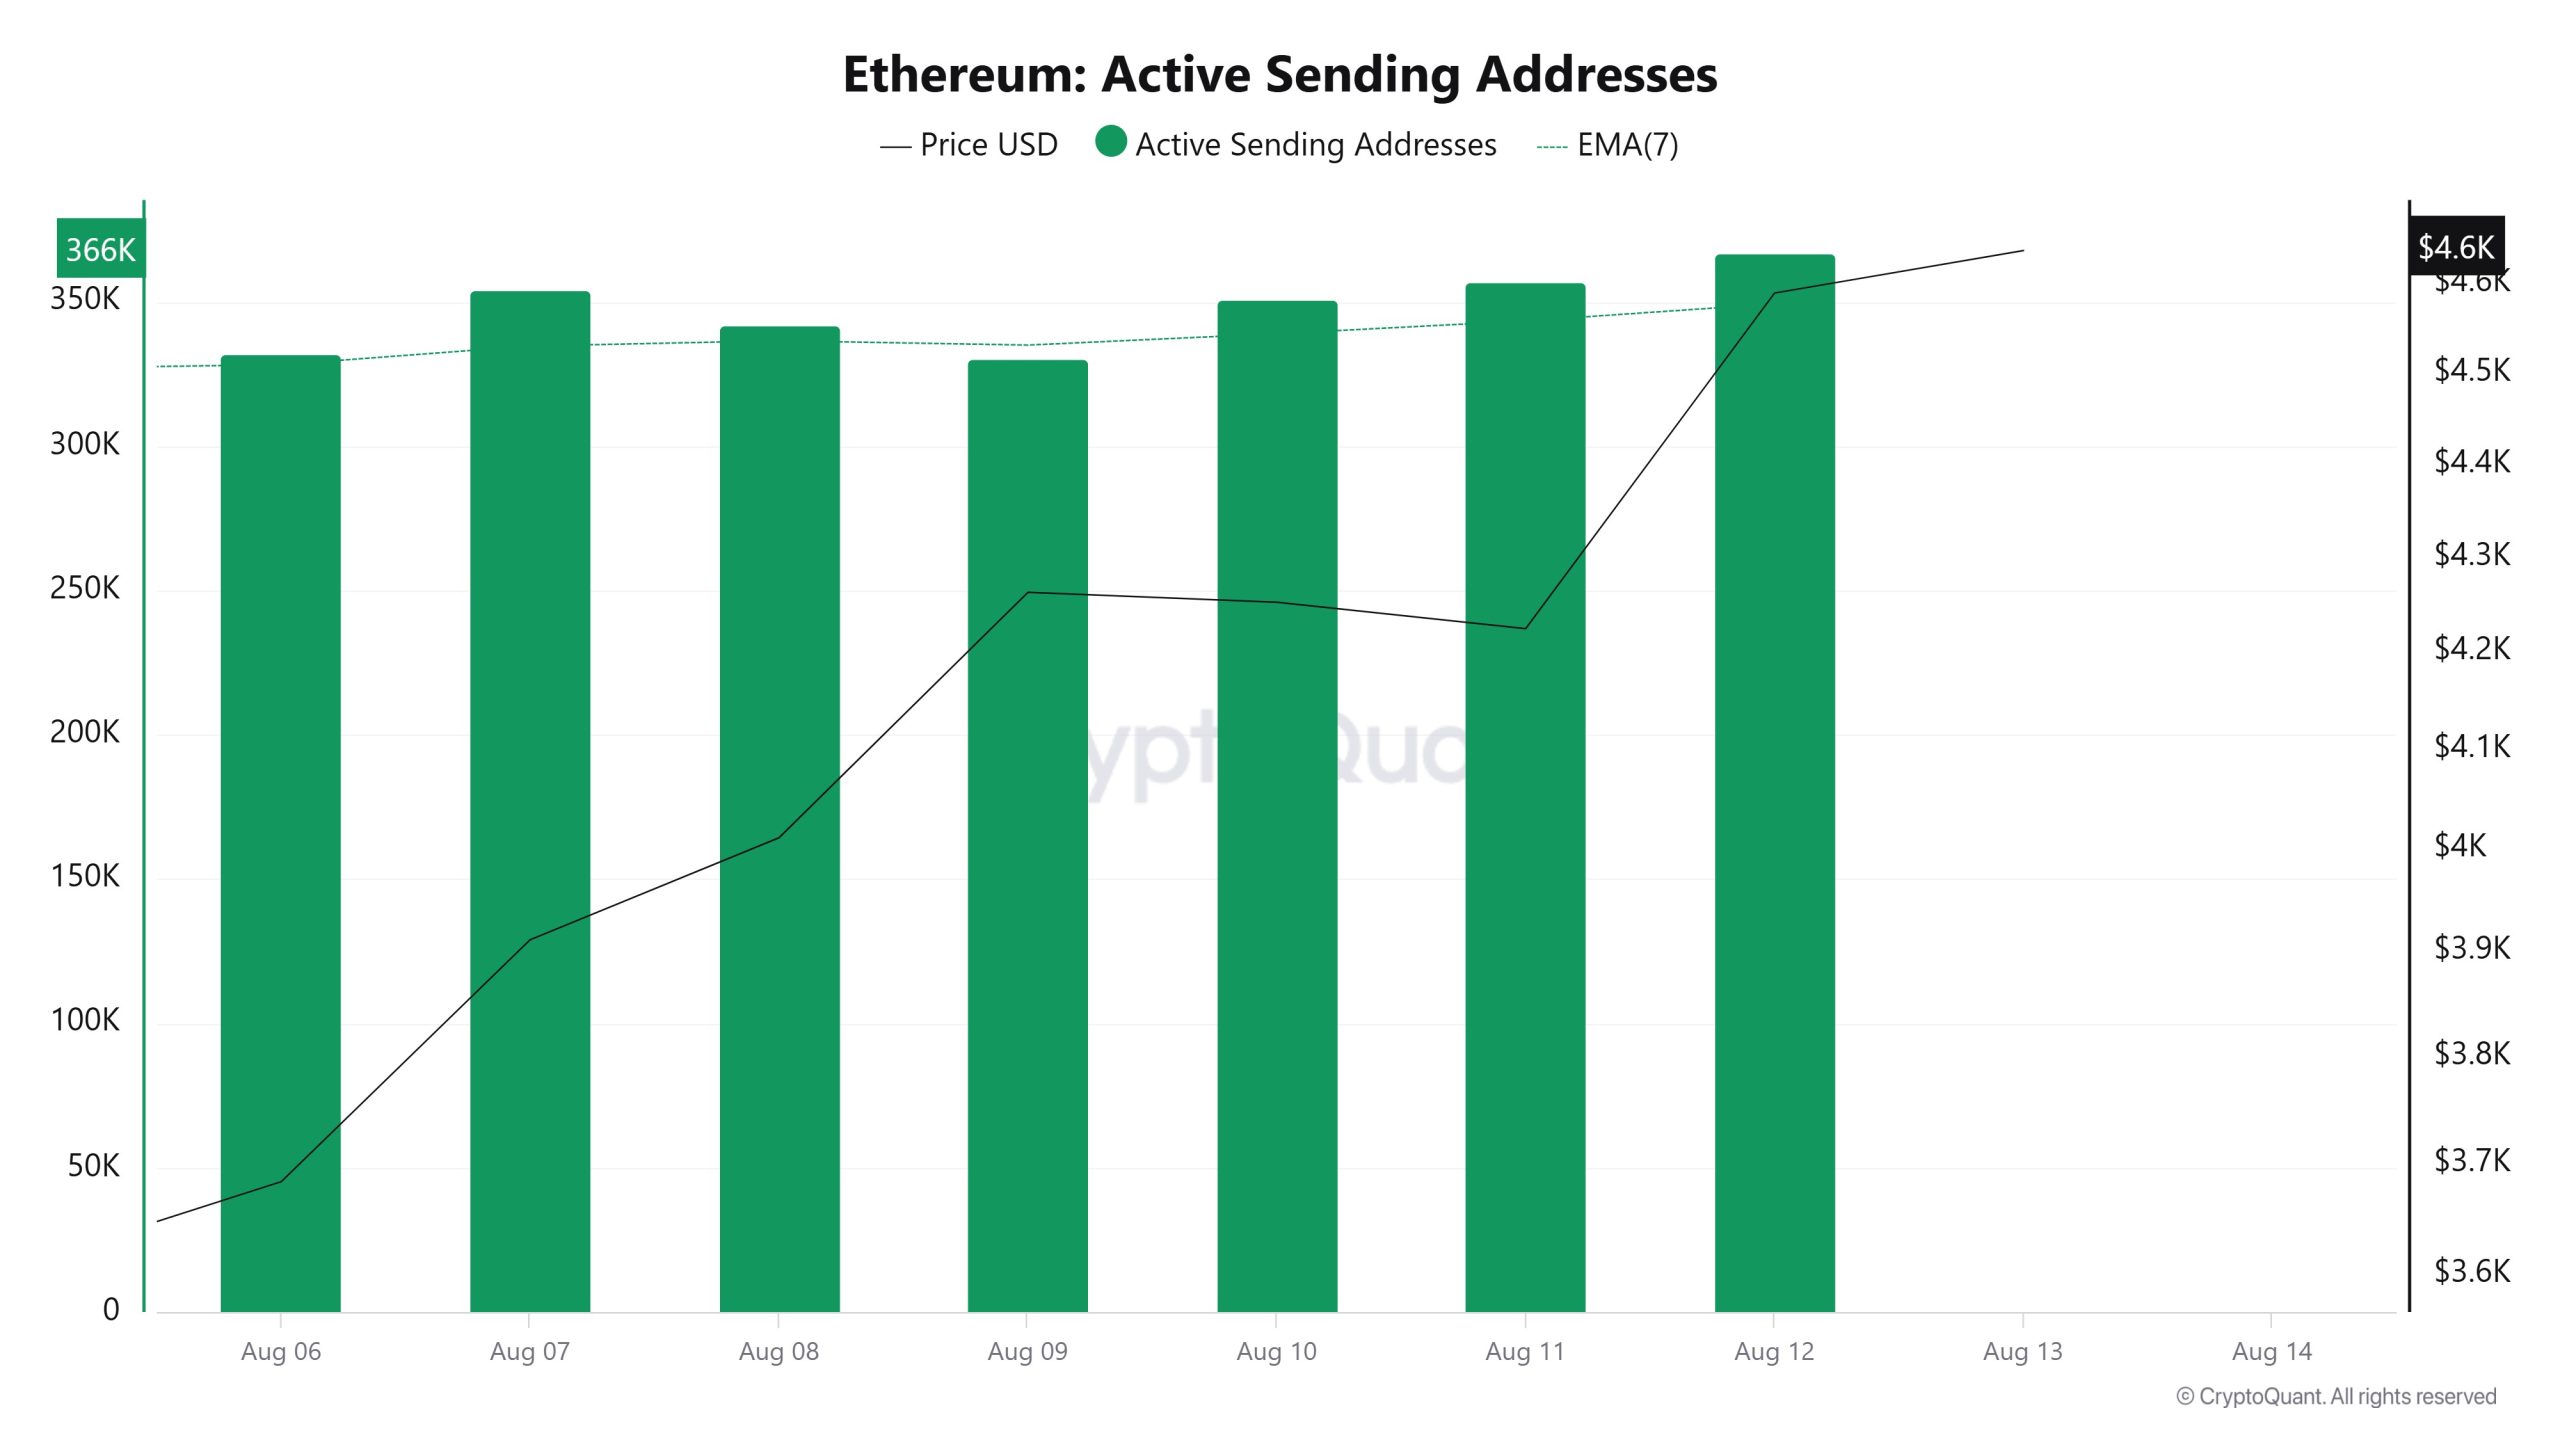
Between August 6 and August 13, an upward movement was observed in active sending addresses alongside the Black Line (price line). On the day the price reached its highest level on a weekly basis, active sending addresses rose to 366,916.
Active Receiving Addresses
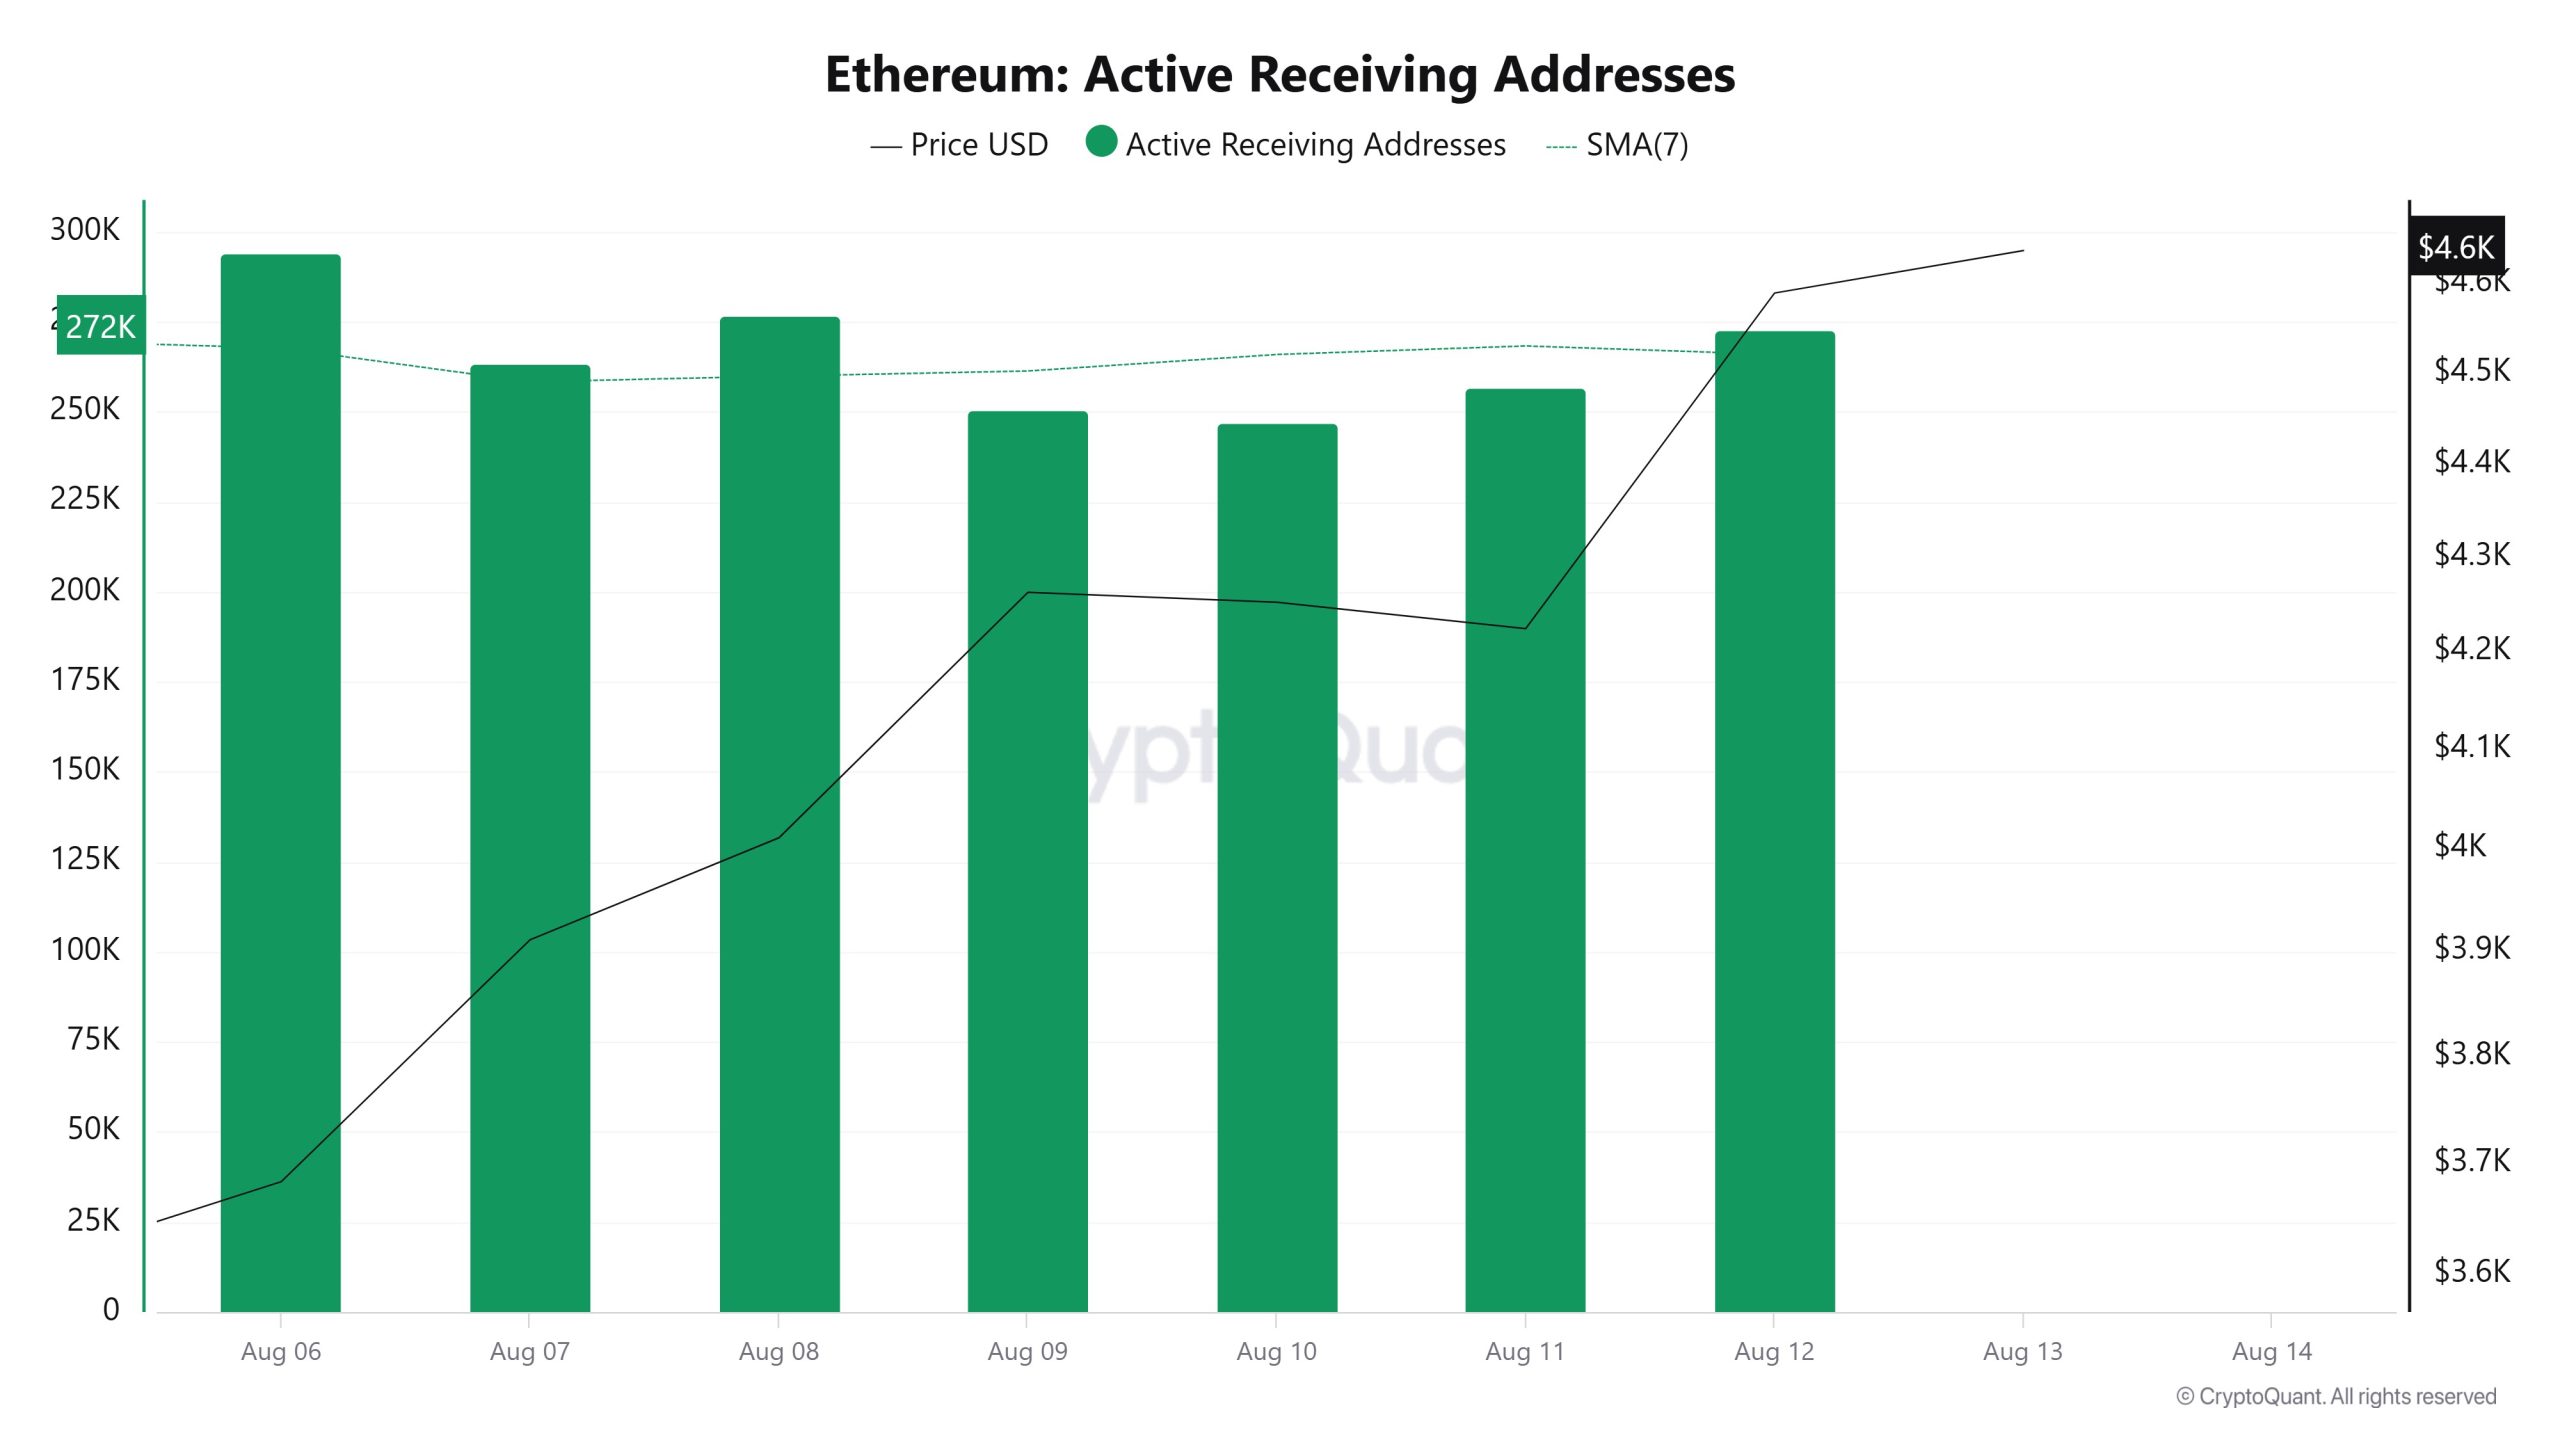
Between August 6 and August 13, an increase was observed in active receiving addresses, while the price also consolidated upward in parallel. On the day the price reached its highest level, active receiving addresses rose to 272,701, indicating that purchases continued.
Total Value Staked
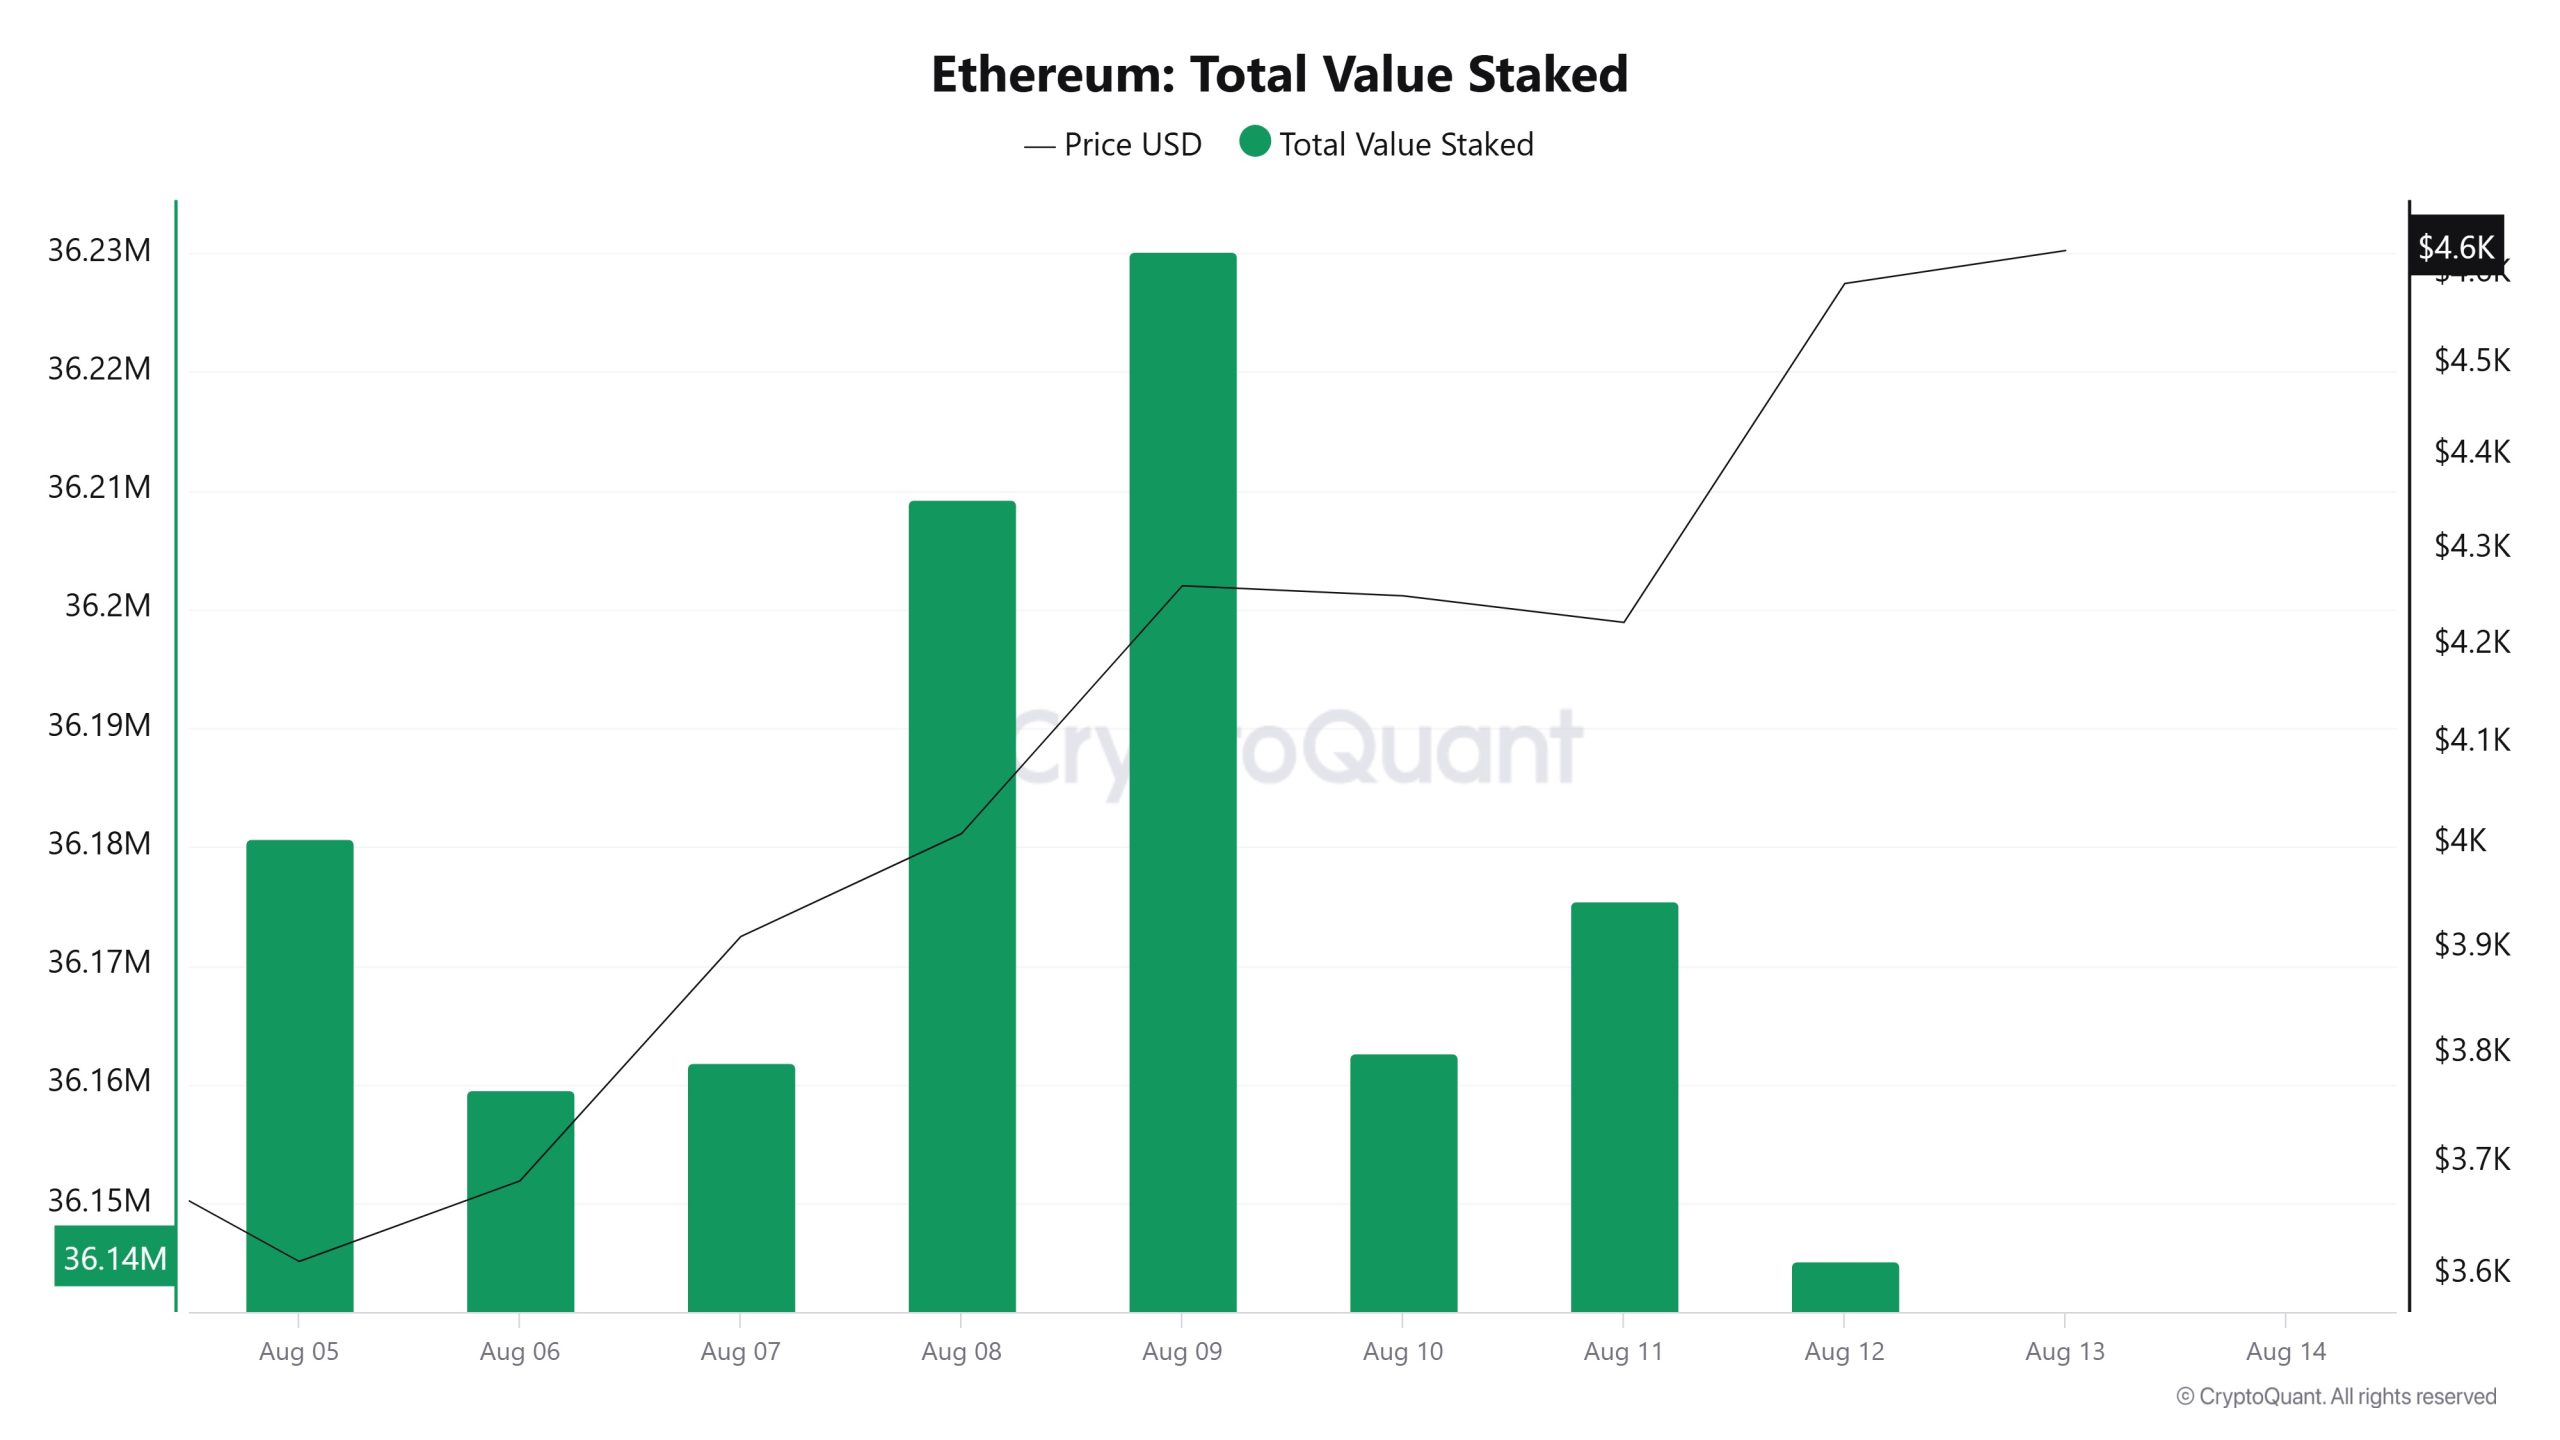
On August 6, when the ETH price was at 3,683, the Total Value Staked was at 36,159,619. As of August 12, the ETH price rose to 4,589, marking a 24.59% increase, while the Total Value Staked decreased to 36,145,111, recording a 0.04% decline.
Staking Inflows
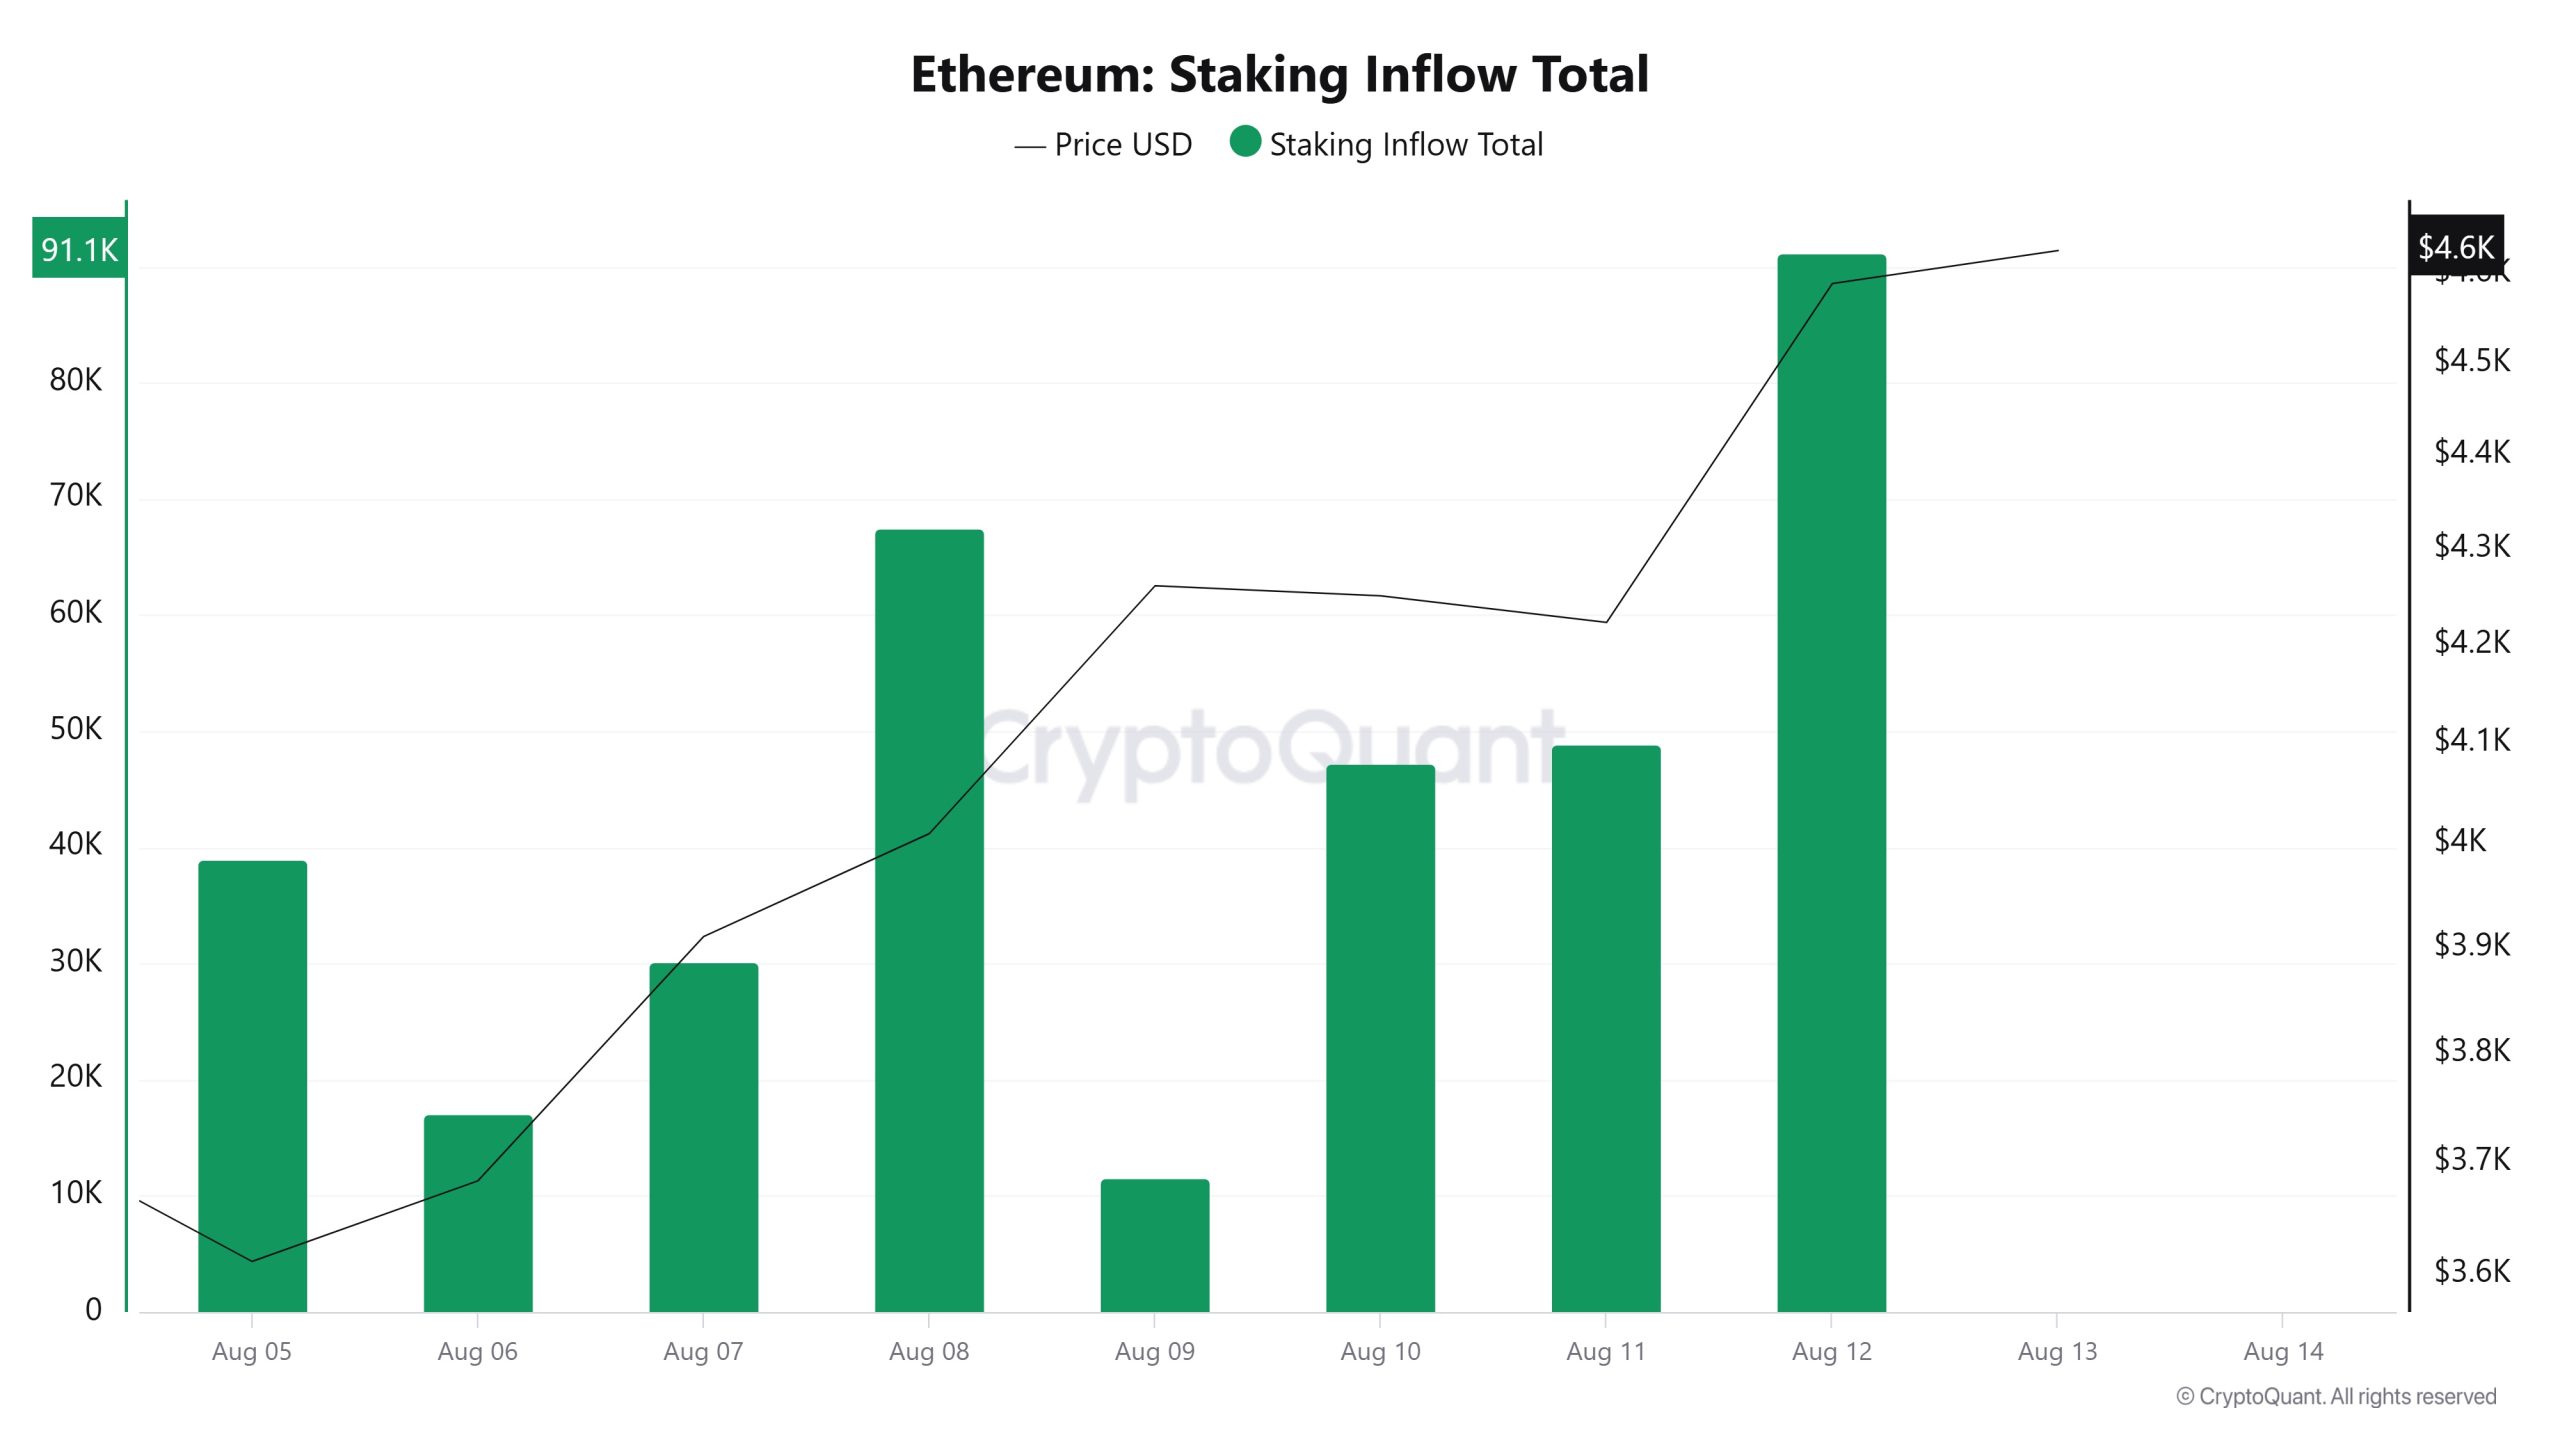
On August 6, when the ETH price was at 3,683, the Staking Inflow was at 17,108. As of August 12, the ETH price rose to 4,589, showing a 24.59% increase, while the Staking Inflow rose to 91,174, recording a 433.01% increase.
Derivatives
Open Interest
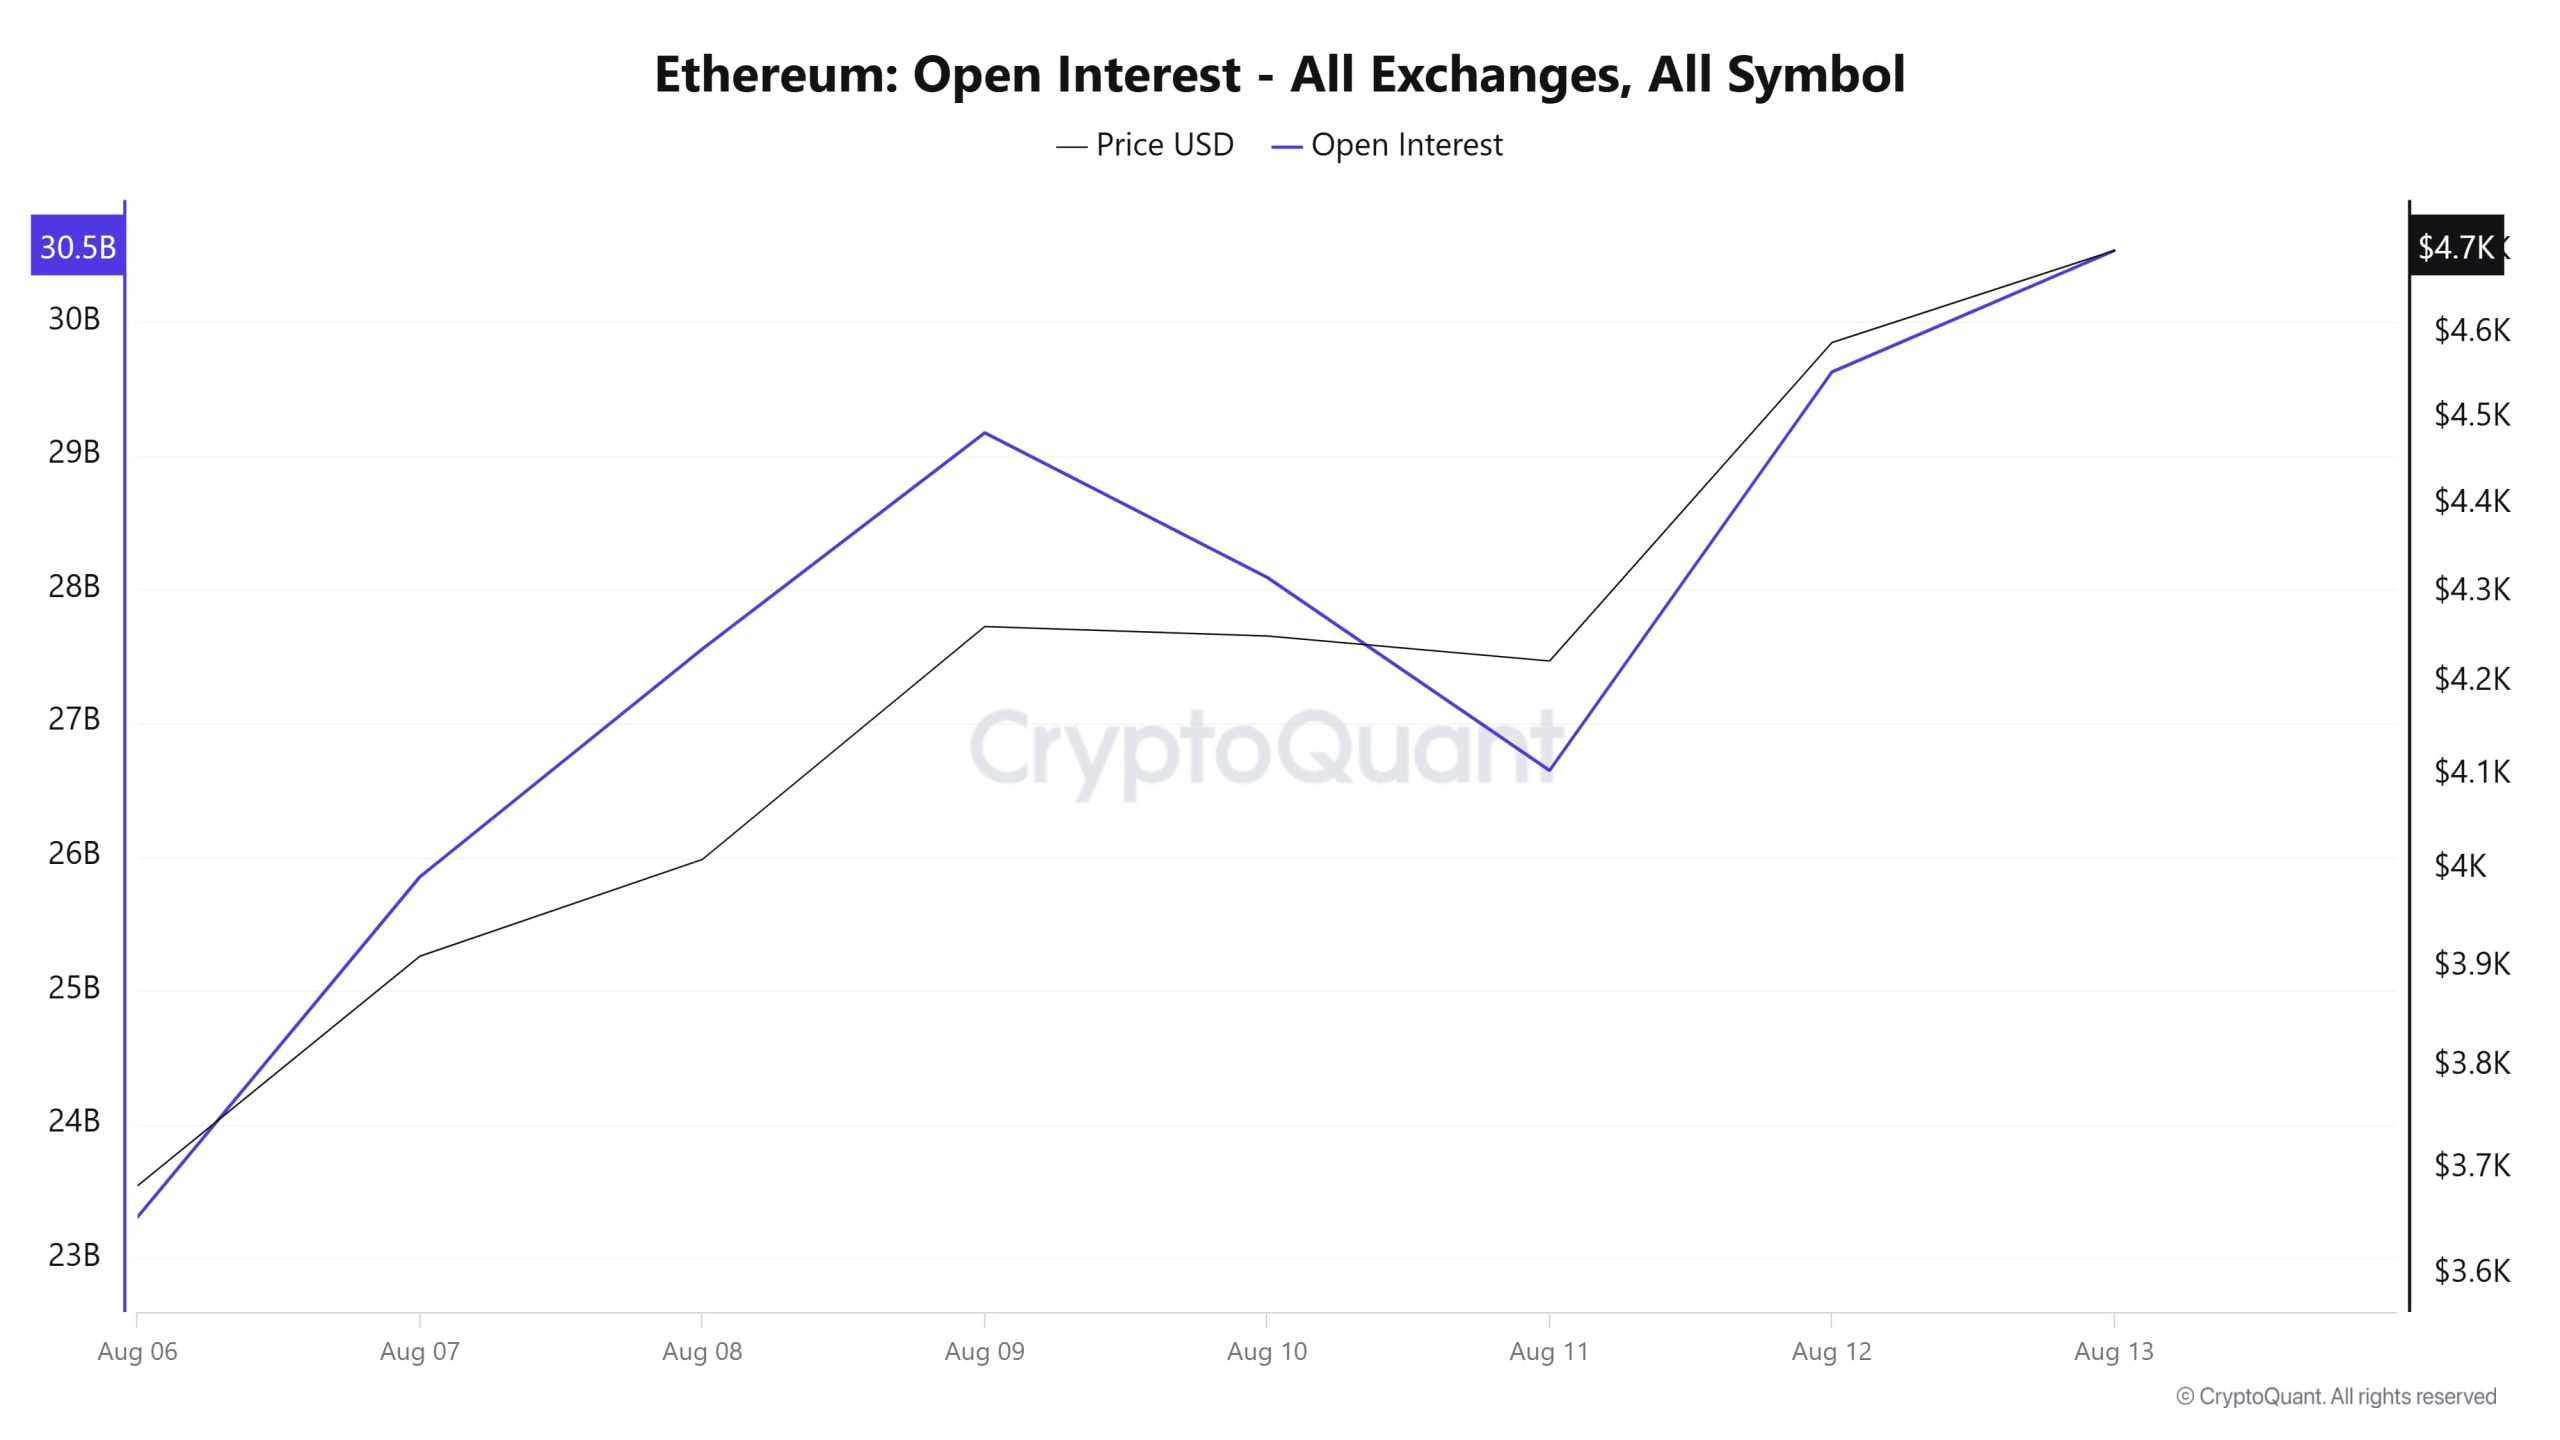
On August 6, open interest was around $23.3 billion, rising steadily in the following days to exceed $29 billion on August 9. However, it lost momentum from this point, falling to around $27 billion on August 11. A strong recovery process then begins, reaching a weekly high of 30.5 billion dollars on August 13. A similar story unfolded on the price front. The upward trend, which began at around $3,600, continued unabated despite minor pullbacks and reached $4,700 as of today. The simultaneous rise in both price and open- -interest indicates that buy-side expectations are strengthening in the market and that investors’ appetite for opening new positions is quite high.
Funding Rate
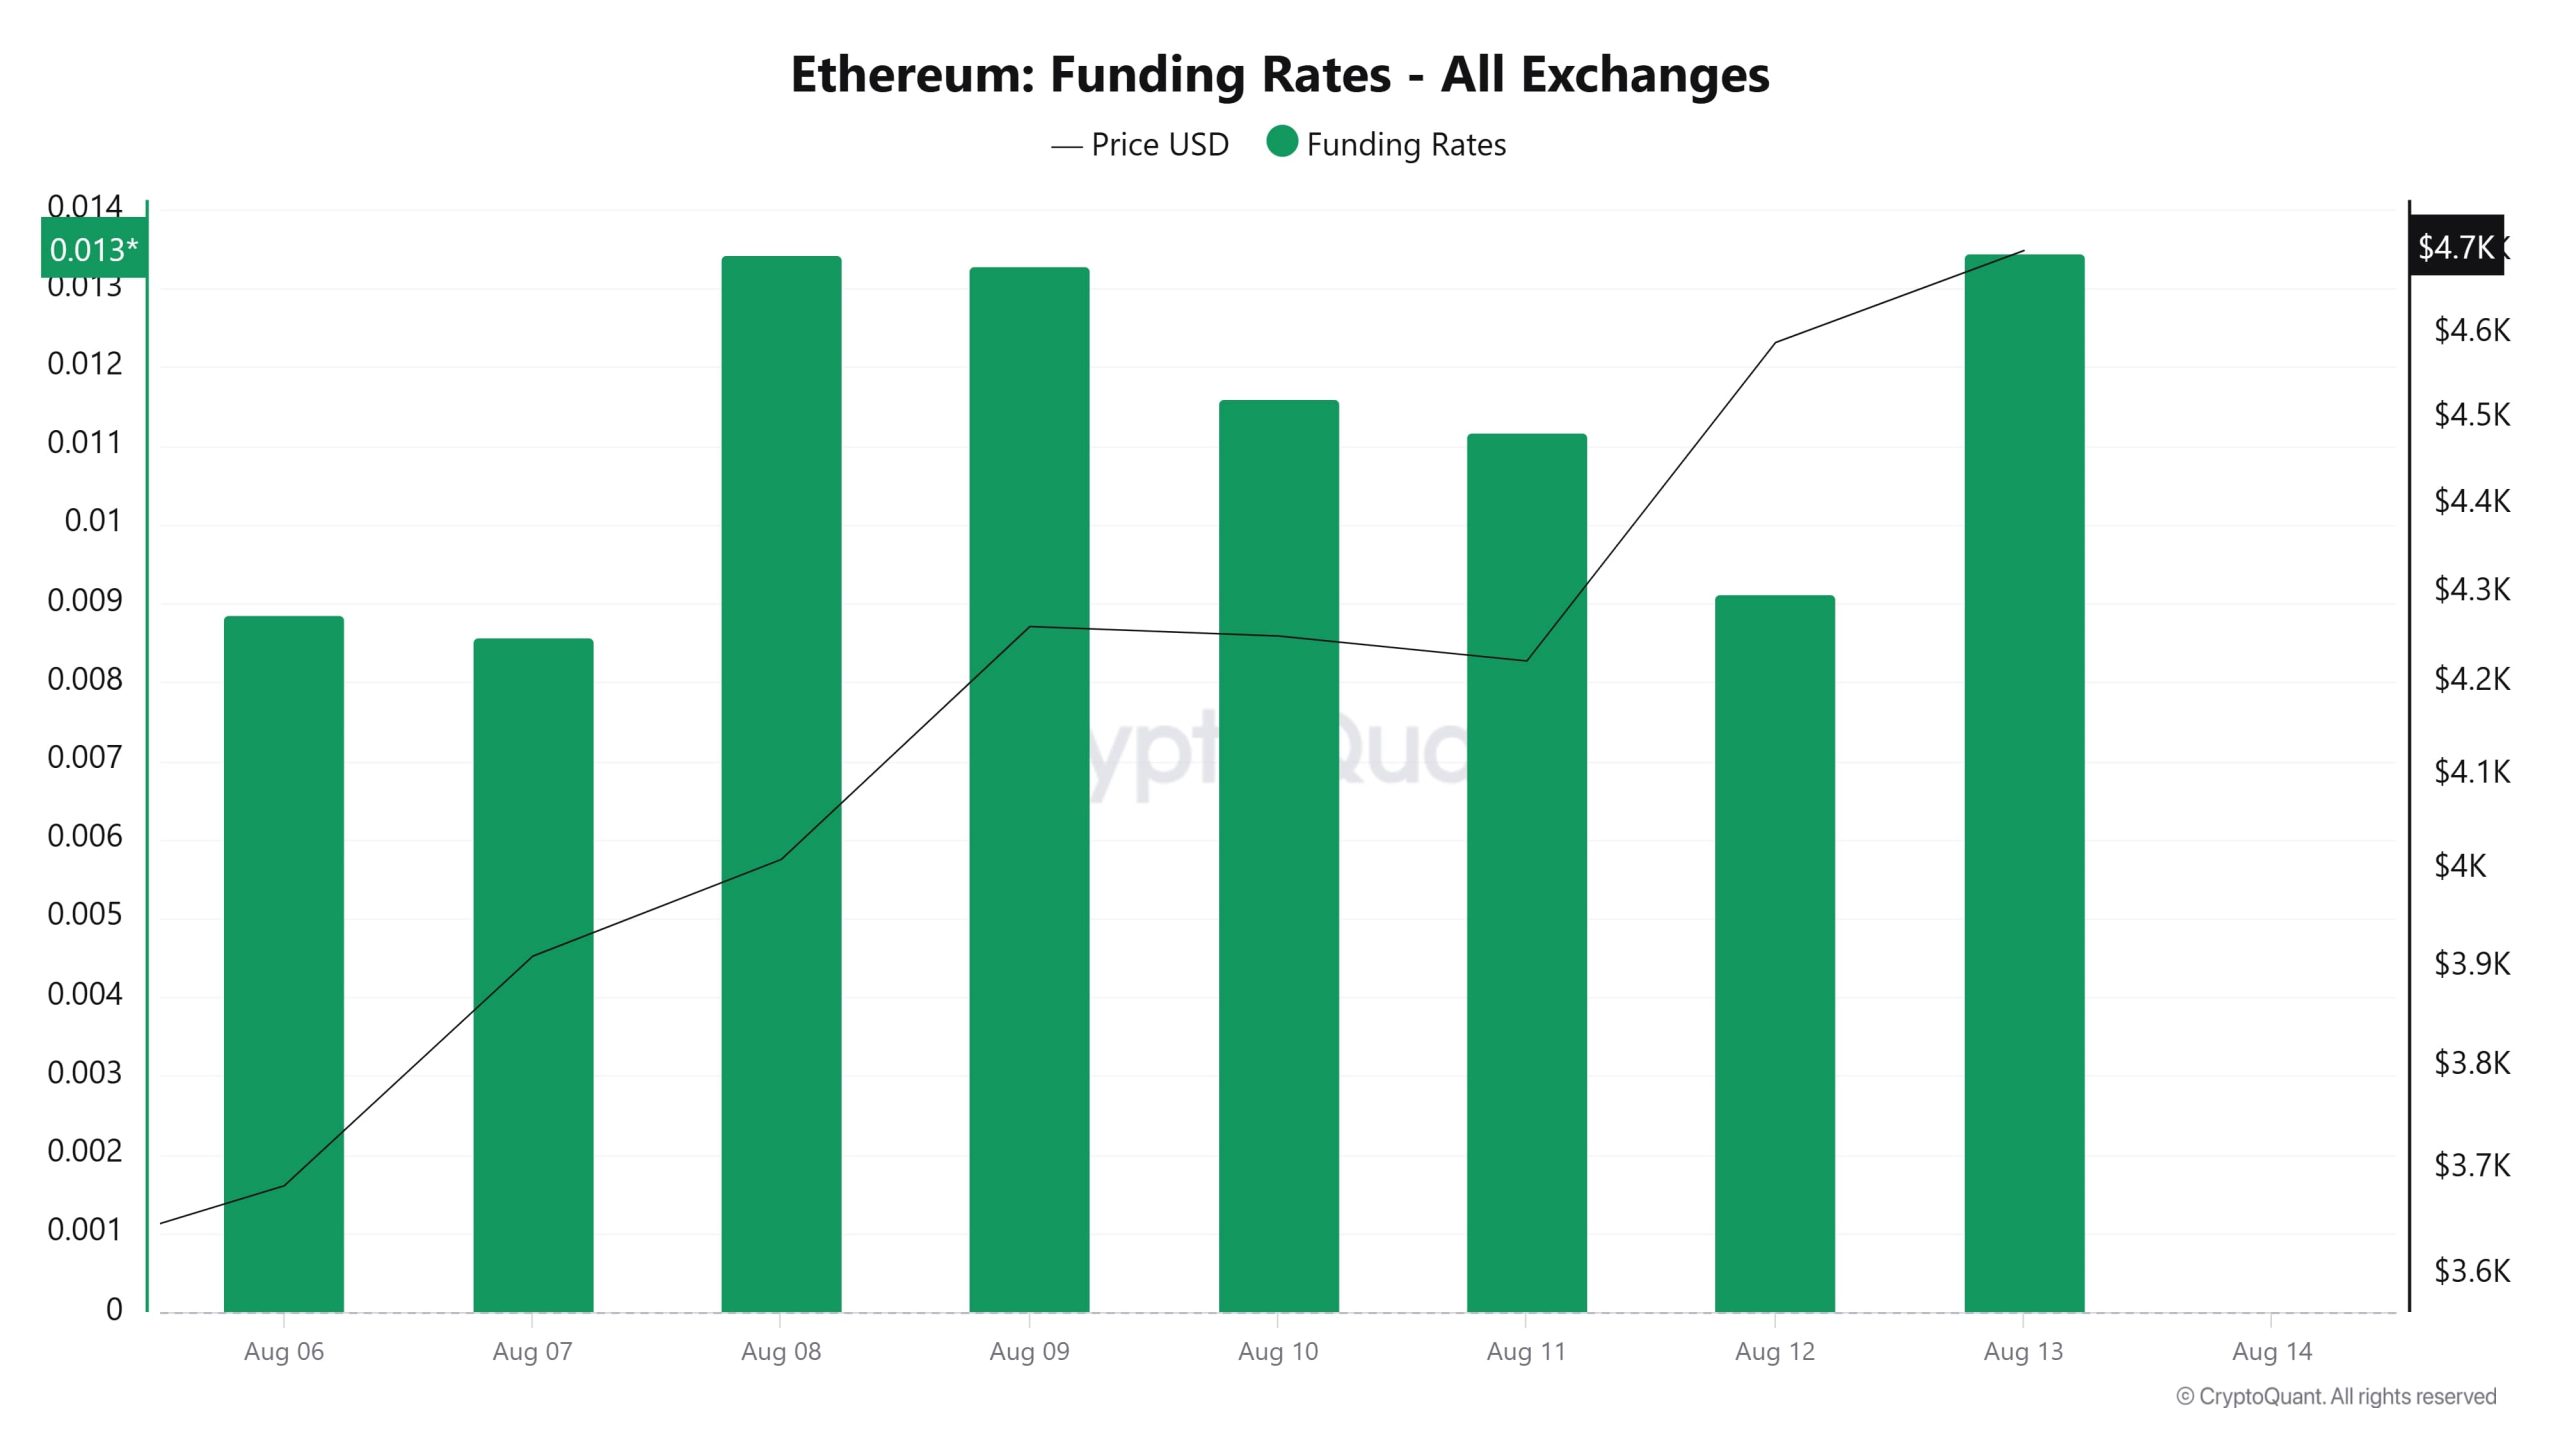
When examining Ethereum’s funding rate data across all exchanges, it can be seen that the rates, which have been in positive territory since August 6, have risen in a volatile manner. On August 8 and 9, the funding rate reached approximately 0.013 levels, indicating an increase in short-term demand for long positions. Although there was a slight pullback on August 10 and 11, there was no significant decline in price during this period; instead, the price remained flat. On August 12, the funding rate dropped significantly, but on August 13, it showed a strong increase again, approaching the same levels, while the Ethereum price rose to around $4,700. The overall picture indicates that the positive funding rate is continuing and the market is predominantly positioned in the long direction, while the price has maintained its upward momentum during this period.
Long & Short Liquidations
With the ETH price rising to around $4,700, approximately $370 million worth of long positions were liquidated. During the same timeframe, $743 million worth of short positions were also liquidated.
Date Long Amount (Million $) Short Amount (Million $)
| Date | Long Amount (Million $) | Short Amount (Million $) |
|---|---|---|
| August 6 | 33.39 | 47.30 |
| August 7 | 32.82 | 122.19 |
| August 8 | 33.12 | 132.47 |
| August 9 | 36.47 | 136.36 |
| August 10 | 71.32 | 39.97 |
| August 11 | 121.81 | 81.68 |
| August 12 | 42.06 | 183.53 |
| Total | 370.99 | 743.50 |
Supply Distribution
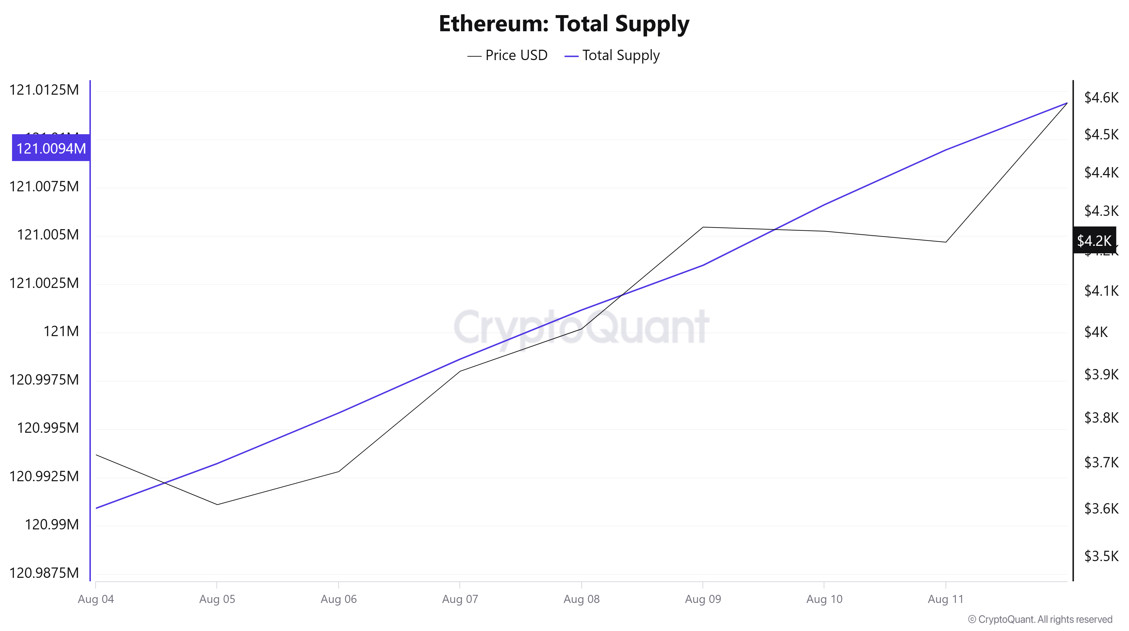
Total Supply: Increased by approximately 0.0134% compared to last week, reaching 121,009,461 units.
New Supply: The amount of ETH produced this week was 16,238.
Velocity: The velocity, which was 8.91 last week, reached 8.94 as of August 11.
| Wallet Category | 04.08.2025 | 11.08.2025 | Change (%) |
|---|---|---|---|
| 100 – 1k ETH | 8.7981M | 8.7204M | -0.883 |
| 1k – 10k ETH | 12.7372M | 12.6318M | -0.827 |
| 10k – 100k ETH | 18.4725M | 19.1864M | 3.865 |
| 100k+ ETH | 4.2244M | 4,264,900 | 0.958 |
According to the latest weekly data, the Ethereum wallet distribution shows a mixed picture. While there was a slight decrease of 0.883% in wallet balances in the 100–1k ETH range, a similar decline of 0.827% was observed in the 1k–10k ETH segment. In contrast, a notable increase of 3.865% was recorded in the 10k–100k ETH range, while the 100k+ ETH category saw a significant rise of 0.958%.
Exchange Supply Ratio
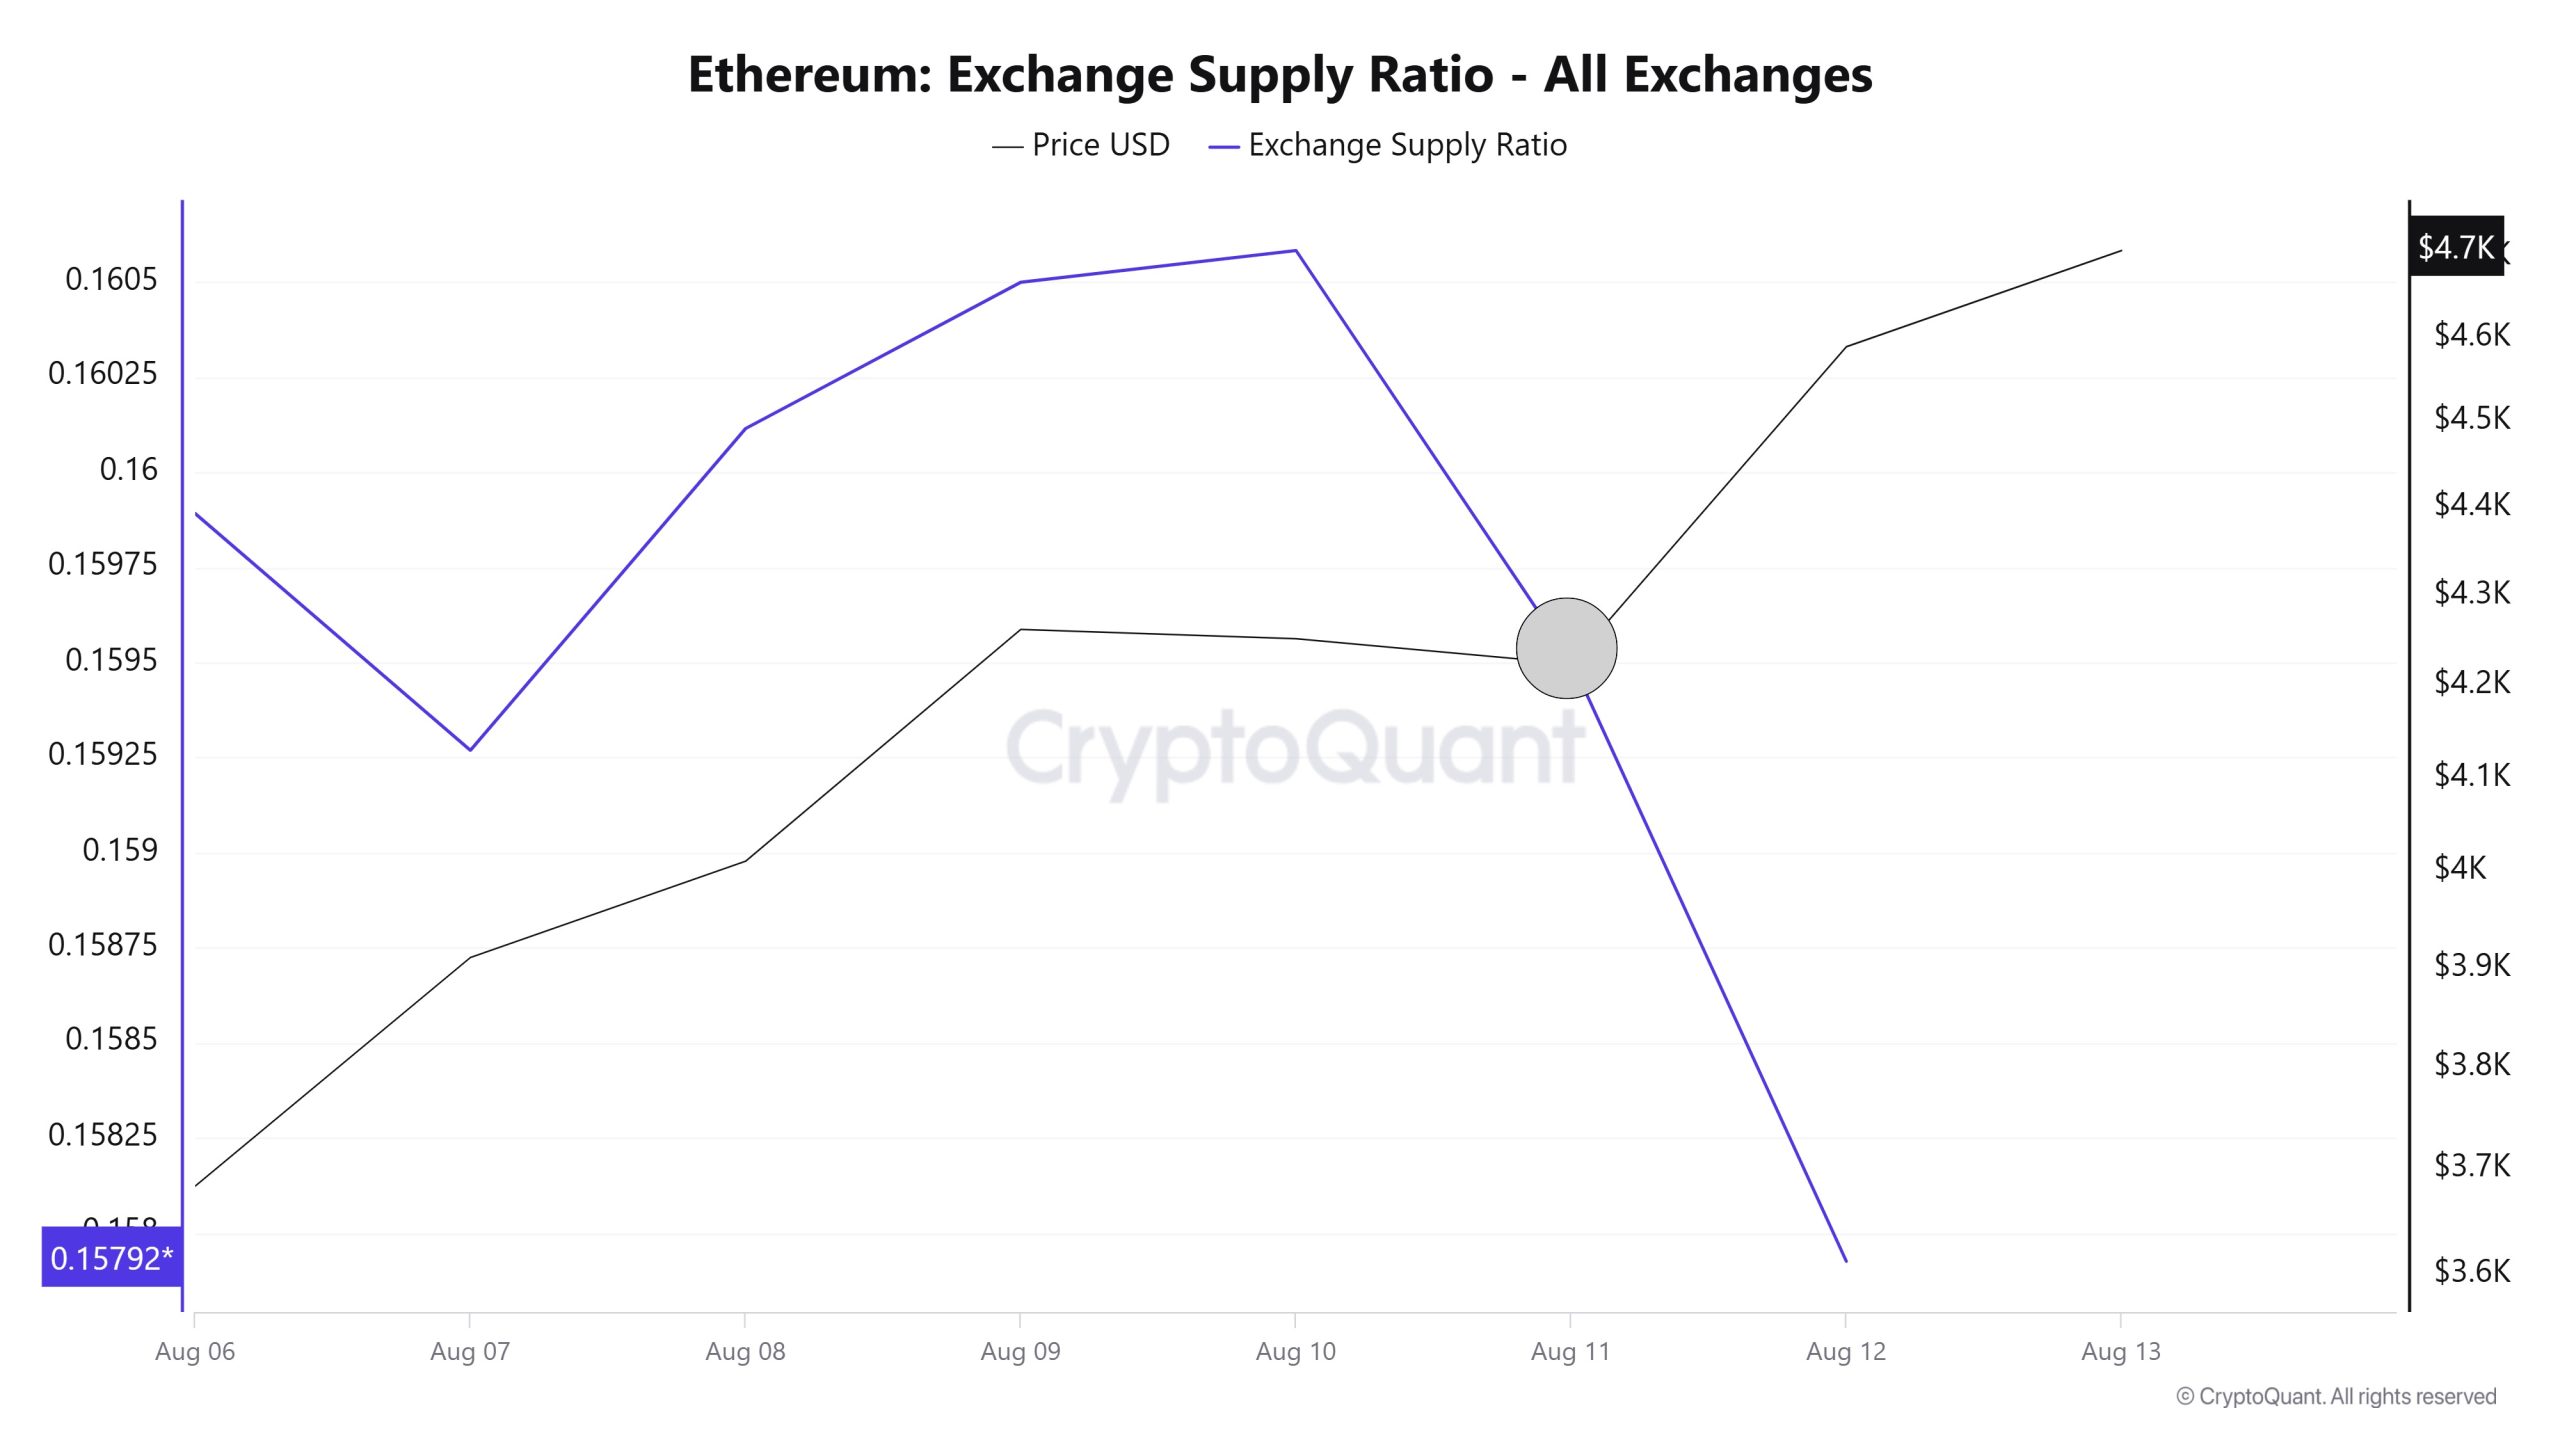
Between August 6 and 13, the Ethereum Exchange Supply Ratio increased from 0.15926902 to 0.15950508. During this period, the Ethereum price rose from $3,580 to $4,704. Particularly between August 11 and 12, at the point where the price and the Exchange Supply Ratio intersected, while the price continued to rise, there was a significant decline in the Exchange Supply Ratio. This indicates that, despite the price increase, the amount of Ethereum being supplied to exchanges decreased, suggesting that long-term investors are likely continuing to hold onto their assets. A general upward trend is observed in the Ethereum price.
Fees and Revenues
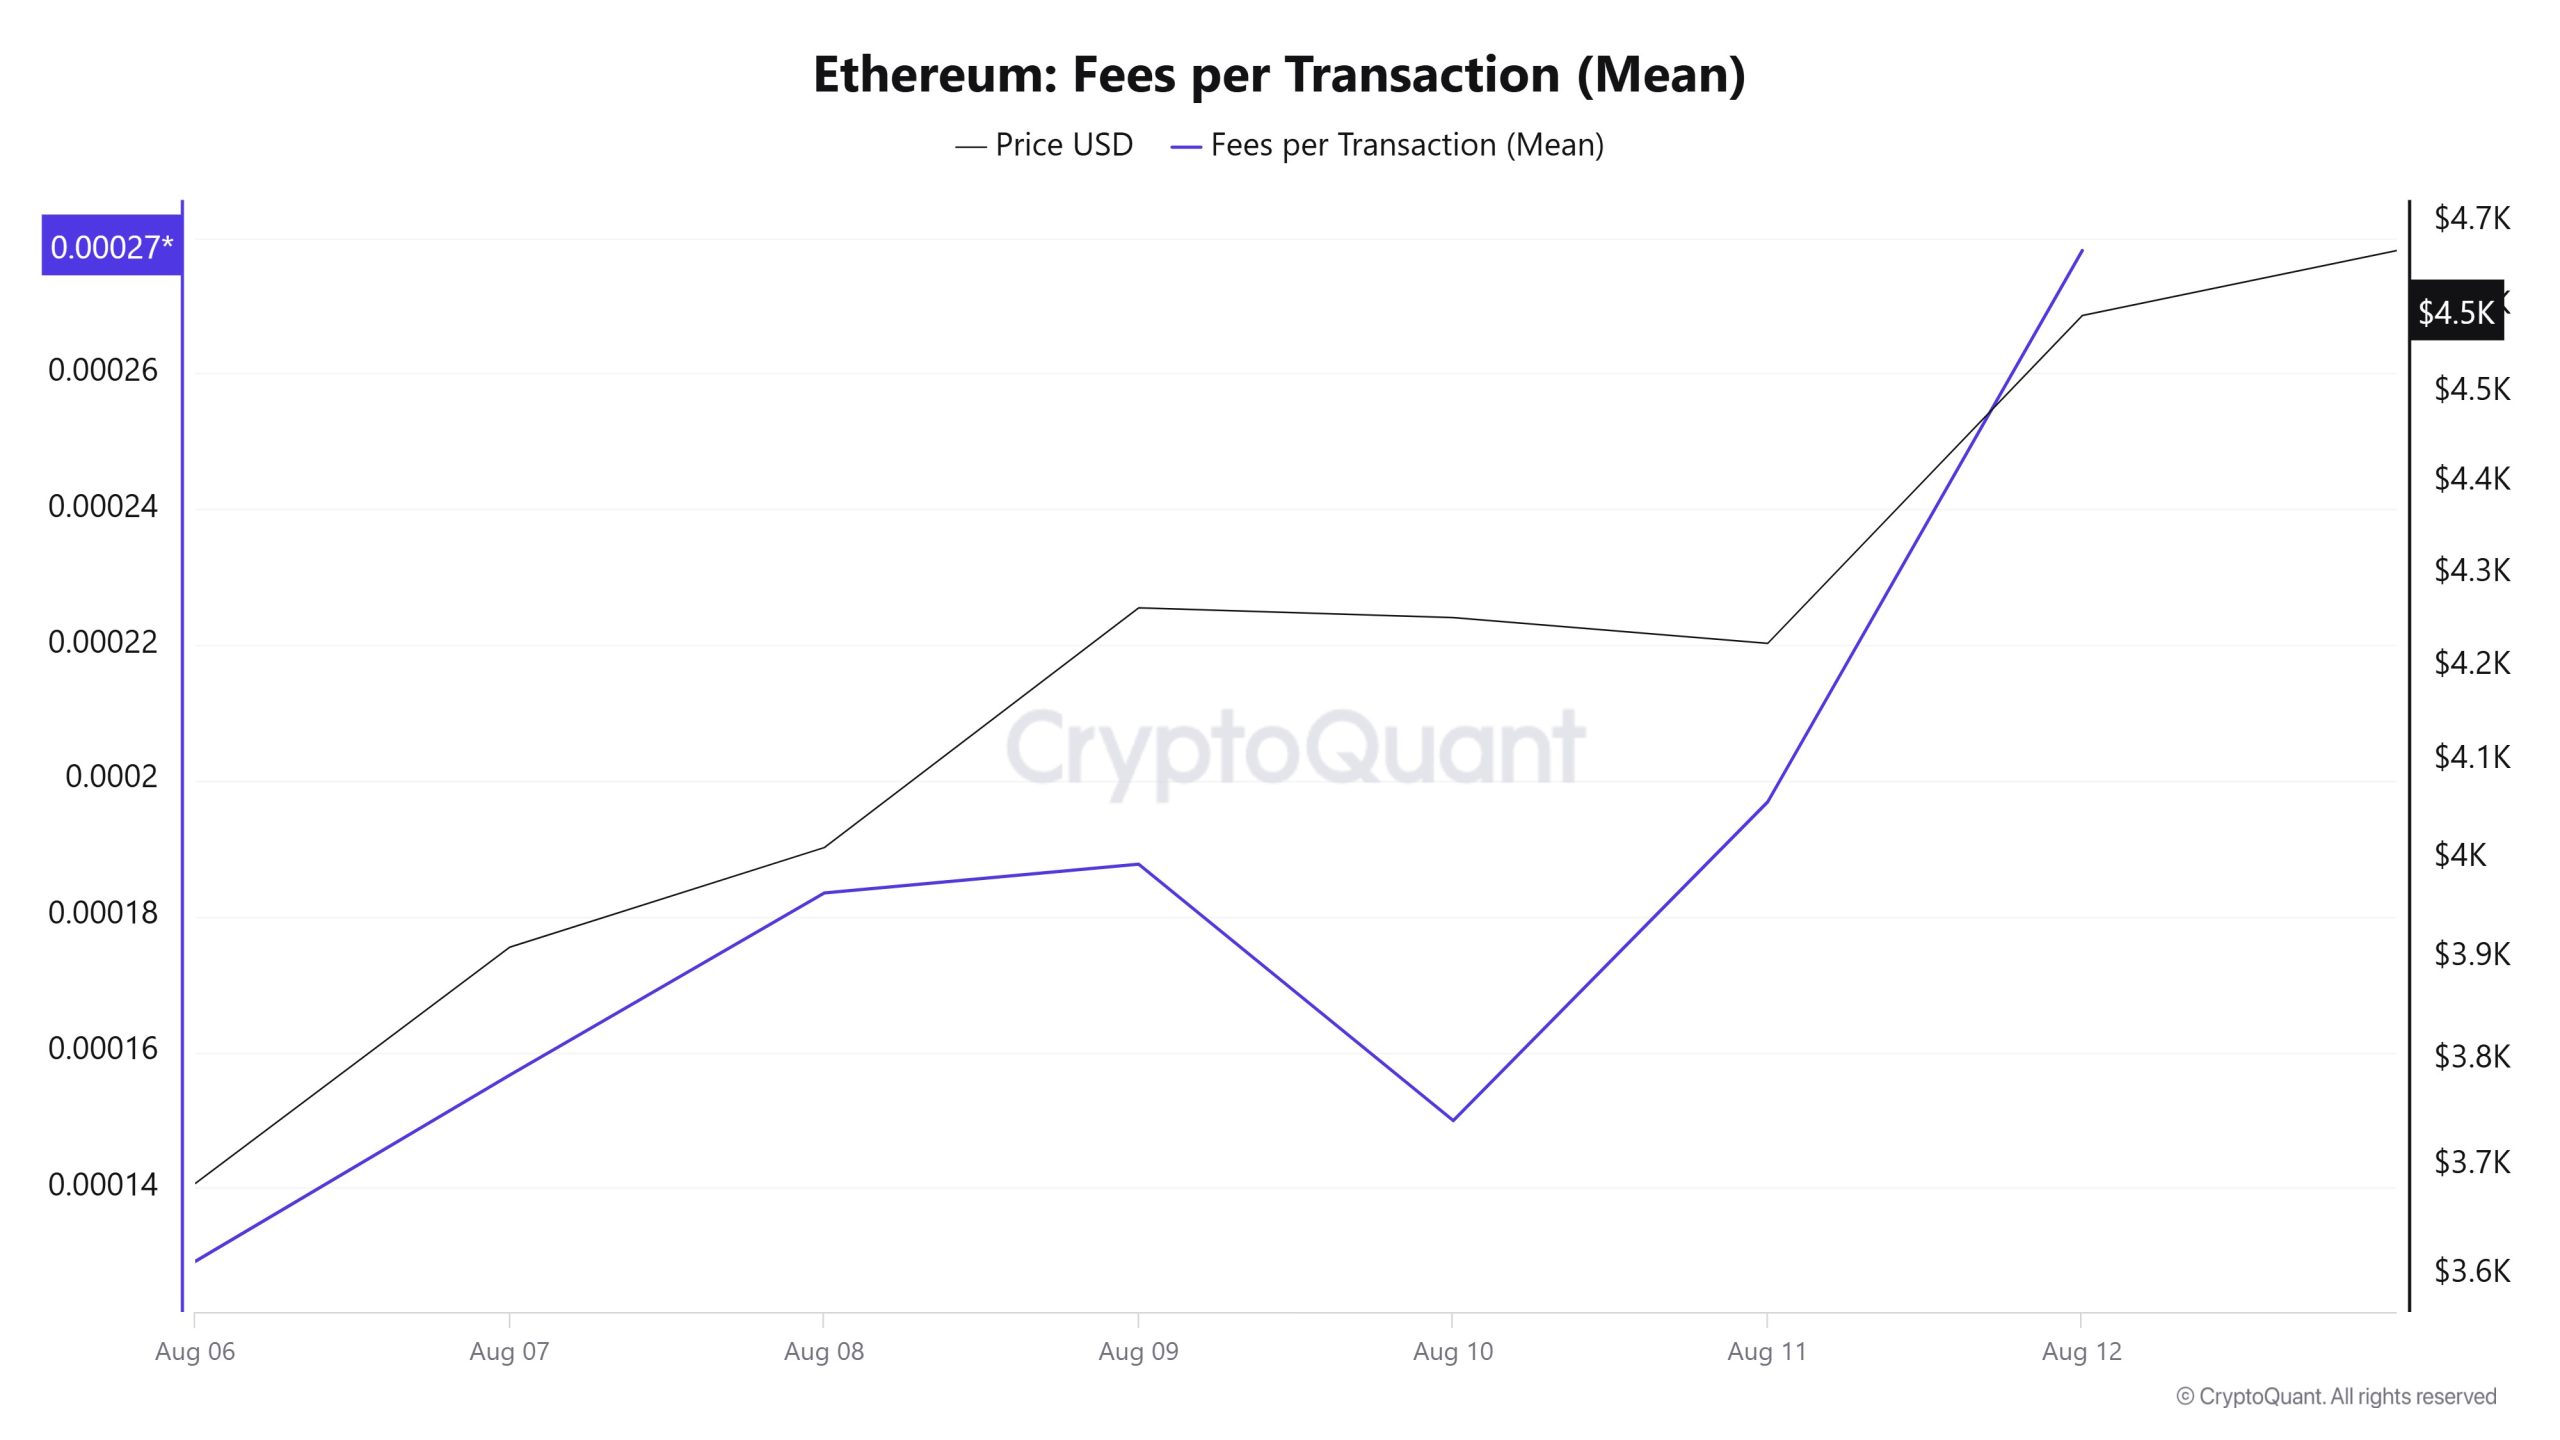
When examining the Ethereum Fees per Transaction (Mean) data for the period between August 6–12, it is observed that the indicator reached 0.000129134893728856 on the first day of the week, August 6.
From this date onwards, the price of Ethereum experienced volatility, resulting in an upward trend until August 9. On August 10, the value dropped to 0.000149896639643983, marking a limited pullback. In the following days, an upward trend was again observed in the indicator, and the price closed at 0.00027811080789579 on August 12, the last day of the week.
Bitcoin: Fees (Total)
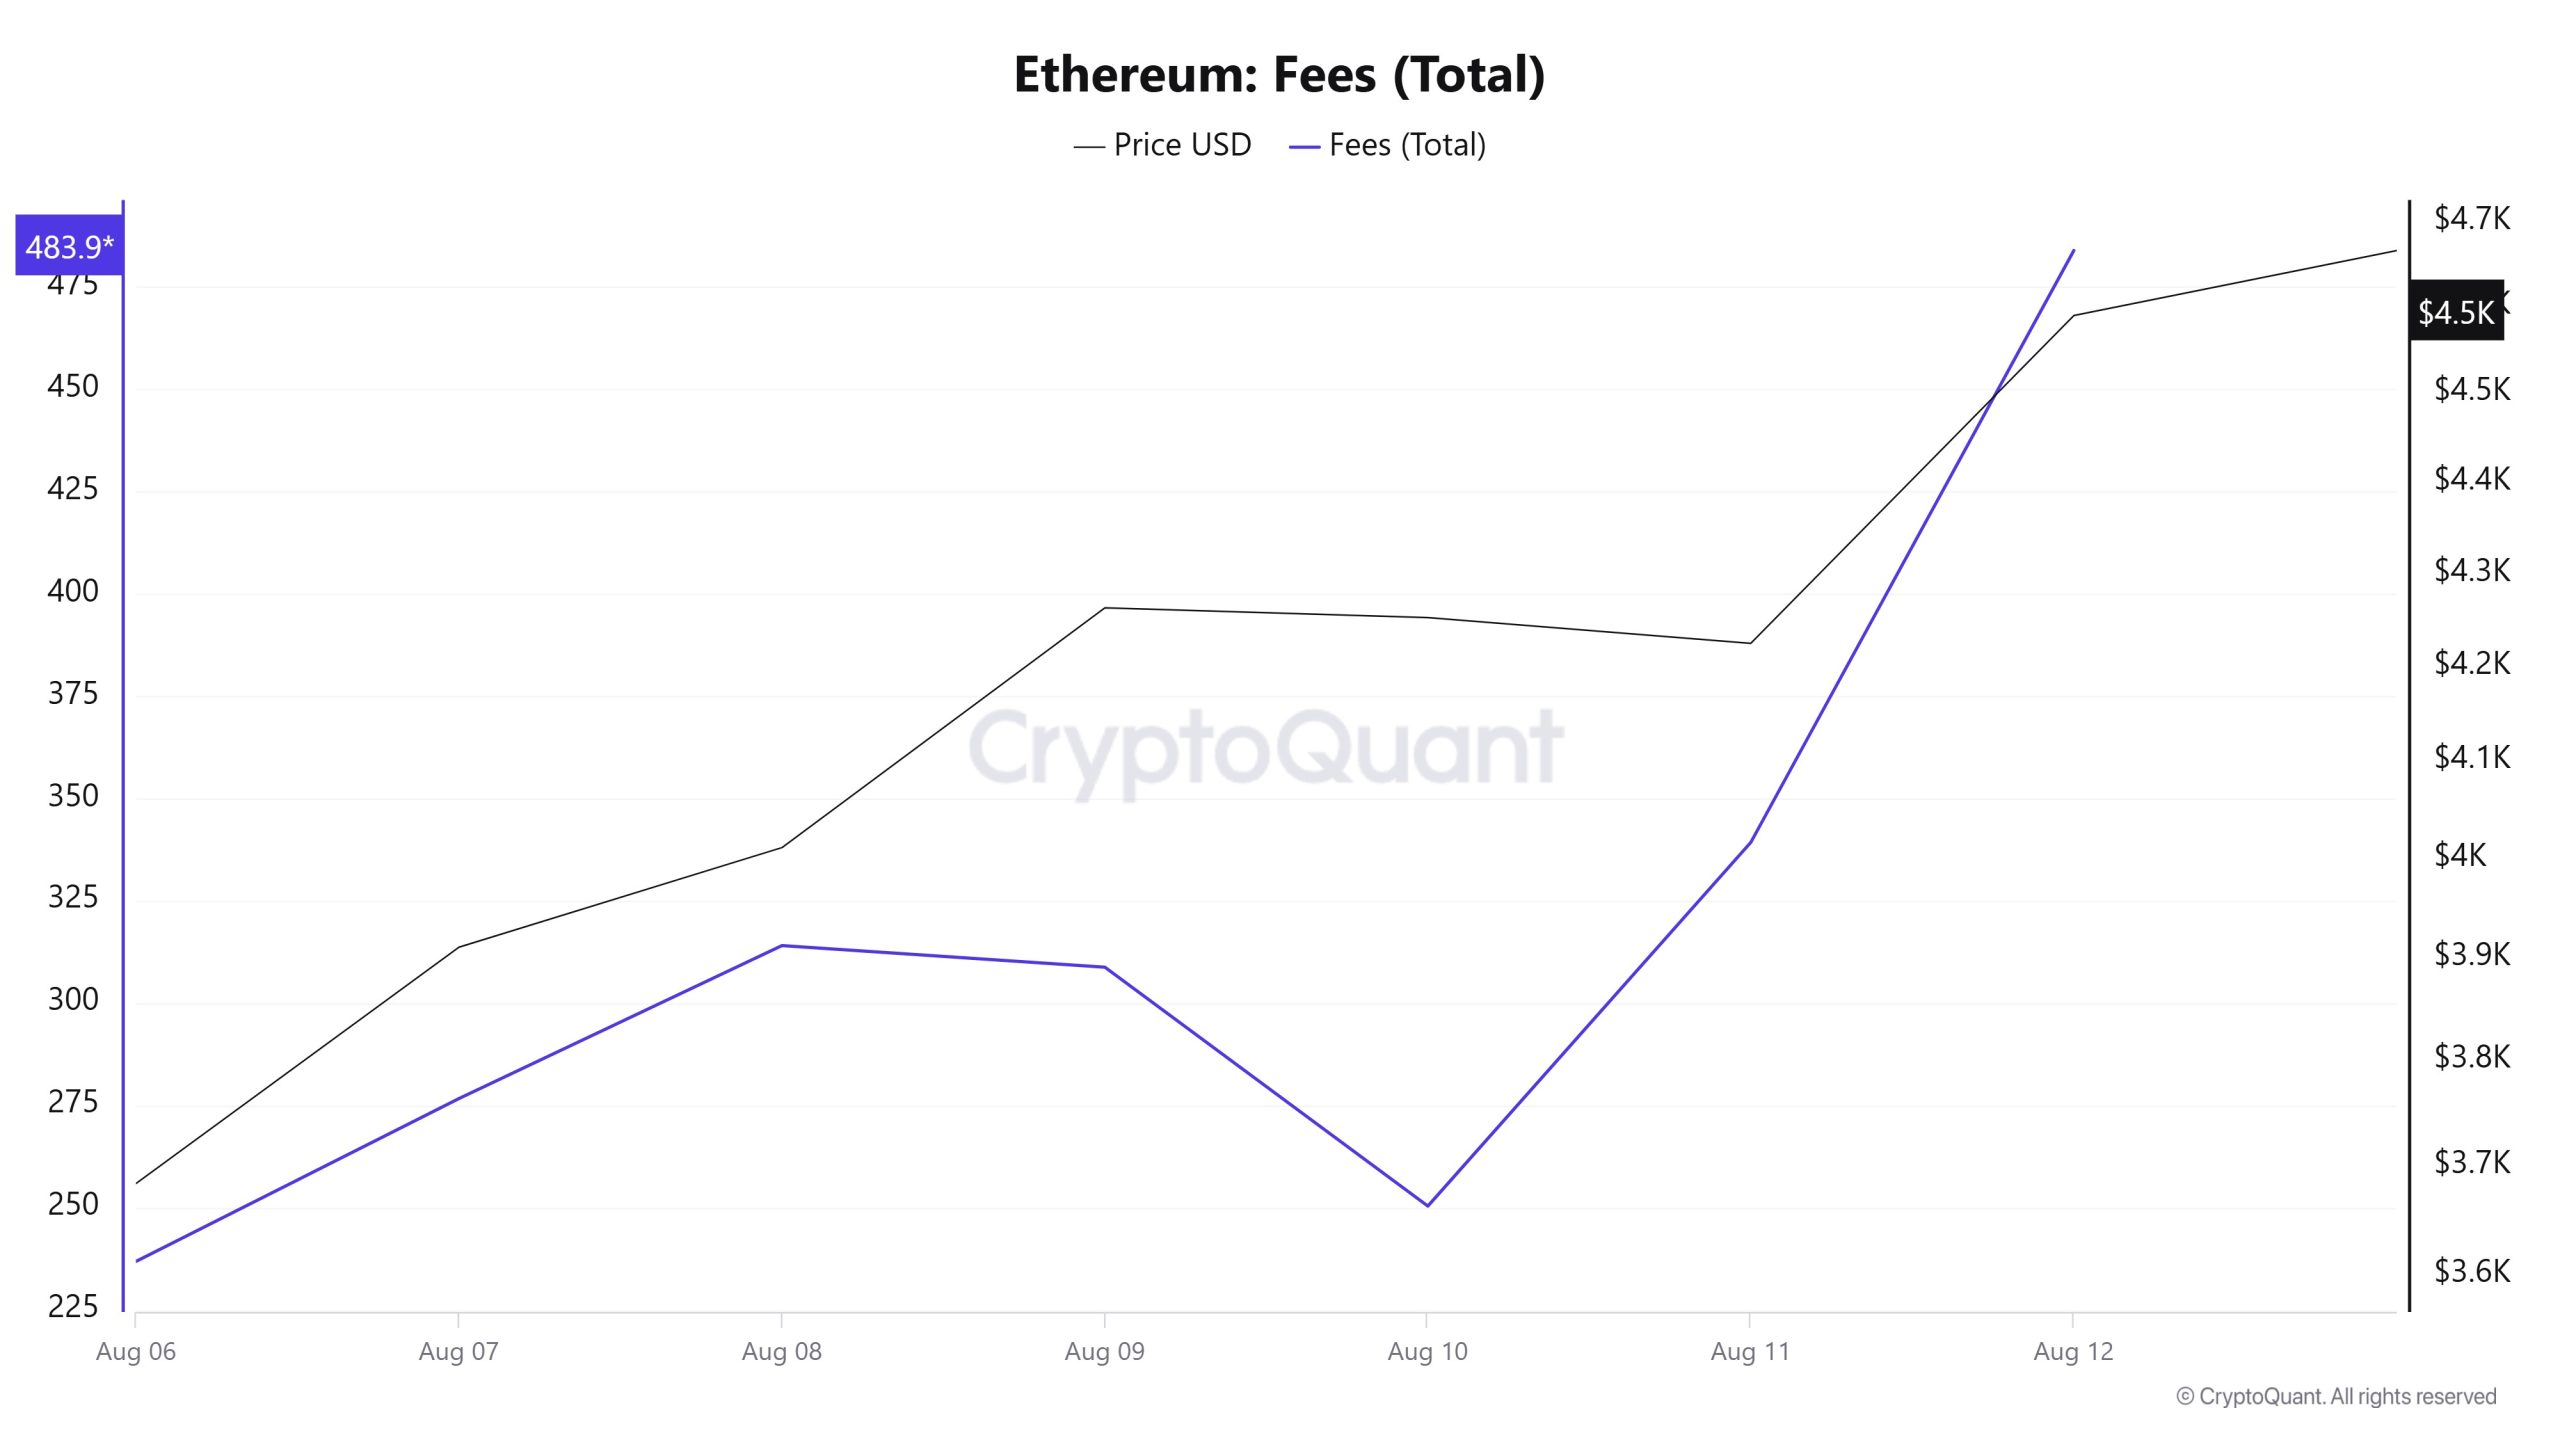
Similarly, when examining the Ethereum Fees (Total) data between August 6 and 12, it can be seen that the indicator stood at 236.80188618465175 on August 6, the first day of the week.
From this date onwards, an upward trend was observed until August 9 due to the impact of volatile movements in the Ethereum price. On August 10, the value dropped to 250.34492611229044, recording a limited pullback. In the following days, an upward trend was again observed in the indicator, and the price closed at 483.9453447031991 on August 12, the last day of the week.
Blocks Mined
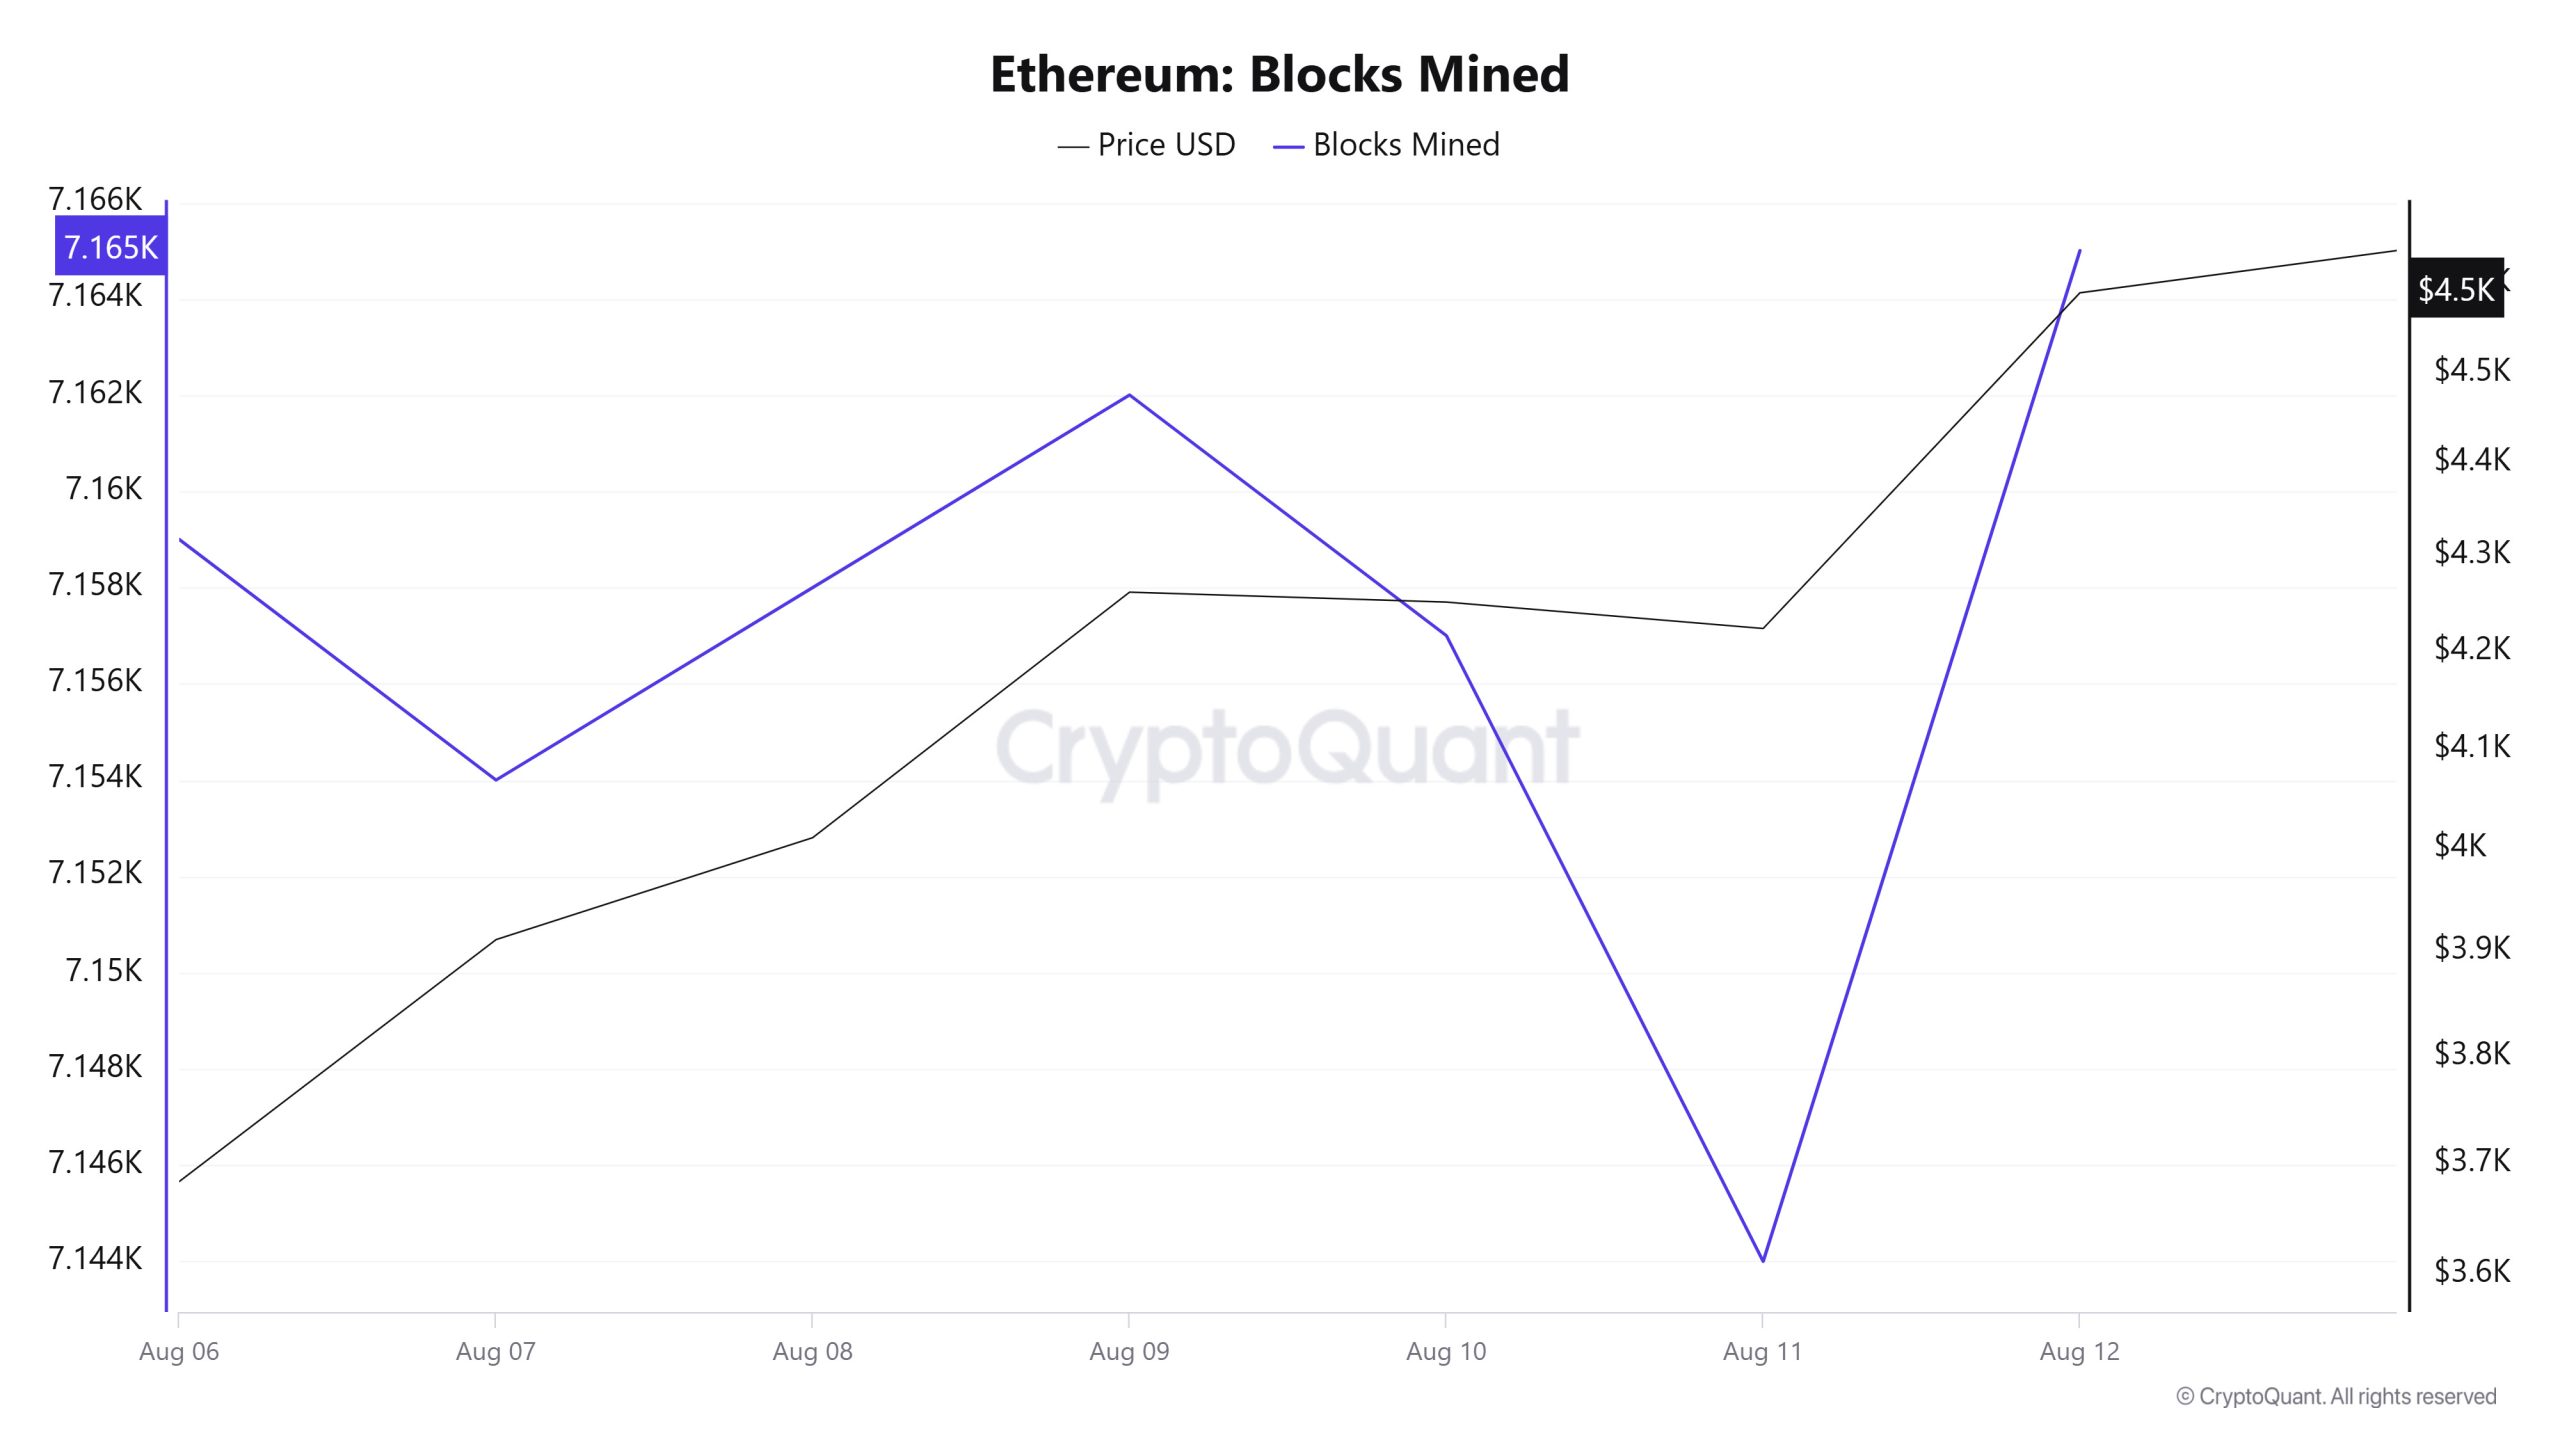
When examining Ethereum block production data between August 6 and 12, an increase was observed throughout the week. While 7,159 blocks were produced on August 6, this number rose to 7,165 as of August 12. The increase in the number of blocks produced indicates that the network was more heavily used during this period. A positive correlation was observed between the Ethereum price and the number of blocks produced over the week.
Block Size
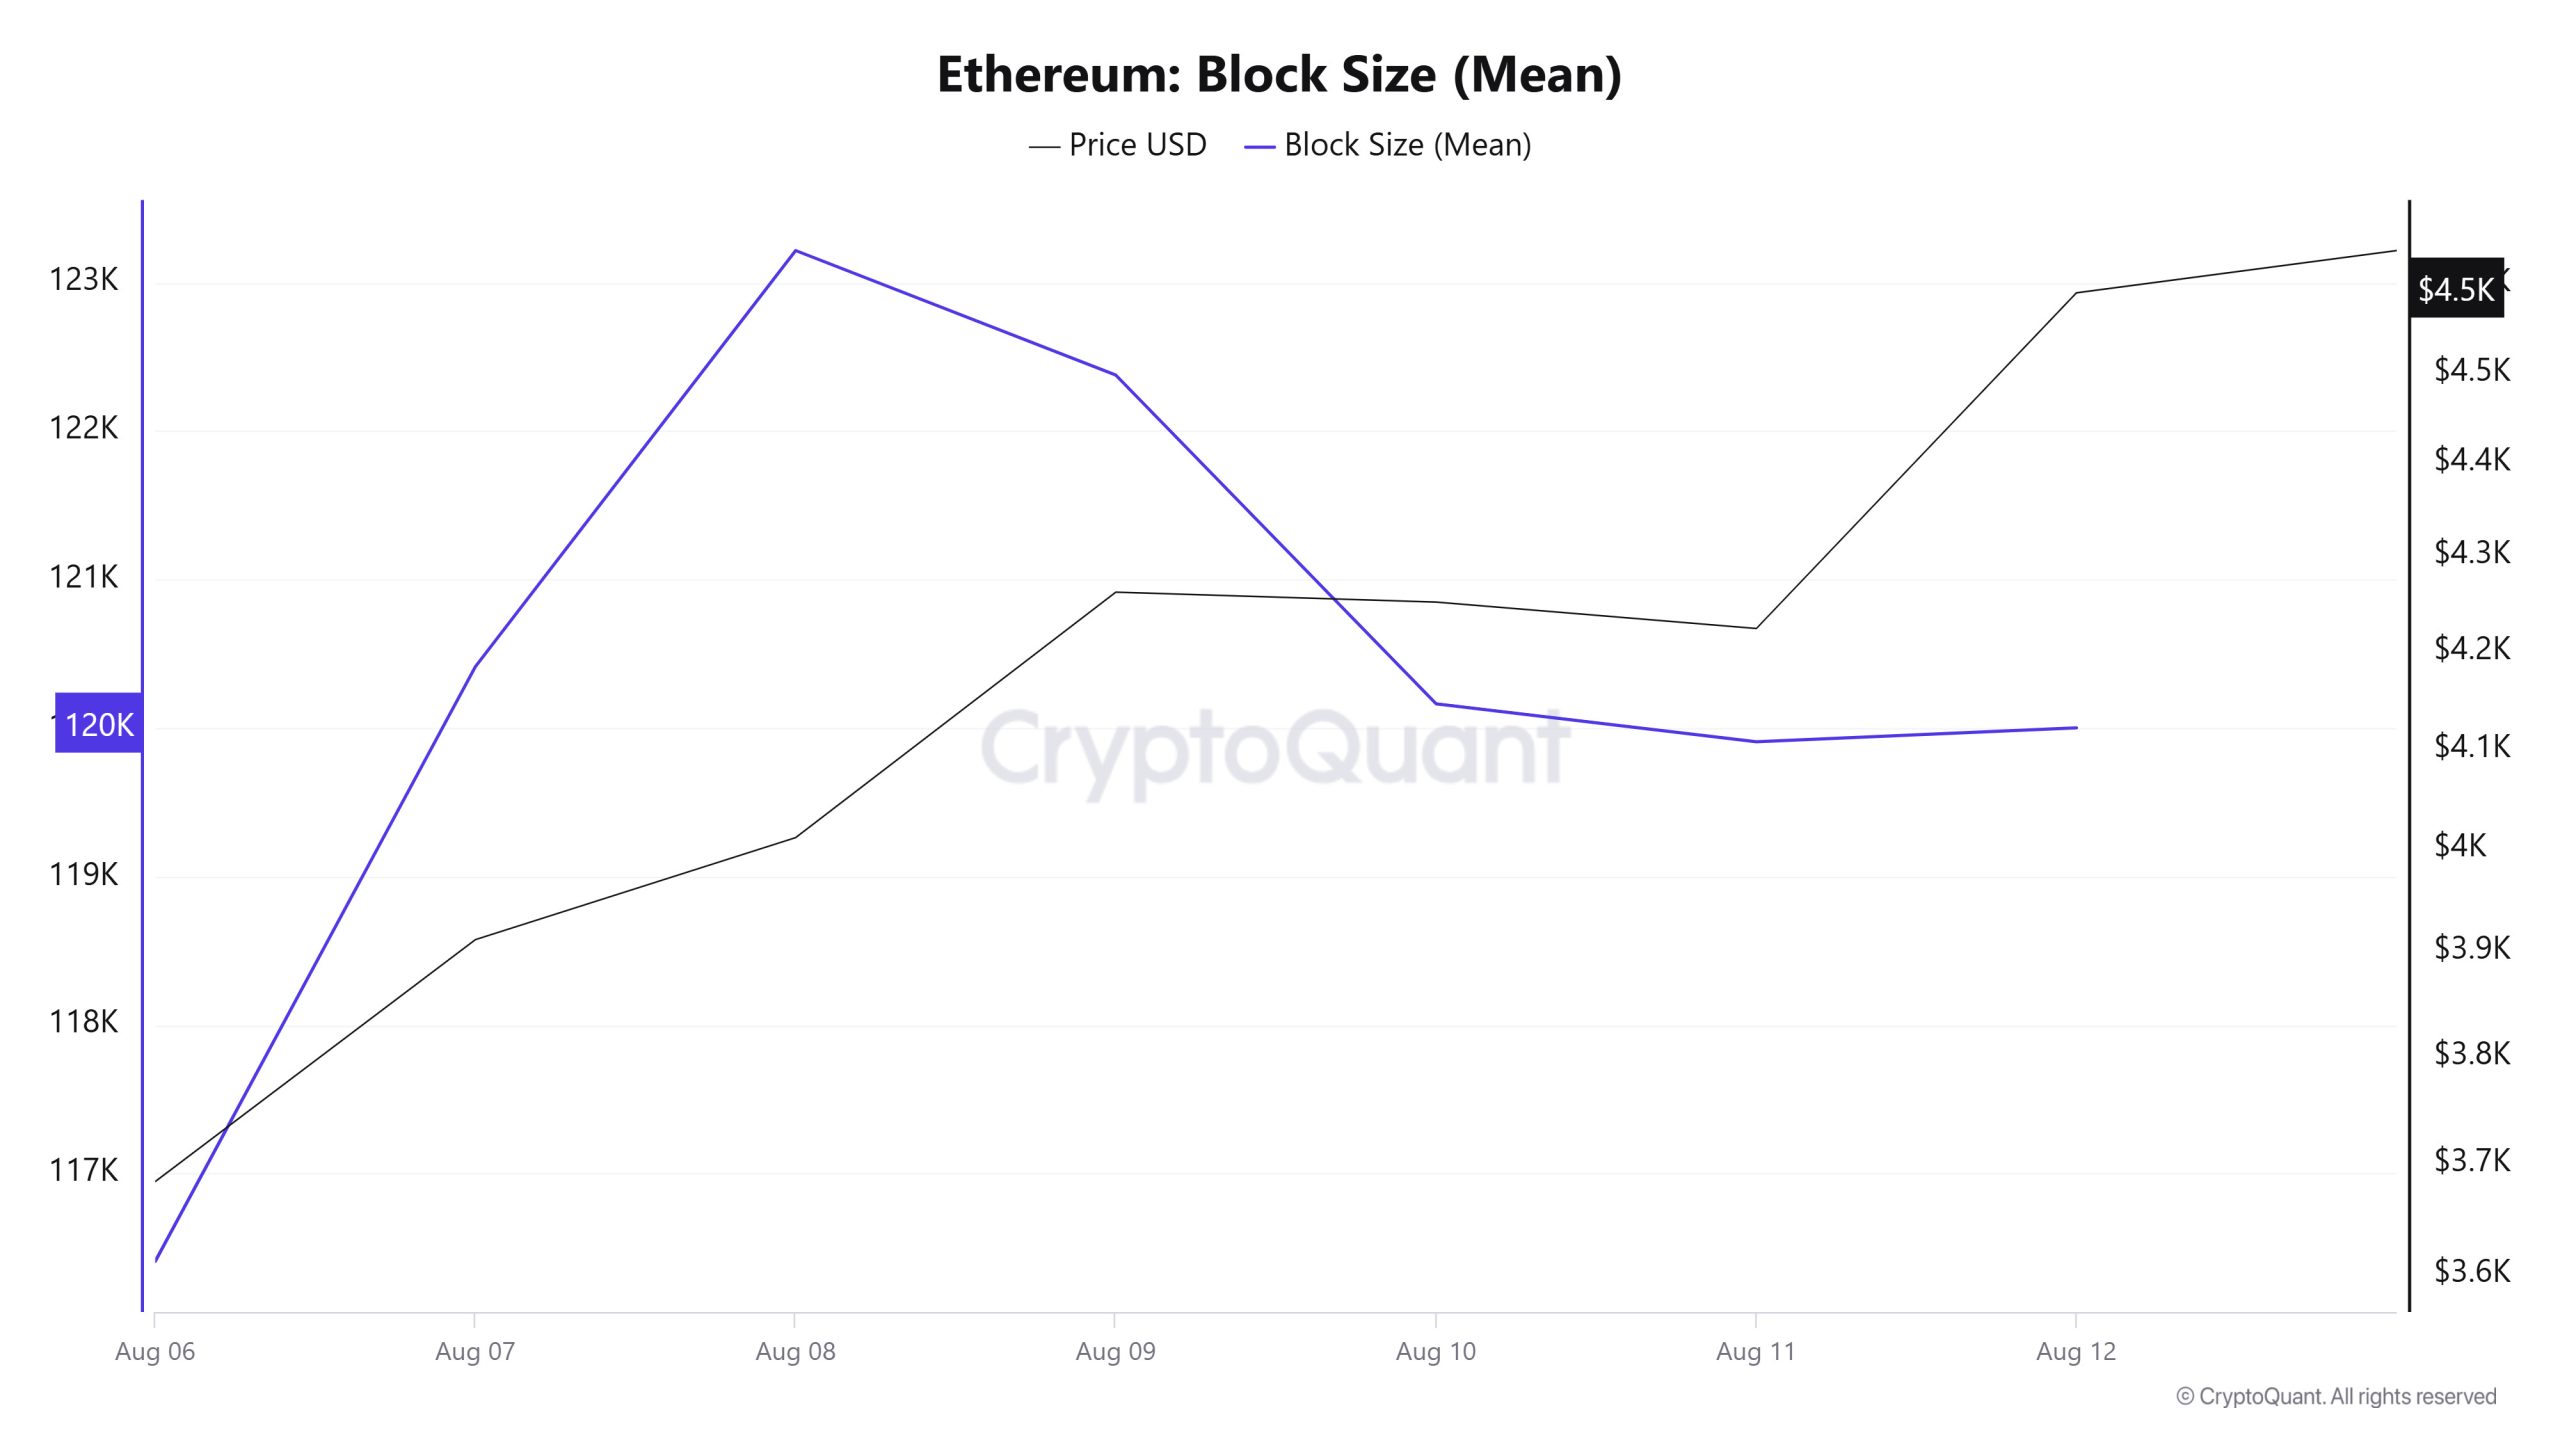
When examining Ethereum block size data between August 6 and August 12, a significant increase was observed throughout the week. While the average block size was measured at 116,407 bytes on August 6, this value rose to 120,000 bytes as of August 12. During the relevant period, a positive correlation was observed between block size and Ethereum price throughout the week.
Block Interval
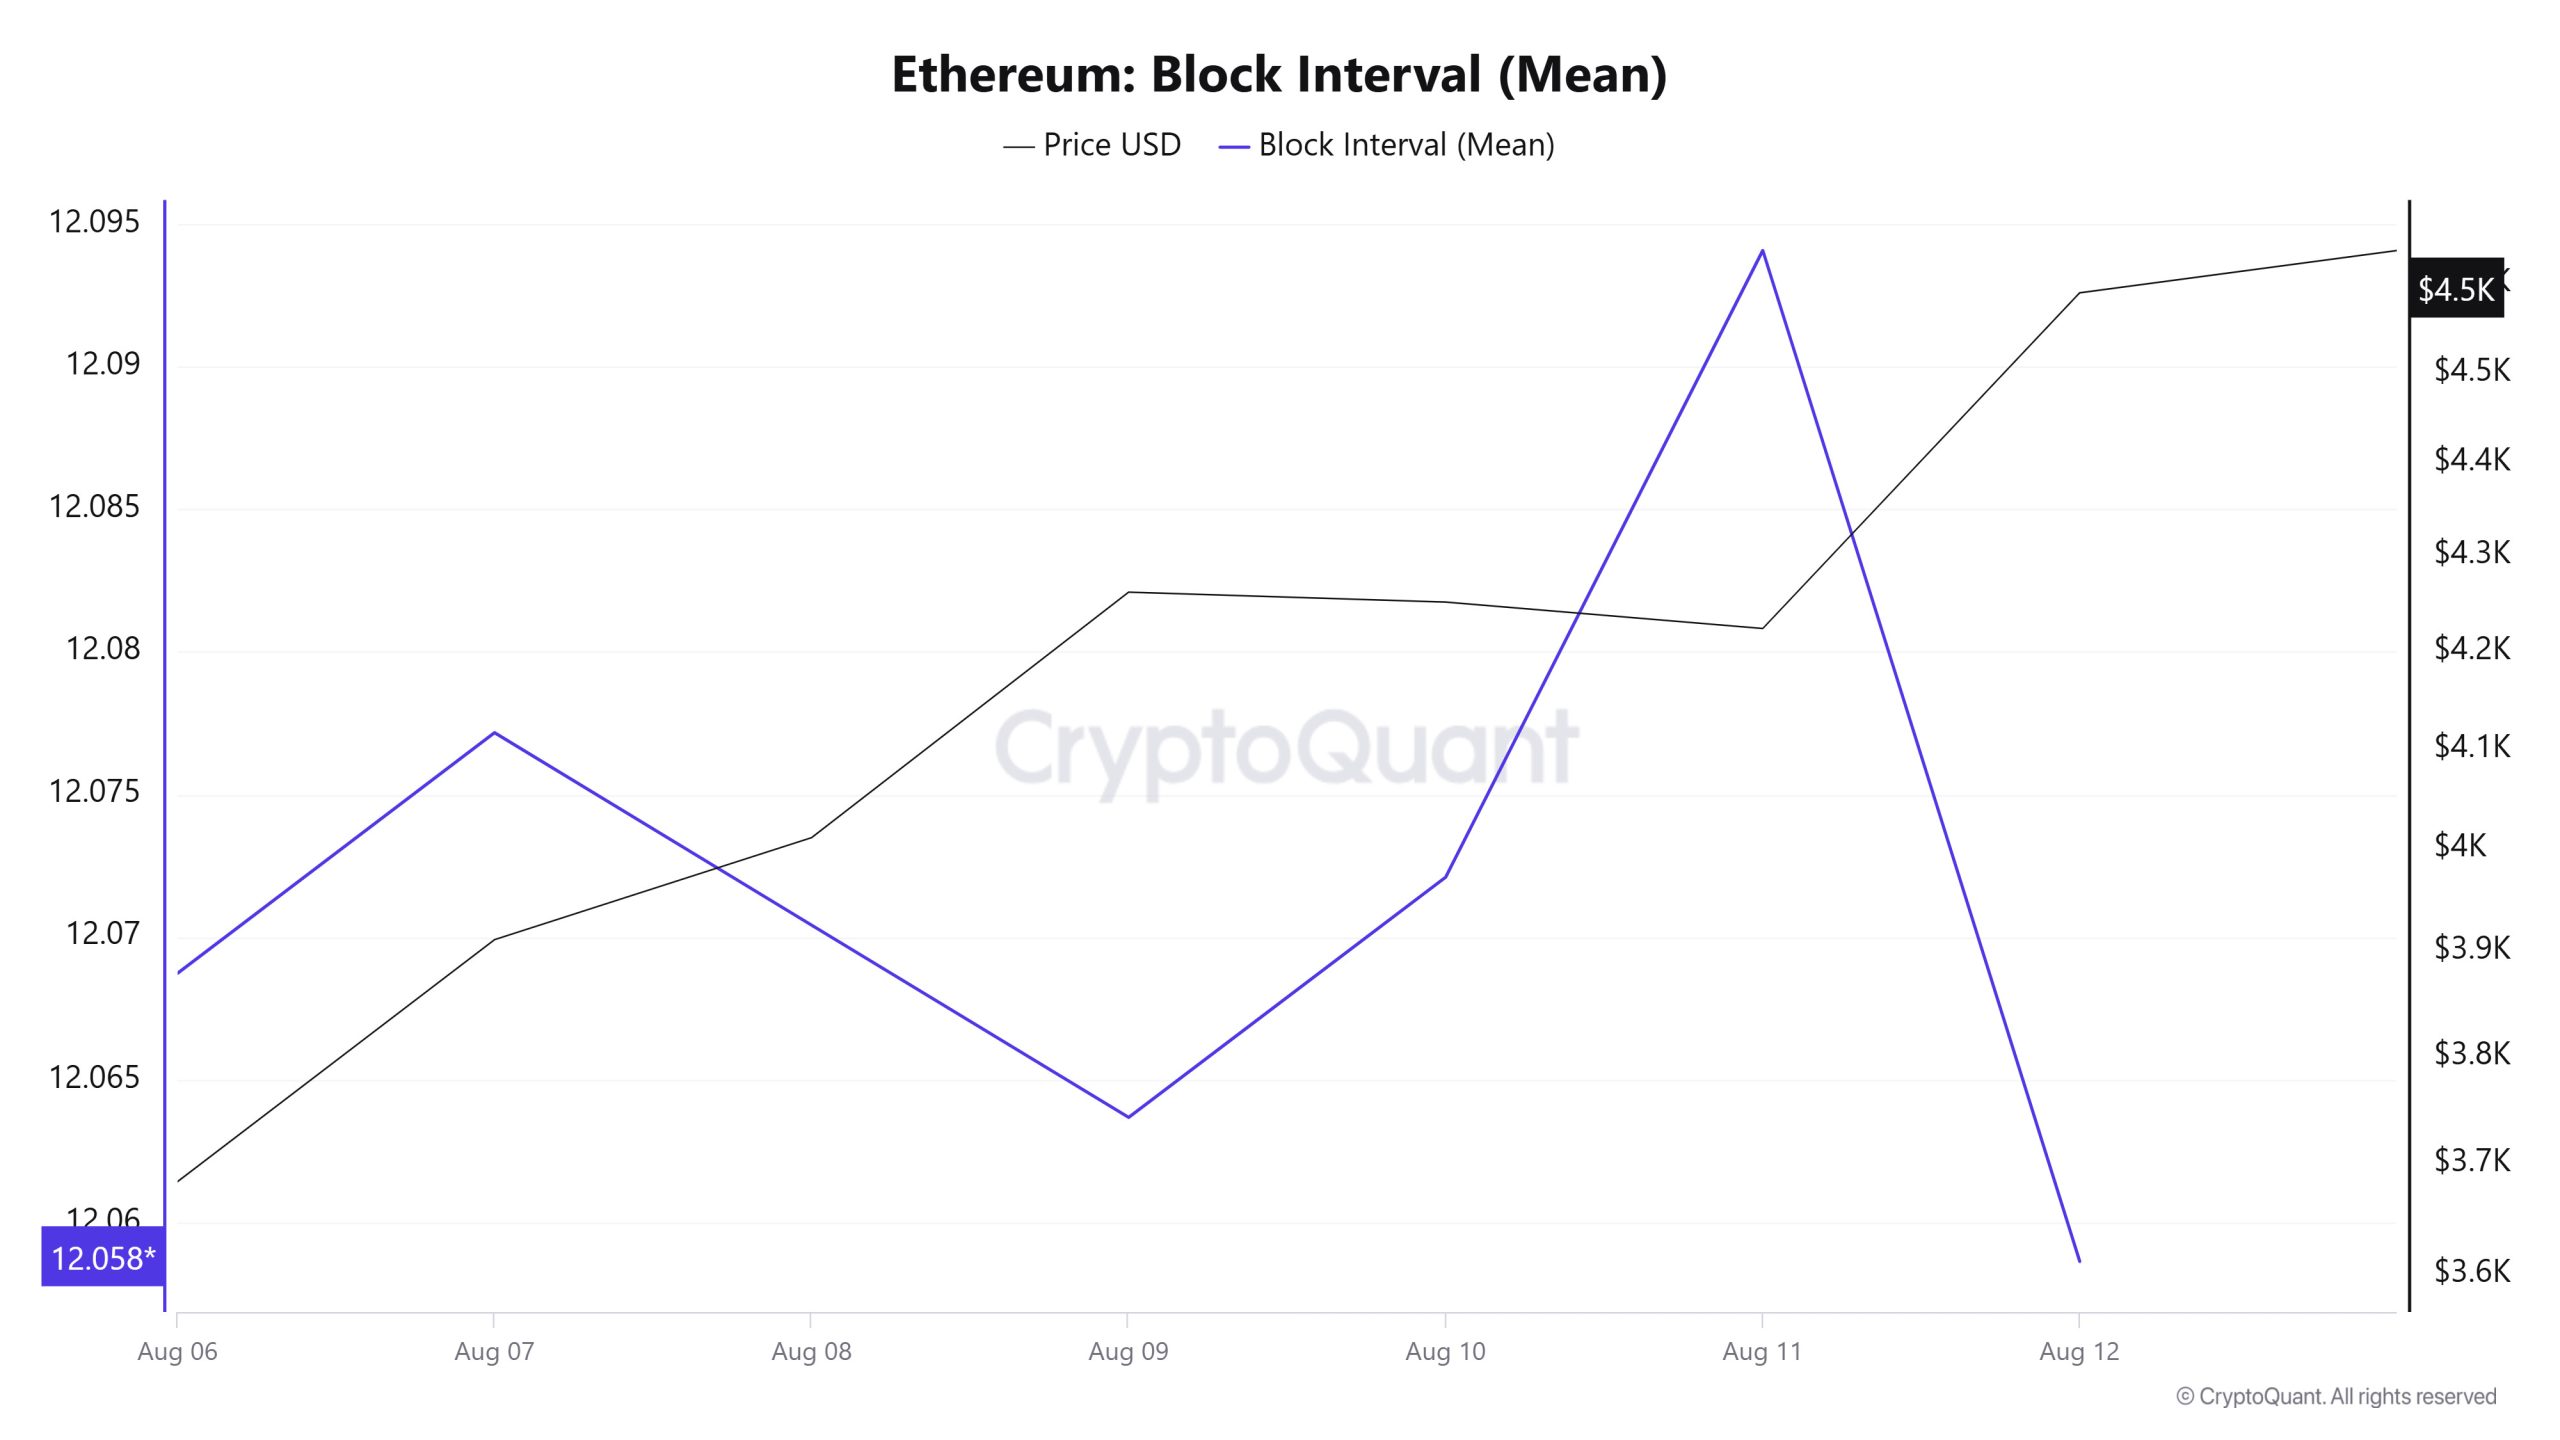
When analysing Ethereum block data between August 6 and 12, a slight decrease was observed throughout the week. On August 6, the average block time was recorded as 12.06 seconds, while by August 12, this time had decreased to 12.05 seconds. During this period, a negative correlation between Ethereum block time and price movement was dominant throughout the week.
Transaction
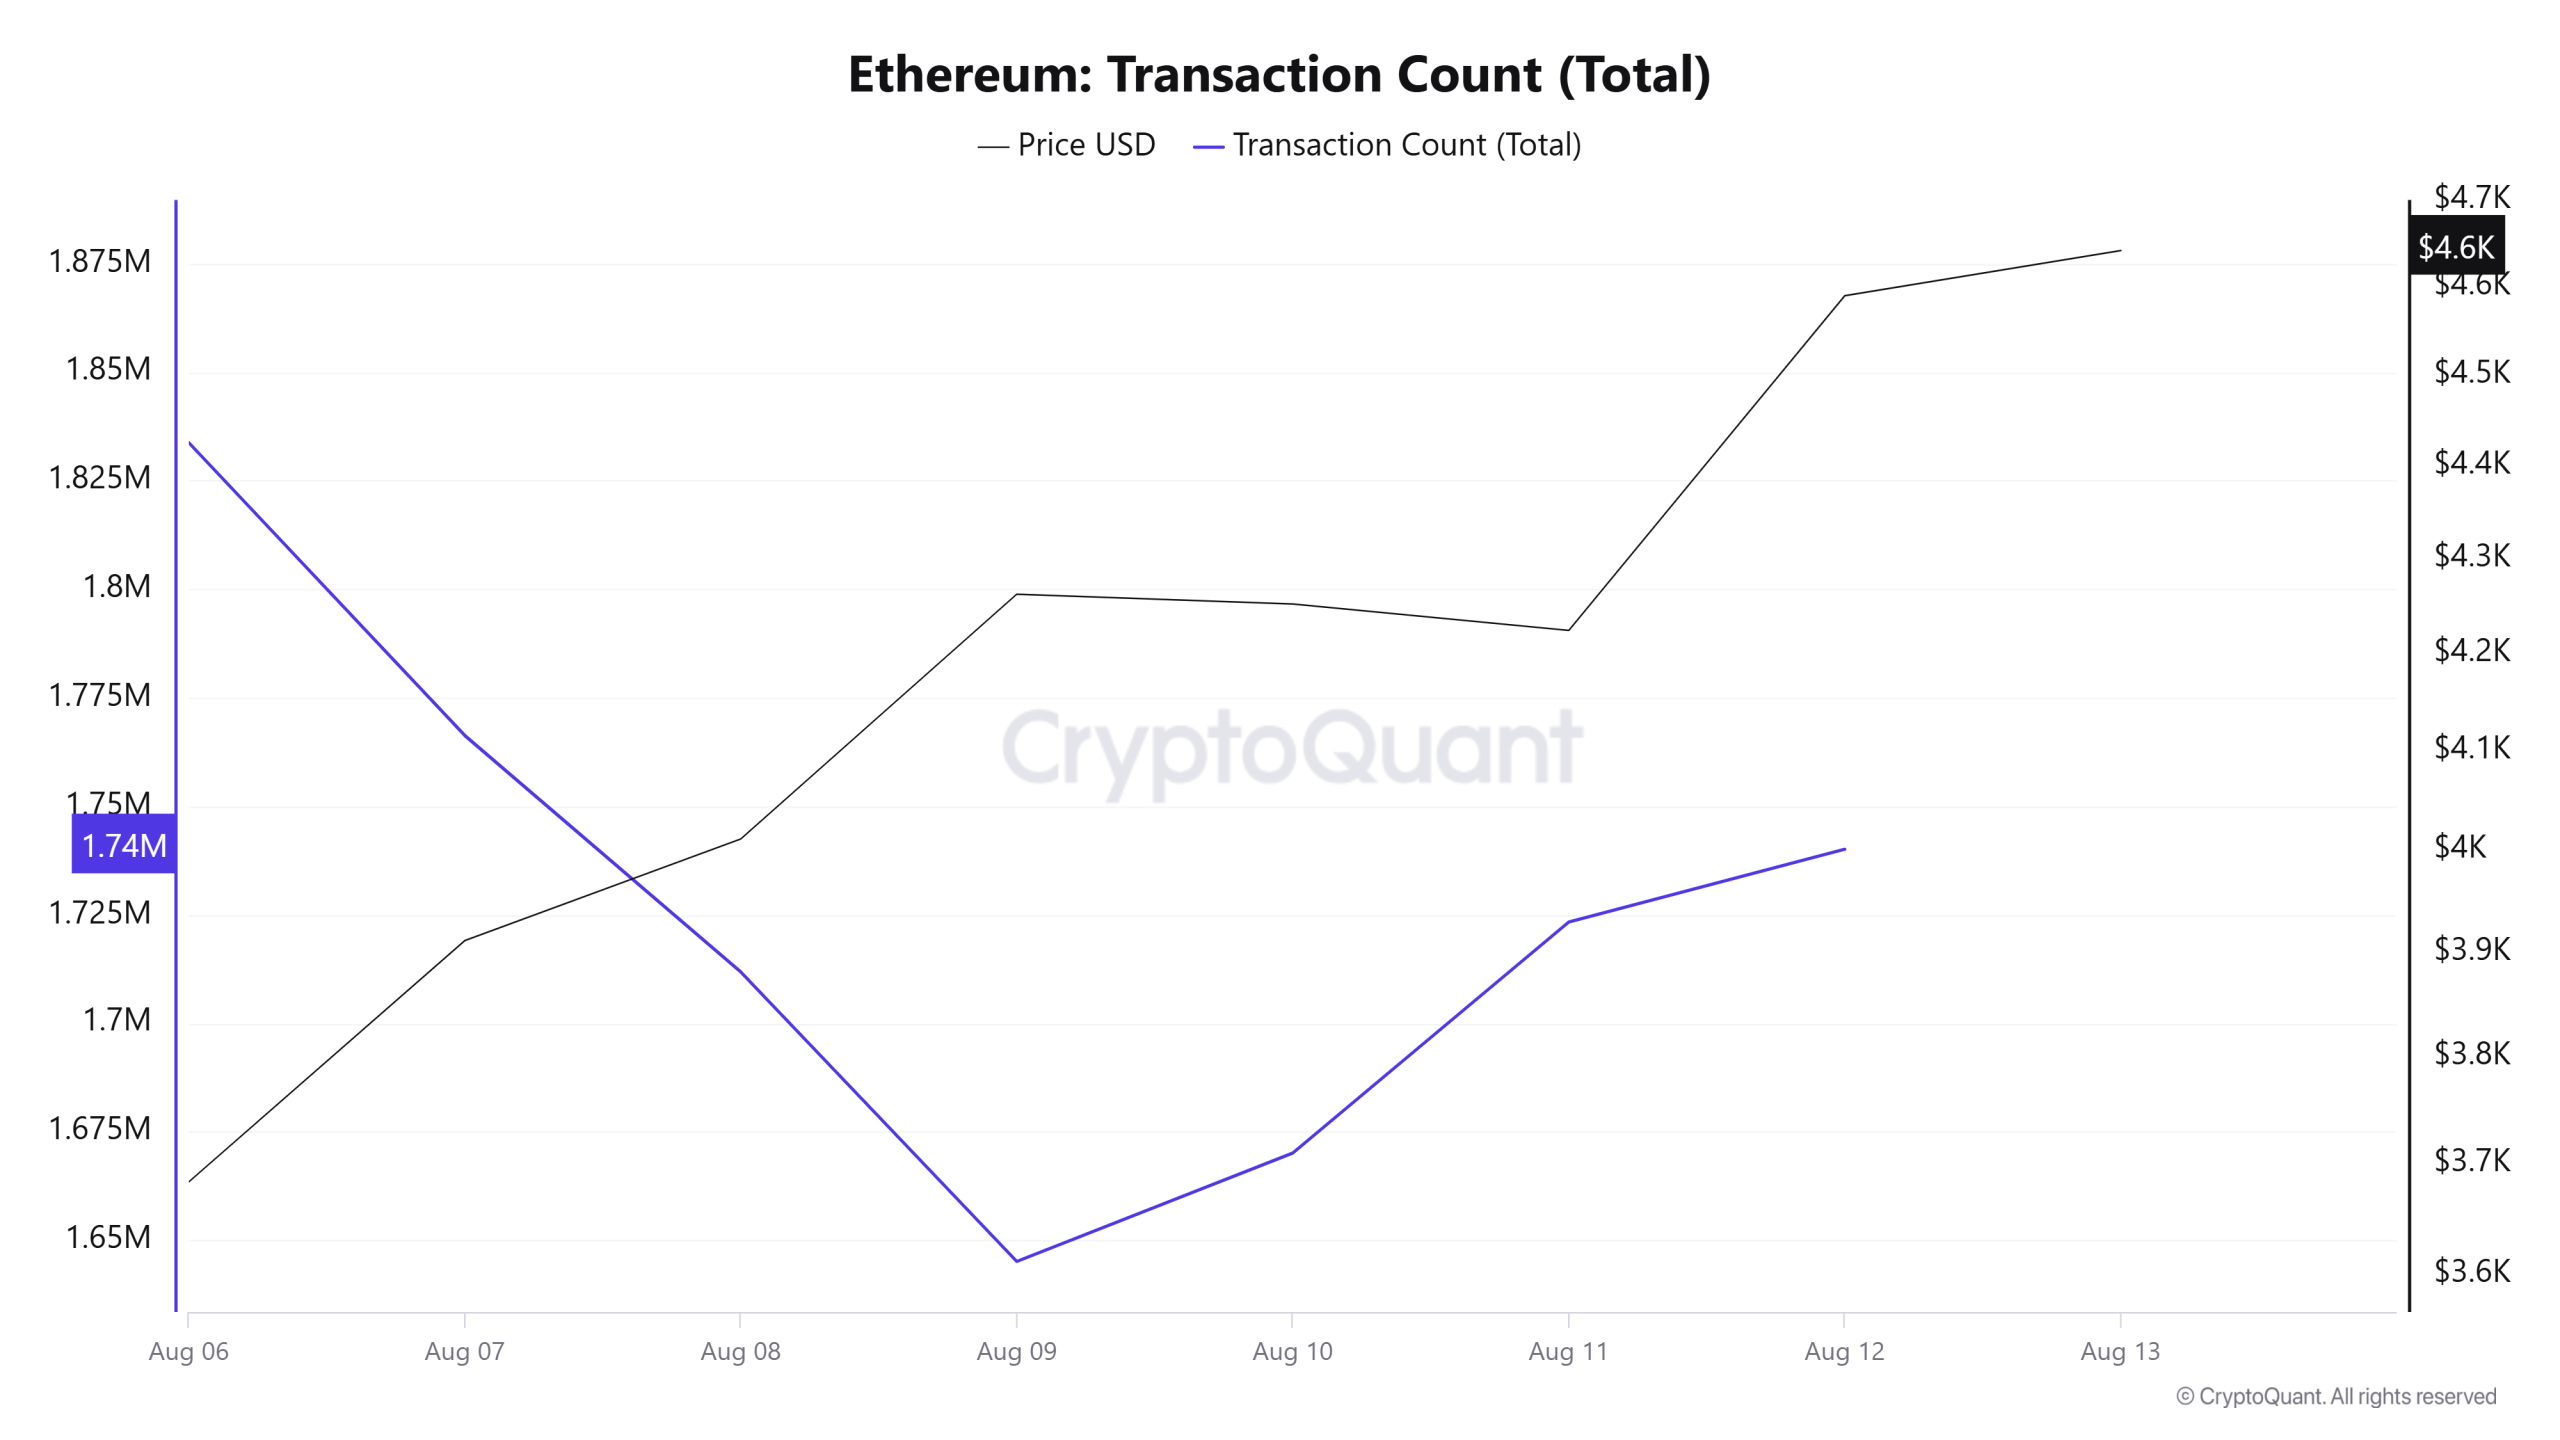
Last week, a total of 10,605,471 transactions were made on the Ethereum network, while this week, that number rose by 14.48% to 12,140,647. The highest number of transactions for the week was 1,833,756 on August 6, while the lowest was 1,645,152 on August 9. In fact, August 6 marked the second-highest transaction volume in Ethereum’s history. When the transaction count was at these levels, the price increased by over 50% within a few weeks. While the increase in transaction volume indicates a significant rise in network usage and, consequently, Ethereum burns, the correlation between price and transaction volume was negatively weighted throughout the week.
Tokens Transferred
The total amount of ETH transferred on the Ethereum network last week was 12,913,505, while this week it increased by approximately 44% to 18,658,140. This is a strong indicator that users and investors are using Ethereum more actively. The 4,175,871 ETH transferred on August 12 was recorded as the third busiest daily transaction of 2025 and also represented the highest daily token transfer amount of the week. On the other hand, the lowest transfer volume of the week was recorded on August 10 with only 1,645,804 ETH transferred. Throughout the week, positive correlations were observed between price and the amount of tokens transferred.
Ethereum demonstrated both active and strong performance this week, with network activity positively supporting the price. These figures confirm investors’ growing confidence in the market and reinforce Ethereum’s status as a vibrant ecosystem.
Estimated Leverage Ratio
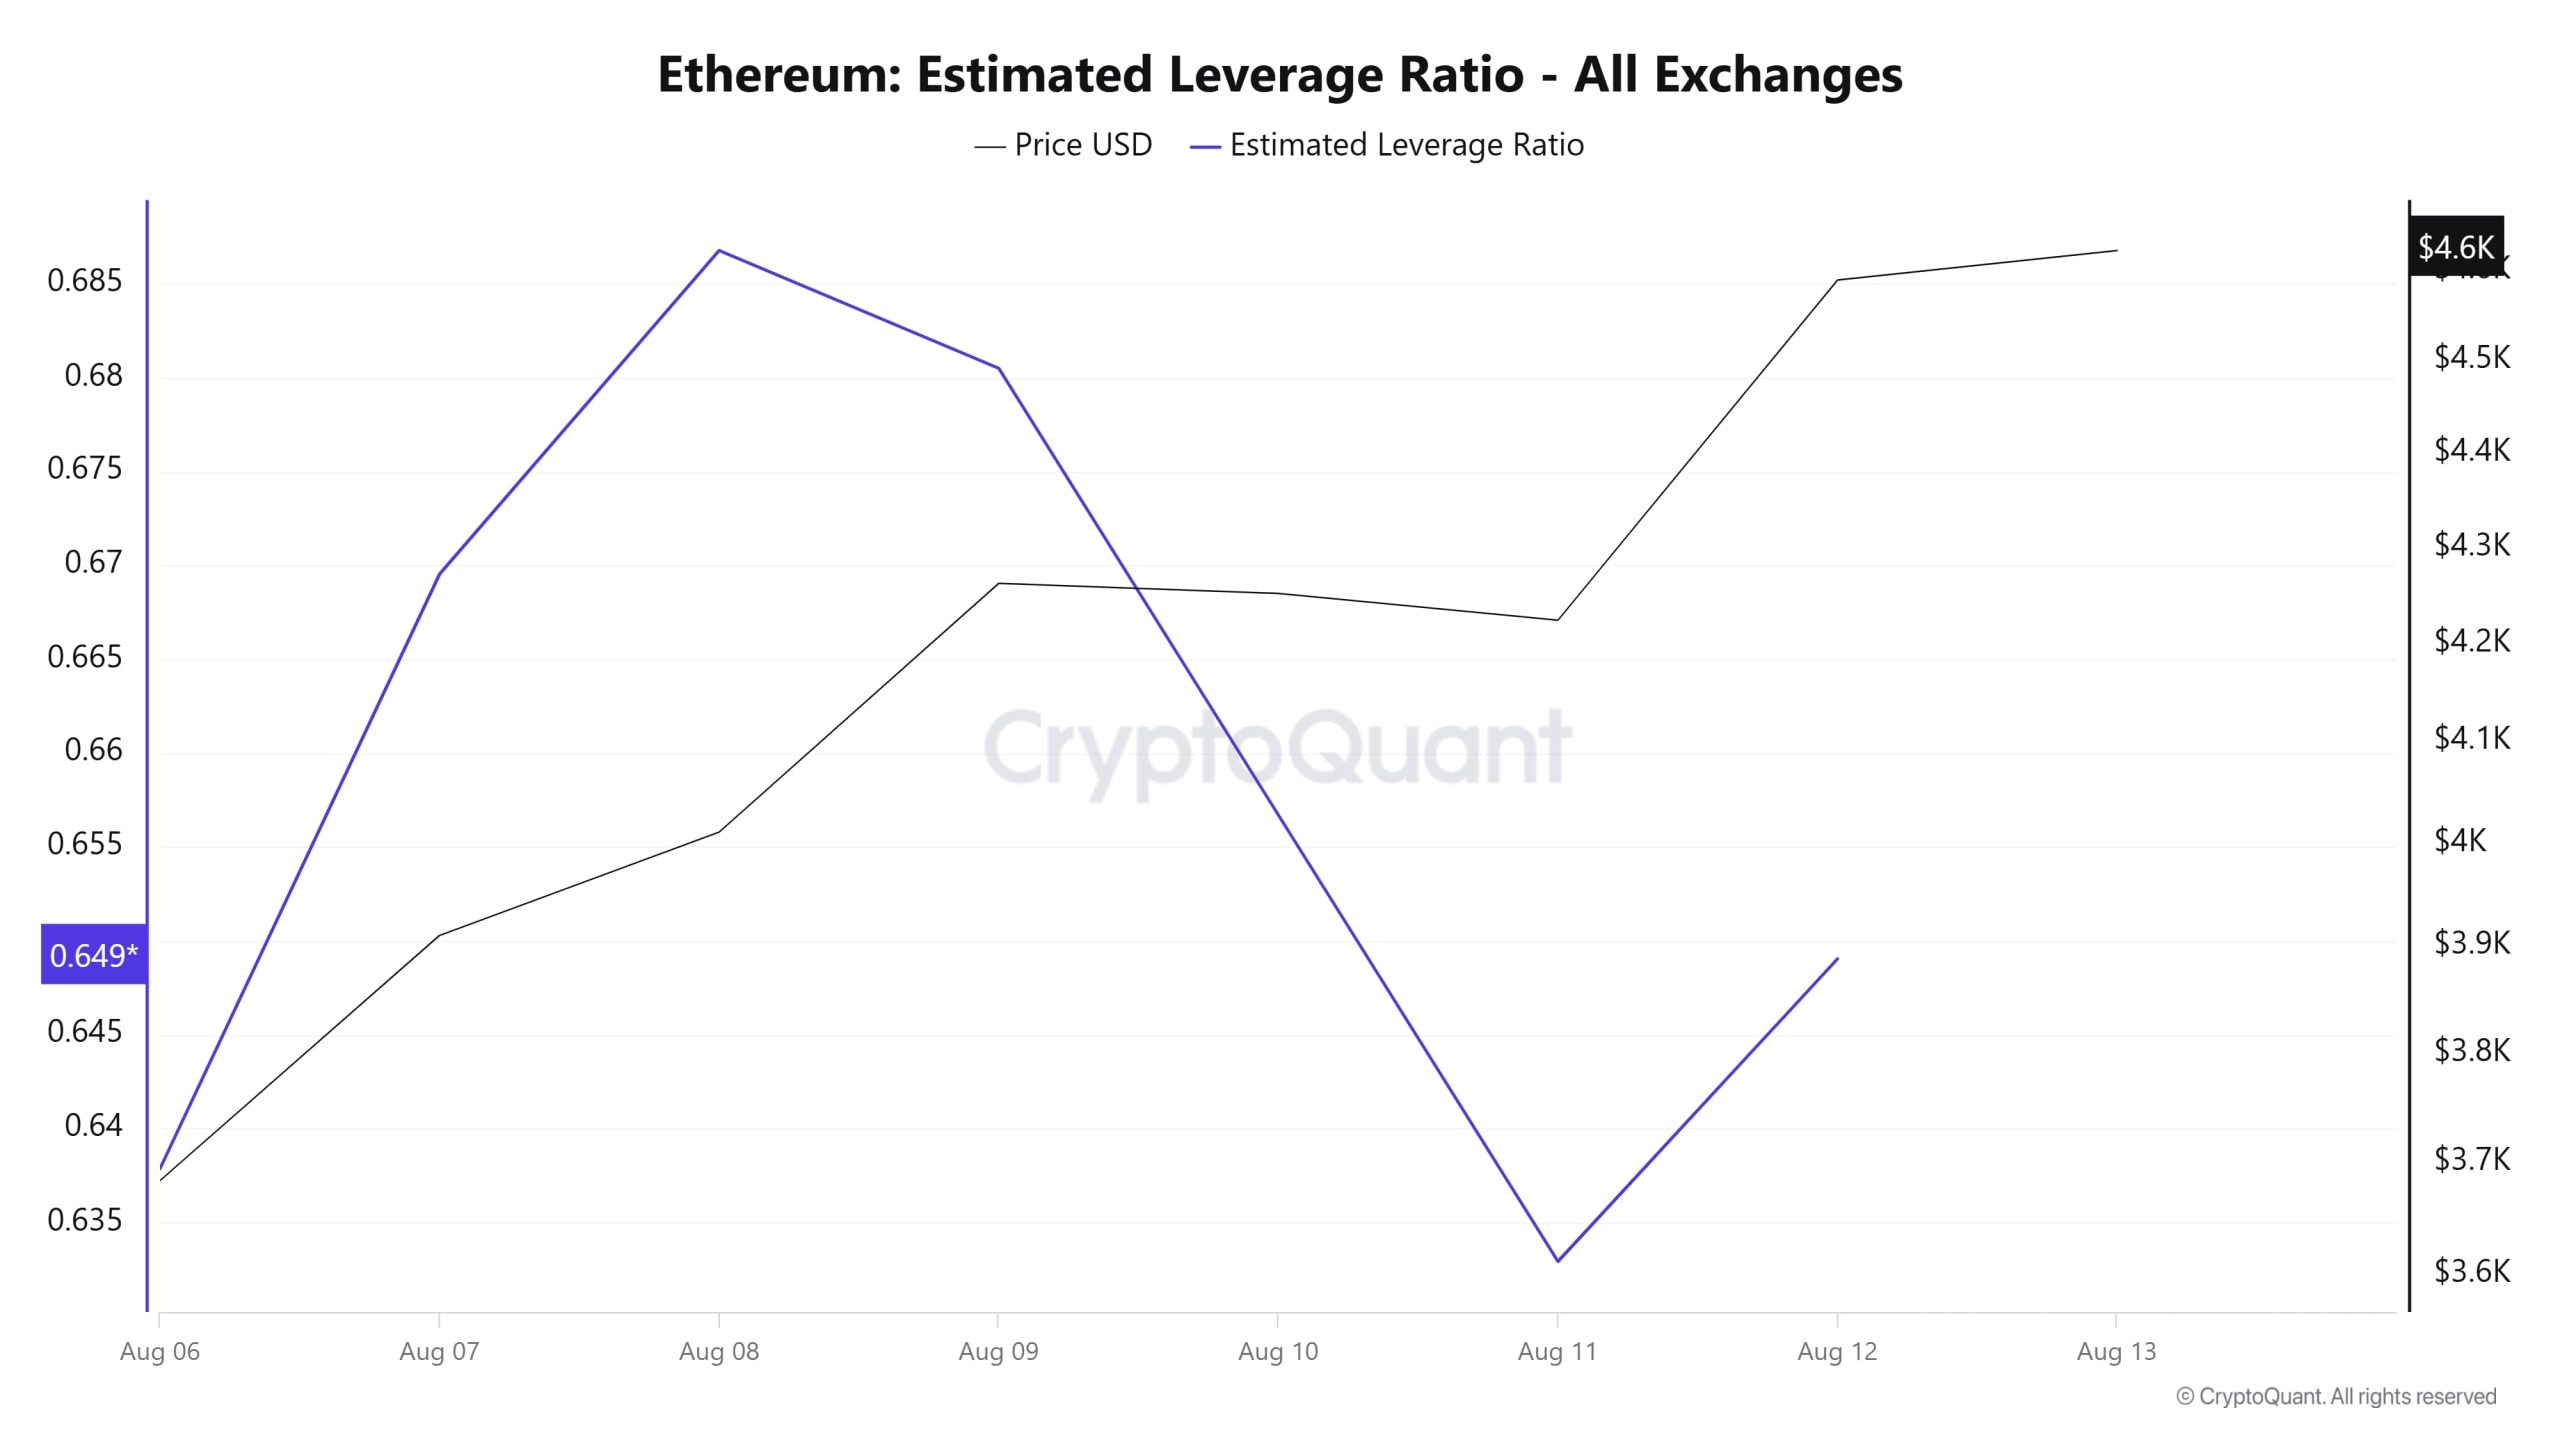
Over the 7-day period, the metric initially showed an increase but later declined. Starting at 0.637, the ELR (Estimated Leverage Ratio) rose to its highest value of 0.686 on August 8. After this point, the metric declined, reaching its lowest level on August 11. At the time of writing, it has risen to 0.649. A higher ELR indicates that participants are willing to take on more risk and generally indicates bullish conditions or expectations. It should be noted that these increases may also be due to a decrease in reserves. Looking at Ethereum reserves, there were 18.90 million reserves at the beginning of the process, which rose slightly during the remainder of the process but then declined and currently stands at 18.68 million. At the same time, Ethereum’s open interest was 47.27 billion dollars at the beginning of the process. As of now, the volume has increased during the process, and the open interest value stands out at 62.43 billion dollars. With all this data, the ELR metric experienced a decline during most of the process. The asset’s price, along with all this data, reached its peak at 4,682 dollars as of now. It reached its lowest point on August 6 at $3,600. As of now, although investors’ and traders’ risk appetite is lower than the metric’s peak, it has started to rise again. This has reflected in the ETH price, causing it to rise as of now. The fluctuations in the ELR ratio and the increase in open interest throughout the process indicate that investors are acting aggressively. In conclusion, the decline in reserves and the increase in open interest indicate that the market’s appetite has increased and is currently leaning toward an upward trend.
ETH Onchain Overall
| Metric | Positive 📈 | Positive 📉 | Neutral ➖ |
|---|---|---|---|
| Active Addresses | ✓ | ||
| Total Value Staked | ✓ | ||
| Derivatives | ✓ | ||
| Supply Distribution | ✓ | ||
| Exchange Supply Ratio | ✓ | ||
| Fees and Revenues | ✓ | ||
| Blocks Mined | ✓ | ||
| Transactions | ✓ | ||
| Estimated Leverage Ratio | ✓ |
The metrics and guidance provided in the table do not alone explain or imply any future changes in the price of any asset. The prices of digital assets can vary based on numerous factors. The on-chain analysis and related guidance provided are intended to assist investors in their decision-making process and should not be relied upon as the sole basis for financial investment decisions. Relying solely on this analysis may result in unfavourable outcomes. Even if all metrics produce positive, negative, or neutral results simultaneously, the expected outcomes may not materialize due to market conditions. Investors reviewing this report are advised to take these warnings into consideration.
Legal Notice
The investment information, comments, and recommendations contained in this document do not constitute investment advisory services. Investment advisory services are provided by authorized institutions on a personal basis, taking into account the risk and return preferences of individuals. The comments and recommendations contained in this document are of a general nature. These recommendations may not be suitable for your financial situation and risk and return preferences. Therefore, making an investment decision based solely on the information contained in this document may not result in outcomes that align with your expectations.
NOTE: All data used in Ethereum onchain analysis is based on Cryptoqaunt.


