
Informe semanal sobre Ethereum Onchain
Direcciones activas
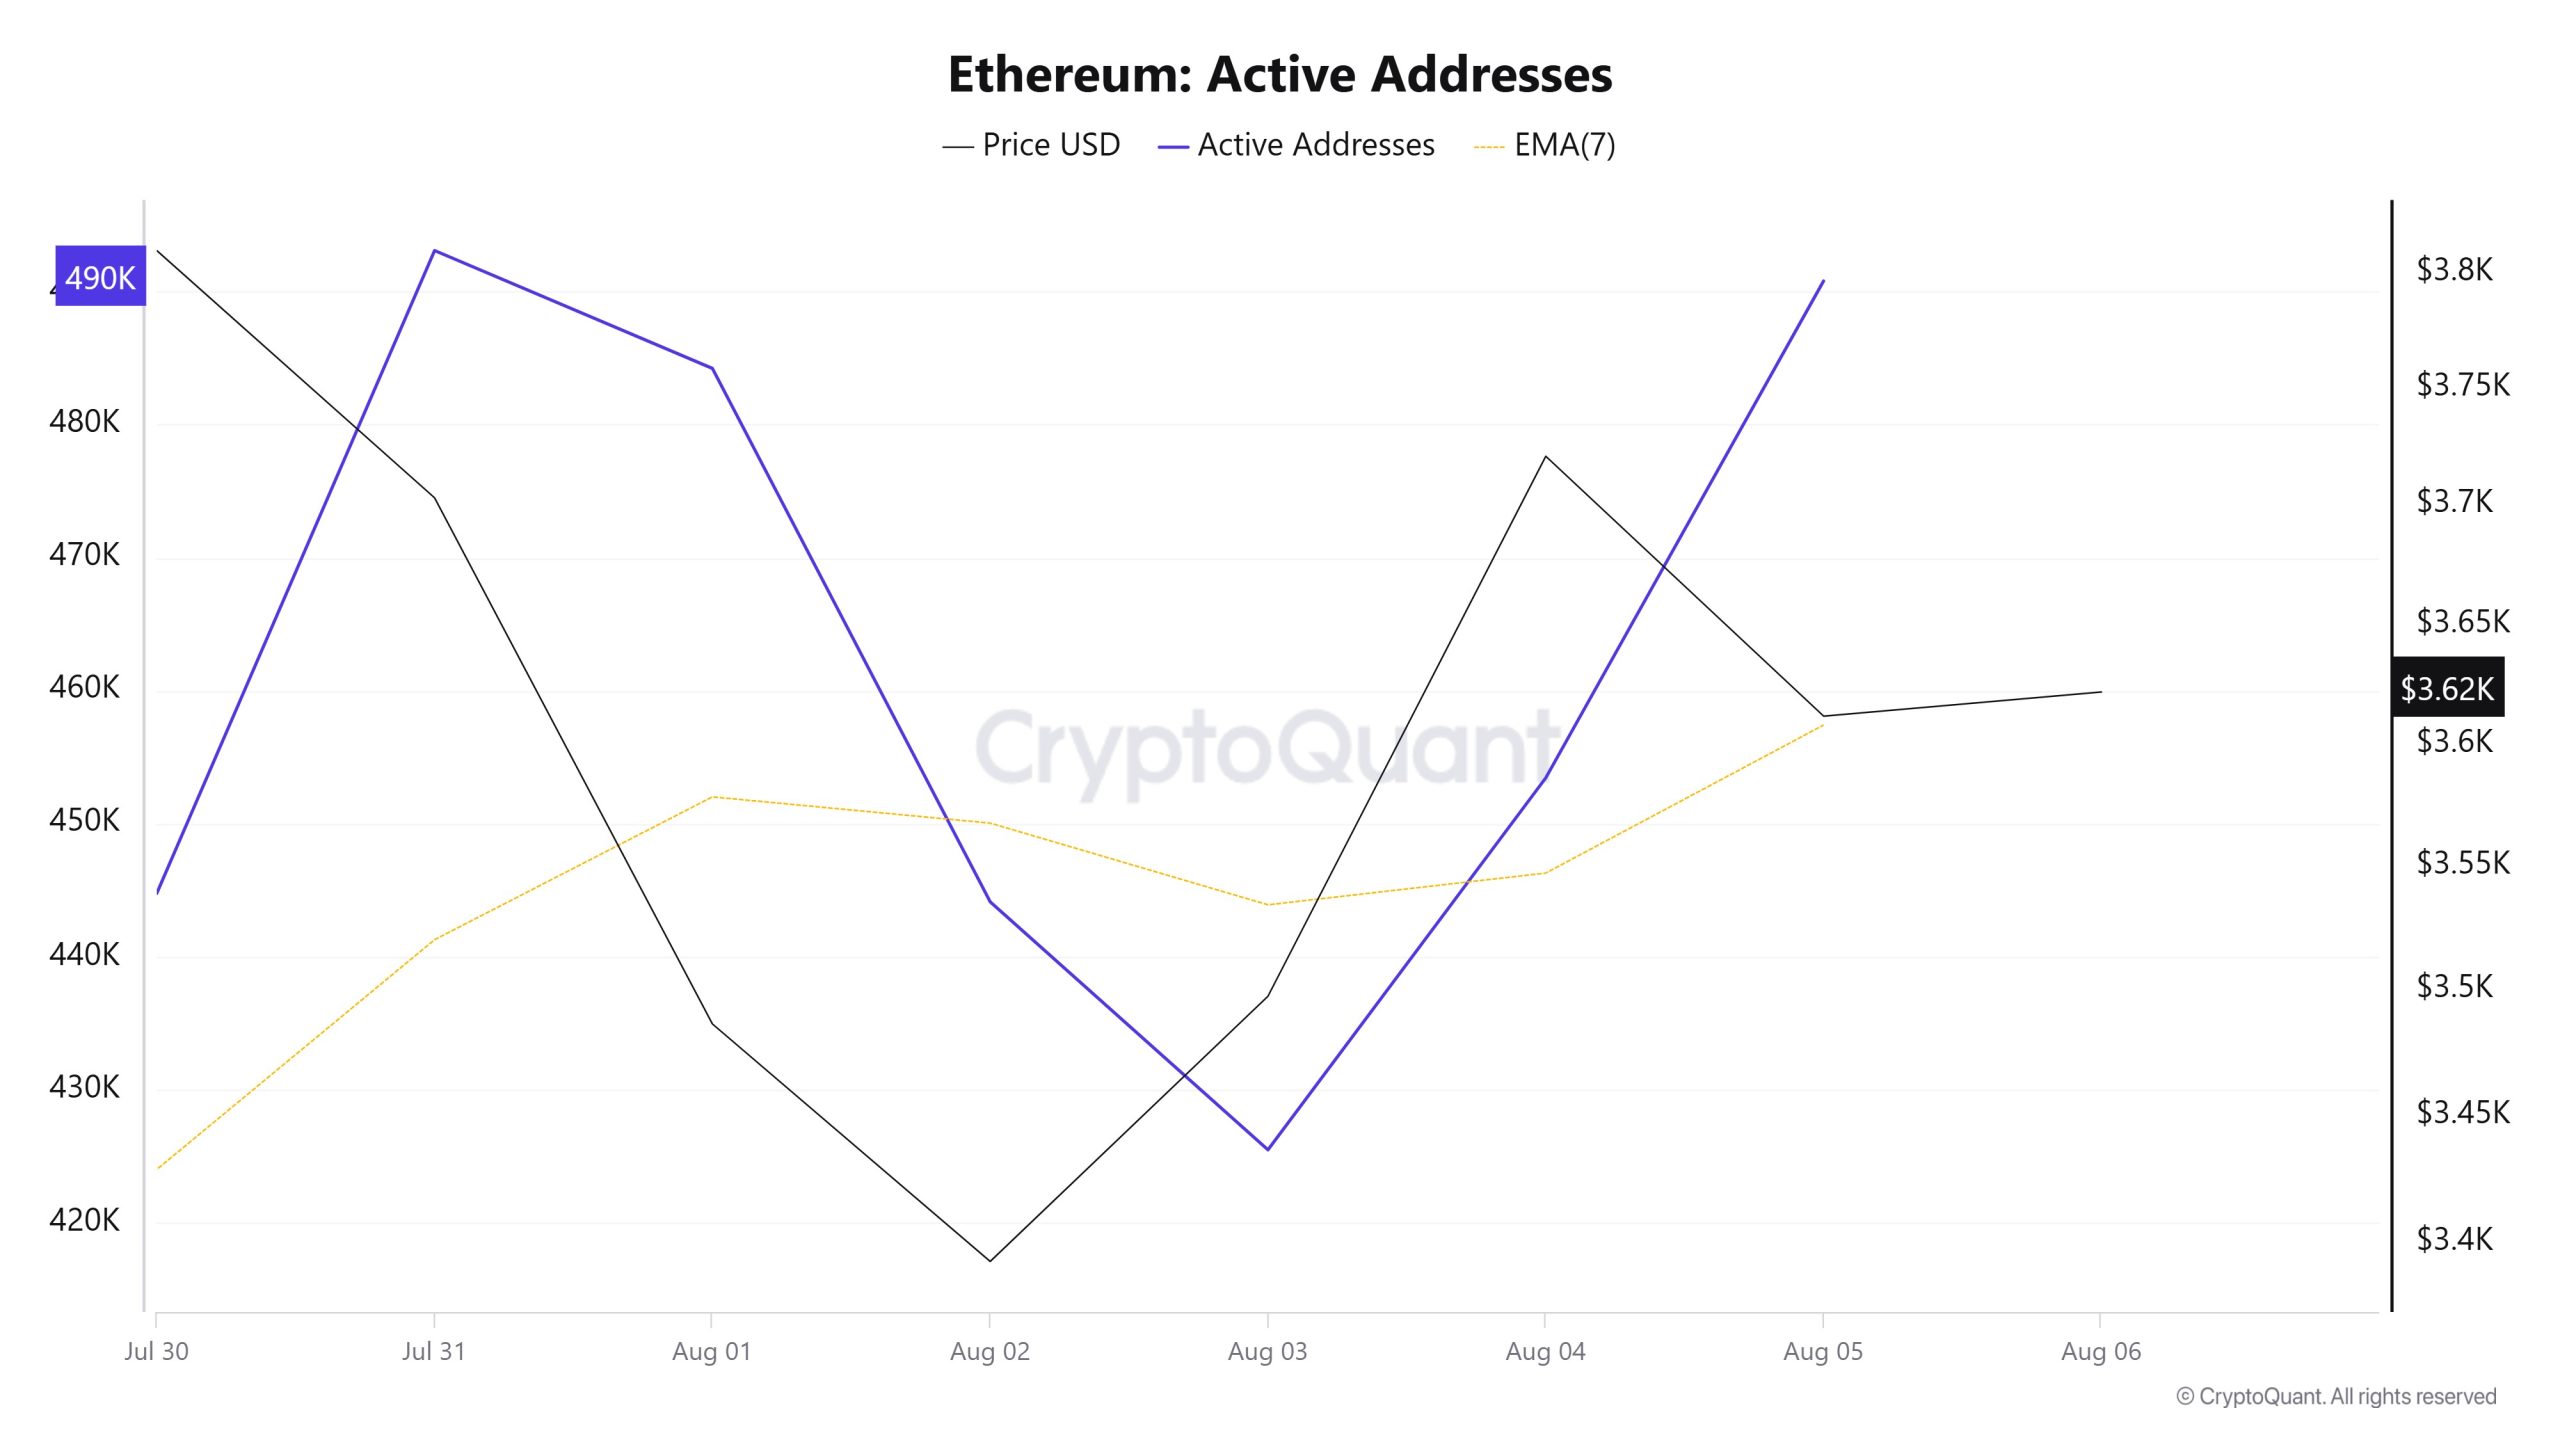
Between Julio 30 and Agosto 6, a total of 493,077 active addresses entered the Ethereum network. During this period, the Ethereum price rose from $3,497 to $3,703. Especially on Julio 31, at the intersection of the price and the number of active addresses, there was a significant decrease in the number of active addresses while the price continued to rise. This suggests that despite the price increase in the following days, short-term participation decreased and was probably dominated by trades among existing investors. When the 7-day simple moving average (SMA) is analyzed, it is seen that a general upward trend is dominant in the Ethereum price.
Direcciones de envío activas
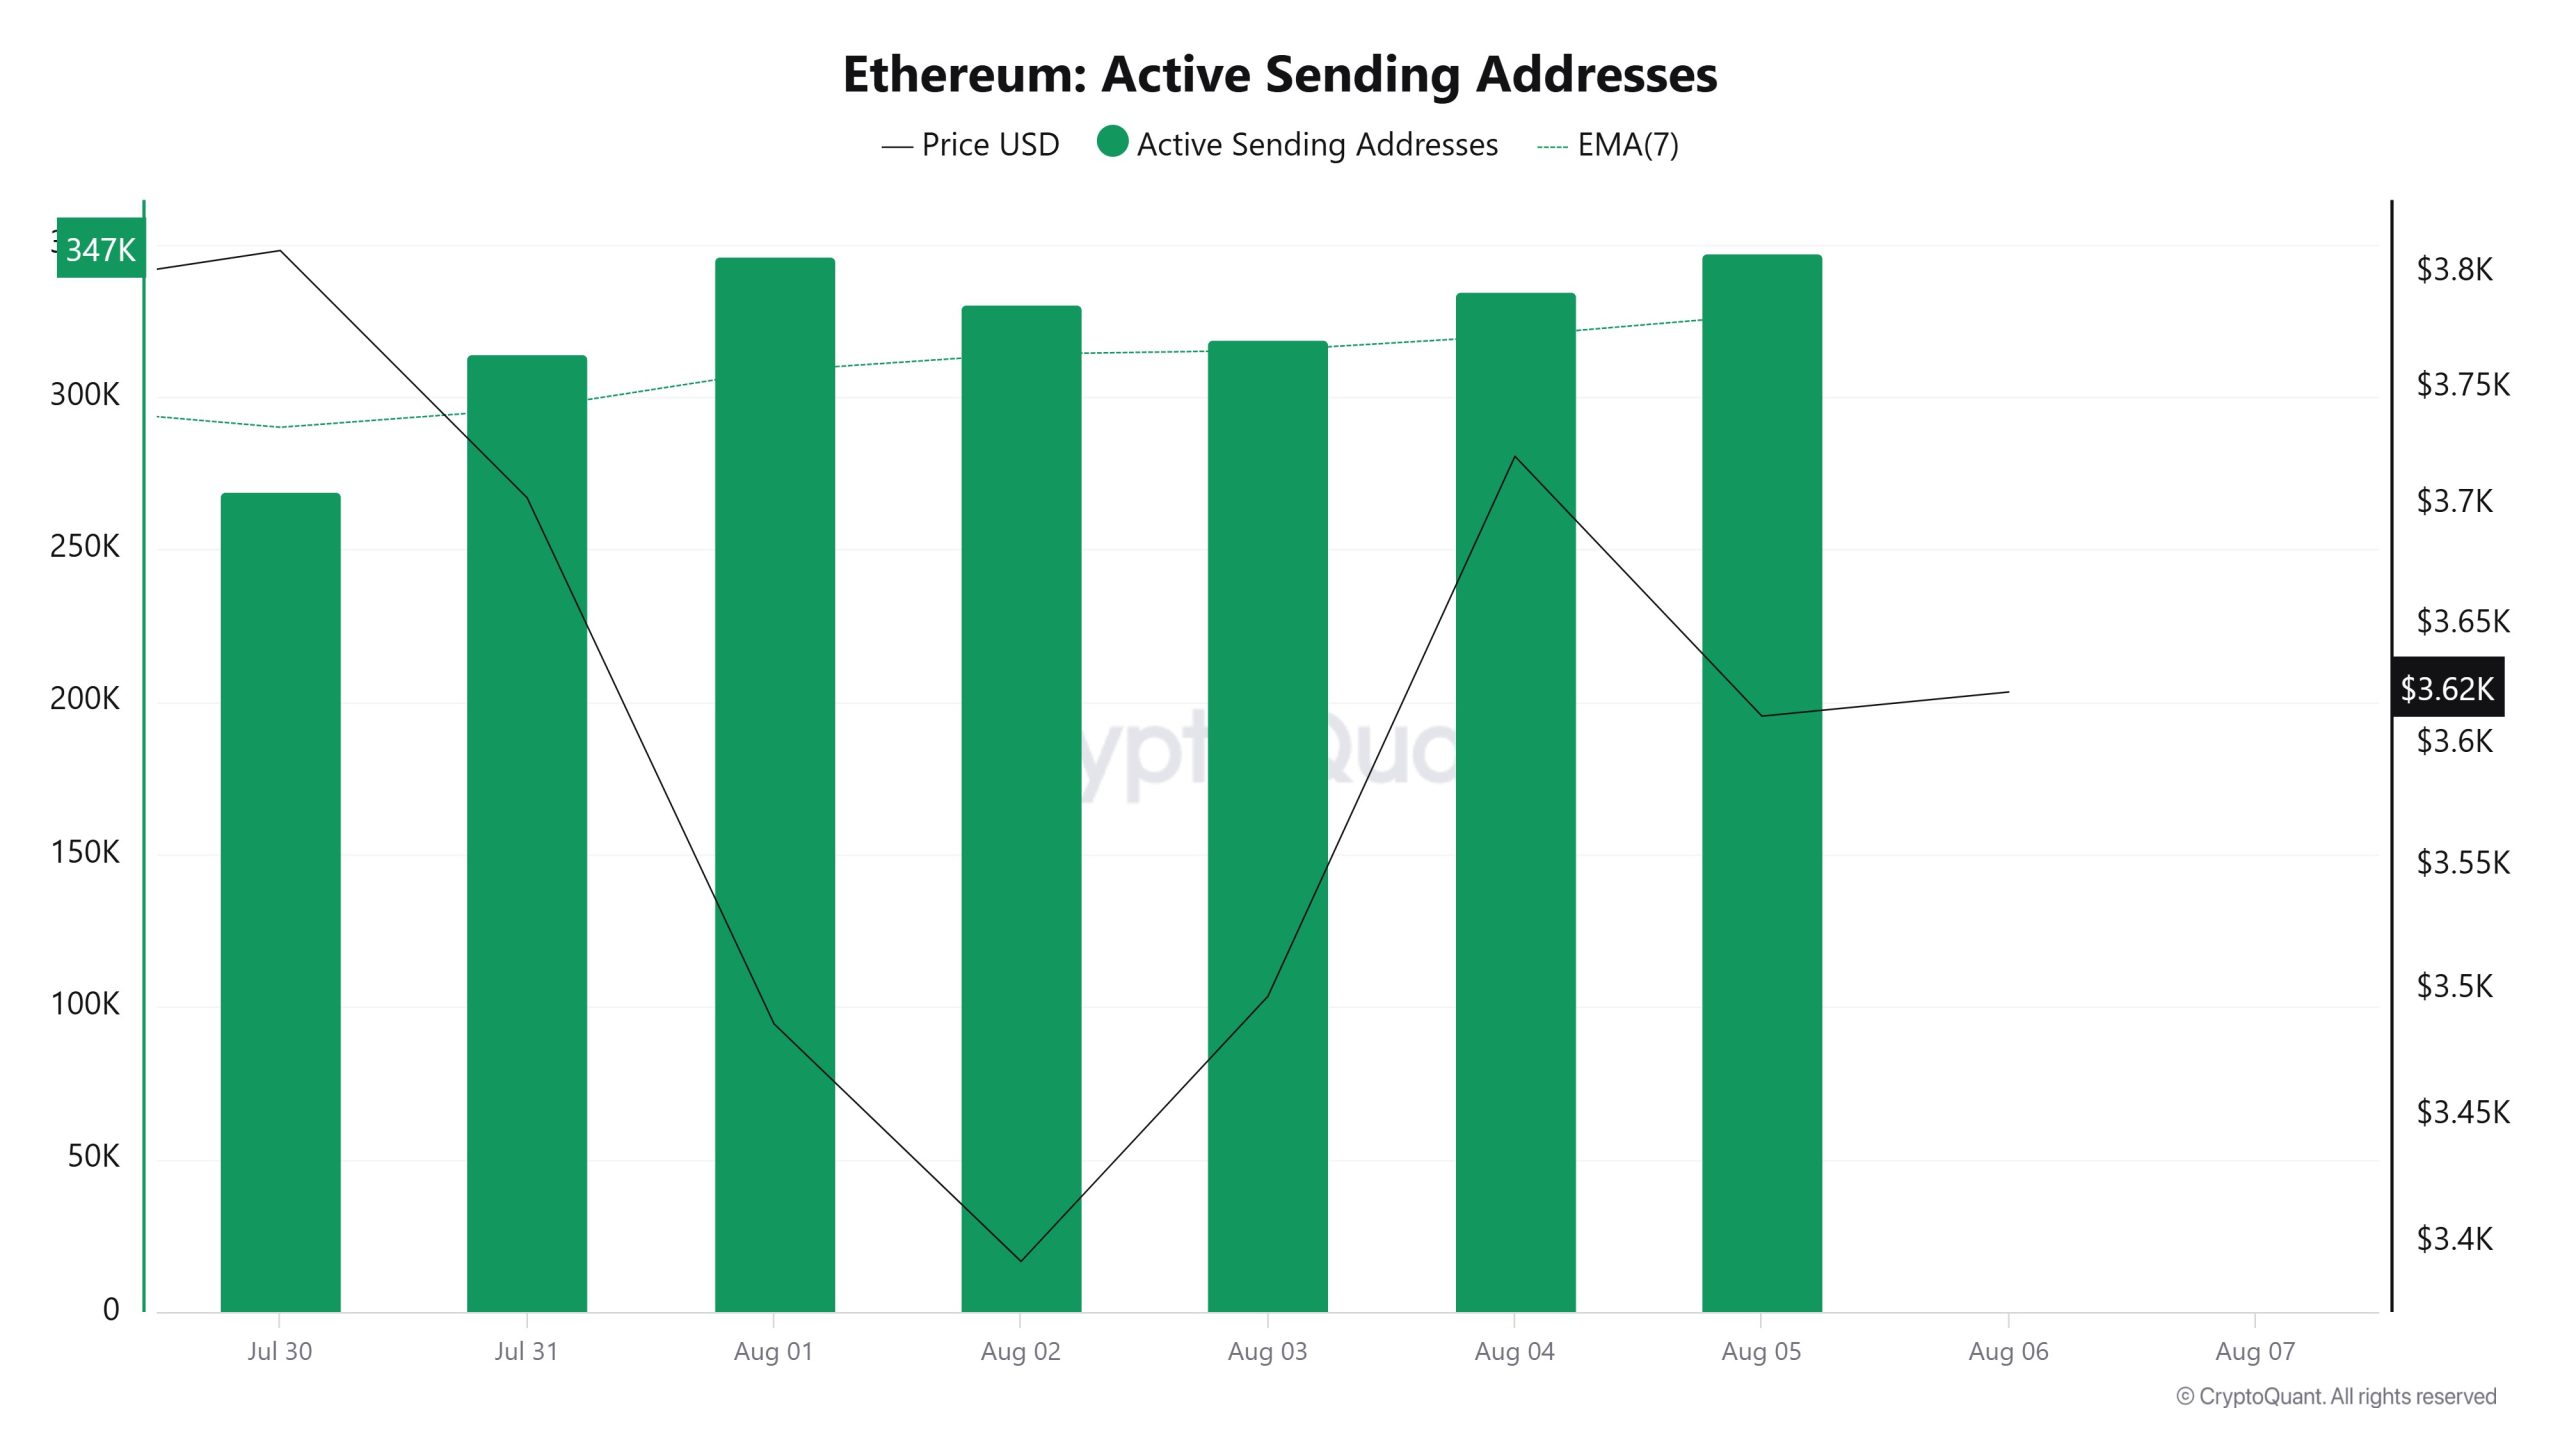
Between Julio 30th and Agosto 6th, there was an upward movement in active shipping addresses with the Black Line (price line). On the same day that the price reached a weekly high, active sending addresses rose to 346,230.
Direcciones receptoras activas
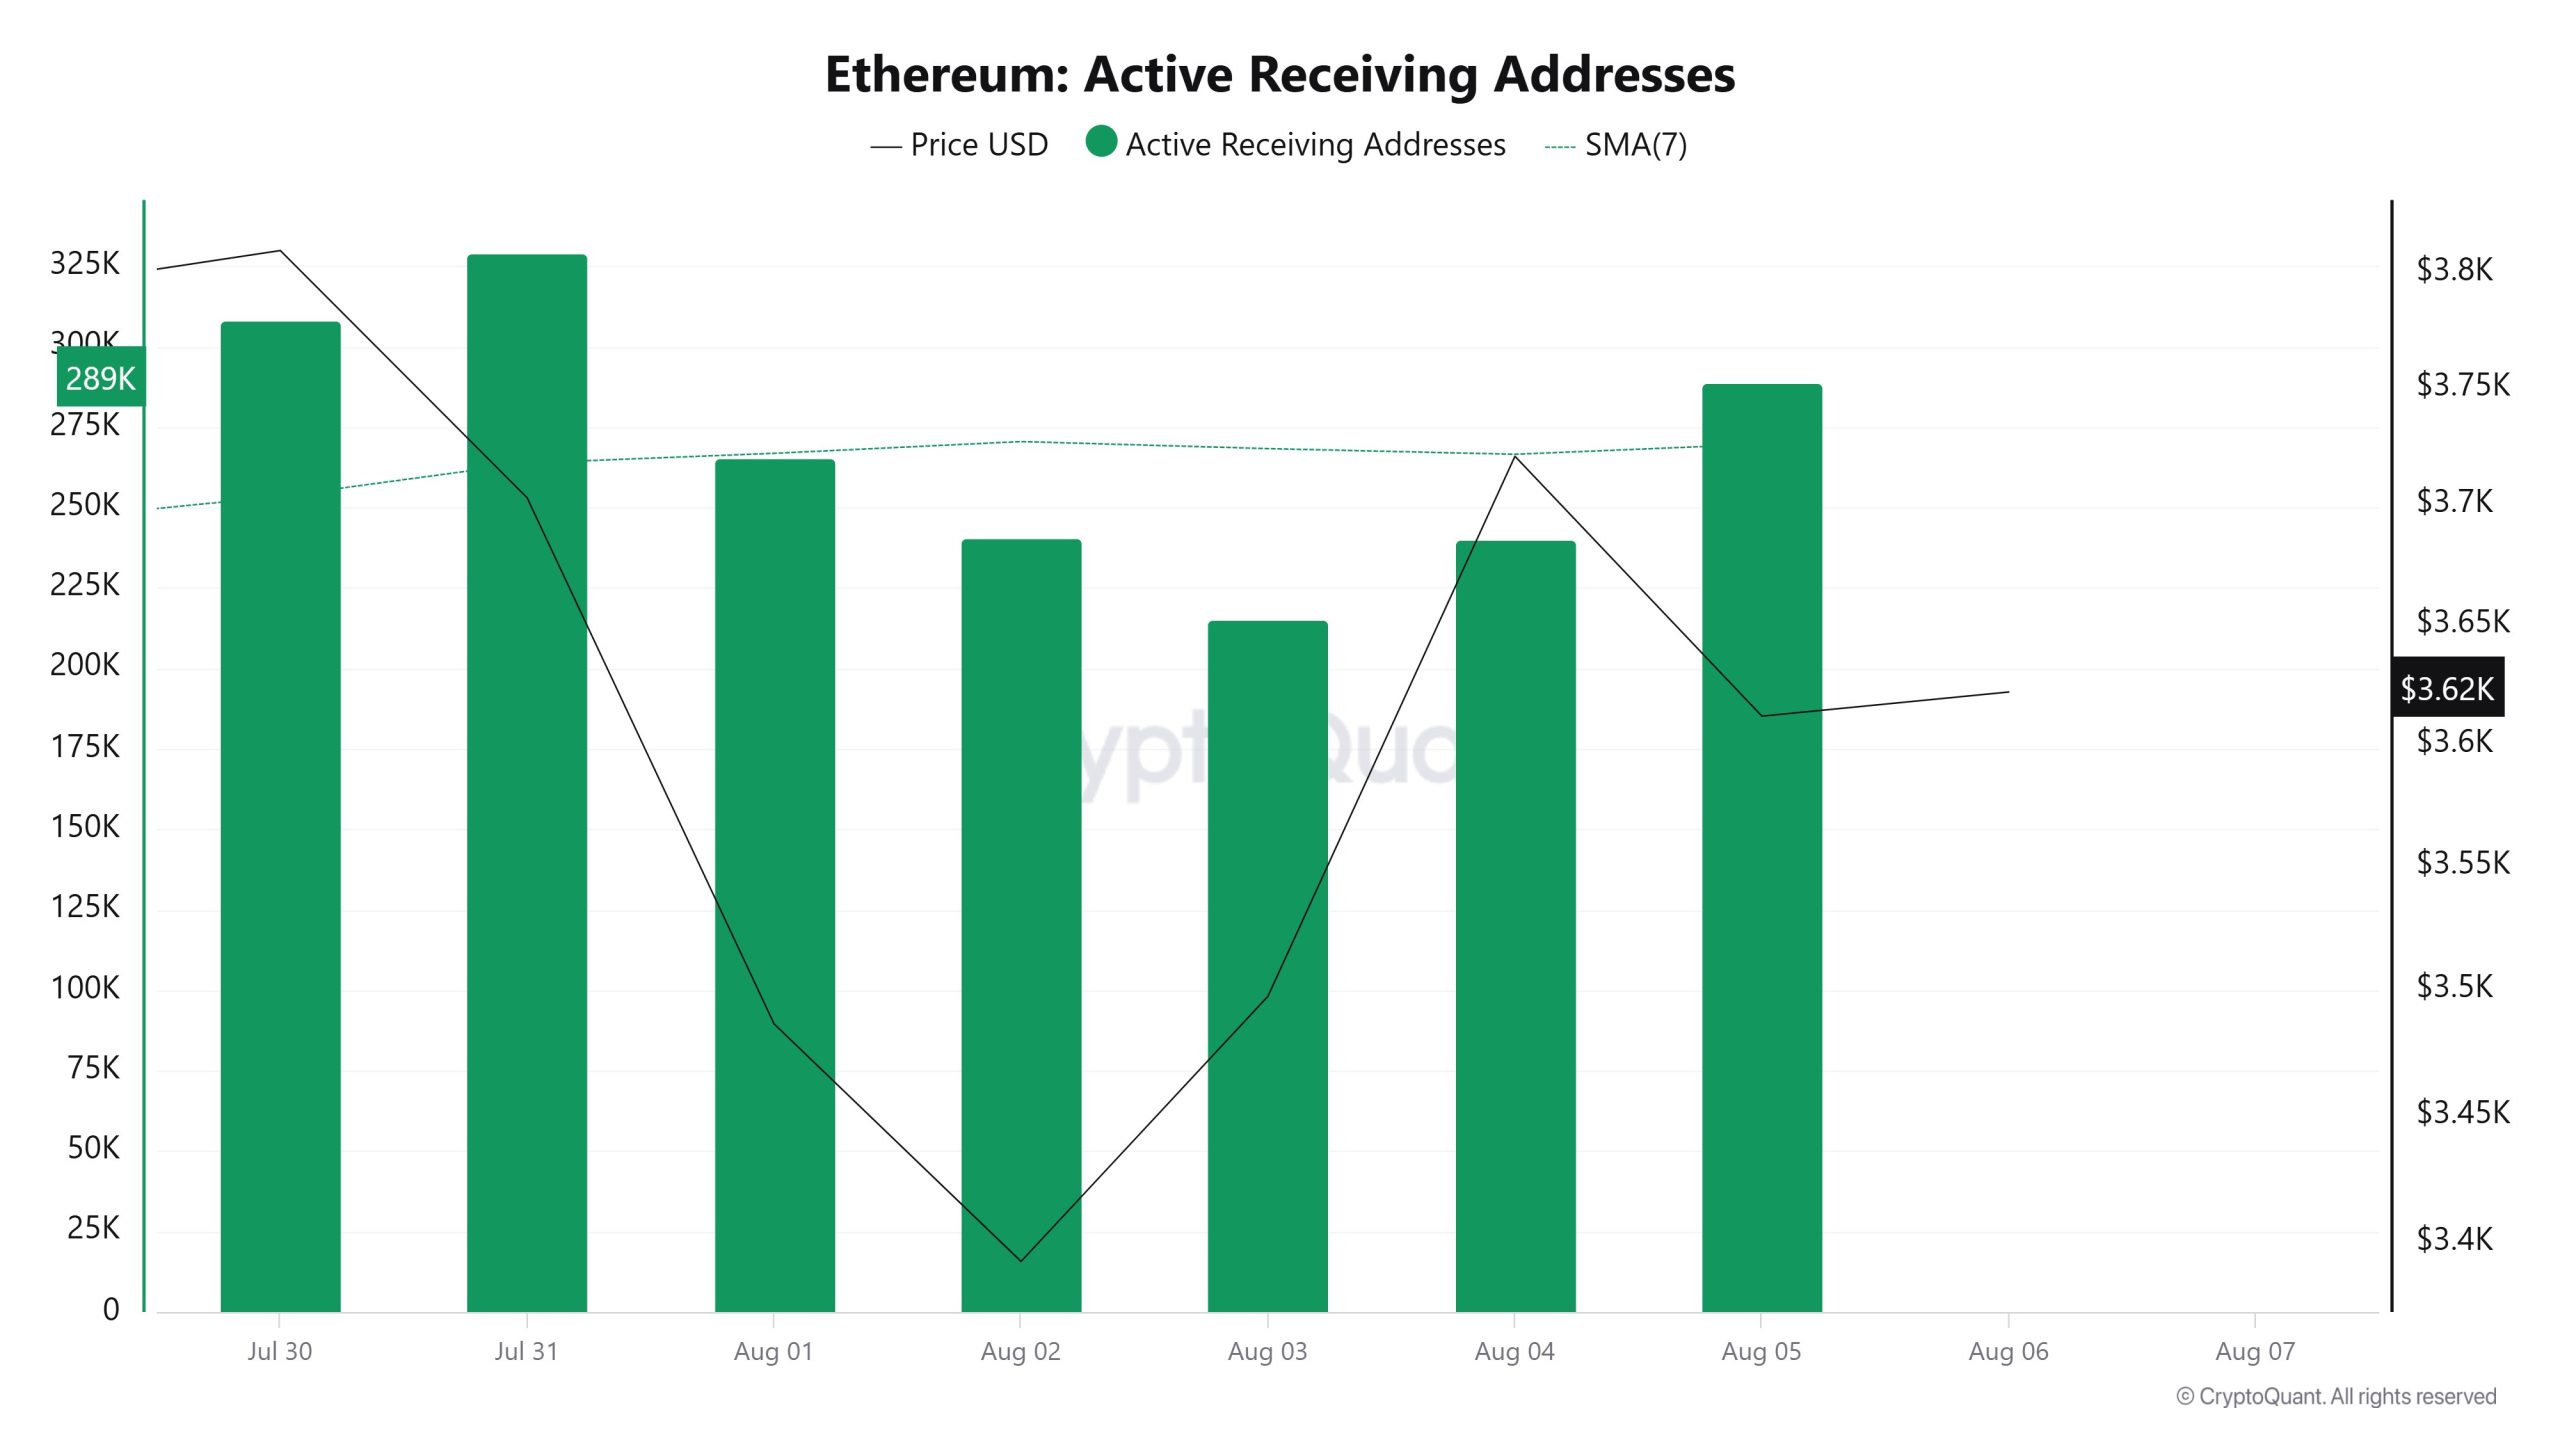
Between Julio 30 and Agosto 6, there was an upward consolidation in active buying addresses and a parallel upward consolidation in the price. On the day of the price high, active receiving addresses dropped to 229,093, indicating that buying is slowing down.
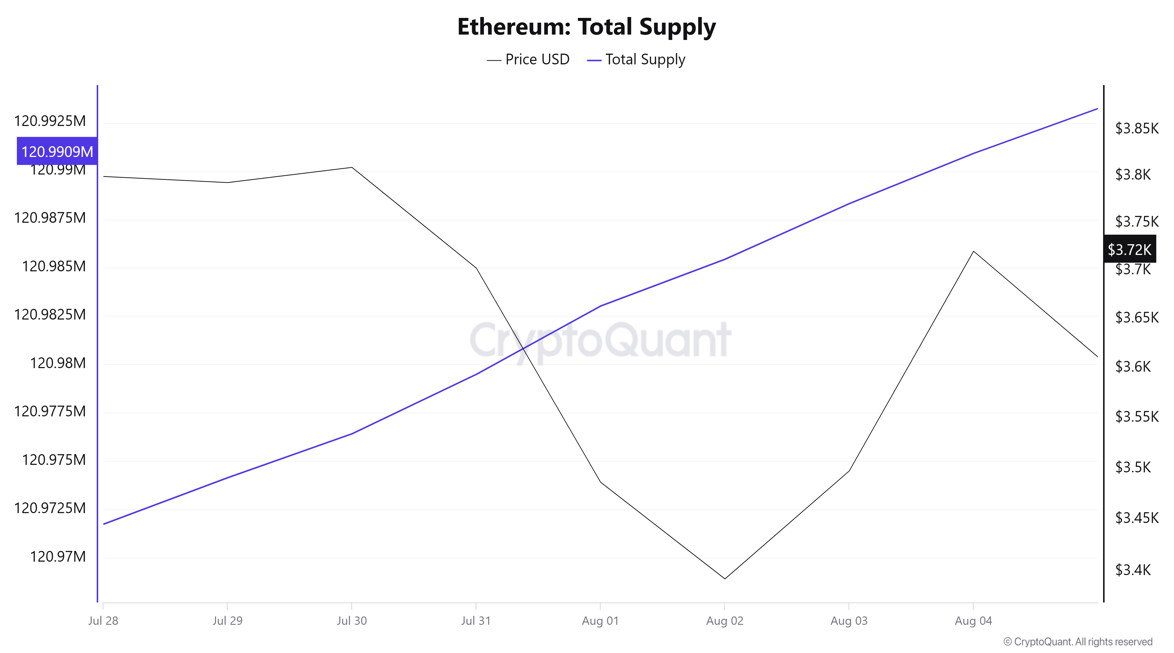
Valor total apostado
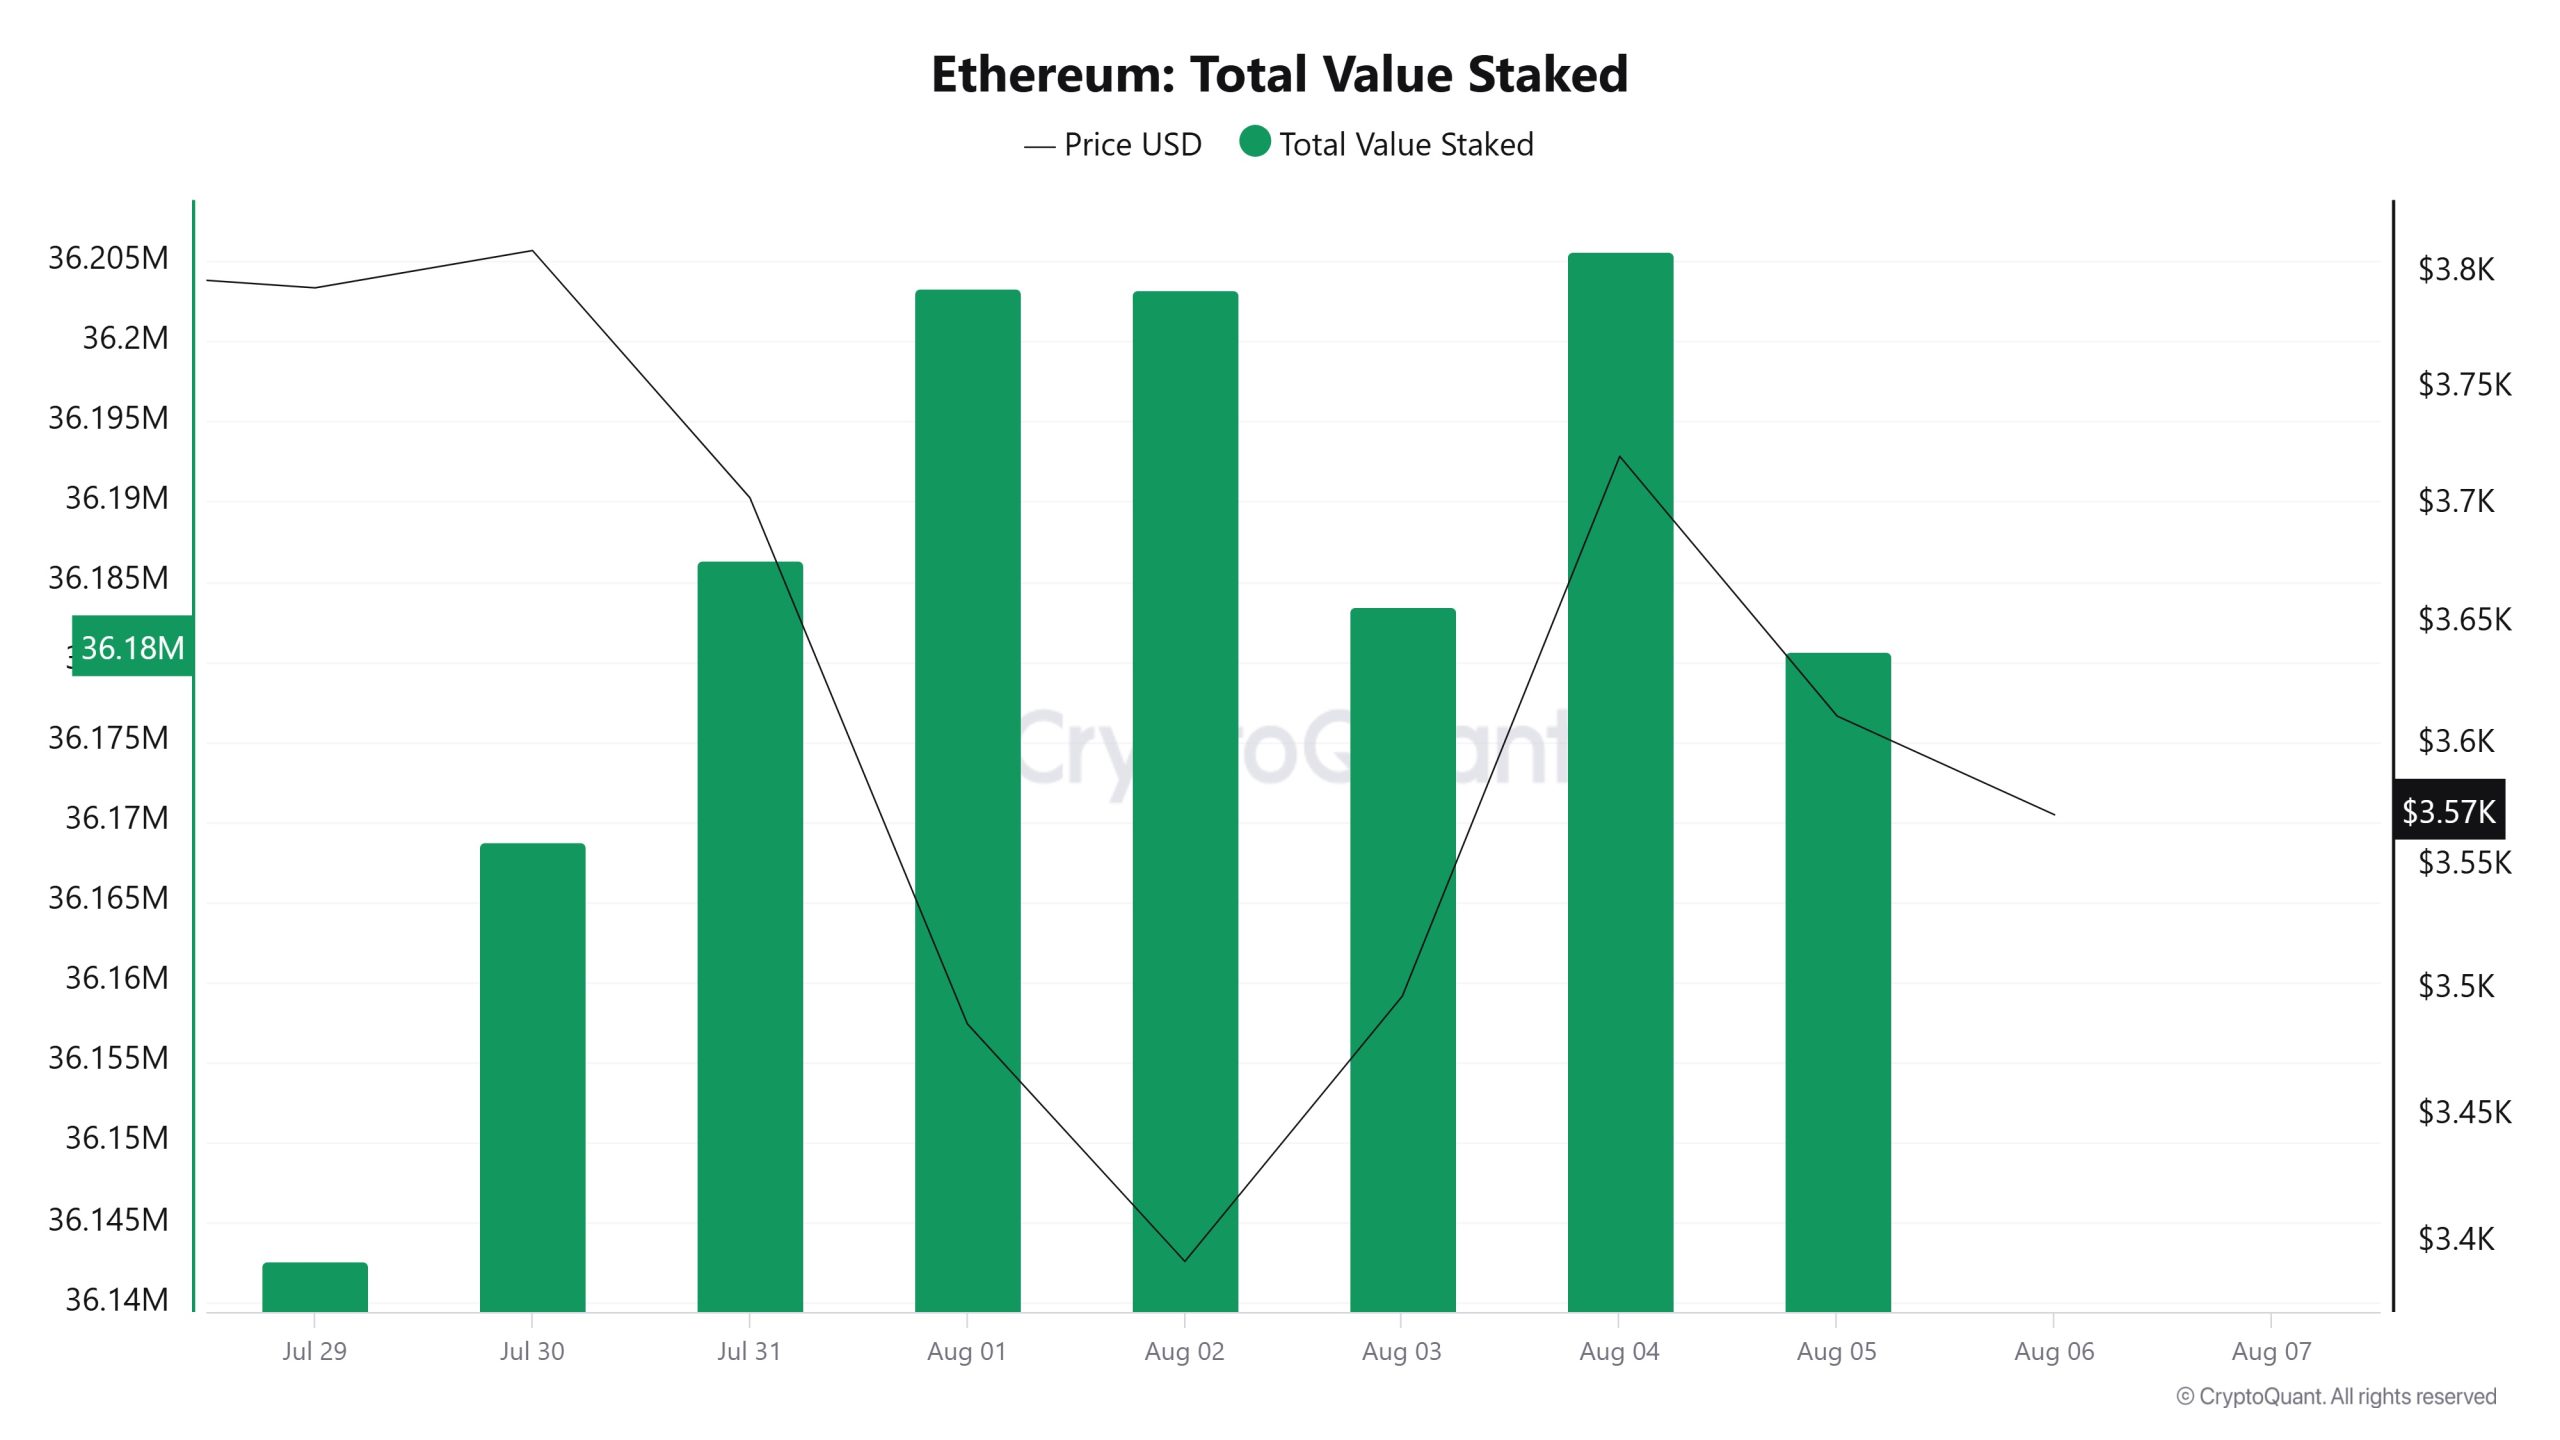
On Julio 30th, ETH price was 3.809 while Total Value Staked was 36.168.745. As of Agosto 5, ETH price fell to 3,611, a decrease of 5.20%, while Total Value Staked rose to 36,180,645, an increase of 0.03%.
Staking Inflows
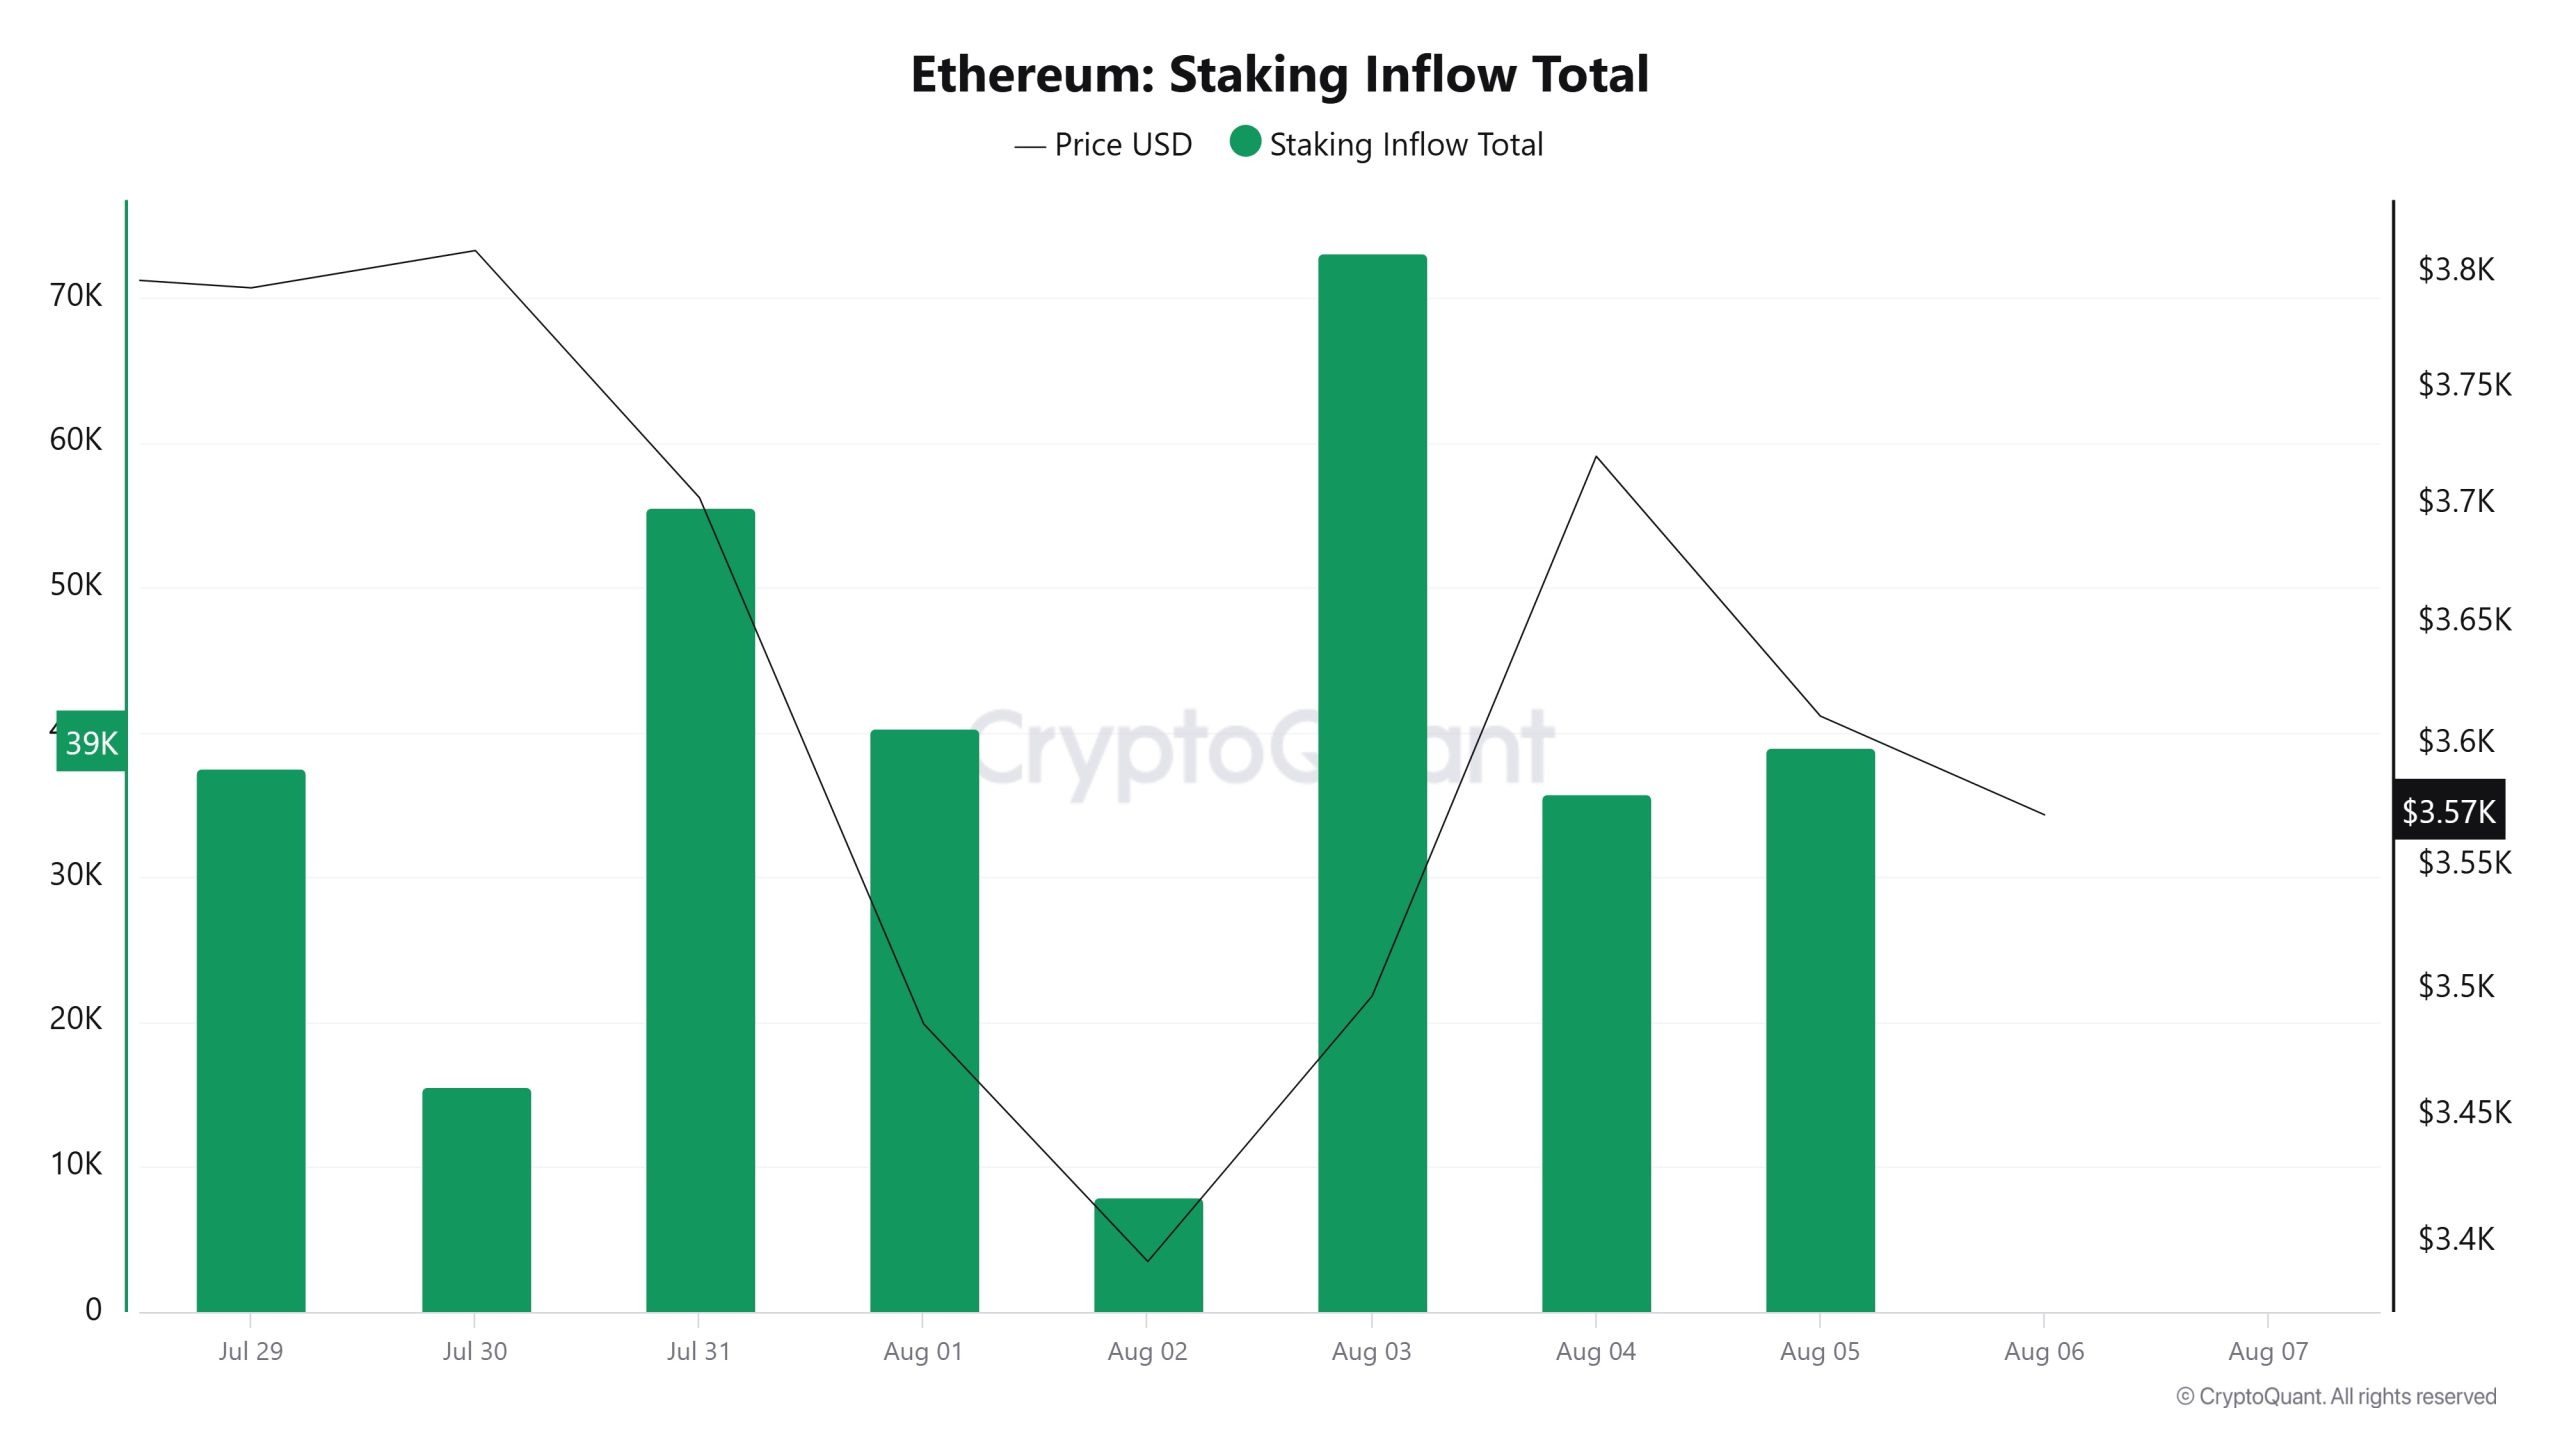
On Julio 30th, ETH price was at 3,809, while Staking Inflow was at 15,532. As of Agosto 5, ETH price fell to 3,611, a decrease of 5.20%, while Staking Inflow rose to 39,030, an increase of 151.38%.
Derivados
Interés abierto
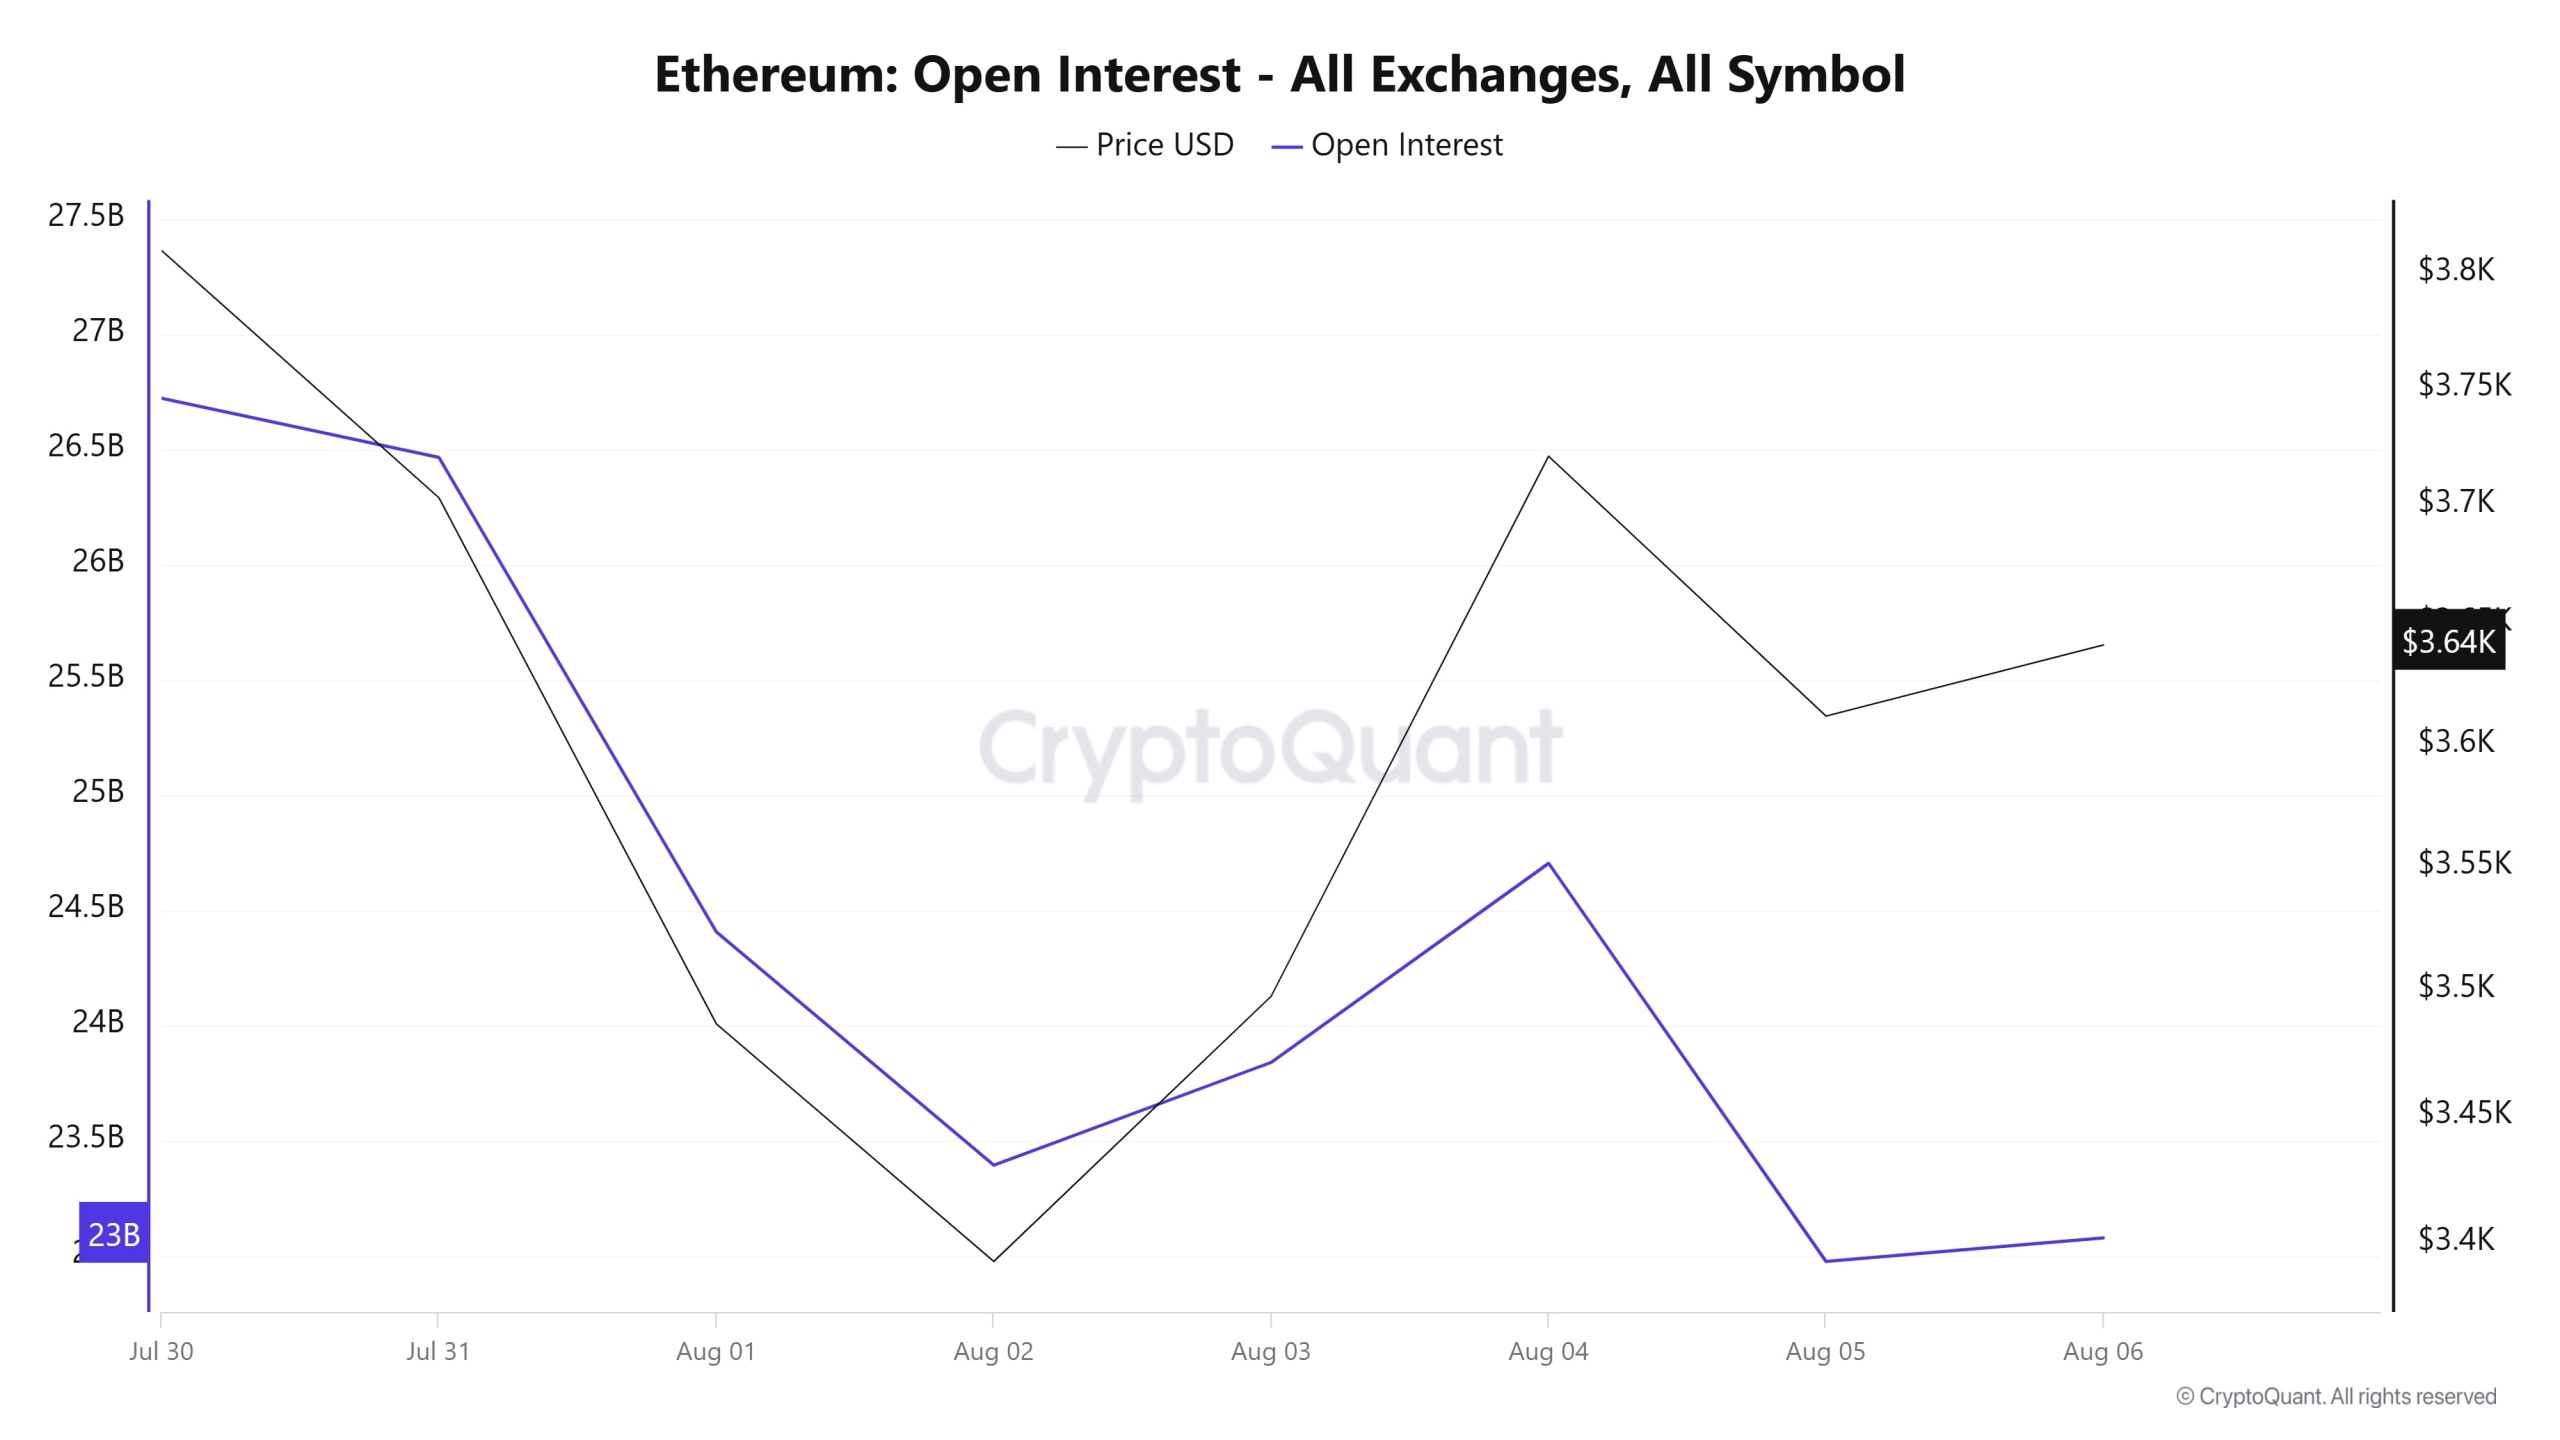
Open positions, which were around $26.7 billion at the end of Julio, fell sharply to $23 billion in the first days of Agosto. In the same period, the price fell similarly, suggesting a general retreat or cautious behavior in the market. On Agosto 2, after both price and open interest hit their lows, a recovery began. On Agosto 3 and 4, the rise in the price is more prominent, while open interest accompanies it, but with a more limited momentum. As of Agosto 5, open interest starts to decline again and settles at a flat level. Price similarly retreated sharply on that day, before recovering slightly on Agosto 6. Overall, this chart shows that in the short term, both investor interest and price movements are fluctuating, and the market remains indecisive and cautious. Since open positions could not increase permanently during this period, it is understood that there is no expectation of a strong direction in the market.
3.2. Funding Rate
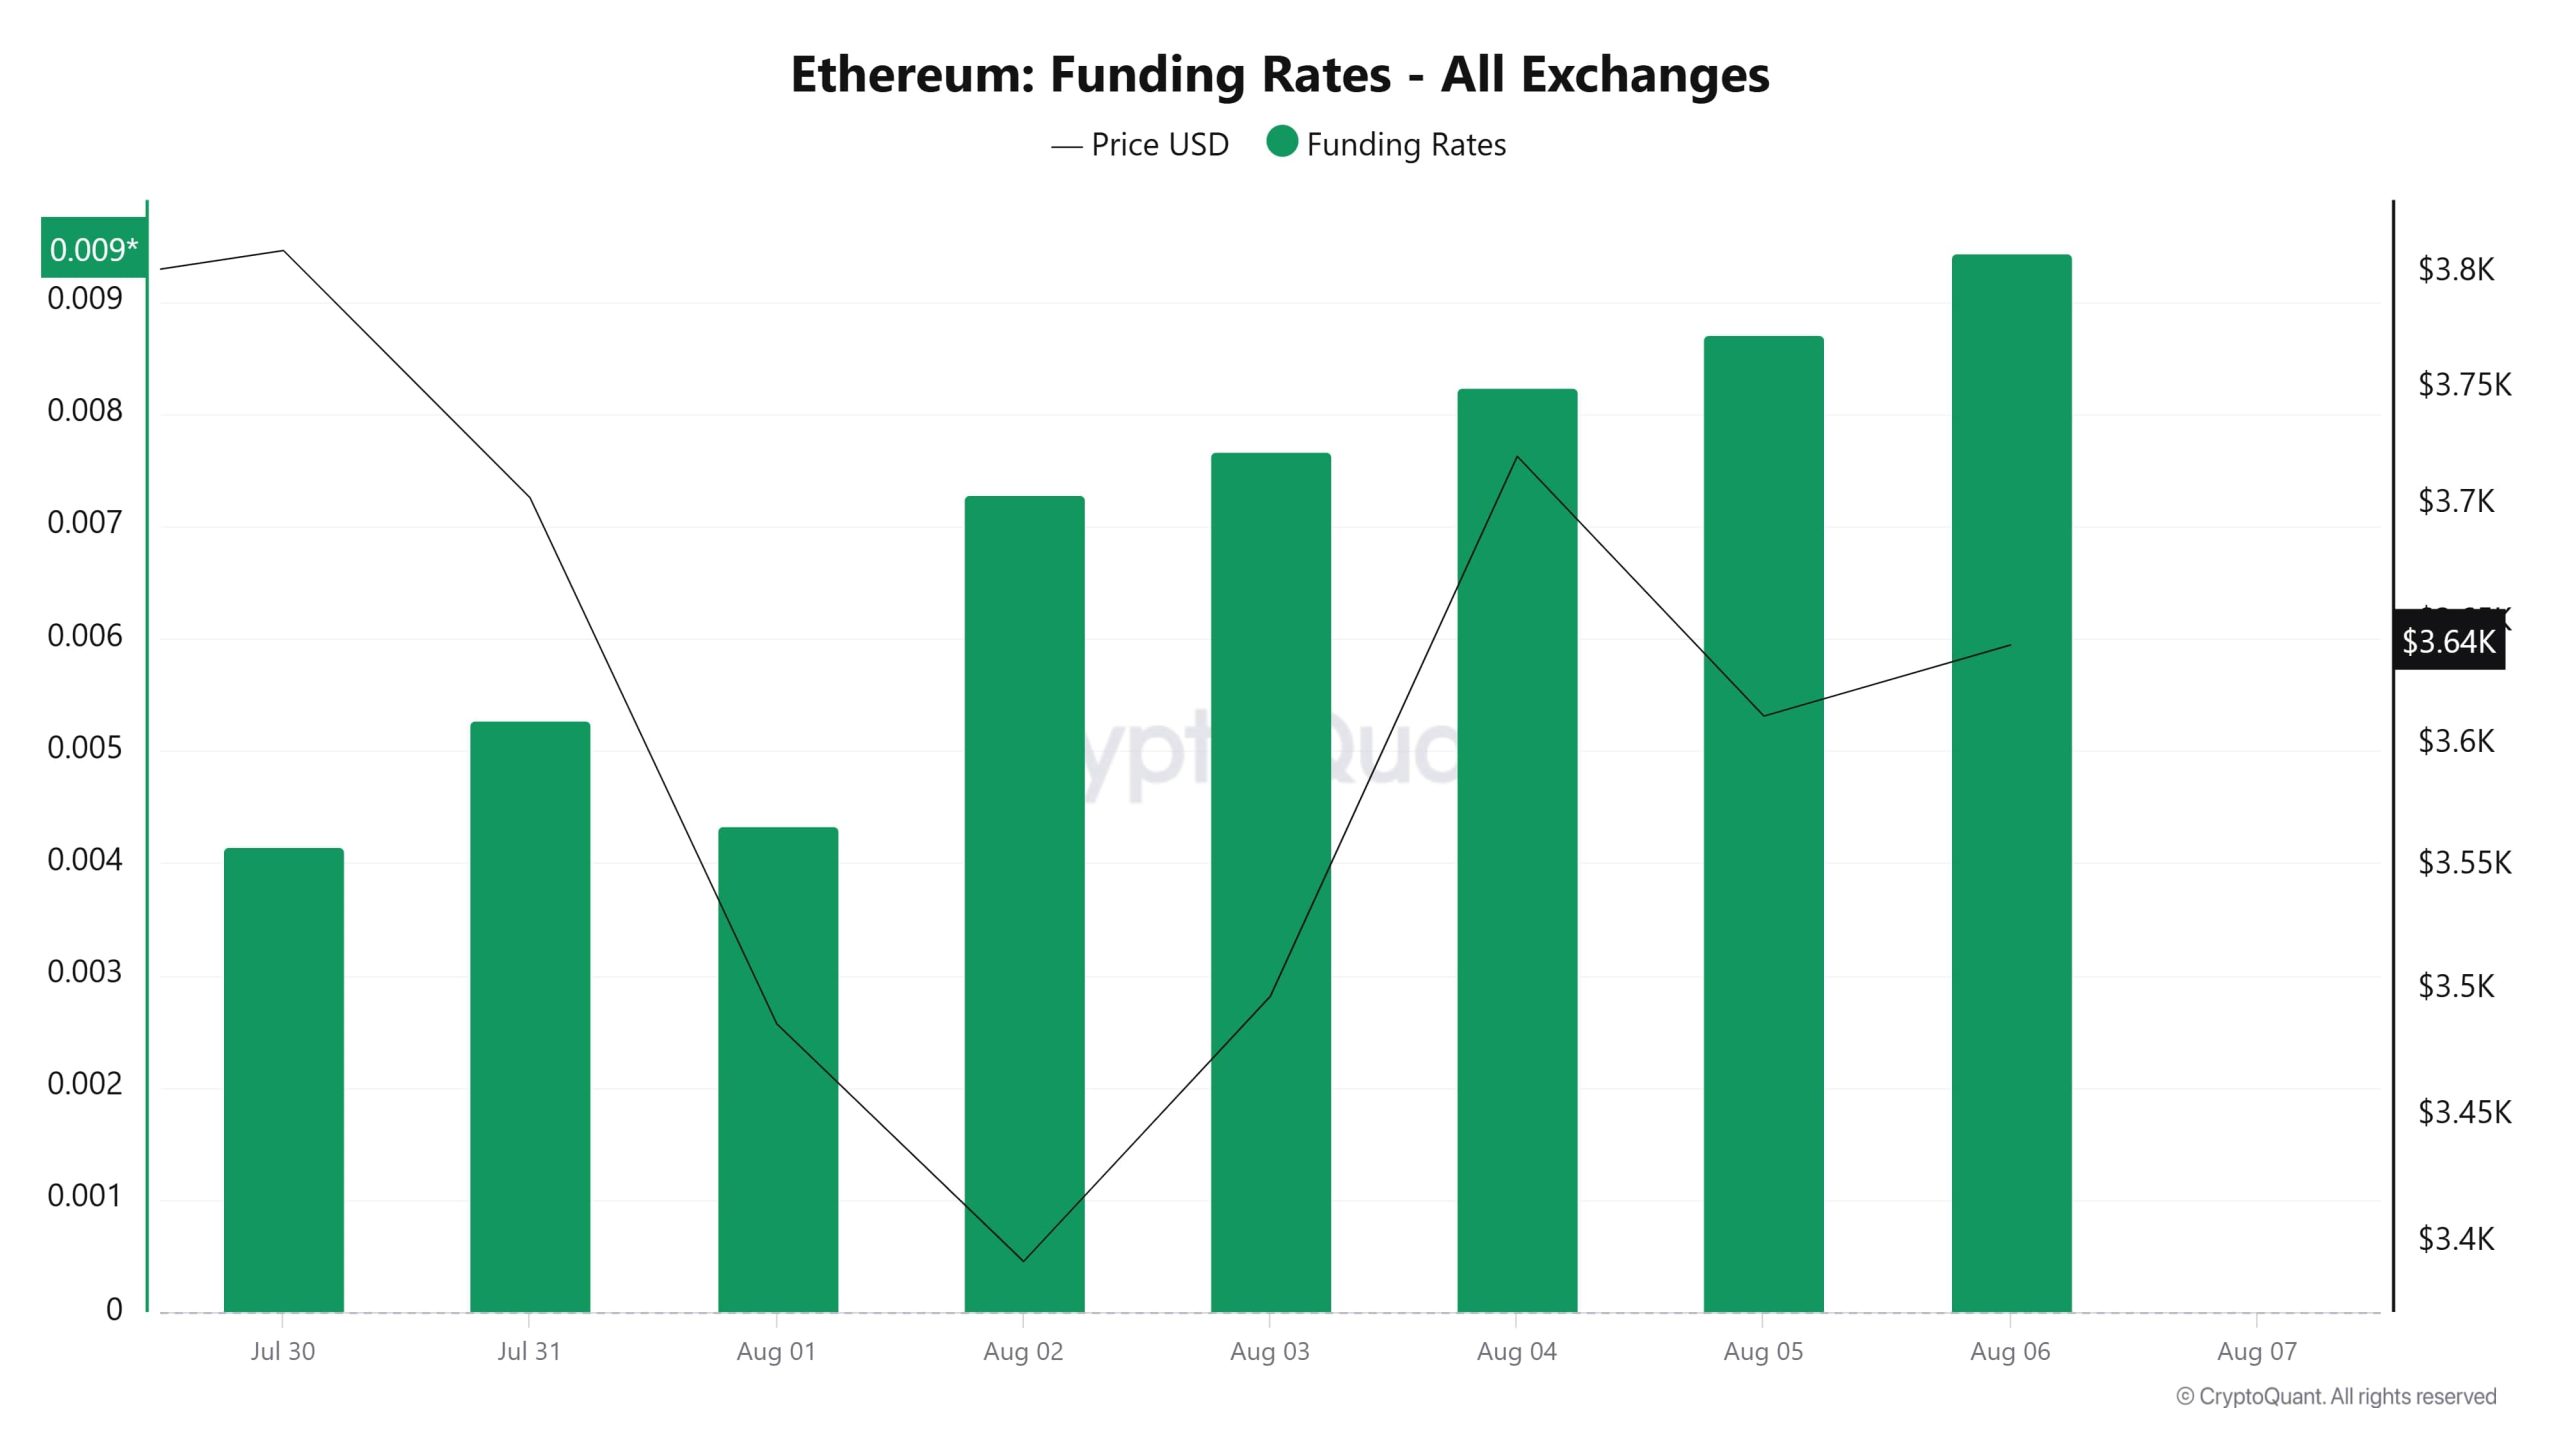
Looking at the chart in general, Ethereum’s funding rates have been on an upward trend since Agosto 2. Rates, which were at lower levels before this date, suddenly moved upwards and reached their highest level as of Agosto 6. This shows that long positions are gaining weight in the market and investors are expecting the price to rise. But interestingly, the price movement is not as strong as the funding rate. Although the price declined significantly from the end of Julio to Agosto 2, the funding rate started to increase from Agosto 2, meaning that investors continued to open long positions despite the decline. After Agosto 4, the price rebounded somewhat, but not in line with the aggressive rise in the funding rate. This suggests that the market may be too optimistic. Although the funding rate is high, the fact that the price does not fully support this may indicate that caution should be exercised in the short term.
Liquidaciones largas y cortas
With the ETH price falling to $3,354, approximately $1.1 billion worth of long positions were liquidated. During the same period, a short position of 359 million dollars was liquidated.
| Fecha | Largo Importe (Millones $) | Corto Importe (Millones $) |
|---|---|---|
| Julio 30 | 114.50 | 40.11 |
| Julio 31 | 94.30 | 30.89 |
| Agosto 01 | 373.88 | 40.97 |
| Agosto 02 | 152.93 | 31.68 |
| Agosto 03 | 28.93 | 57.00 |
| Agosto 04 | 17.15 | 115.86 |
| Agosto 05 | 337.88 | 42.91 |
| Total | 1119.57 | 359.42 |
Distribución de suministros
Total Supply: 120,993,223 units, up about 0.01775% from last week.
New Supply: The amount of ETH produced this week was 21,487.
Velocity: Velocity was 8.91 as of Agosto 4, up from 8.85 last week.
| Categoría de carteras | 28.07.2025 | 04.08.2025 | Cambio (%) |
|---|---|---|---|
| 100 - 1k ETH | 8.8642M | 8.7981M | -0.746% |
| 1k - 10k ETH | 12.6256M | 12.7372M | 0.884% |
| 10k - 100k ETH | 18.1479M | 18.4725M | 1.789% |
| 100k+ ETH | 4.3805M | 4.2244M | -3.564% |
According to the latest weekly data, Ethereum wallet distribution is mixed. While wallet balances in the 100 – 1k ETH range experienced a limited decrease of 0.746%, a moderate increase of 0.884% was recorded in the 1k – 10k ETH segment. In contrast, there was a notable increase of 1.789% in the 10k – 100k ETH range, while the 100k+ ETH category saw a significant decrease of 3.564%.
Exchange Supply Ratio
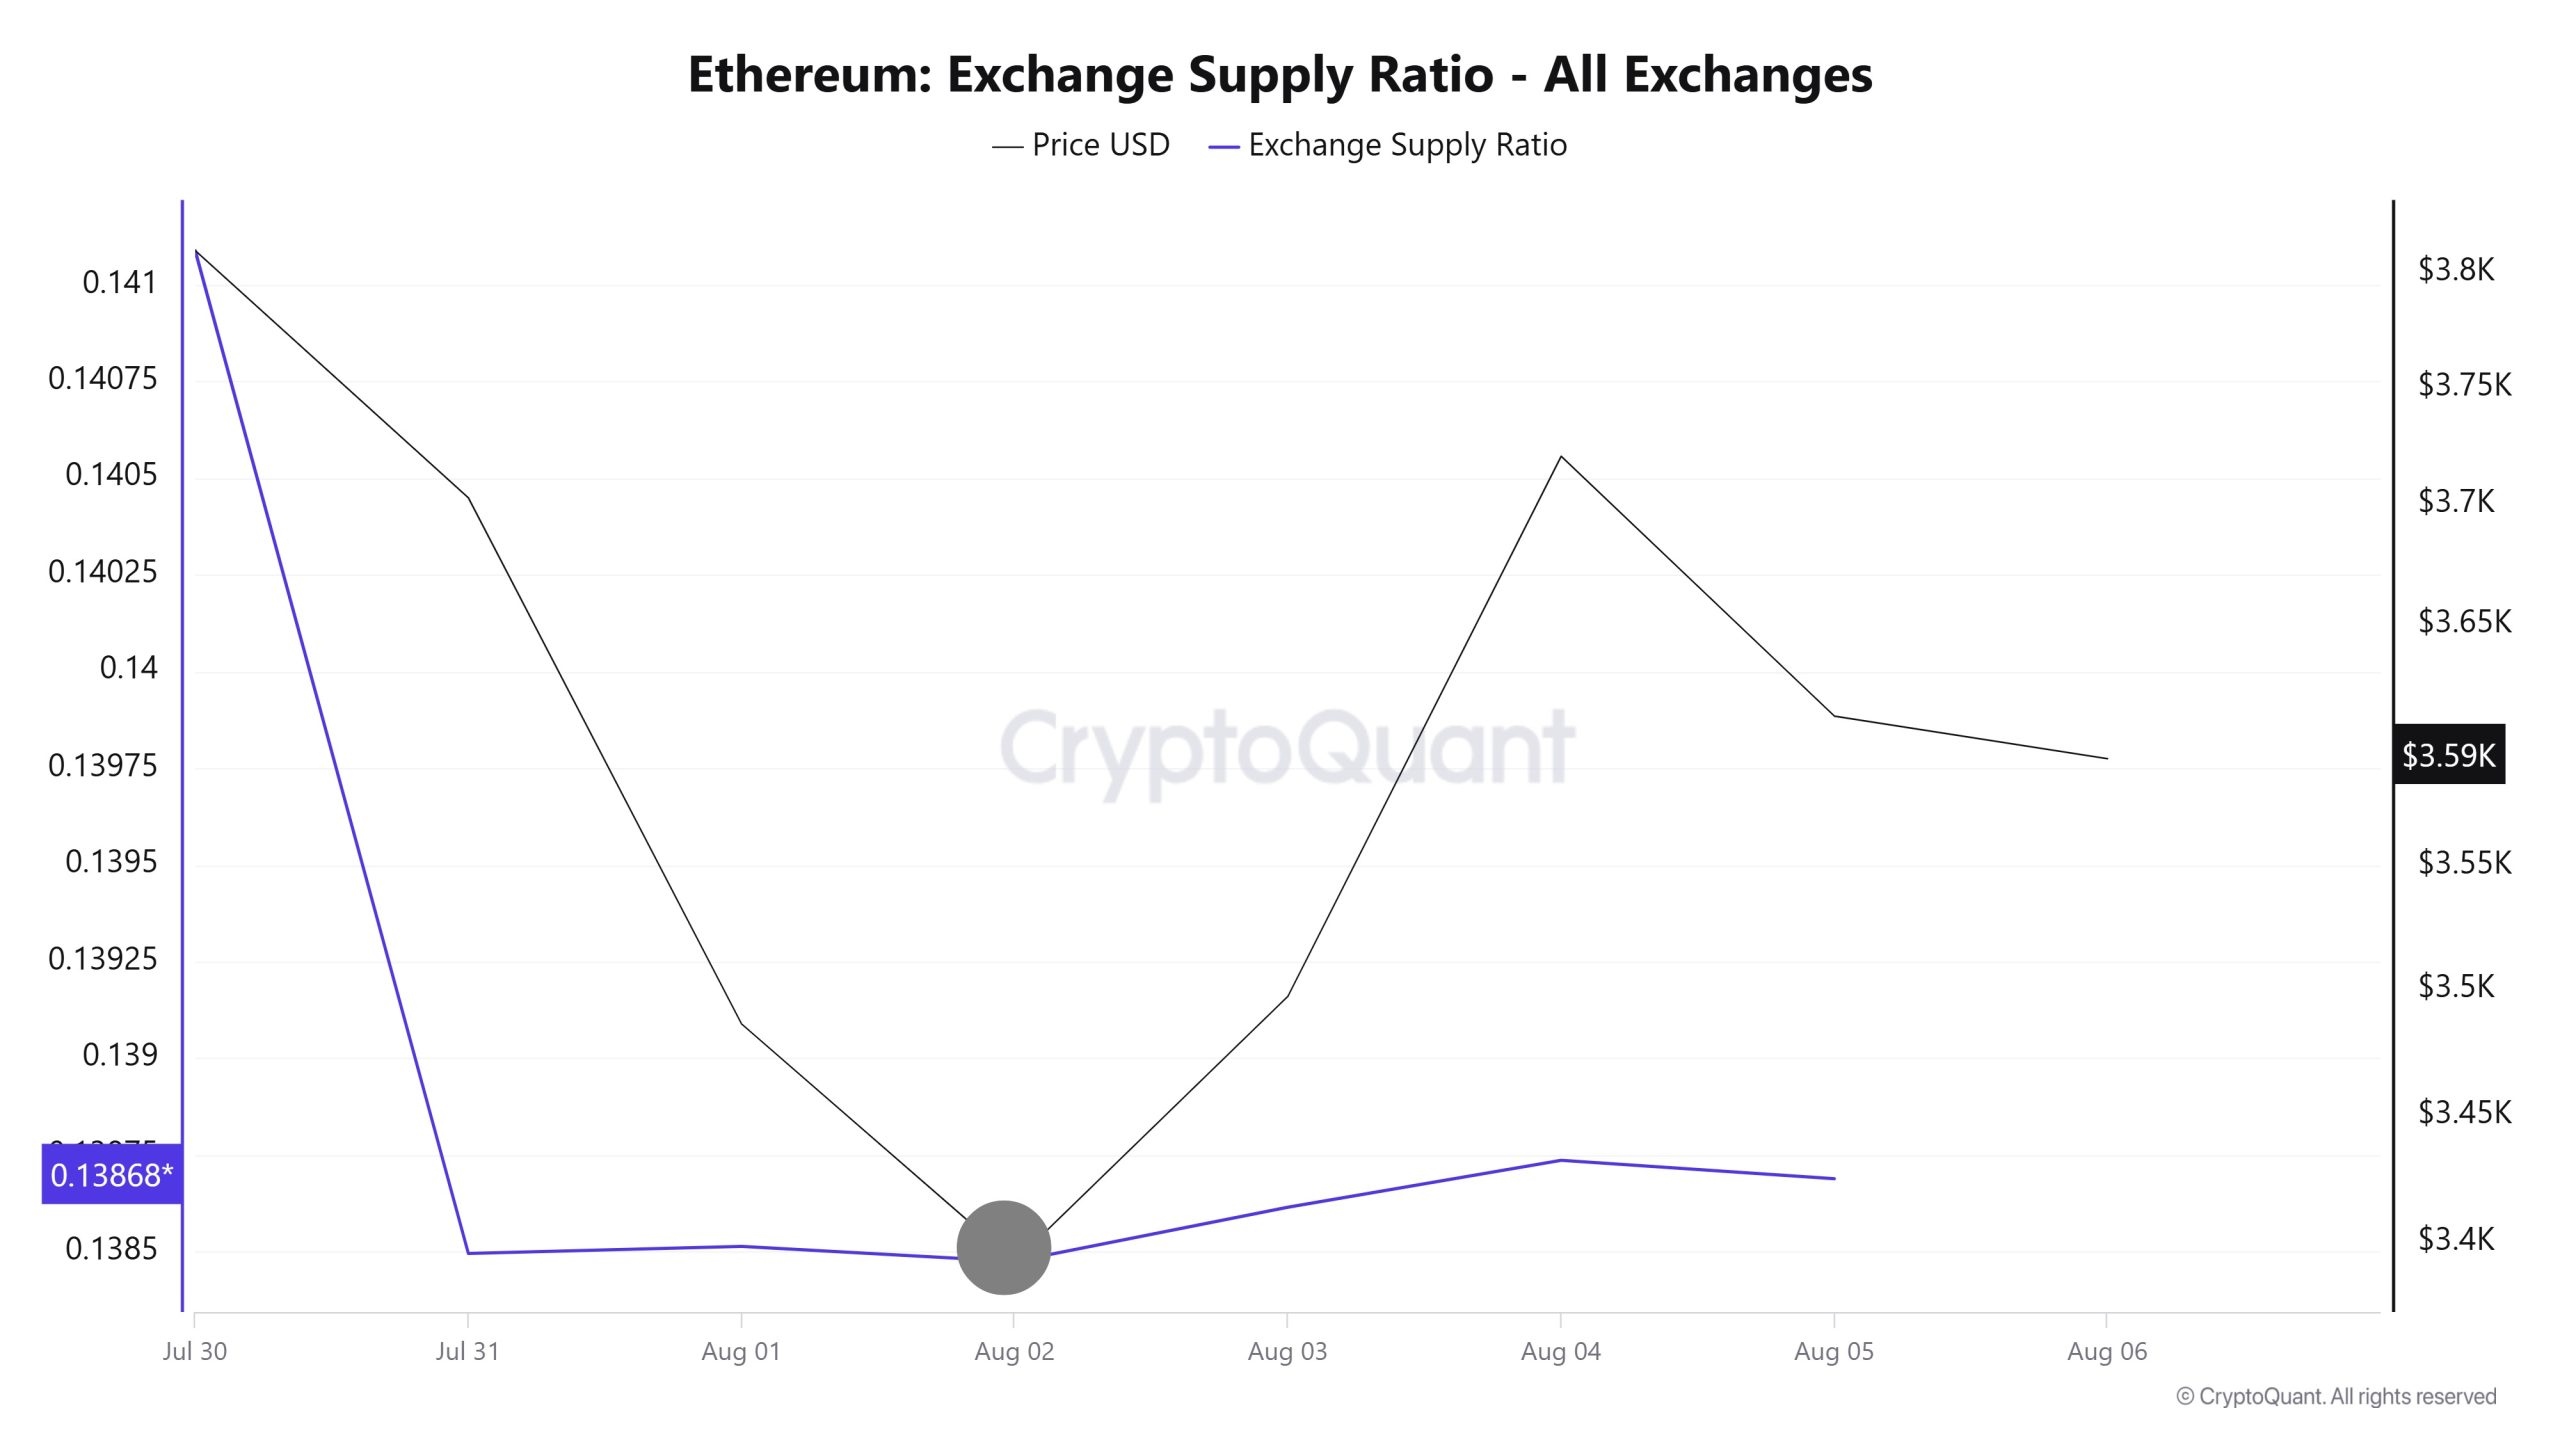
Between Agosto 30th and Agosto 5th, the Ethereum Exchange Supply Ratio increased from 0.13849551 to 0.13873636. During this period, the Ethereum price rose from $3,703 to $3,720. At the intersection of the price and the Exchange Supply Ratio, especially on Agosto 2, there was a significant increase in the Exchange Supply Ratio as the price continued to fall. This suggests that despite the price decline, the amount of Ethereum supplied to exchanges has increased, possibly indicating that long-term investors have stopped holding their holdings. It is seen that a downward trend is generally dominant in the Ethereum price.
Reserva de cambio
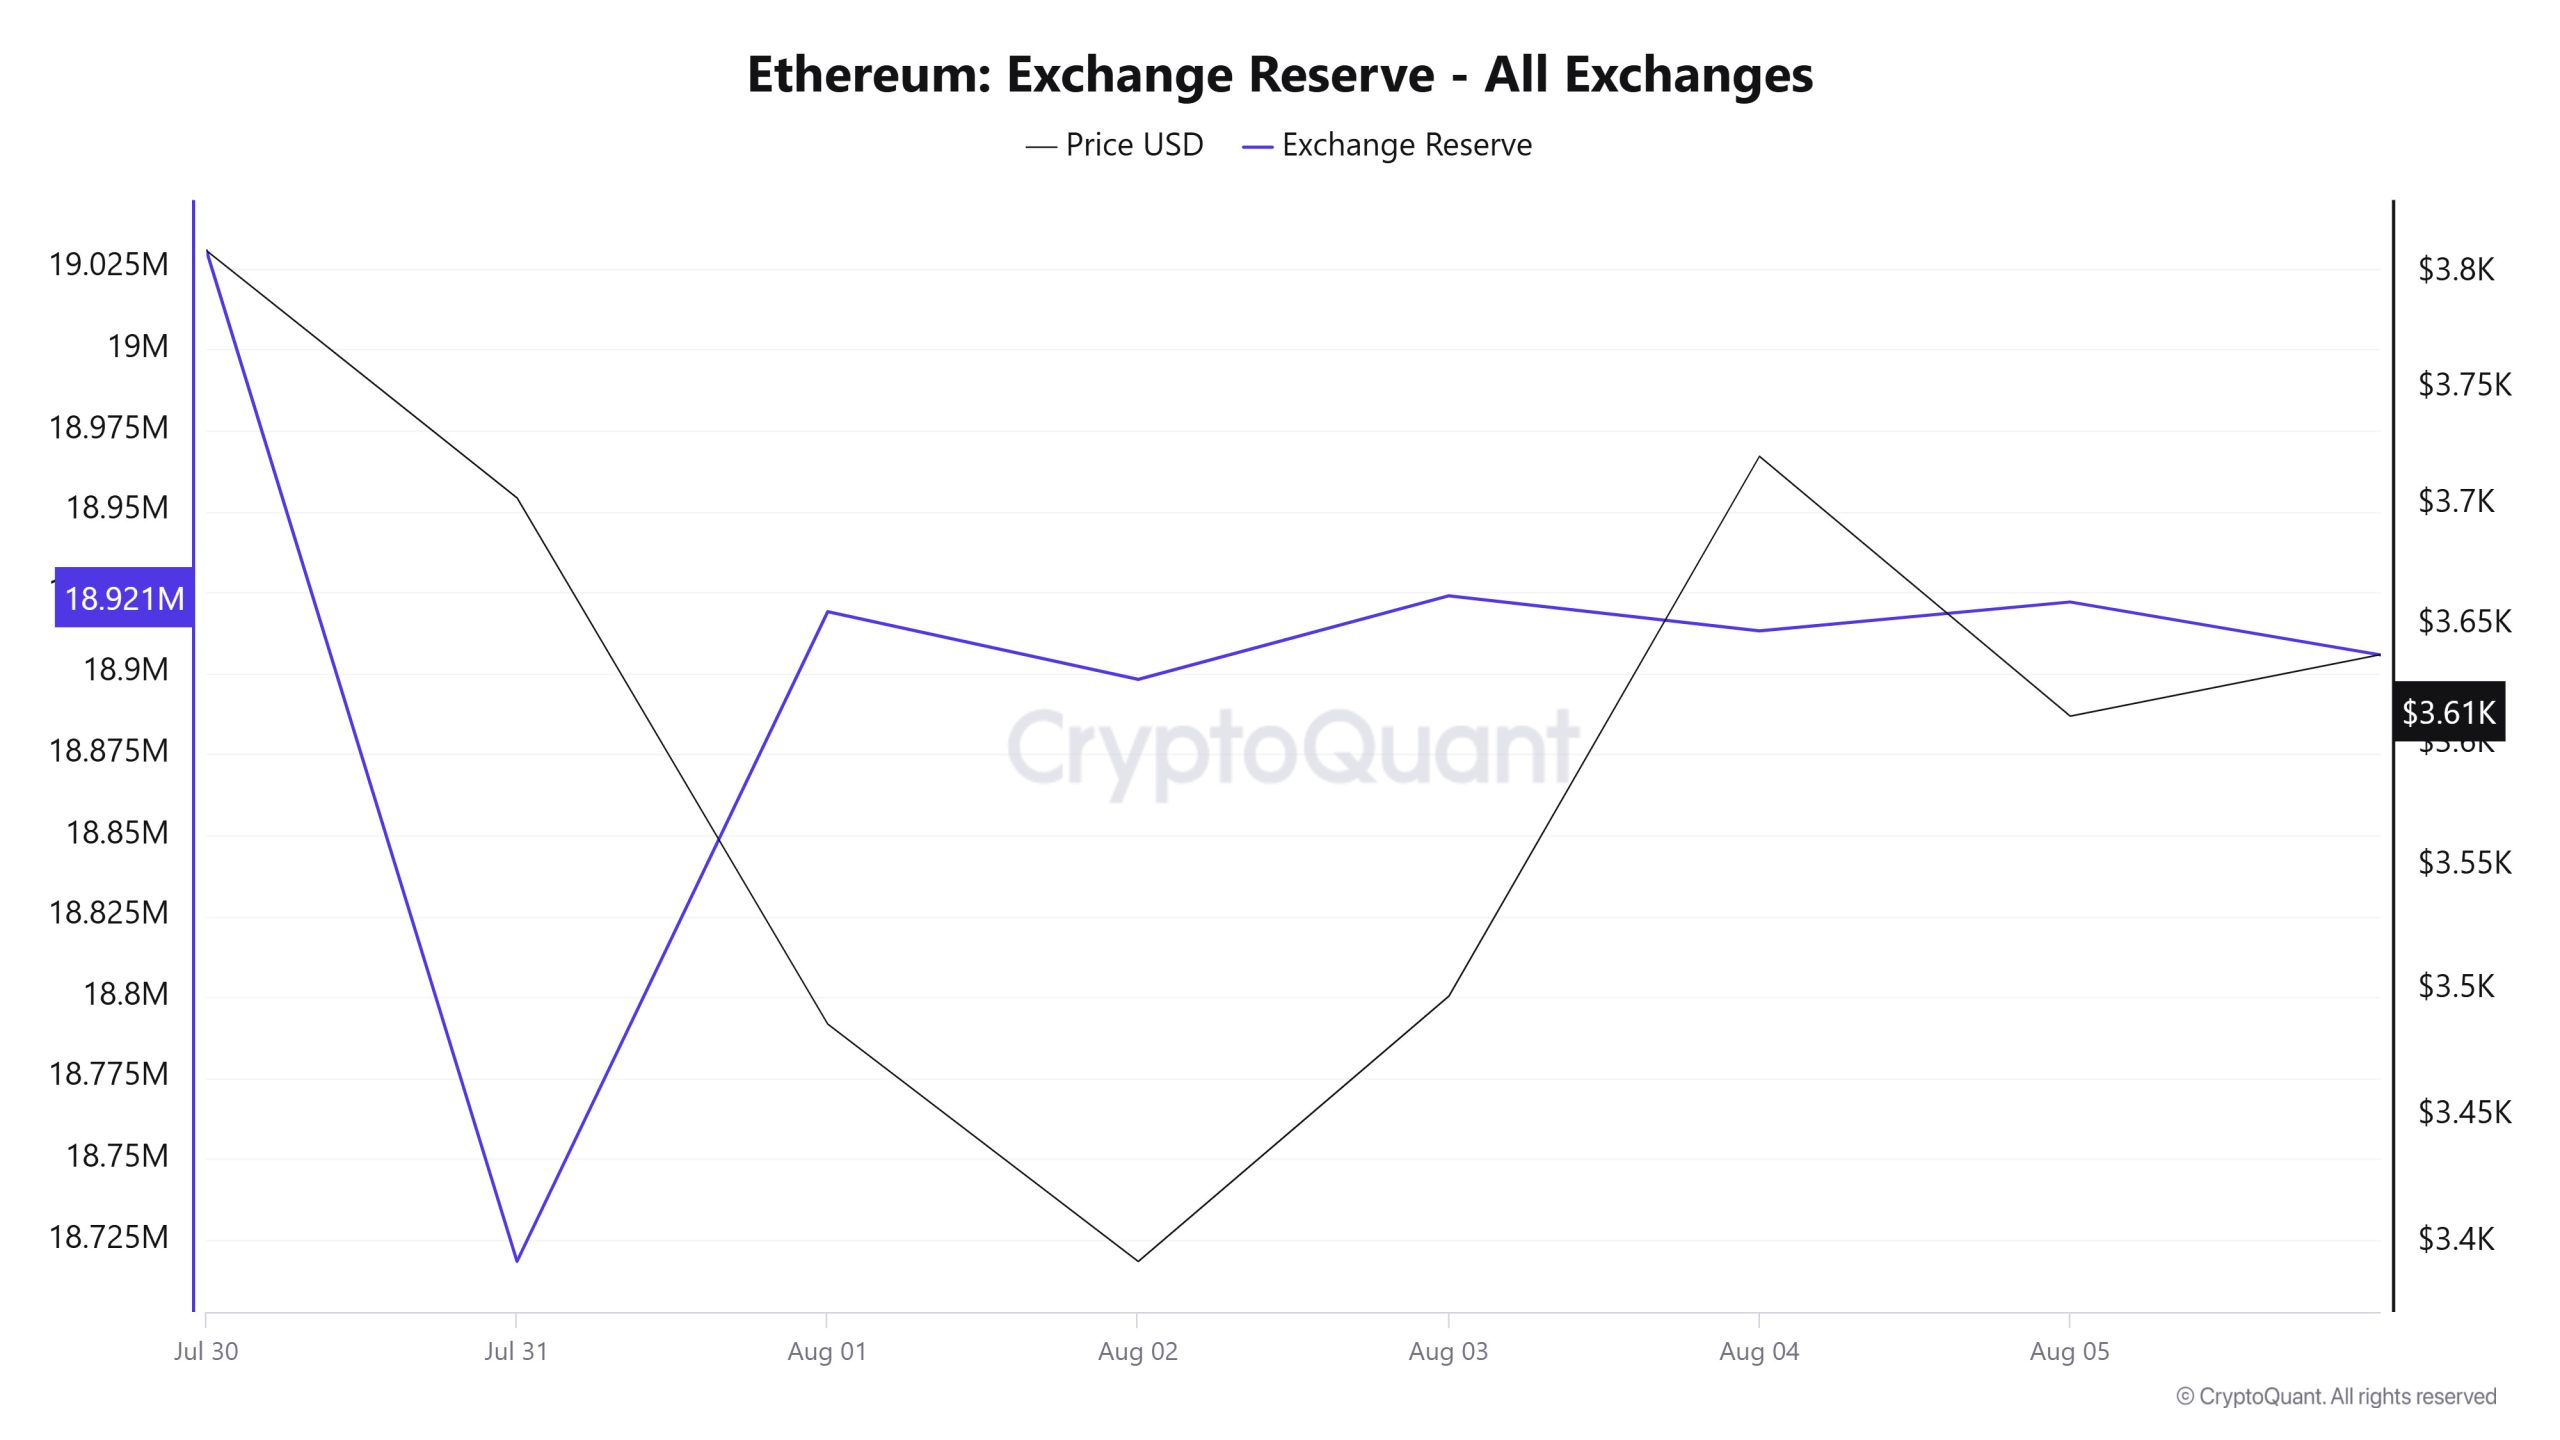
Between Julio 30 and Agosto 5, 2025, Ethereum reserves on exchanges decreased from 19,030,470 ETH to 18,921,976 ETH. During this period, there was a total net outflow of 108,494 ETH, a decrease of about 0.57% in exchange reserves. During the same period, the Ethereum price fell 5.2%, from $3,810 to $3,612. The decline in the price despite the continued reduction in reserves indicates that investors are following a cautious strategy of profit realization or selling. In the long term, the decline in reserves continues to support bullish potential, while in the short term, continued stock market outflows and selling pressure may cause the price to remain in a more sideways trend.
| Fecha | 30-Jul | 31-Jul | 1-Aug | 2-Aug | 3-Aug | 4-Aug | 5-Aug |
|---|---|---|---|---|---|---|---|
| Entrada de divisas | 1,010,735 | 1,009,376 | 1,350,715 | 496,083 | 383,635 | 957,304 | 1,159,541 |
| Salida de divisas | 1,007,639 | 1,321,446 | 1,150,141 | 516,965 | 357,842 | 968,146 | 1,150,609 |
| Intercambio Netflow | 3,095 | -312,070 | 200,574 | -20,881 | 25,793 | -10,842 | 8,932 |
| Reserva de cambio | 19,030,470 | 18,718,400 | 18,918,974 | 18,898,092 | 18,923,885 | 18,913,043 | 18,921,976 |
| Precio del ETH | 3,810 | 3,703 | 3,486 | 3,393 | 3,497 | 3,721 | 3,612 |
Tasas e ingresos
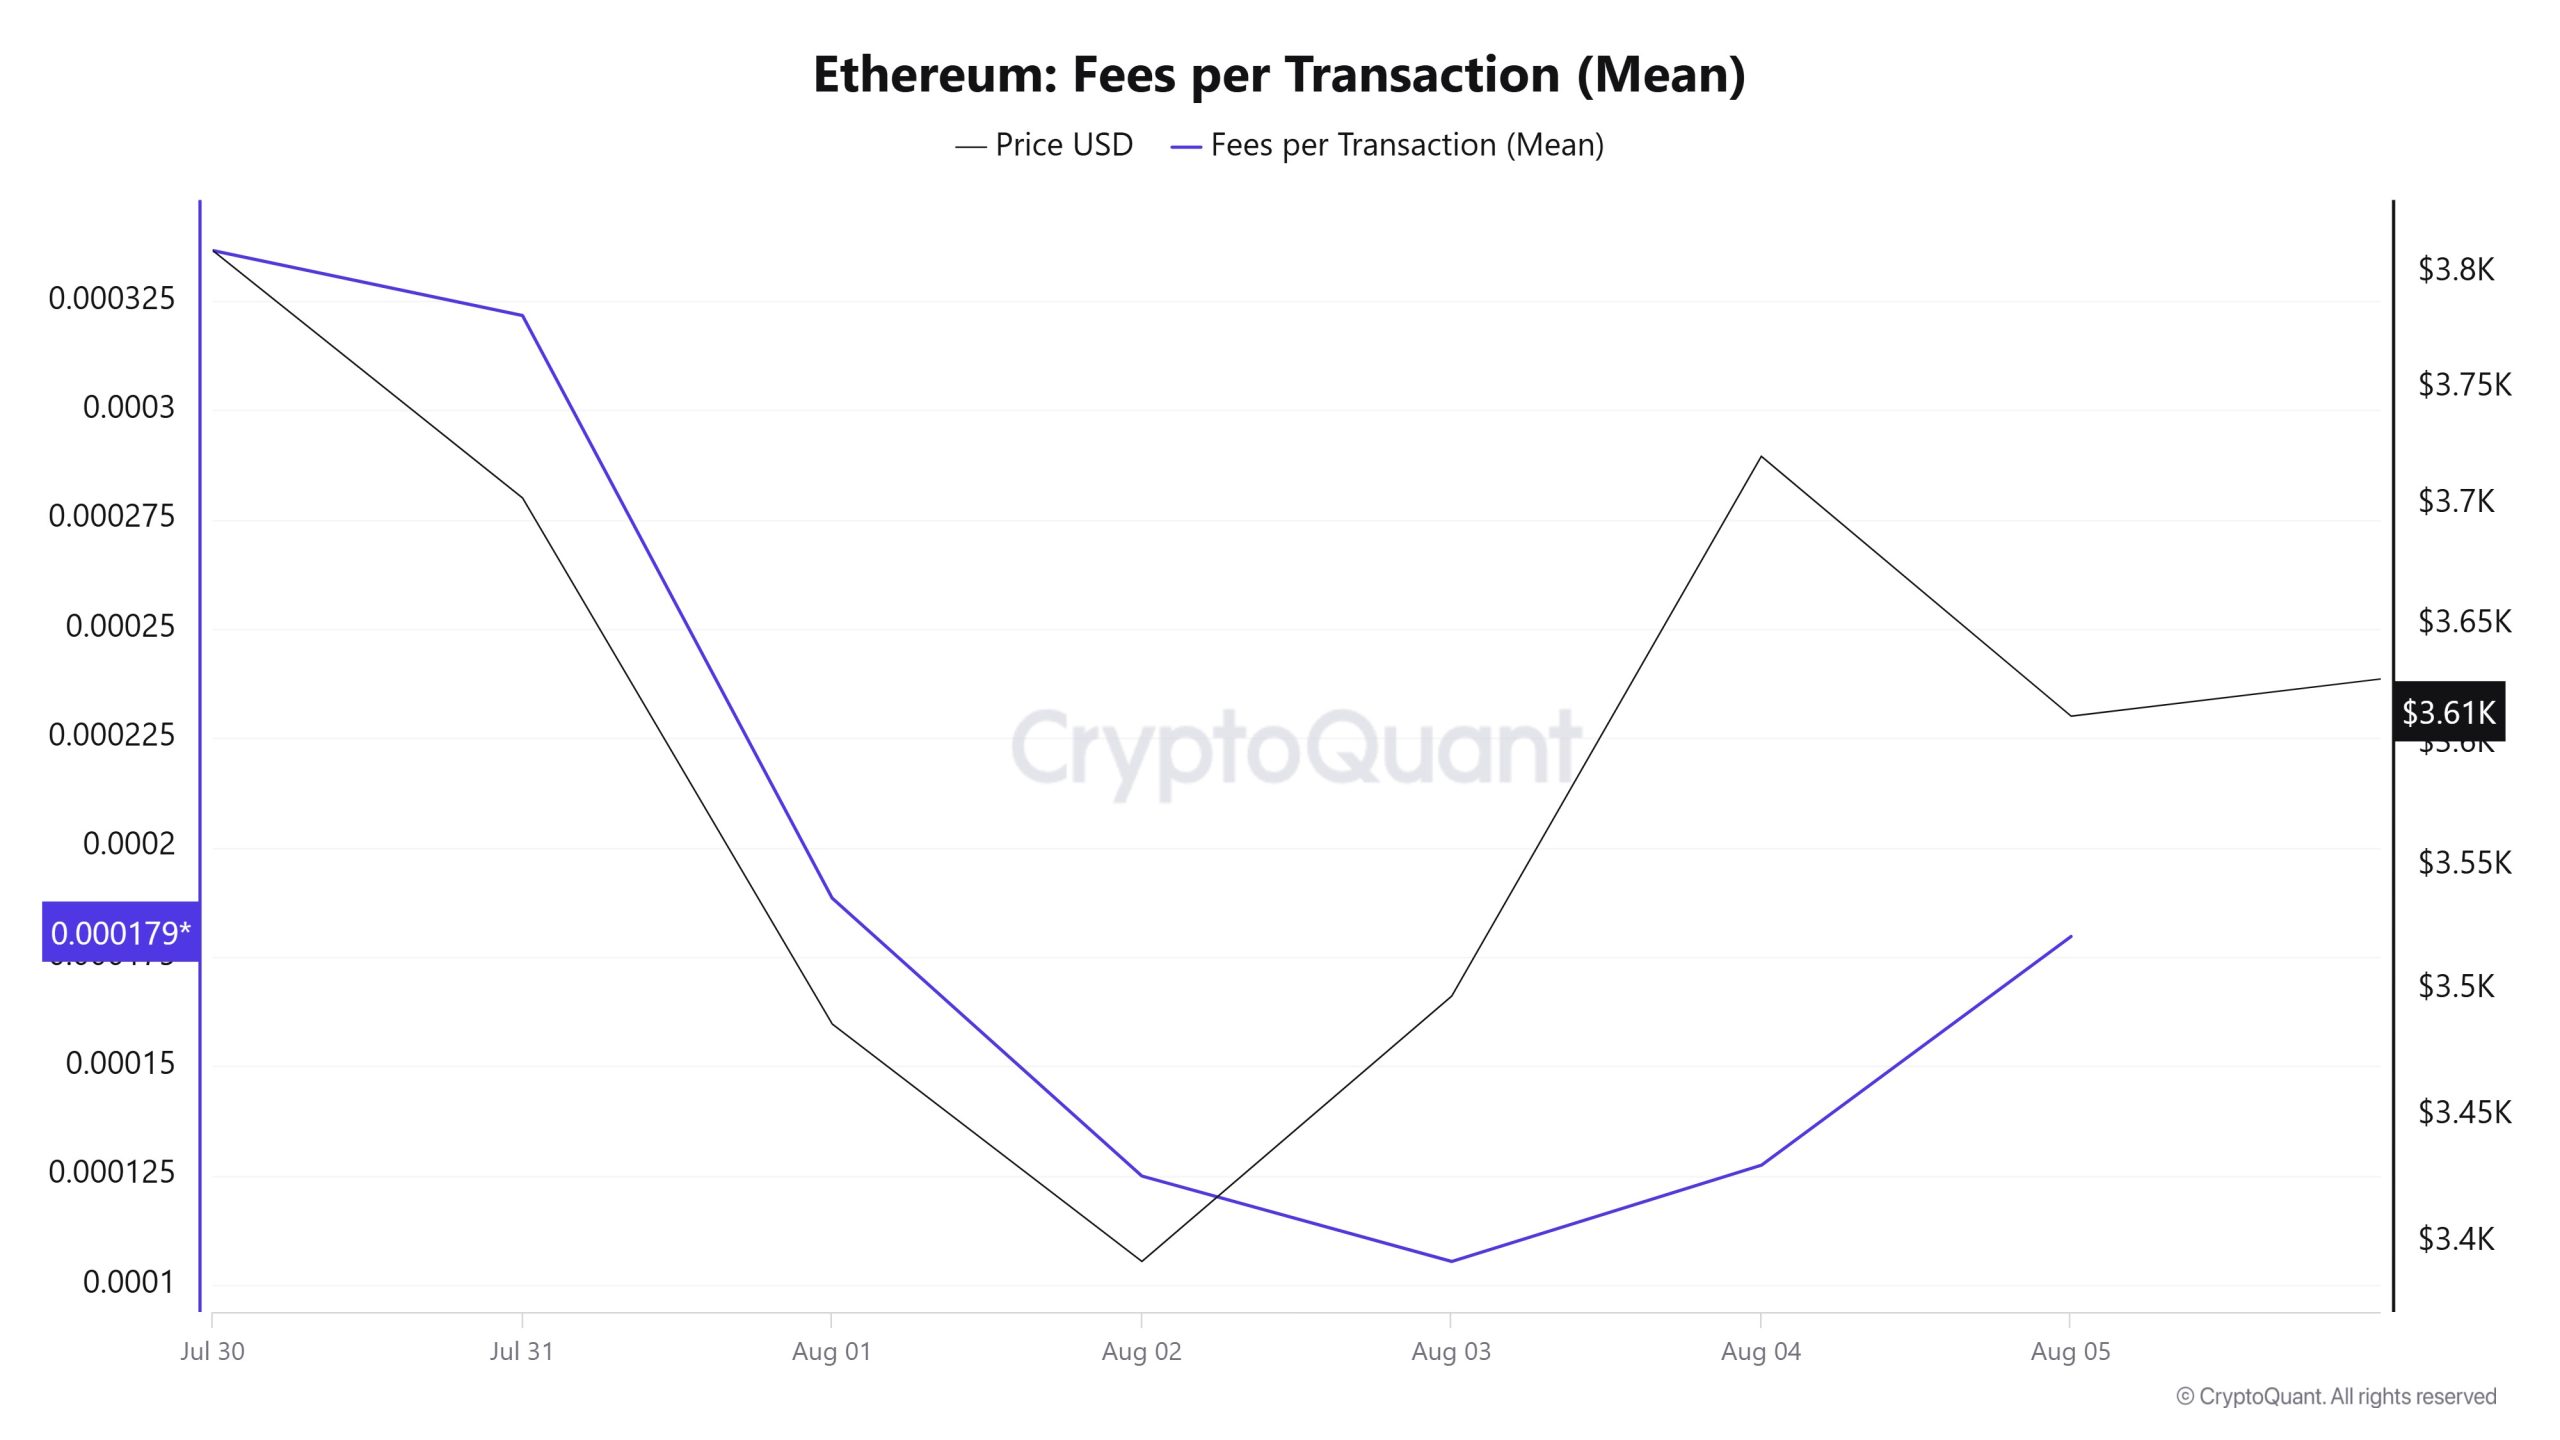
When the Ethereum Fees per Transaction (Mean) data between Julio 30 and Agosto 5 is analyzed, it is seen that this indicator was realized at the level of 0.000336440317944061 on Julio 30, the first day of the week.
As of this date, a downward trend was observed due to the volatile movements in the Ethereum price; as of Agosto 3, it reached 0.000105307312637154, reaching the lowest level of the week.
In the following days, Ethereum Fees per Transaction (Mean) started to rise again and closed at 0.00017961704632878 on Agosto 5, the last day of the week.
Bitcoin: Tasas (Total)
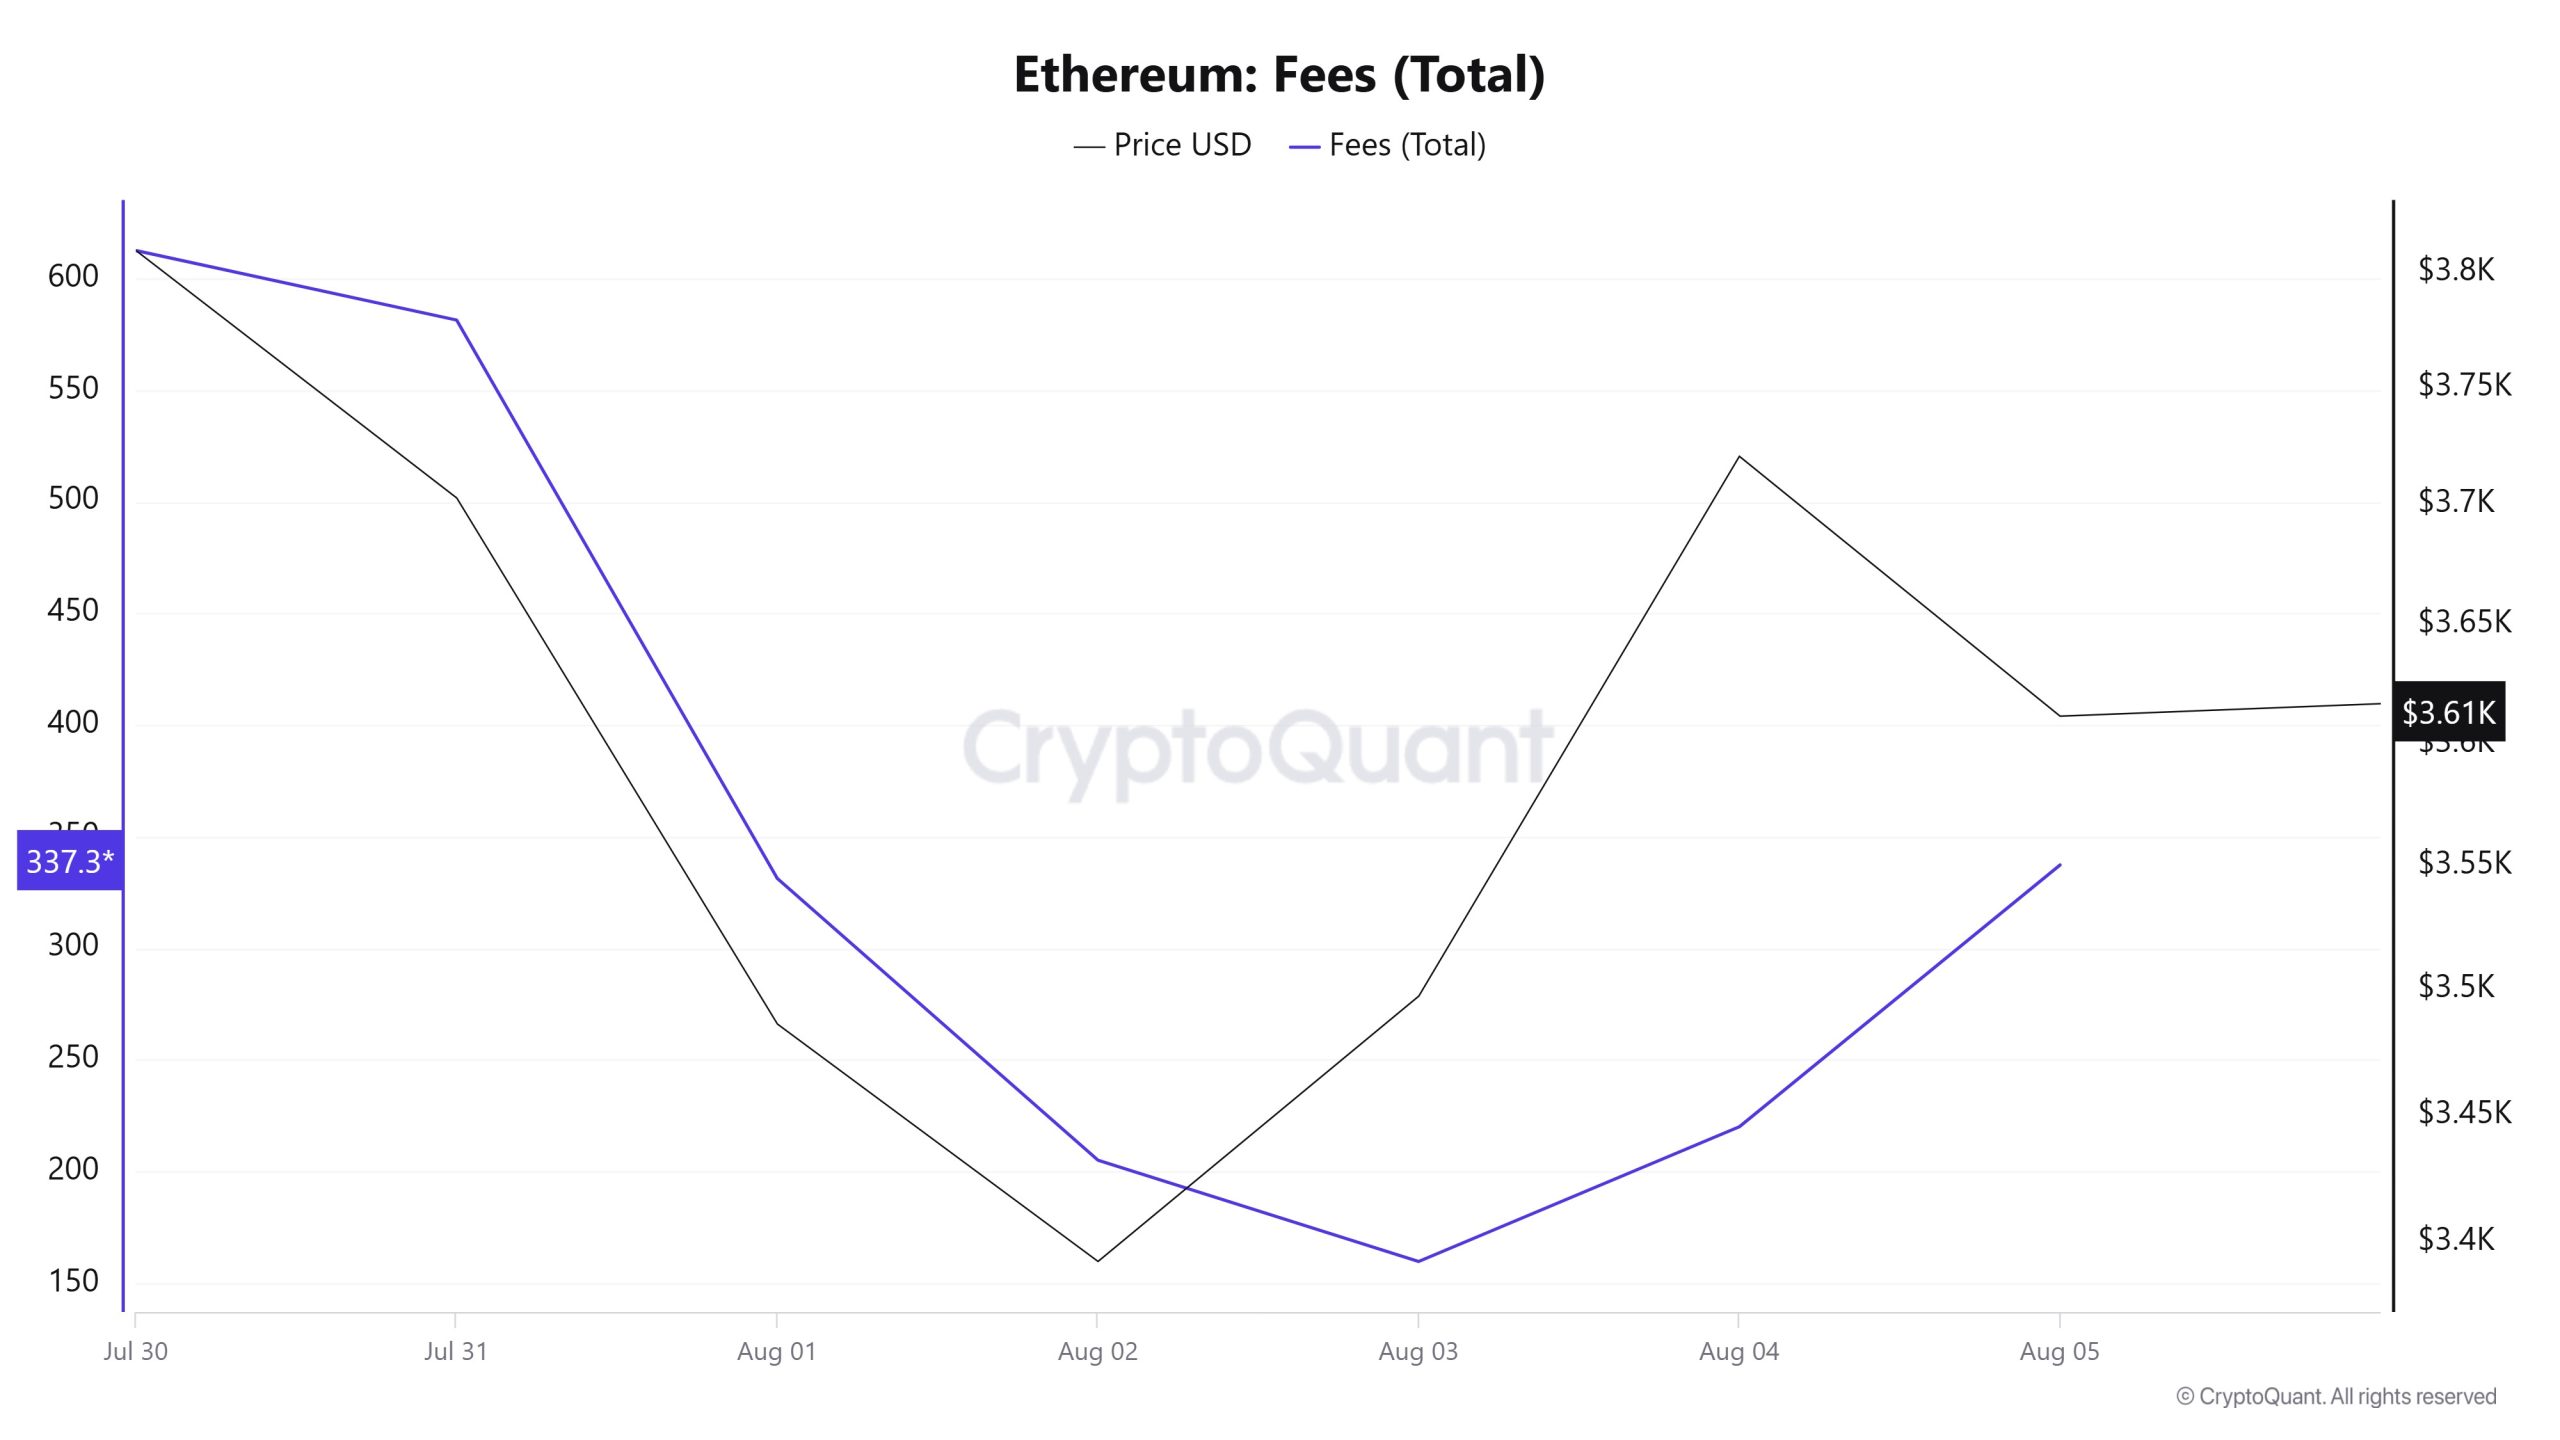
Similarly, an analysis of Ethereum Fees (Total) data between Julio 30 and Agosto 5 shows that on Julio 30, the first day of the week, this indicator stood at 612,6568096551816.
As of this date, a downward trend was observed due to the volatile movements in the Ethereum price; as of Agosto 3, it reached 159.64114712885606, the lowest level of the week.
In the following days, Ethereum Fees (Total) started to rise again and closed at 337,32638113388487 on Agosto 5, the last day of the week.
Bloques extraídos
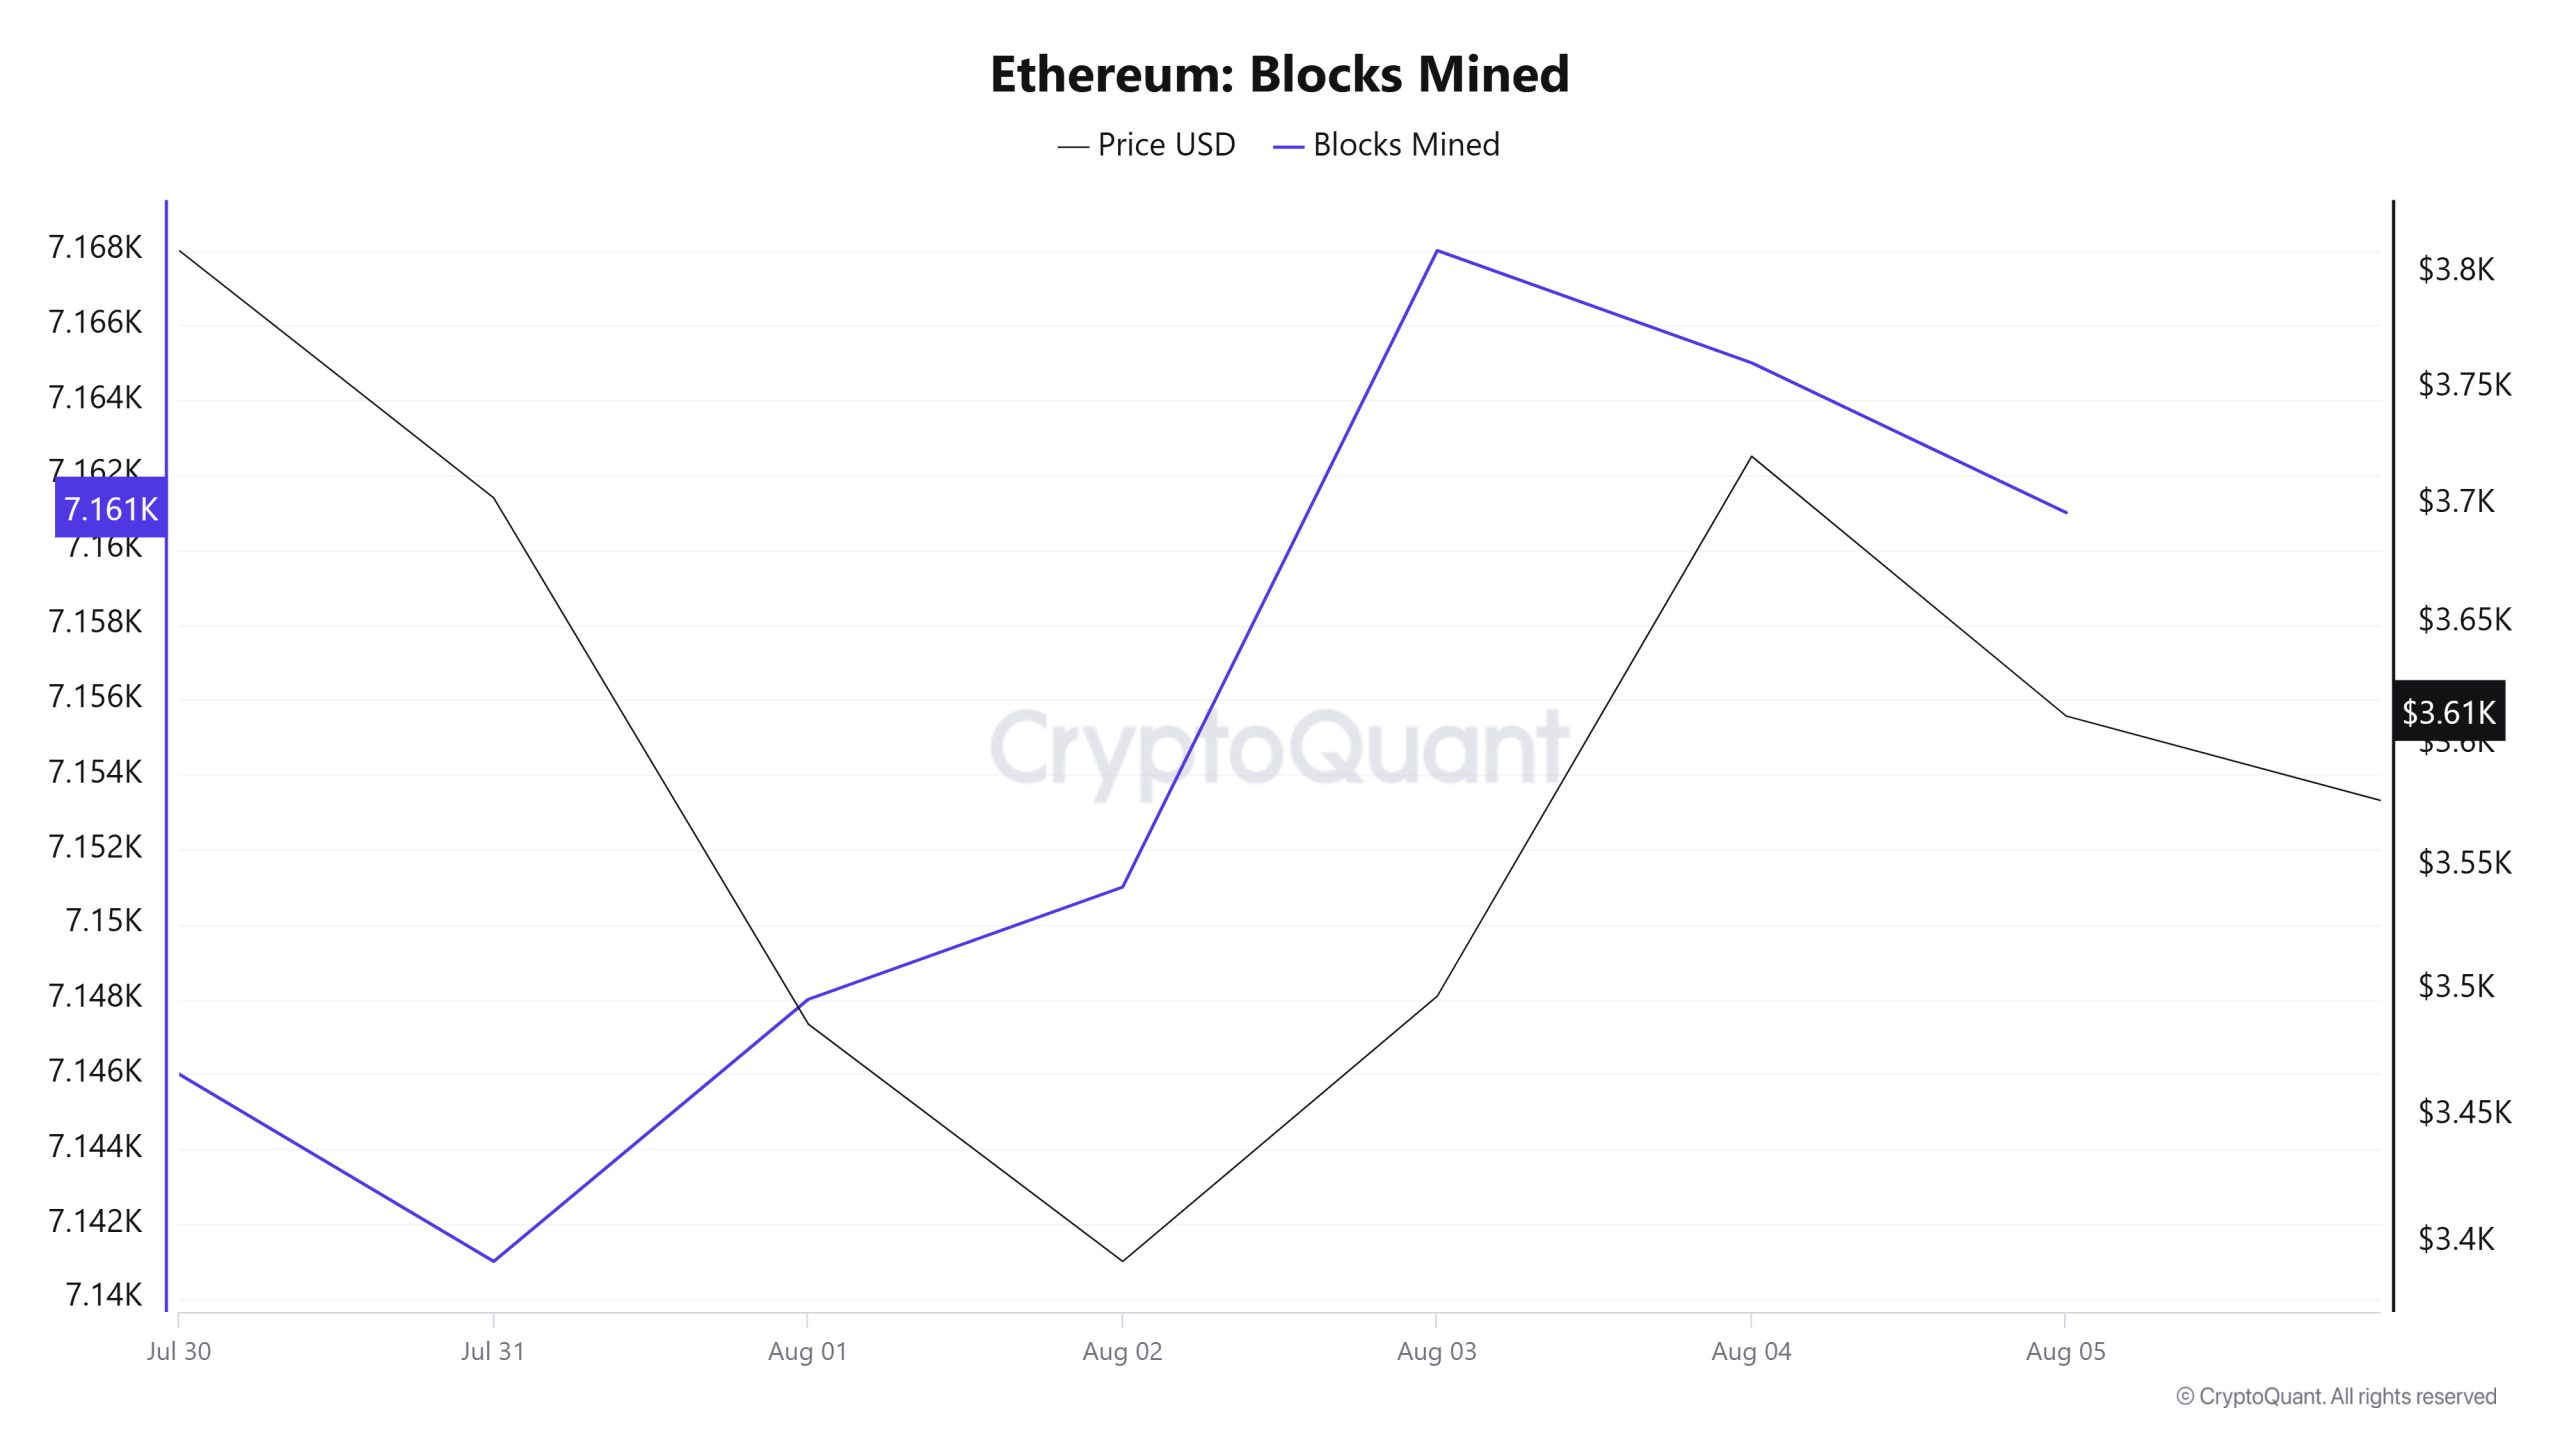
Between Julio 30 and Agosto 5, Ethereum block production data showed an increase throughout the week. While 7,146 blocks were produced on Julio 30, this number increased to 7,161 as of Agosto 5. The increase in the number of blocks produced indicates that the network was used more intensively during this period. There was a positive correlation between the Ethereum price and the number of blocks produced throughout the week.
Tamaño del bloque
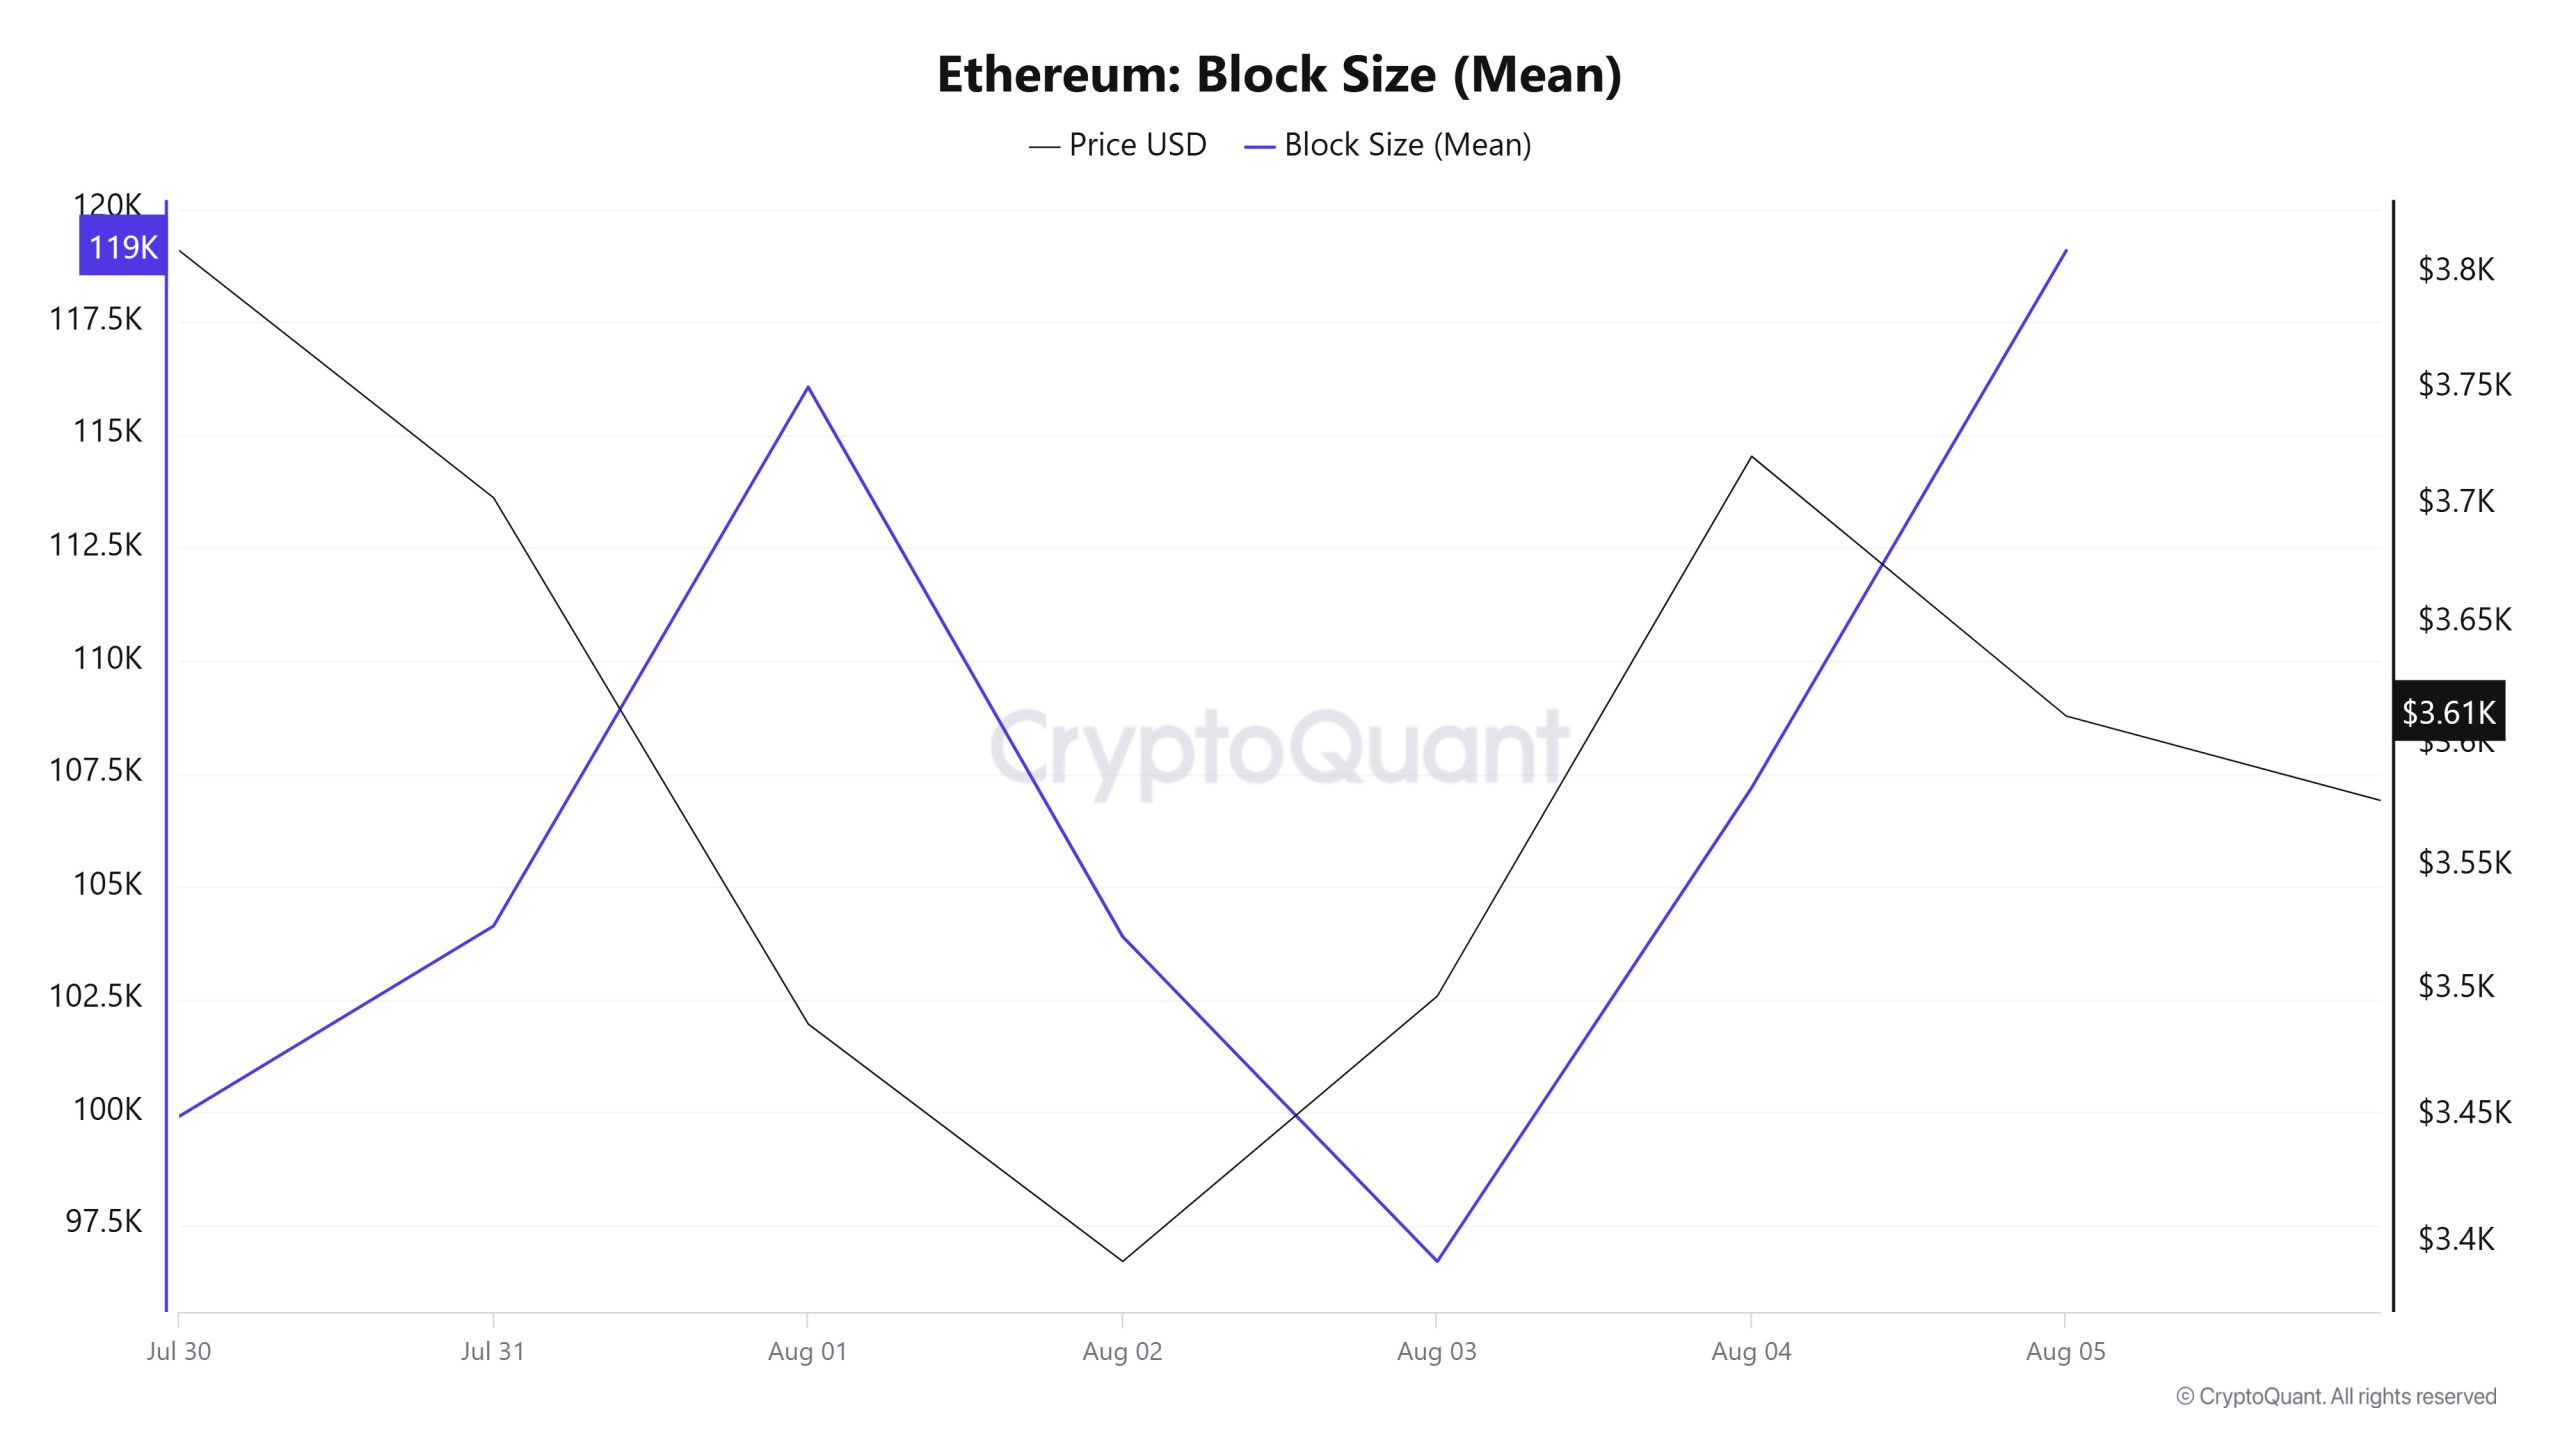
Between Julio 30 and Agosto 5, Ethereum block size data showed a significant increase throughout the week. On Julio 30th, the average block size was 99,914 bytes, while as of Agosto 5th, this value increased to 119,084 bytes. There was a negative correlation between block size and Ethereum price during the week.
Intervalo en bloque
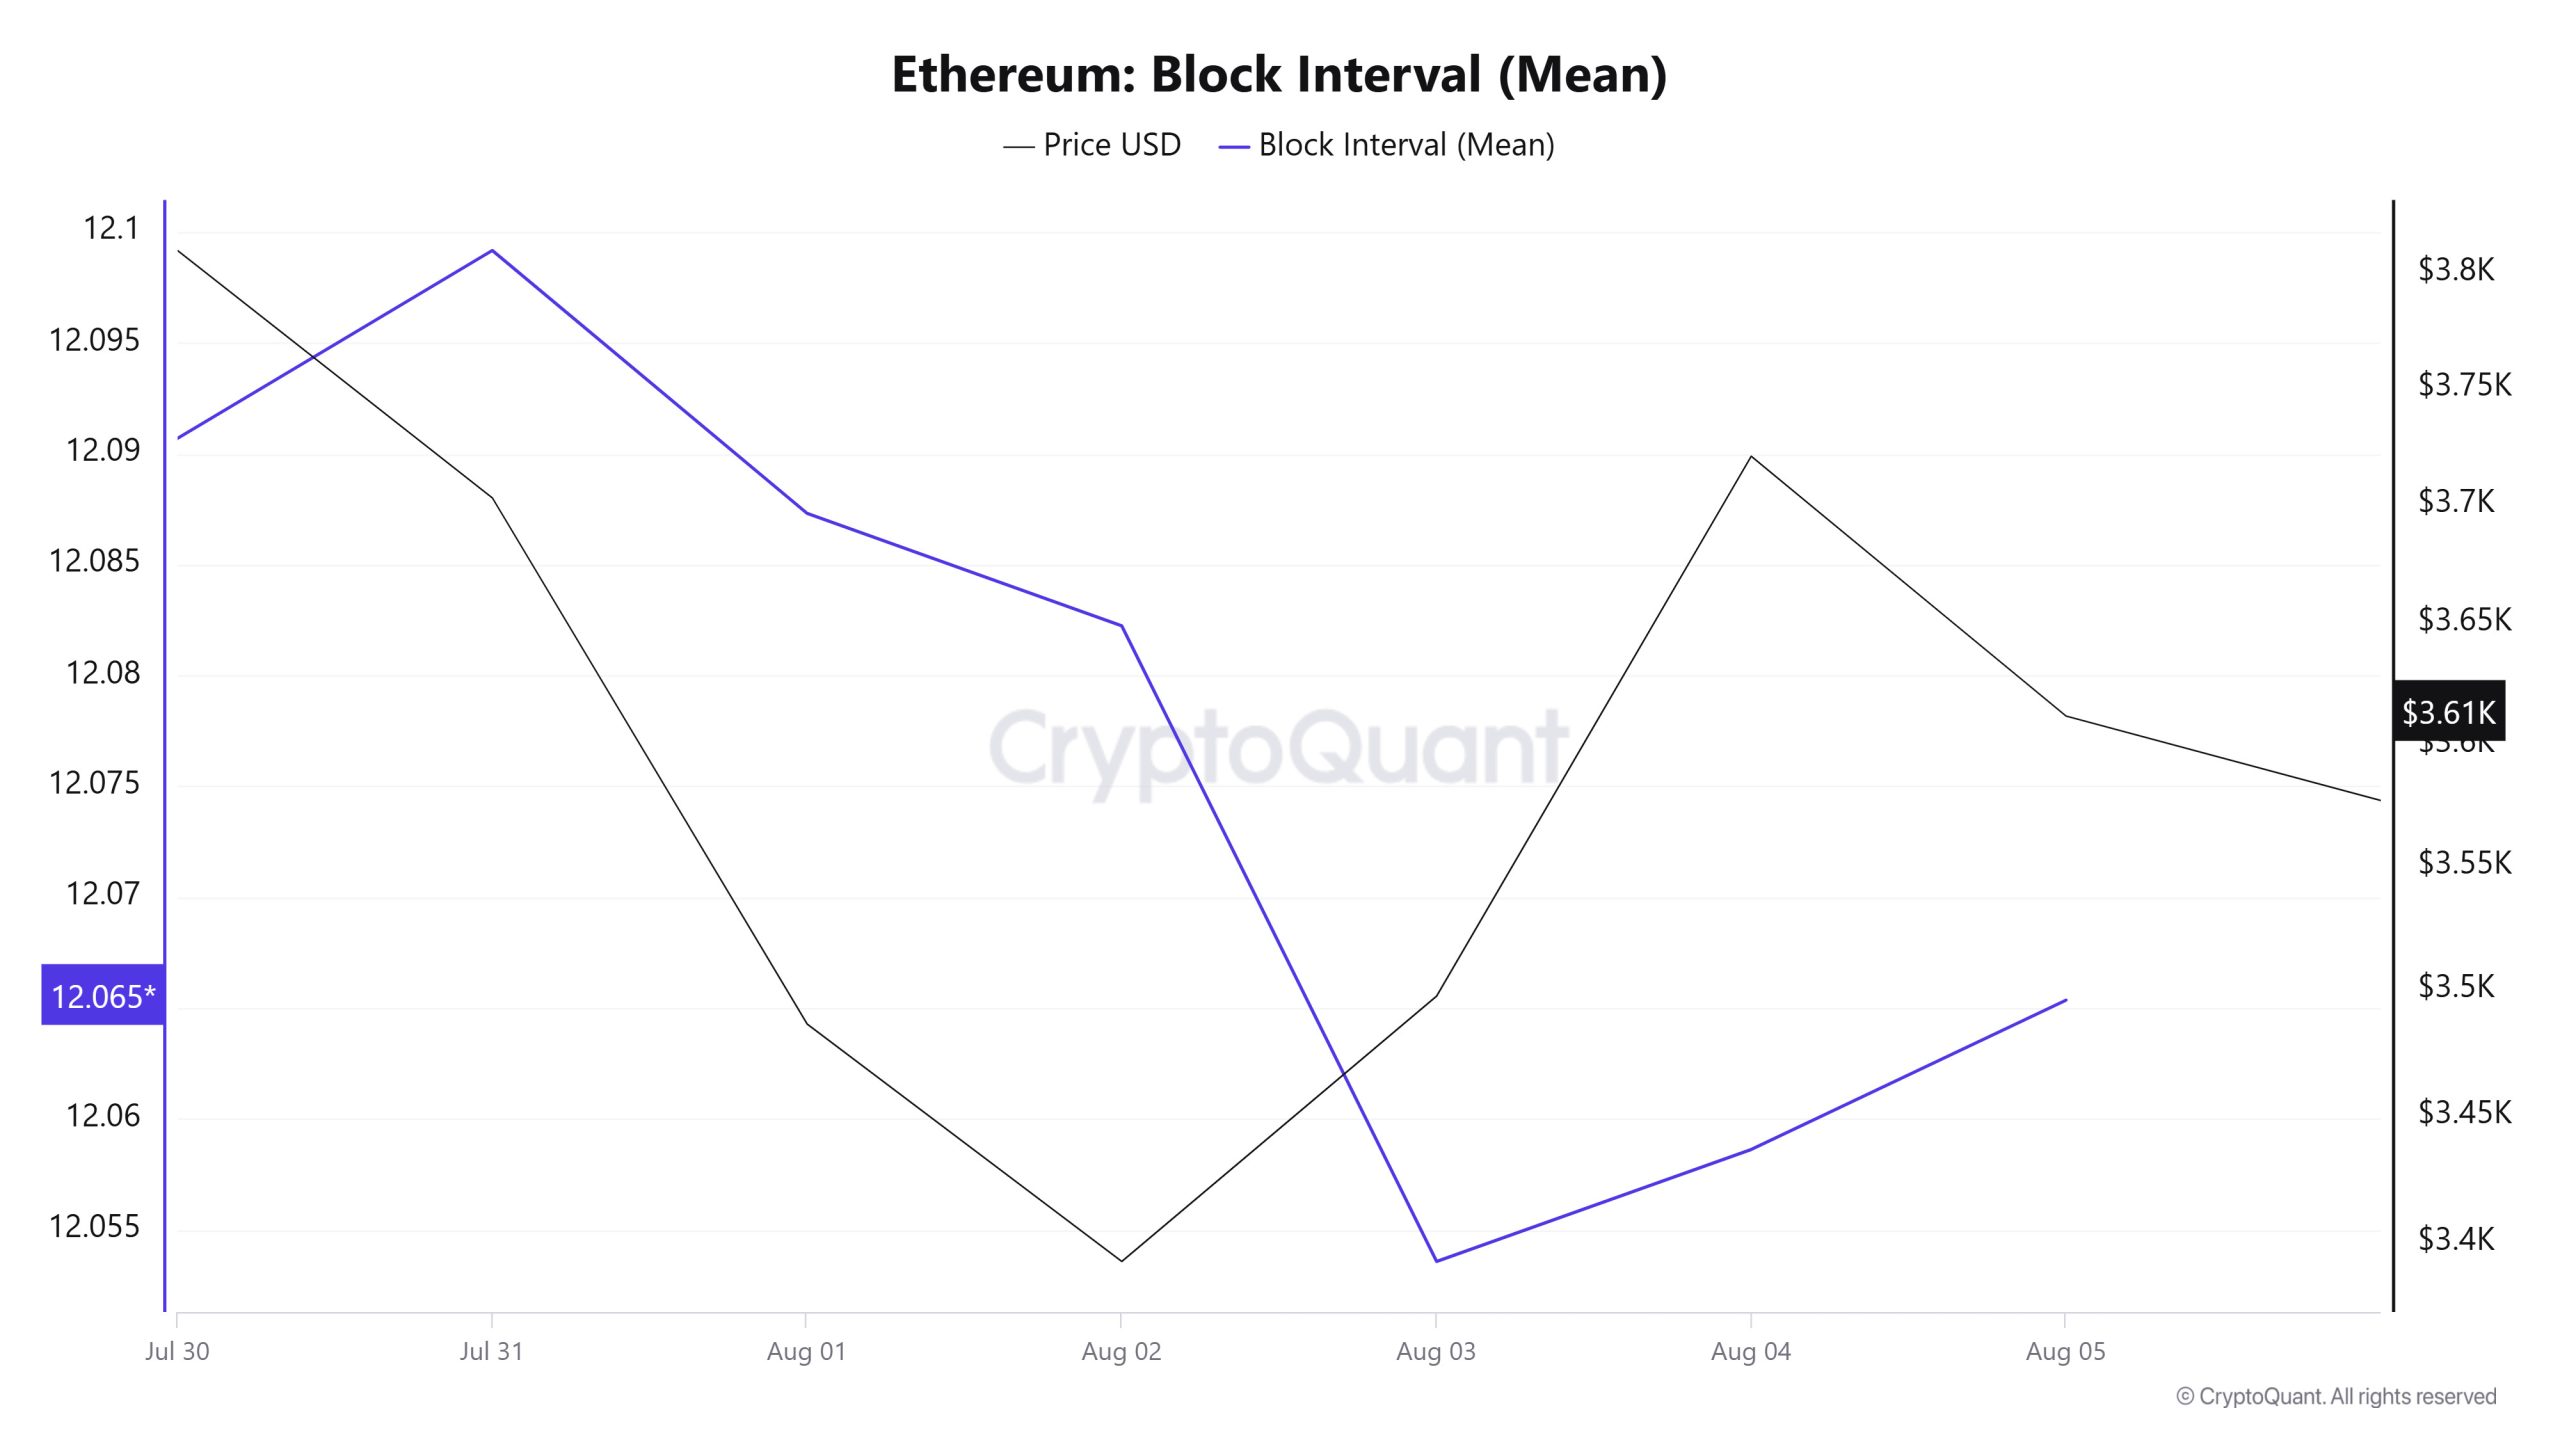
Between Julio 30 and Agosto 5, Ethereum block data showed a slight decrease throughout the week. On Julio 30, the average block duration was 12.09 seconds, while it decreased to 12.06 seconds as of Agosto 5. During the period in question, Ethereum block duration and price movement were positively correlated throughout the week.
Transacción
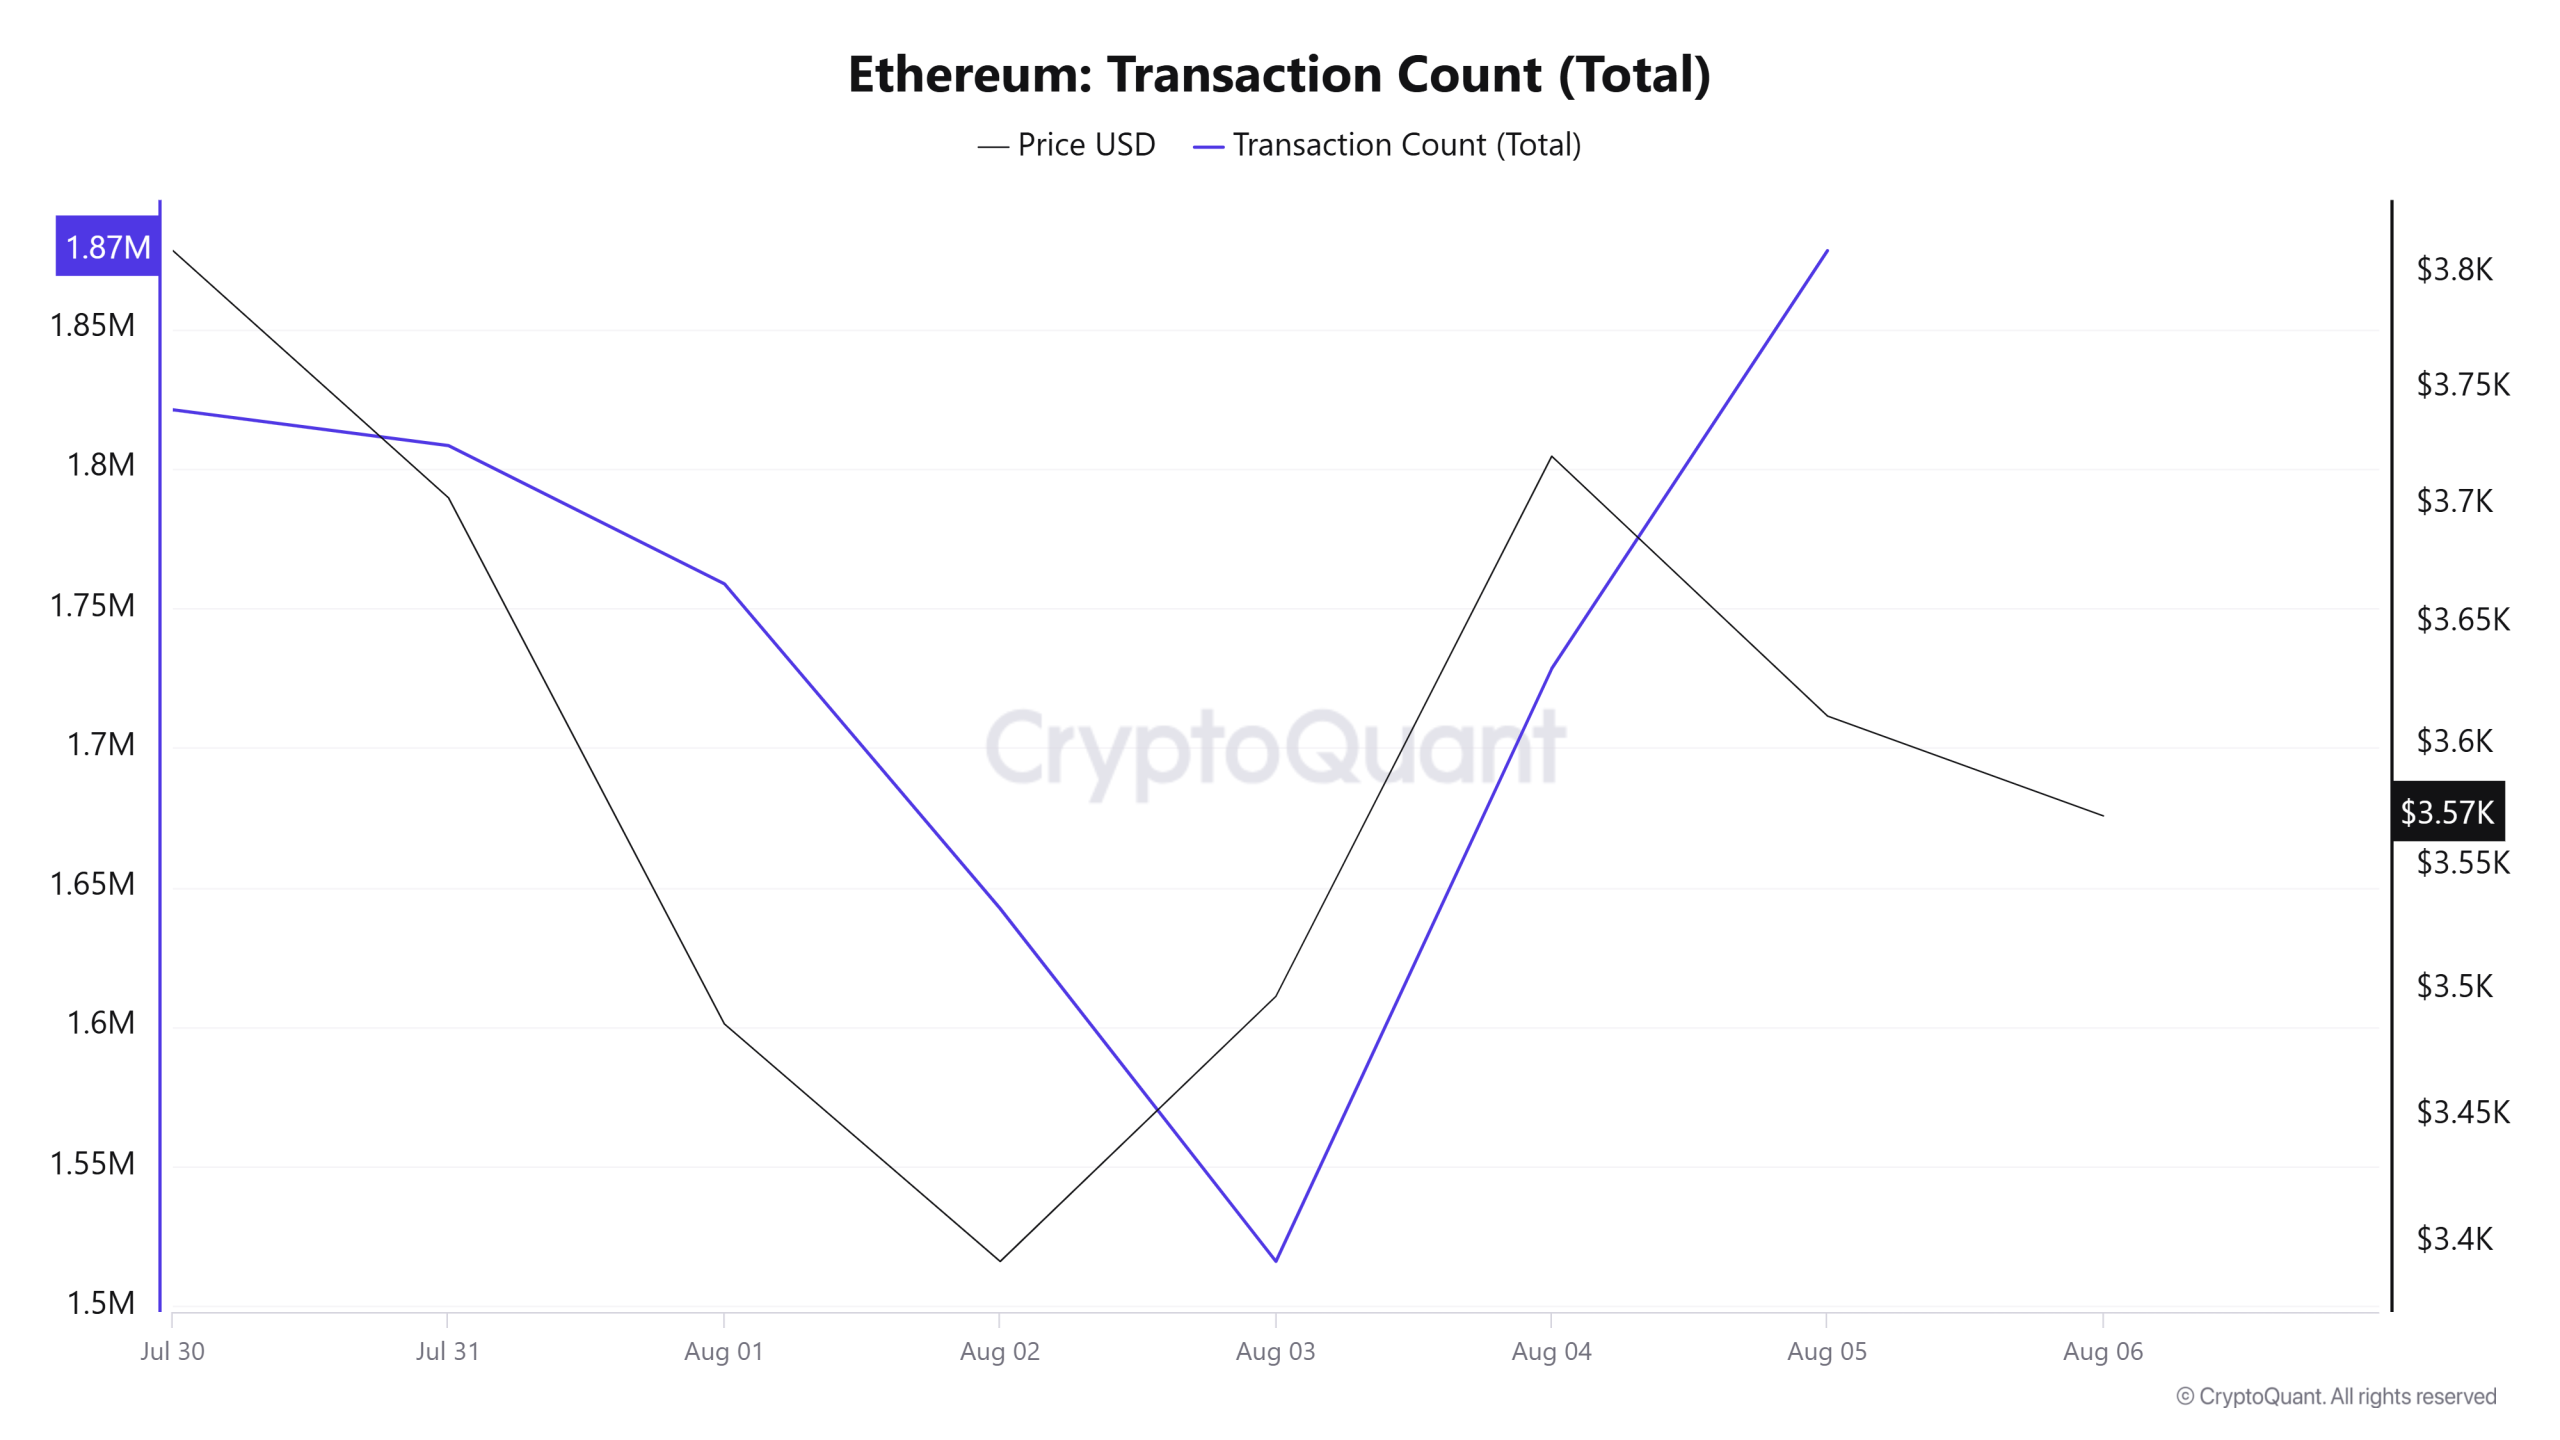
Last week, a total of 11,143,025 transactions were executed on the Ethereum network, while this week this number decreased by about 4.82% to 10,605,471. The highest number of transactions on a weekly basis was 1,878,031 on Agosto 5, while the lowest number of transactions was 1,515,955 on Agosto 3.
This change in the number of transactions suggests that the usage on the network has stopped increasing and stabilized a bit, and Ethereum burns have decreased compared to last week. The correlation between the price and the number of transactions was positively weighted throughout the week.
Fichas transferidas
While the total amount of ETH transferred on the Ethereum network last week was 16,952,280, this week this amount decreased by approximately 23.81% to 12,913,505. 2,530,694 ETH transfers on Agosto 1 was the highest daily token transfer amount of the week, while Agosto 3 recorded the lowest value of the week with only 1,019,774 ETH transfers. When the relationship between the price and the amount of tokens transferred was analyzed throughout the week, a balanced correlation was observed.
The fact that the number of transfers in network usage has decreased, but the total amount of tokens transferred has decreased much more, suggests that user activity on the Ethereum network has decreased, but the volume of smaller users has increased. This can be interpreted as Ethereum expanding its user base to small investors on DeFi, NFT and other Web3 applications.
Ratio de apalancamiento estimado
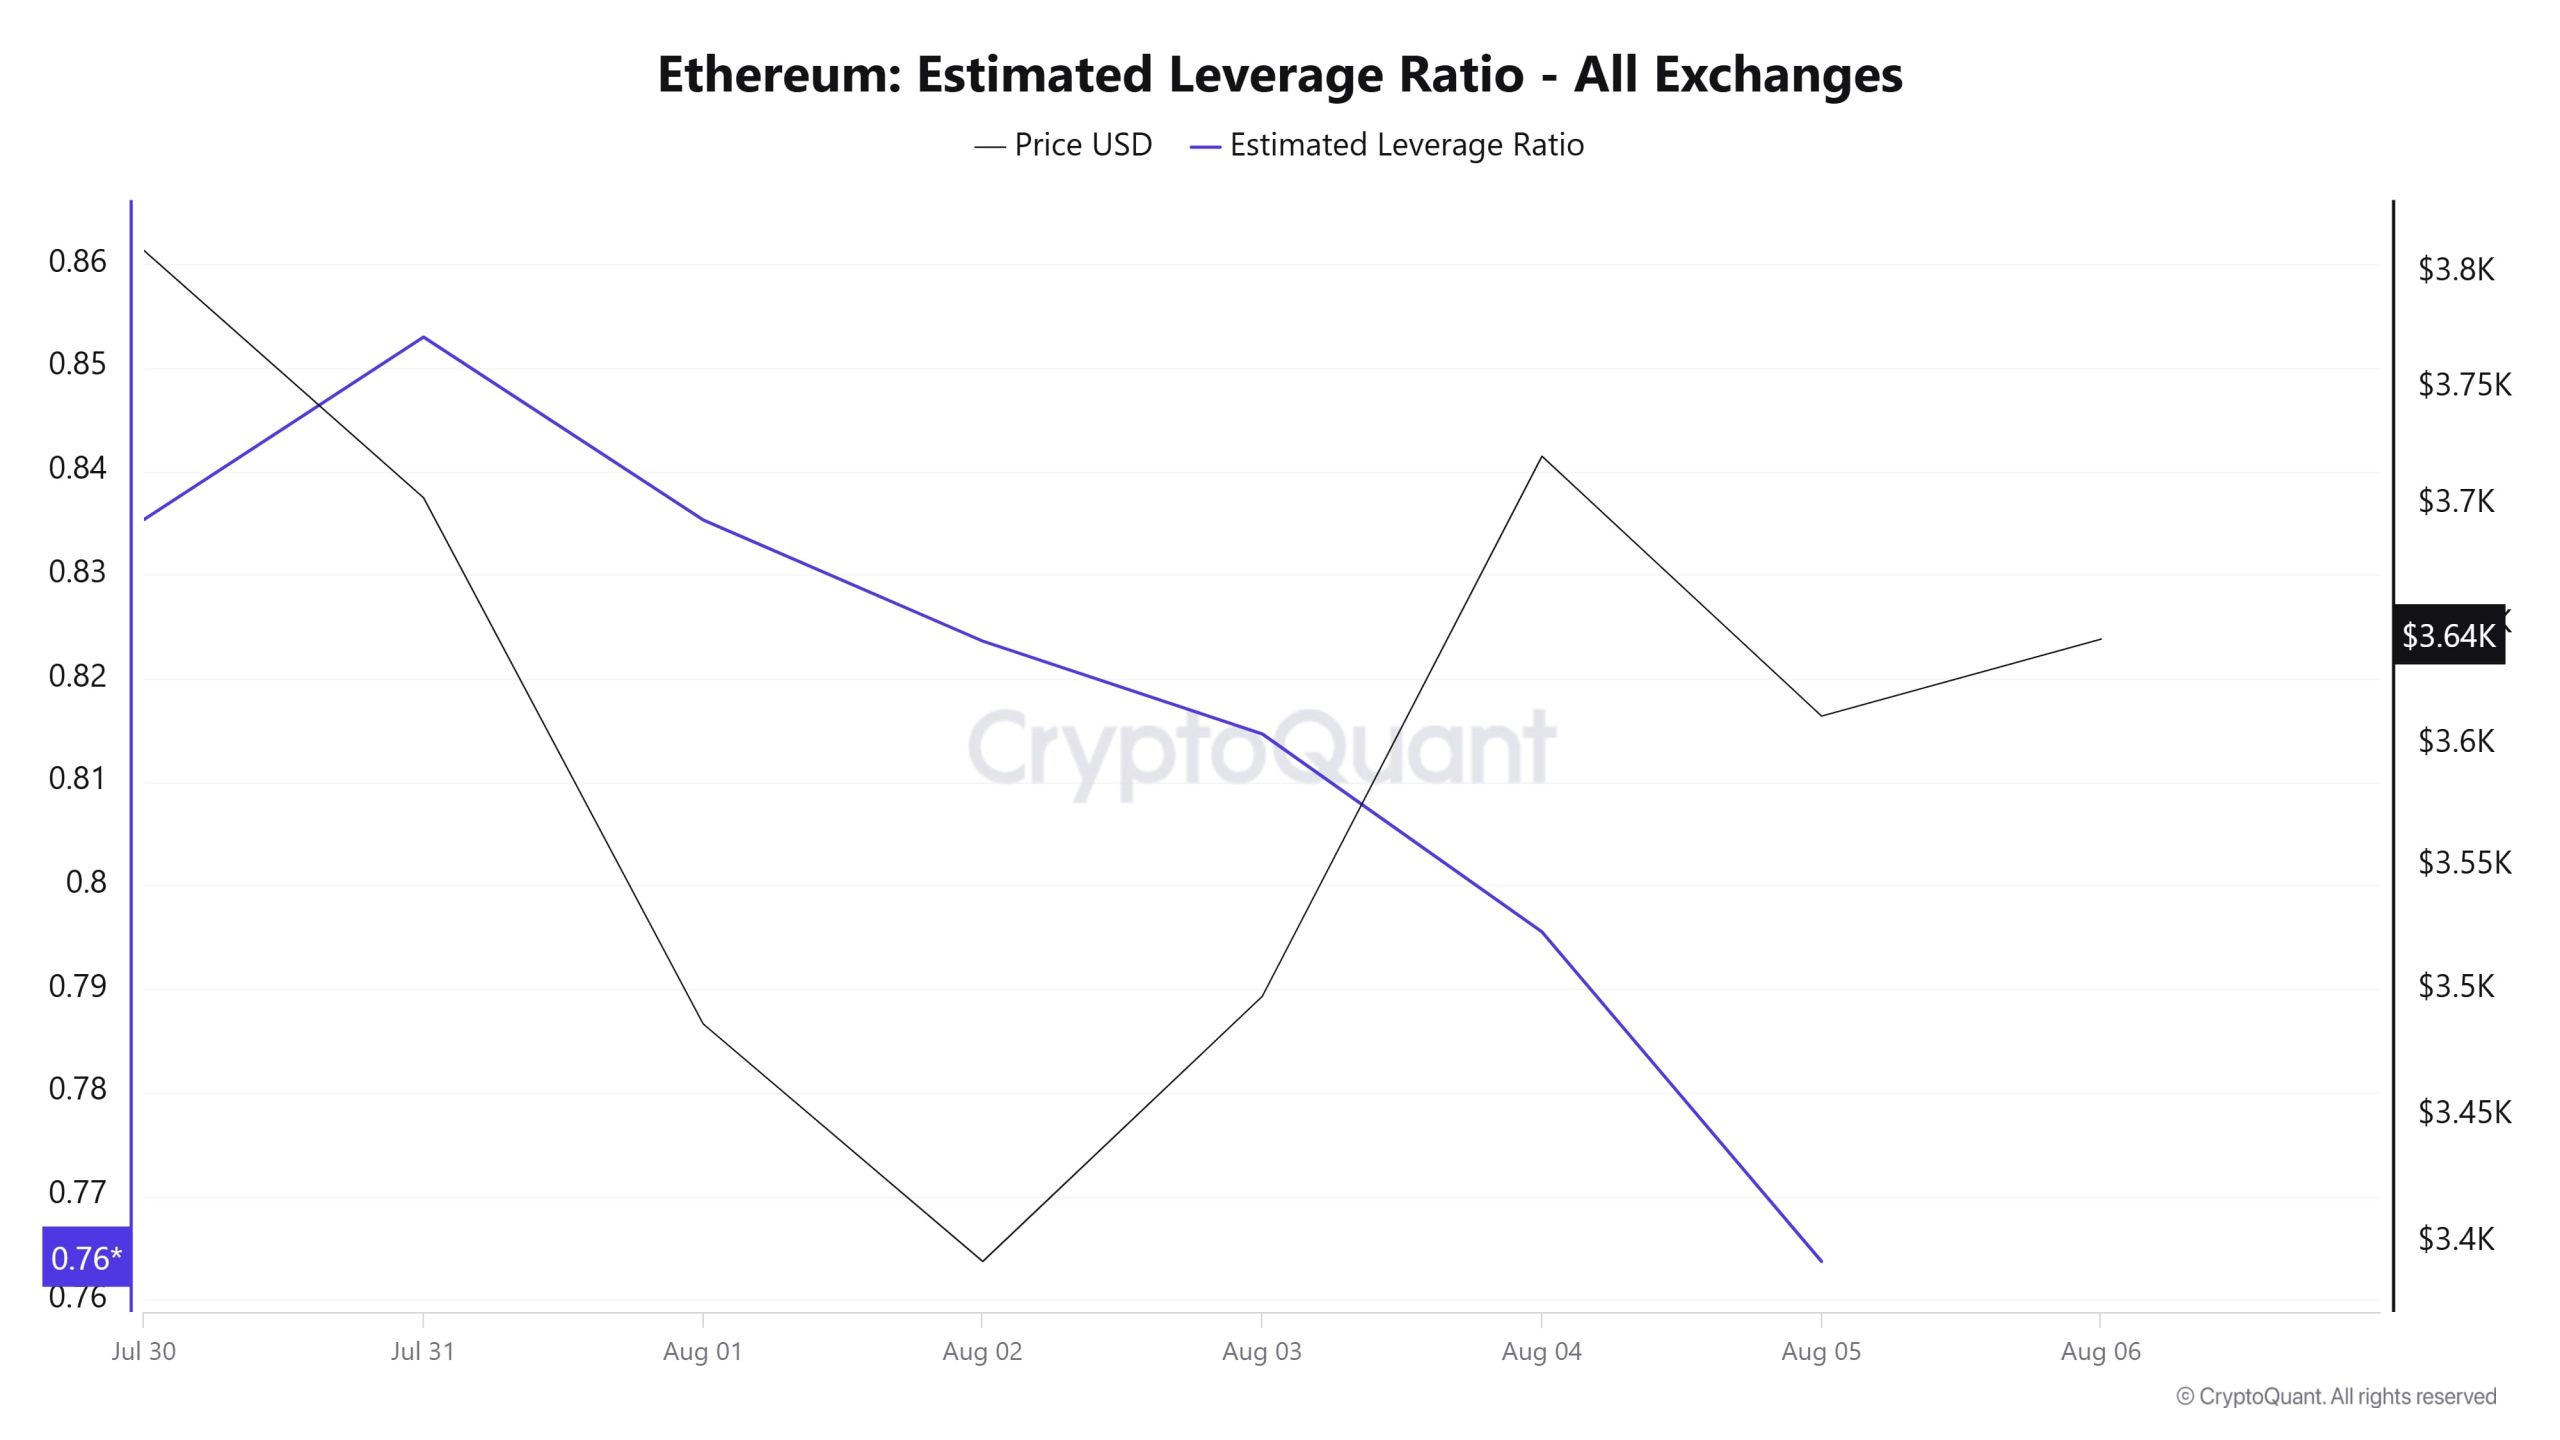
During the 7-day period, the metric generally declined. ELR (Estimated Leverage Ratio), which had a value of 0.835 at the beginning of the process, increased after the day and reached its highest value of 0.852 on Julio 31. After this point, the metric declined to 0.763 at the time of writing. A higher ELR means that participants are willing to assume more risk and generally indicates bullish conditions or expectations. It should be noted that these rallies can also be caused by dwindling reserves. When we look at Ethereum reserves, there were 19.03 million reserves at the beginning of the process, while this figure decreased during the rest of the process and is currently seen as 18.93 million. At the same time, Ethereum’s Open Interest is seen as 55.64 billion dollars at the beginning of the process. As of now, the volume decreased in the process and the open interest value stood out as 47.27 billion dollars. With all this data, the ELR metric has retreated for most of the process. The price of the asset, on the other hand, experienced the highest point of the process with all this data on Julio 31 and set it at $ 3,878. The lowest point was realized on Agosto 3 at $ 3,353. As of now, the risk appetite of investors and traders seems to have decreased. This was reflected in the ETH price, causing the price to remain flat at the moment. The decline in the ELR rate and the decrease in open interest throughout the process shows us that investors are hedging. As a result, the decline in reserves and open interest indicates that the market has lost its appetite and is on a bearish approach.
ETH Onchain En general
| Métrica | Positivo 📈 | Negativo 📉 | Neutro ➖ |
|---|---|---|---|
| Direcciones activas | ✓ | ||
| Valor total apostado | ✓ | ||
| Derivados | ✓ | ||
| Distribución de suministros | ✓ | ||
| Ratio de oferta de cambio | ✓ | ||
| Reserva de cambio | ✓ | ||
| Tasas e ingresos | ✓ | ||
| Bloques extraídos | ✓ | ||
| Transacción | ✓ | ||
| Ratio de apalancamiento estimado | ✓ |
*The metrics and guidance in the table do not, by themselves, describe or imply an expectation of future price changes for any asset. The prices of digital assets may vary depending on many different variables. The onchain analysis and related guidance are intended to assist investors in their decision-making process, and making financial investments based solely on the results of this analysis may result in harmful transactions. Even if all metrics produce a positive, negative or neutral result at the same time, the expected results may not be seen according to market conditions. Investors reviewing the report would be well advised to heed these caveats.
Aviso legal
La información sobre inversiones, los comentarios y las recomendaciones contenidas en este documento no constituyen servicios de asesoramiento en materia de inversiones. Los servicios de asesoramiento en materia de inversión son prestados por instituciones autorizadas a título personal, teniendo en cuenta las preferencias de riesgo y rentabilidad de los particulares. Los comentarios y recomendaciones contenidos en este documento son de tipo general. Estas recomendaciones pueden no ser adecuadas para su situación financiera y sus preferencias de riesgo y rentabilidad. Por lo tanto, tomar una decisión de inversión basándose únicamente en la información contenida en este documento puede no dar lugar a resultados acordes con sus expectativas.
NOTA: Todos los datos utilizados en el análisis de Ethereum onchain se basan en Cryptoqaunt.

