
Direcciones activas
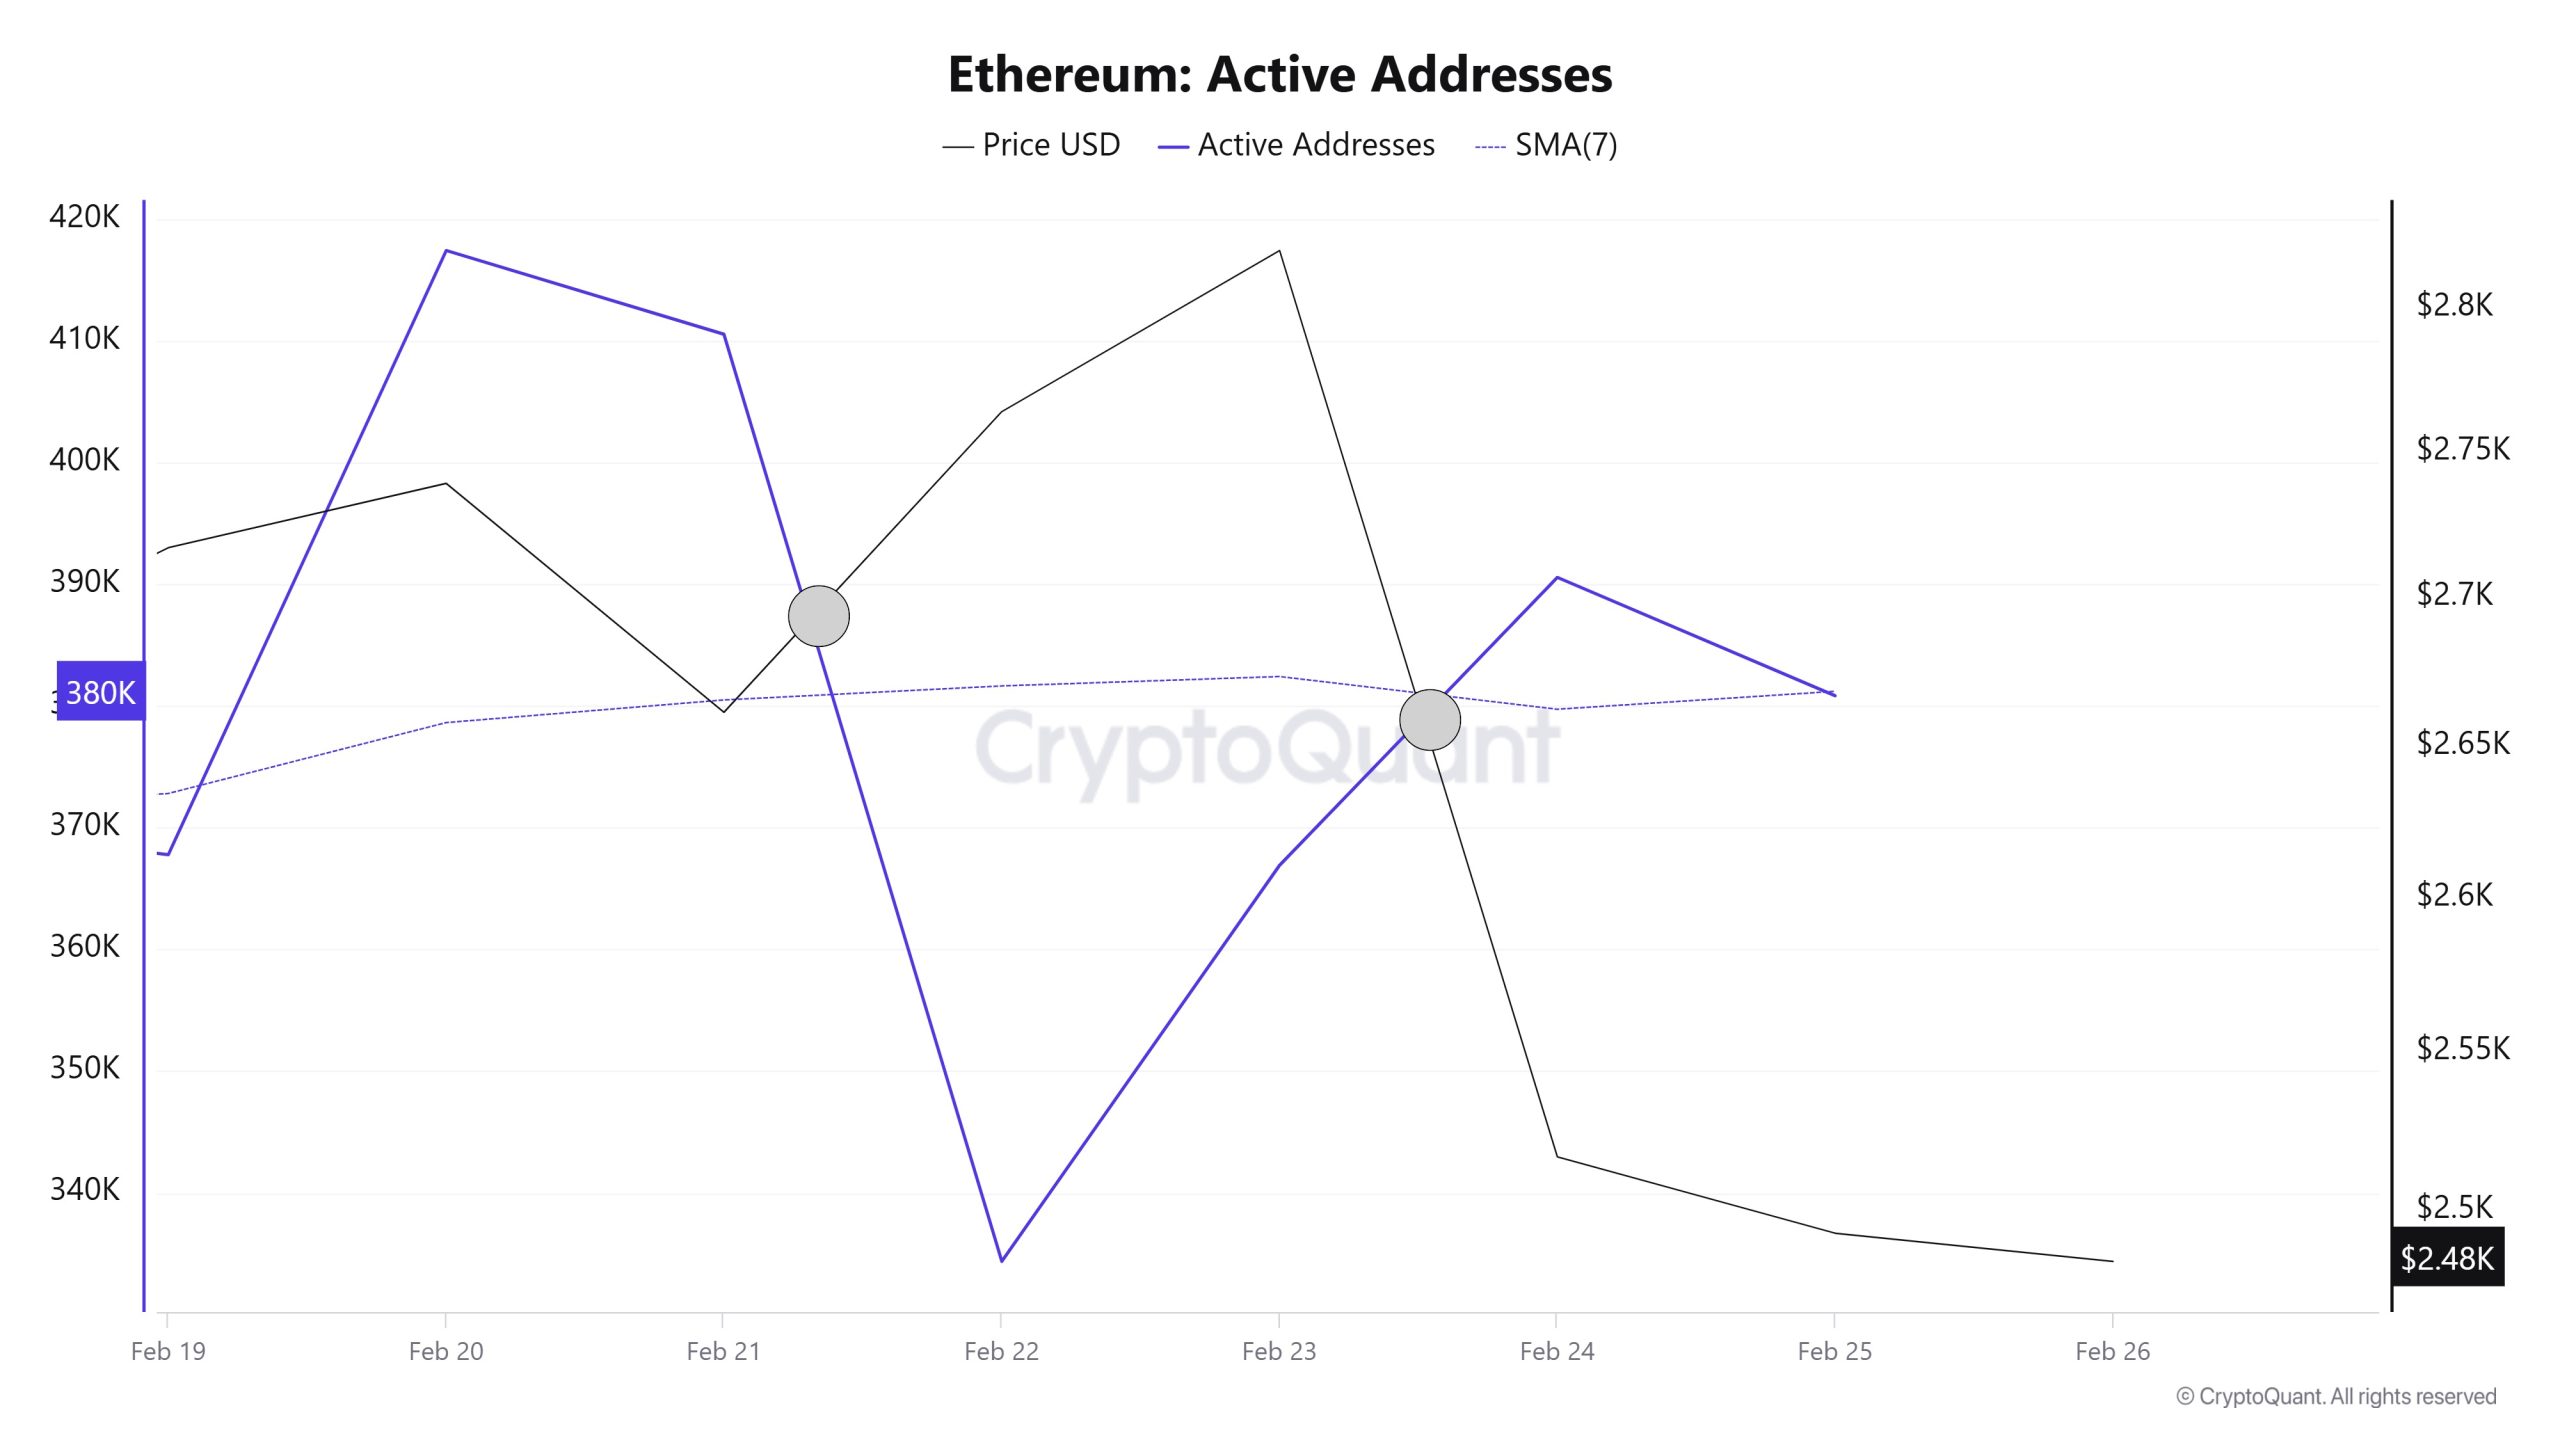 En cuanto al número de direcciones activas, se produjeron 417.394 inicios de sesión activos en la red ETH entre el 19 y el 26 de febrero de 2025, esta semana. Durante este periodo, Ethereum cayó de 2.738 a 2.516 dólares. En la región marcada en el gráfico, donde se cruzan el precio y el número de direcciones activas, las compras de Ethereum están disminuyendo gradualmente. Cuando seguimos la media móvil simple de 7 días, se observa que el precio sigue una tendencia a la baja en las fechas en las que esta media recorta el precio. Esta situación indica que el precio de Ethereum está experimentando entradas en los niveles de 2.738 $.
Direcciones de envío activas
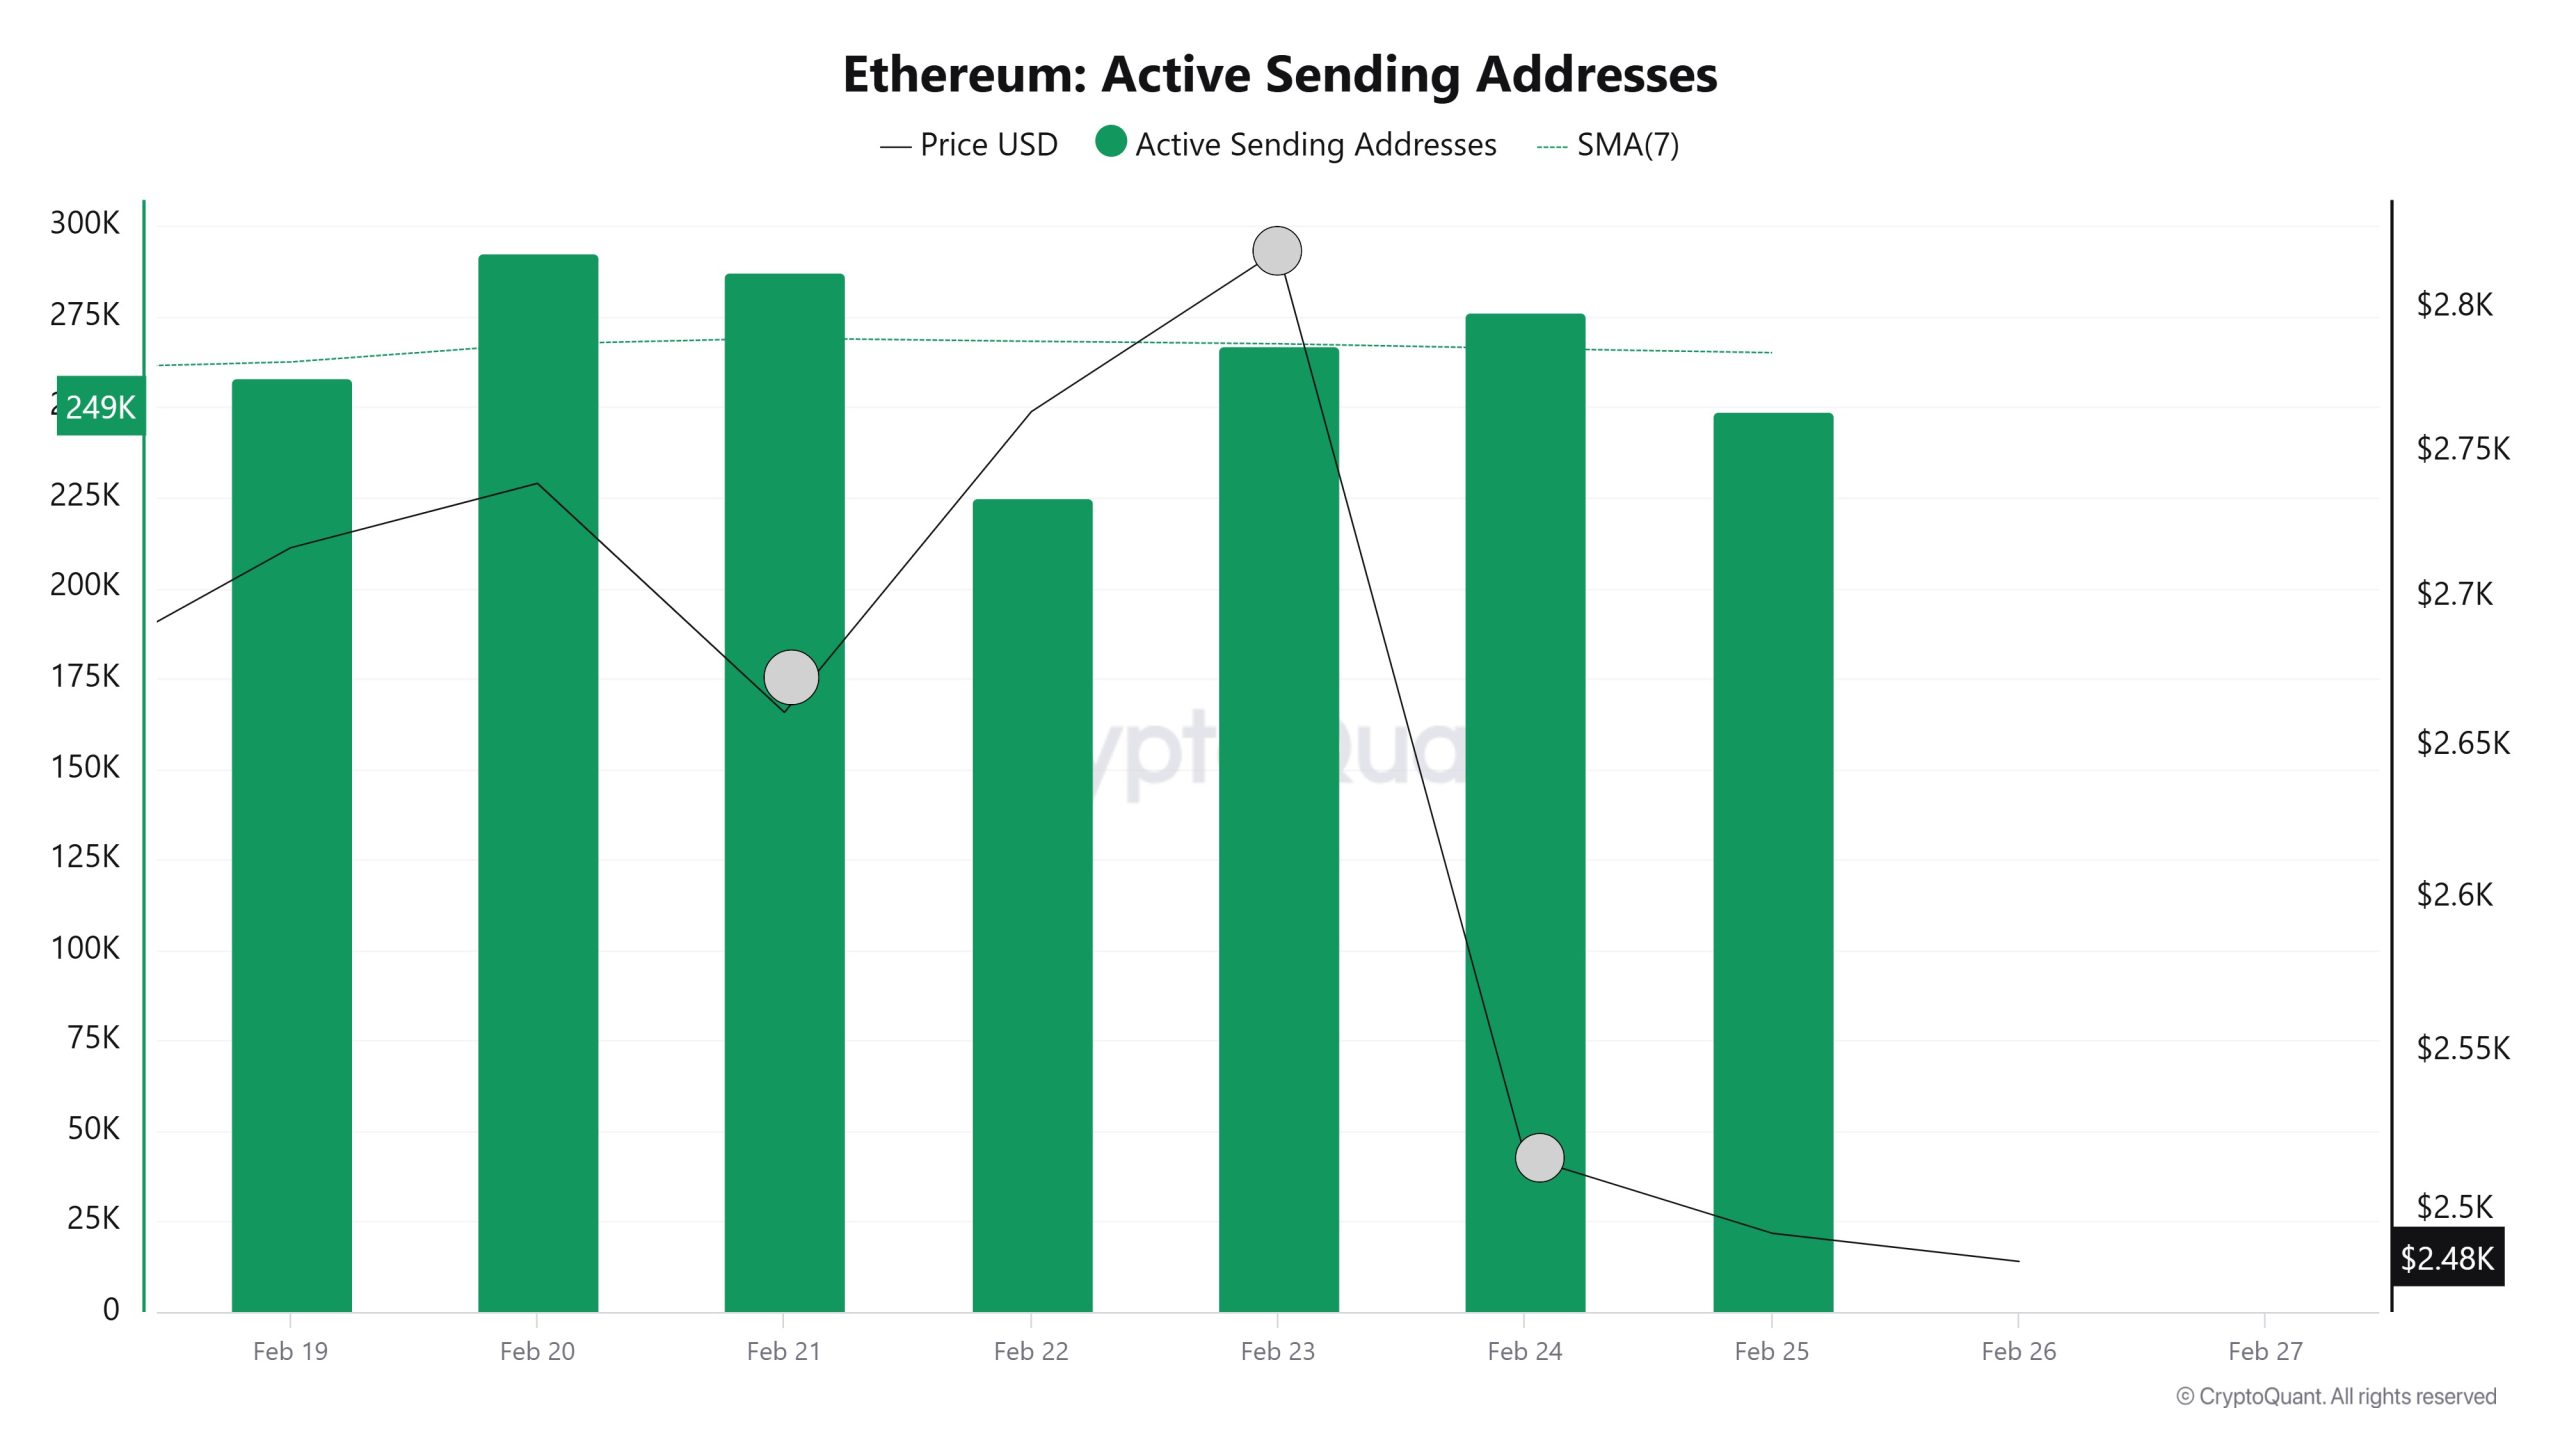
Con la línea negra (línea del precio) en direcciones de envío activas, se produjo una caída significativa de las direcciones de envío activas hacia el 21 de febrero. El día en que el precio alcanzó su punto más bajo, las direcciones de envío activas cayeron hasta 287.111 , lo que indica que los compradores vendieron sus posiciones ya que Ethereum se mantuvo en 2.661 durante un tiempo. Como resultado, se observa que las caídas del precio provocan una aceleración de las direcciones de envío.
Direcciones receptoras activas
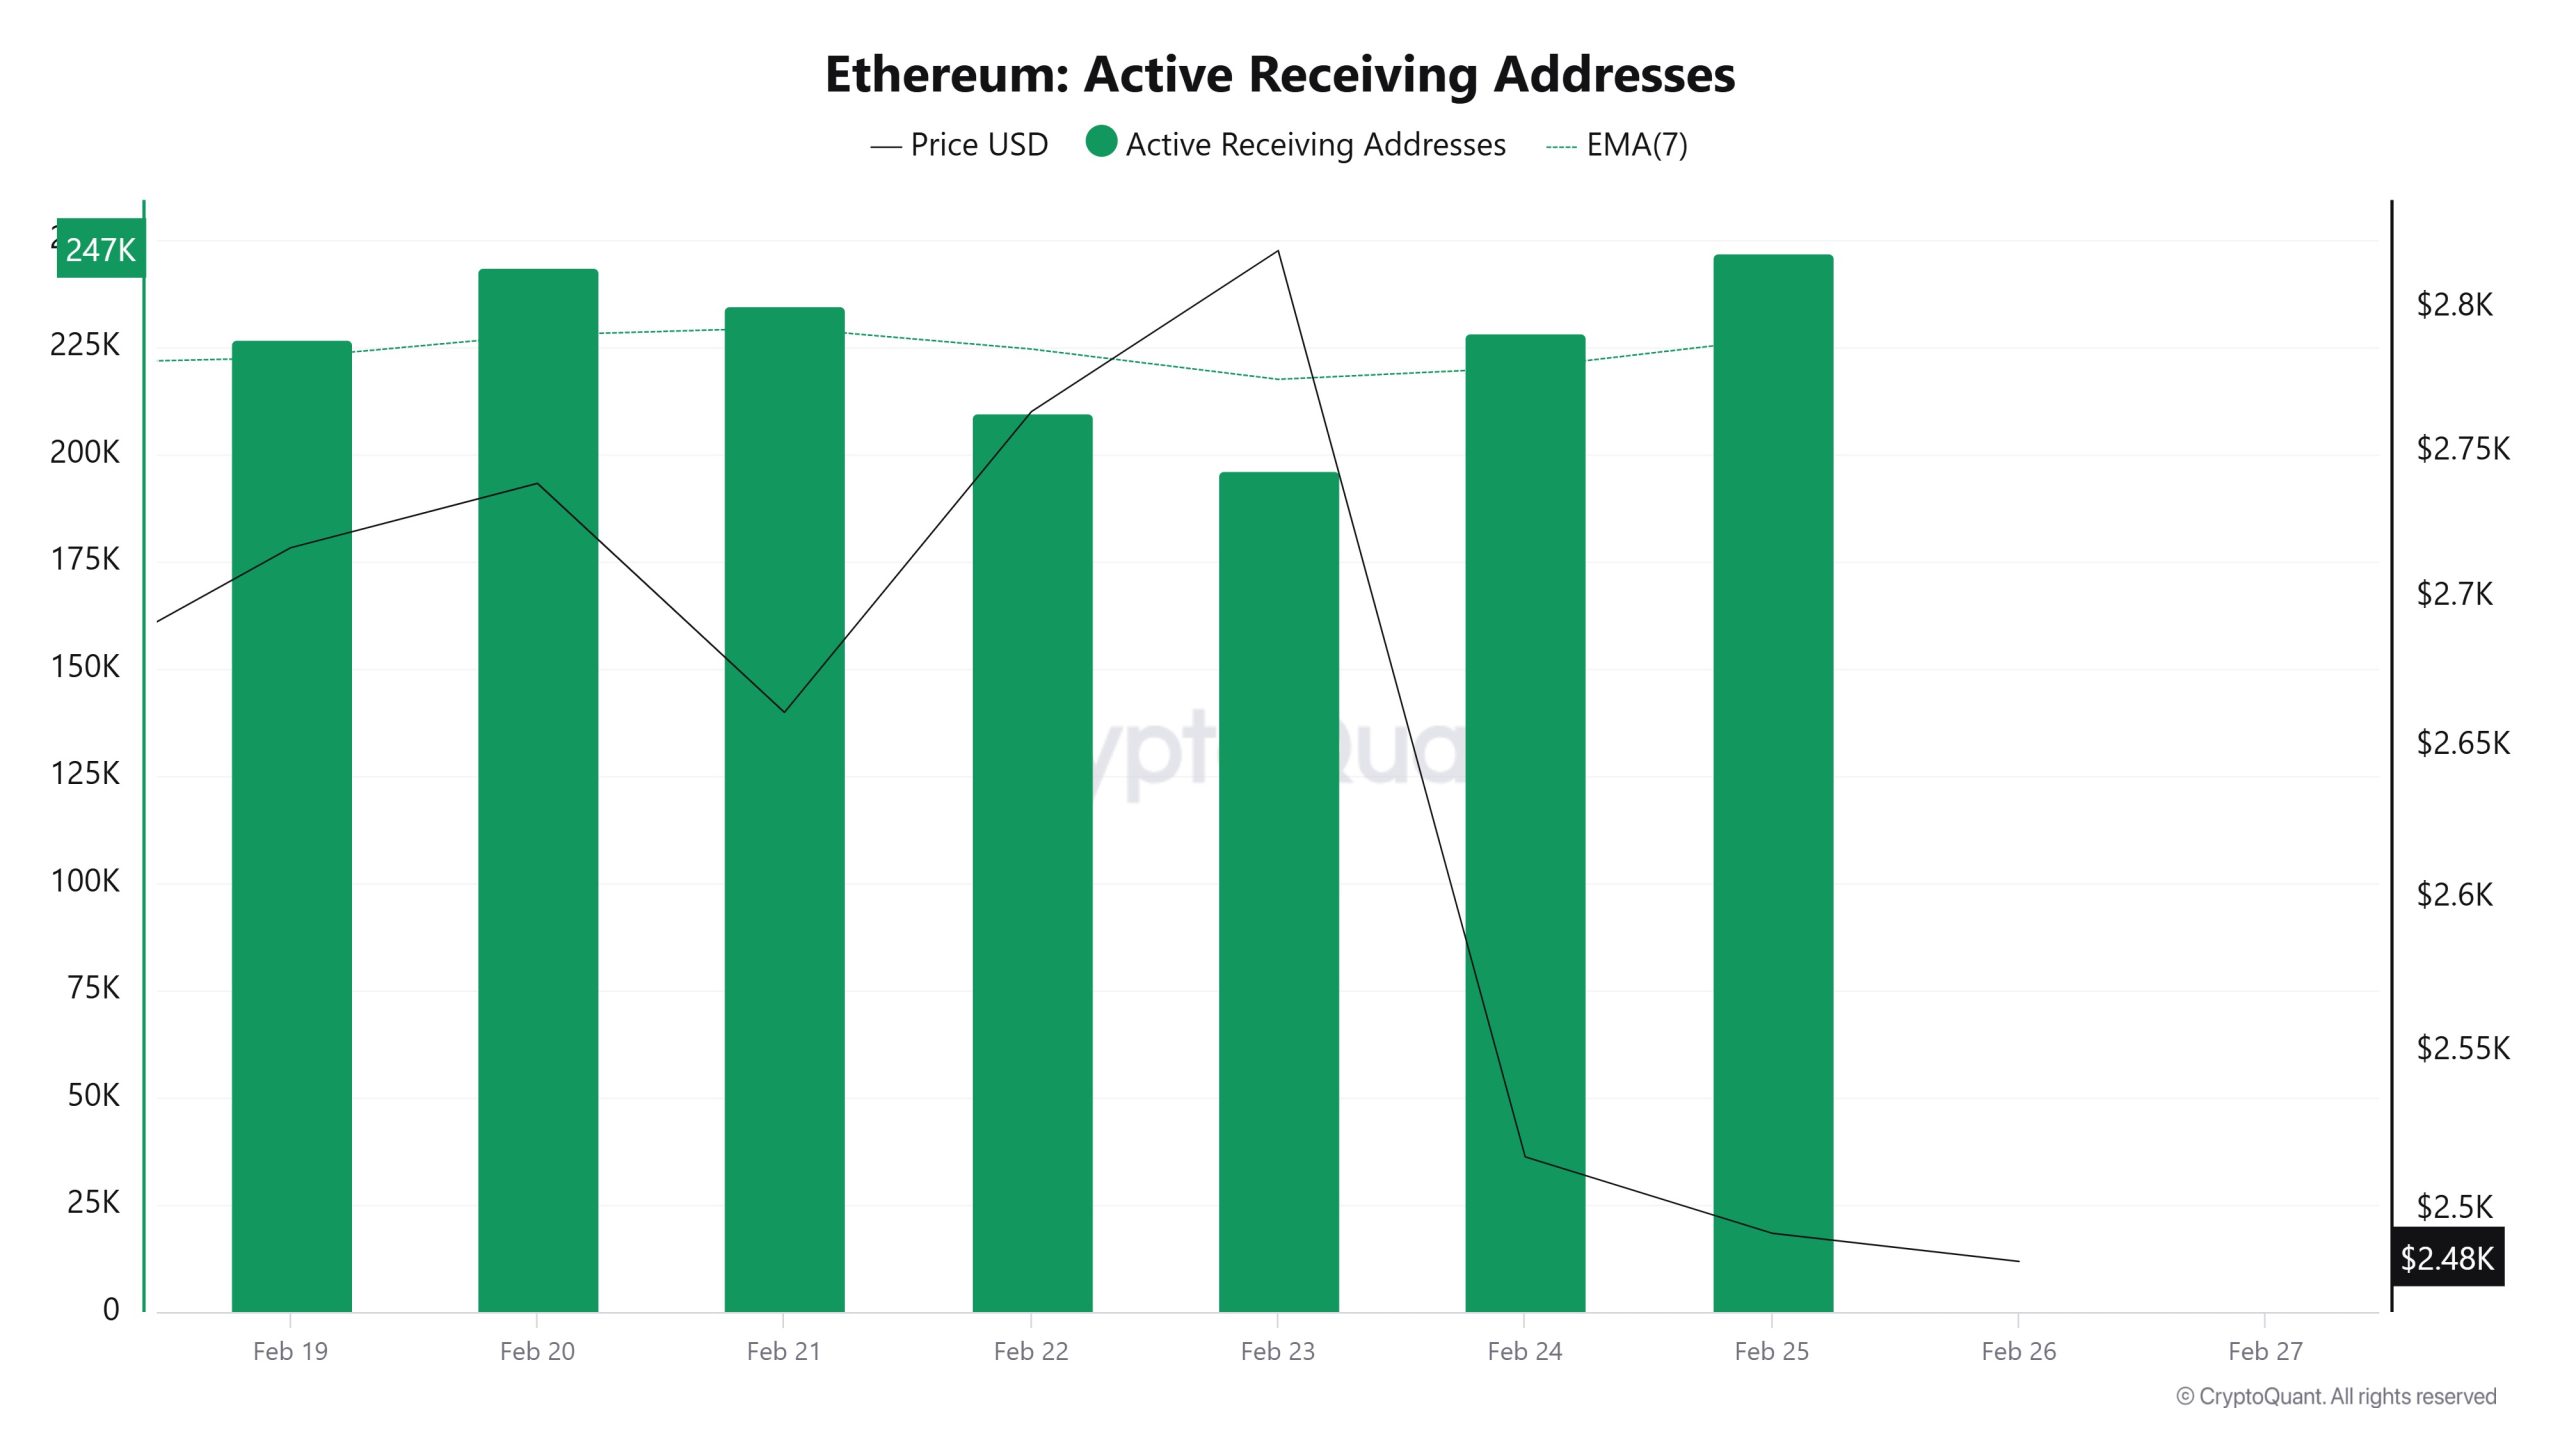
En las direcciones de los compradores activos, parece que el 23 de febrero, cuando el precio estaba en 2.738, el número de compradores se acercó a los niveles más altos de 243.576, y el nivel más largo de compra se situó en el nivel en el que los inversores fueron a aumentar sus posiciones en Ethereum. Esto puede indicar los niveles de coste de los compradores antes de que suba el precio.
Valor total apostado
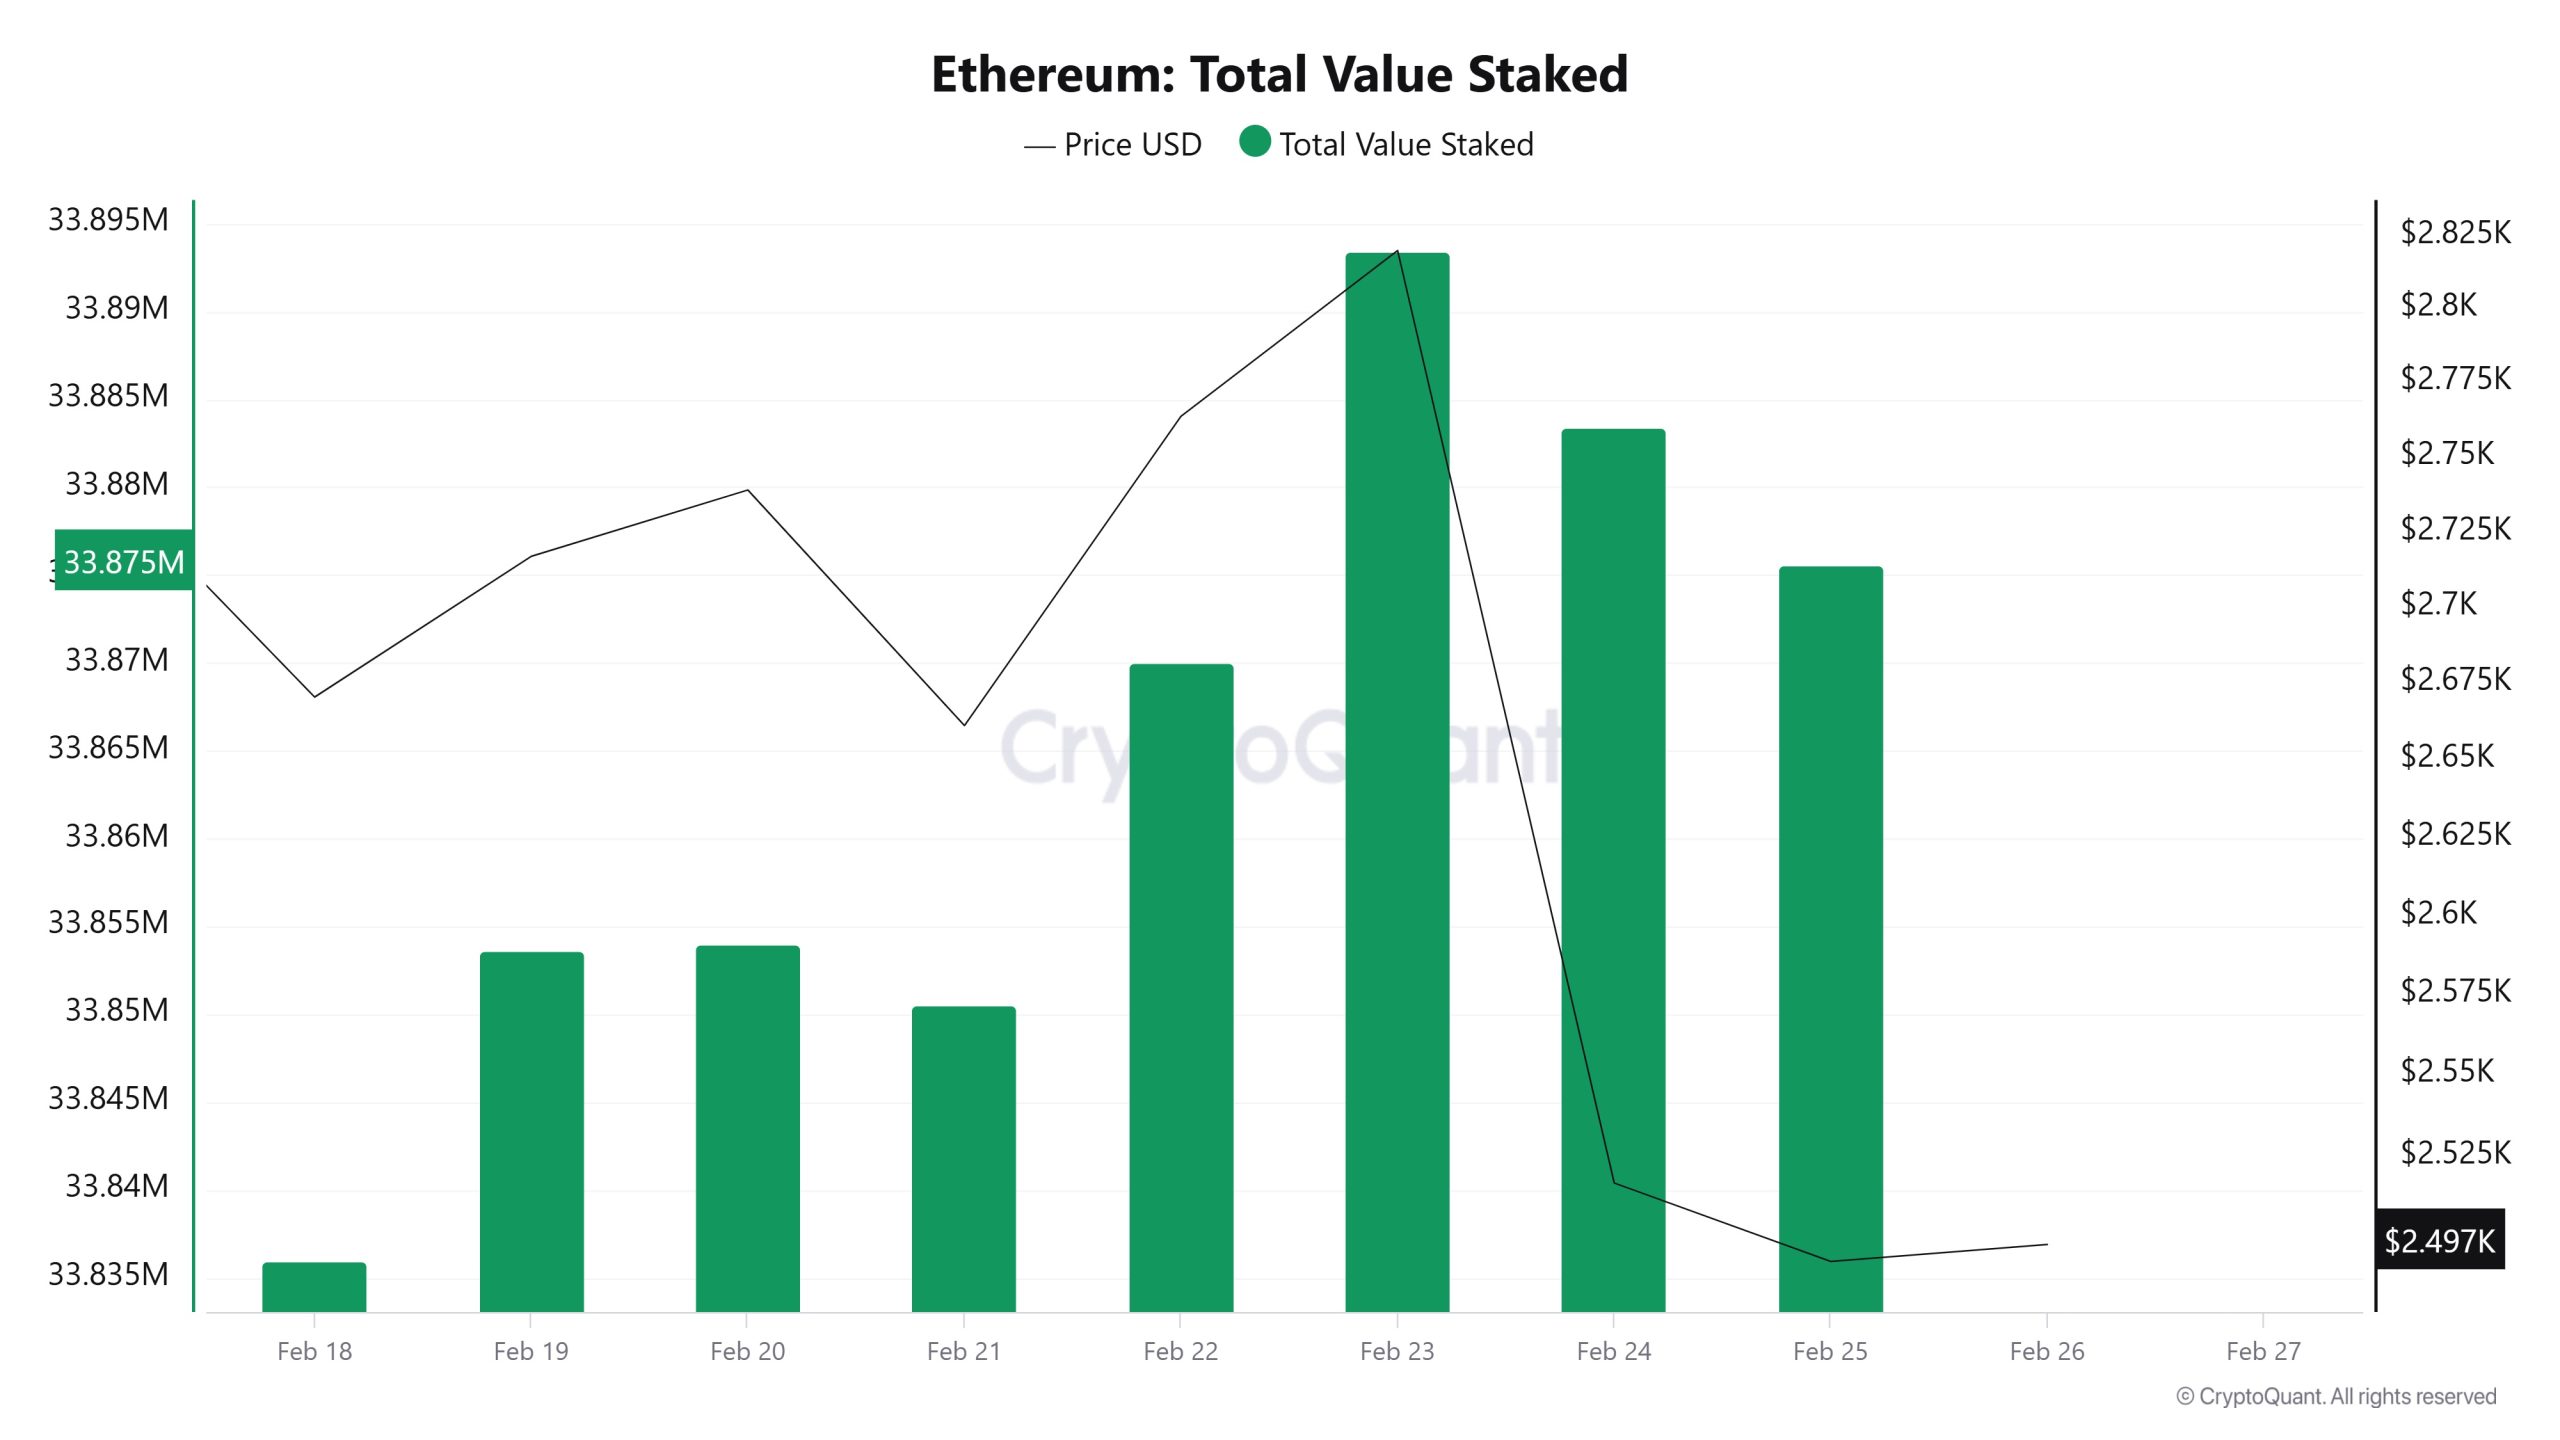
El 19 de febrero, el precio de ETH era de 2.716 mientras que Total Value Staked Ratio era de 33.853. El 25 de febrero, el precio de ETH bajó a 2.492 mientras que Total Value Staked Ratio fue de 33.875. En comparación con la semana pasada, el precio de ETH bajó un 8,25% mientras que Total Value Staked Ratio aumentó un 0,065%.
Entradas en juego
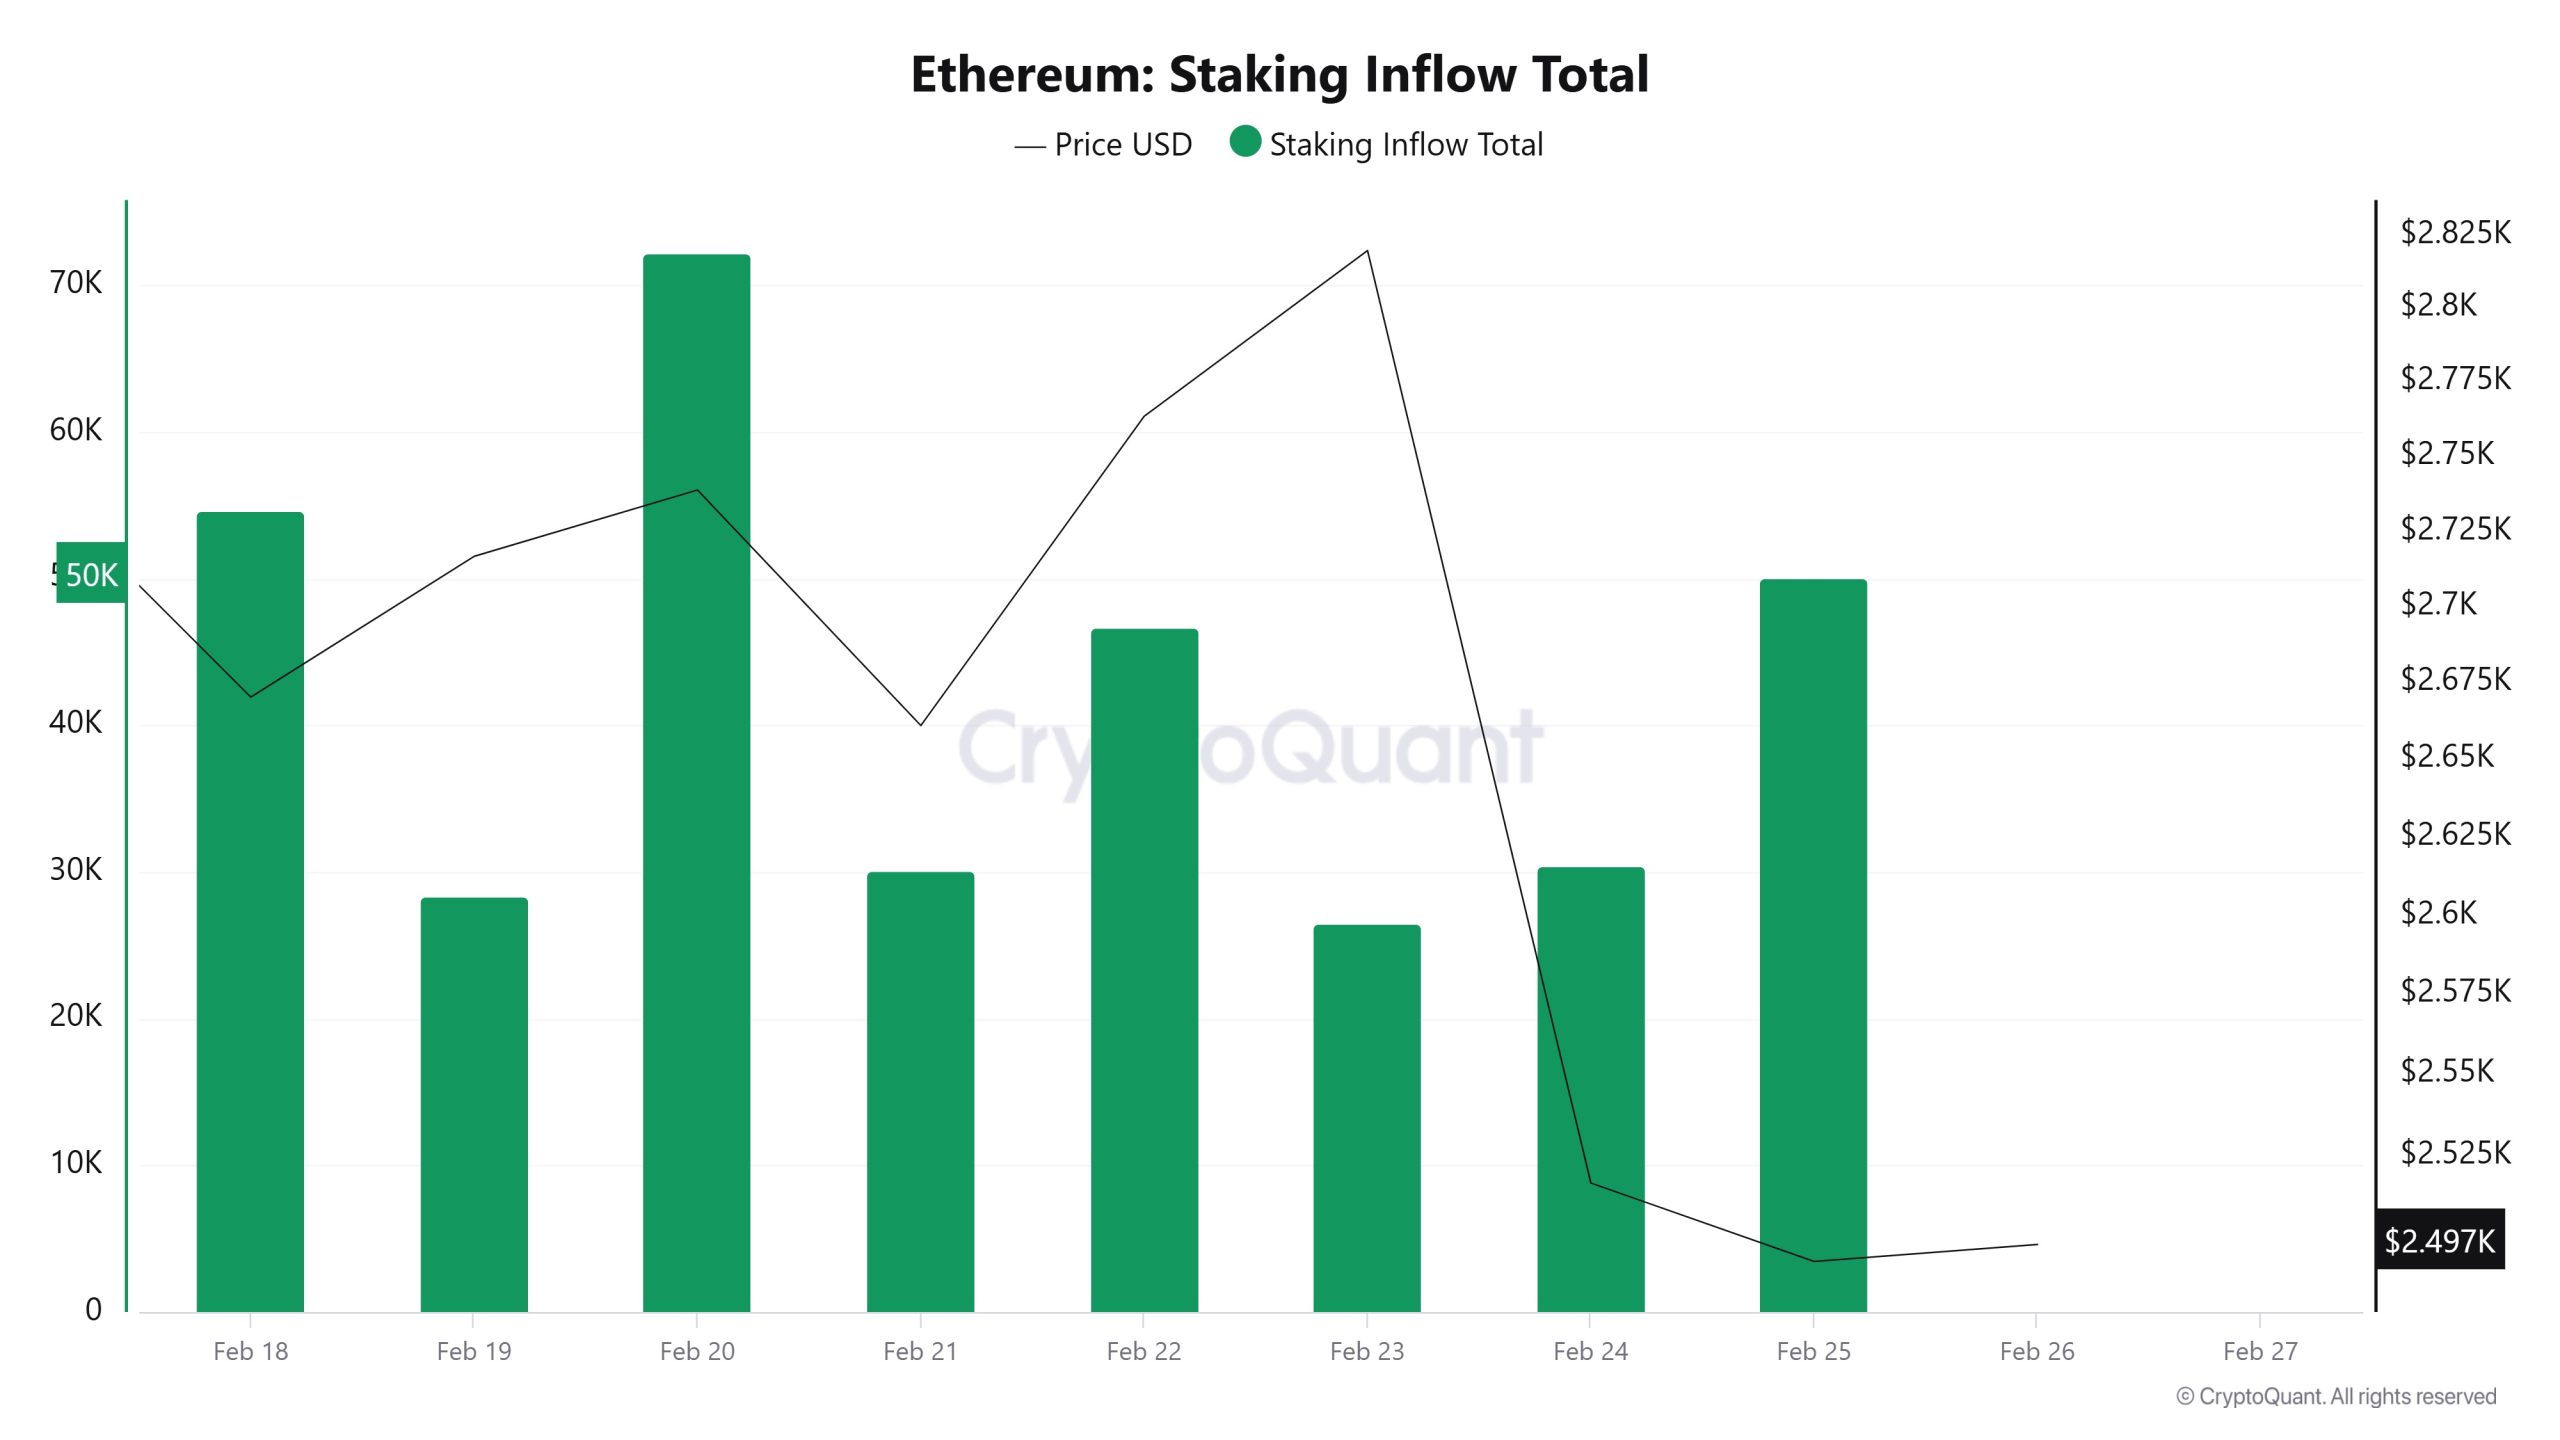
El 19 de febrero, el precio de ETH era de 2.716 mientras que el Staking Inflow Ratio era de 28.397. El 25 de febrero, el precio de ETH bajó a 2,492 mientras que el Staking Inflow Ratio fue de 50,045. En comparación con la semana pasada, el precio de ETH disminuyó un 8,25% y el Staking Inflow Ratio aumentó un 76,2%.
Derivados
Interés abierto
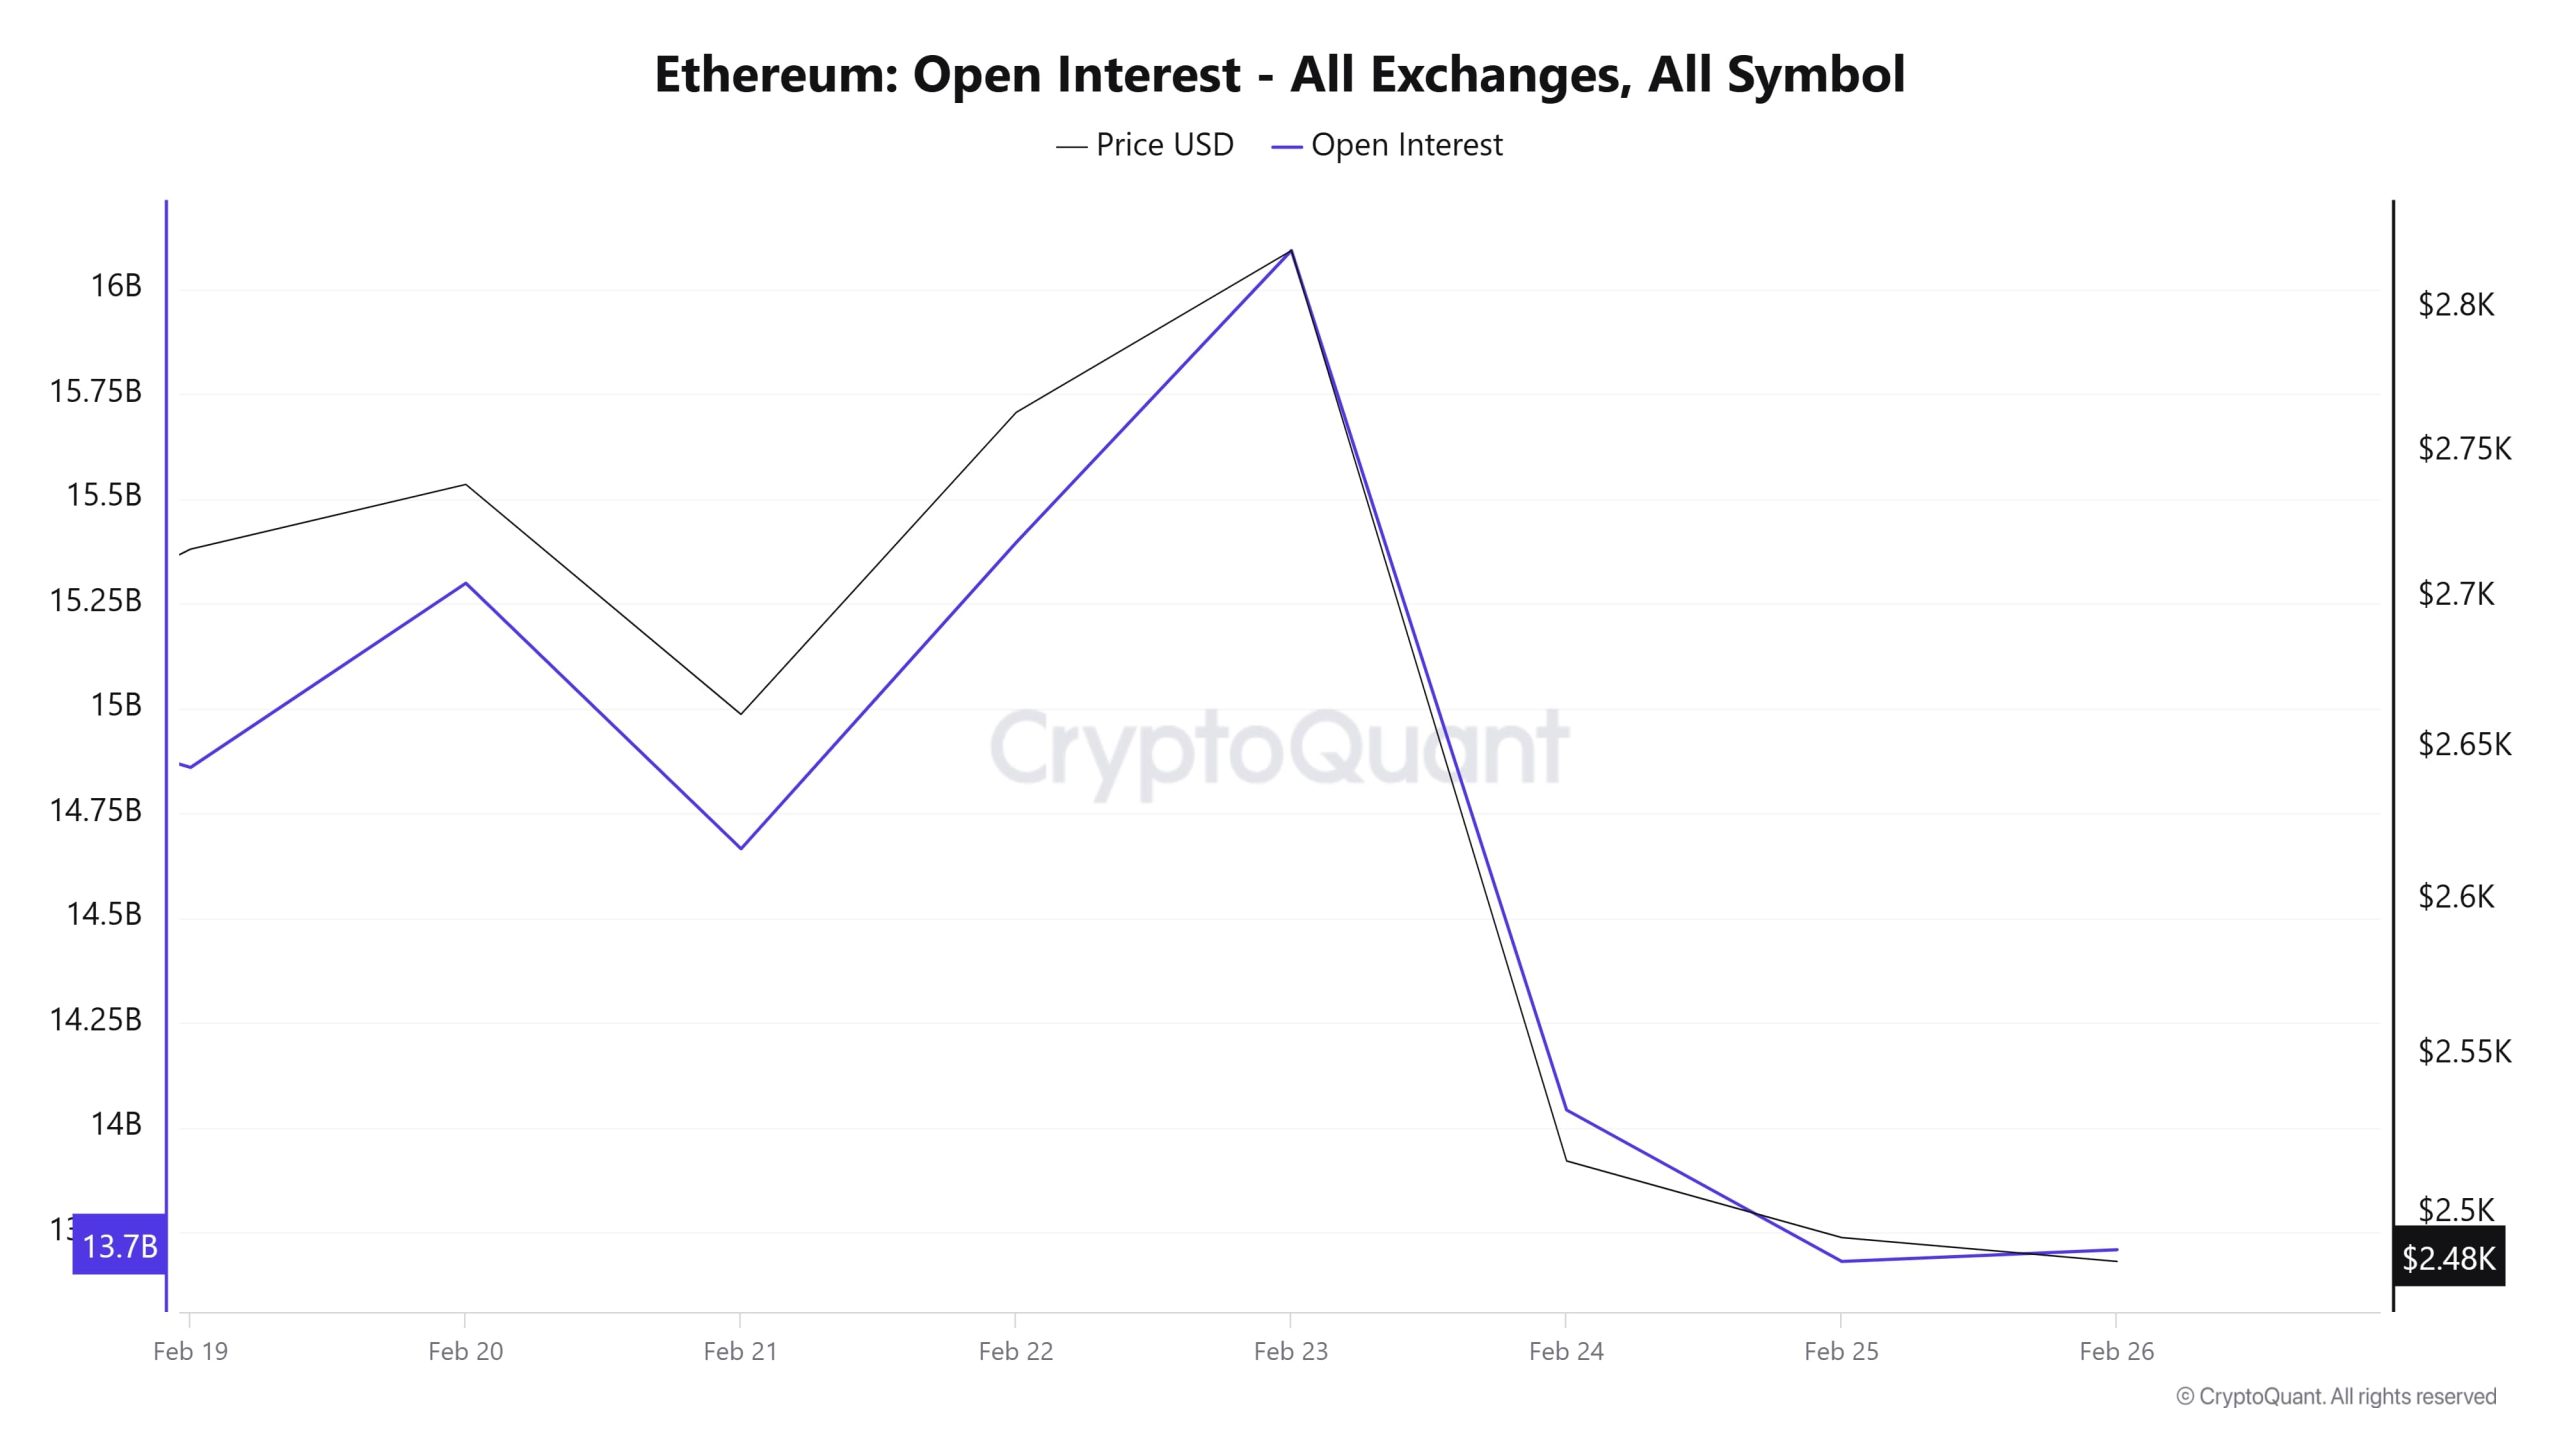
El interés abierto de Ethereum comenzó en 14.800 millones de dólares el 19 de febrero. El 20 de febrero subió, alcanzando los 15.200 millones de dólares. Sin embargo, hubo un cierto descenso el 21 de febrero y el interés abierto cayó a 14.700 millones de dólares. A partir del 22 de febrero, el interés abierto empezó a subir de nuevo y alcanzó su punto máximo el 23 de febrero, llegando a superar los 16.000 millones de dólares. El 24 de febrero, el hackeo de Bybit desencadenó un fuerte descenso y el interés abierto disminuyó rápidamente, cayendo significativamente el 25 de febrero.
A partir del 26 de febrero, el interés abierto alcanzó un mínimo de 2,48K. En general, existe una fuerte correlación entre el interés abierto y el precio durante la semana, con un fuerte descenso especialmente desde el 24 de febrero. Estos movimientos indican que los cambios repentinos en la dinámica del mercado y la alta volatilidad son efectivos.
Tasa de financiación
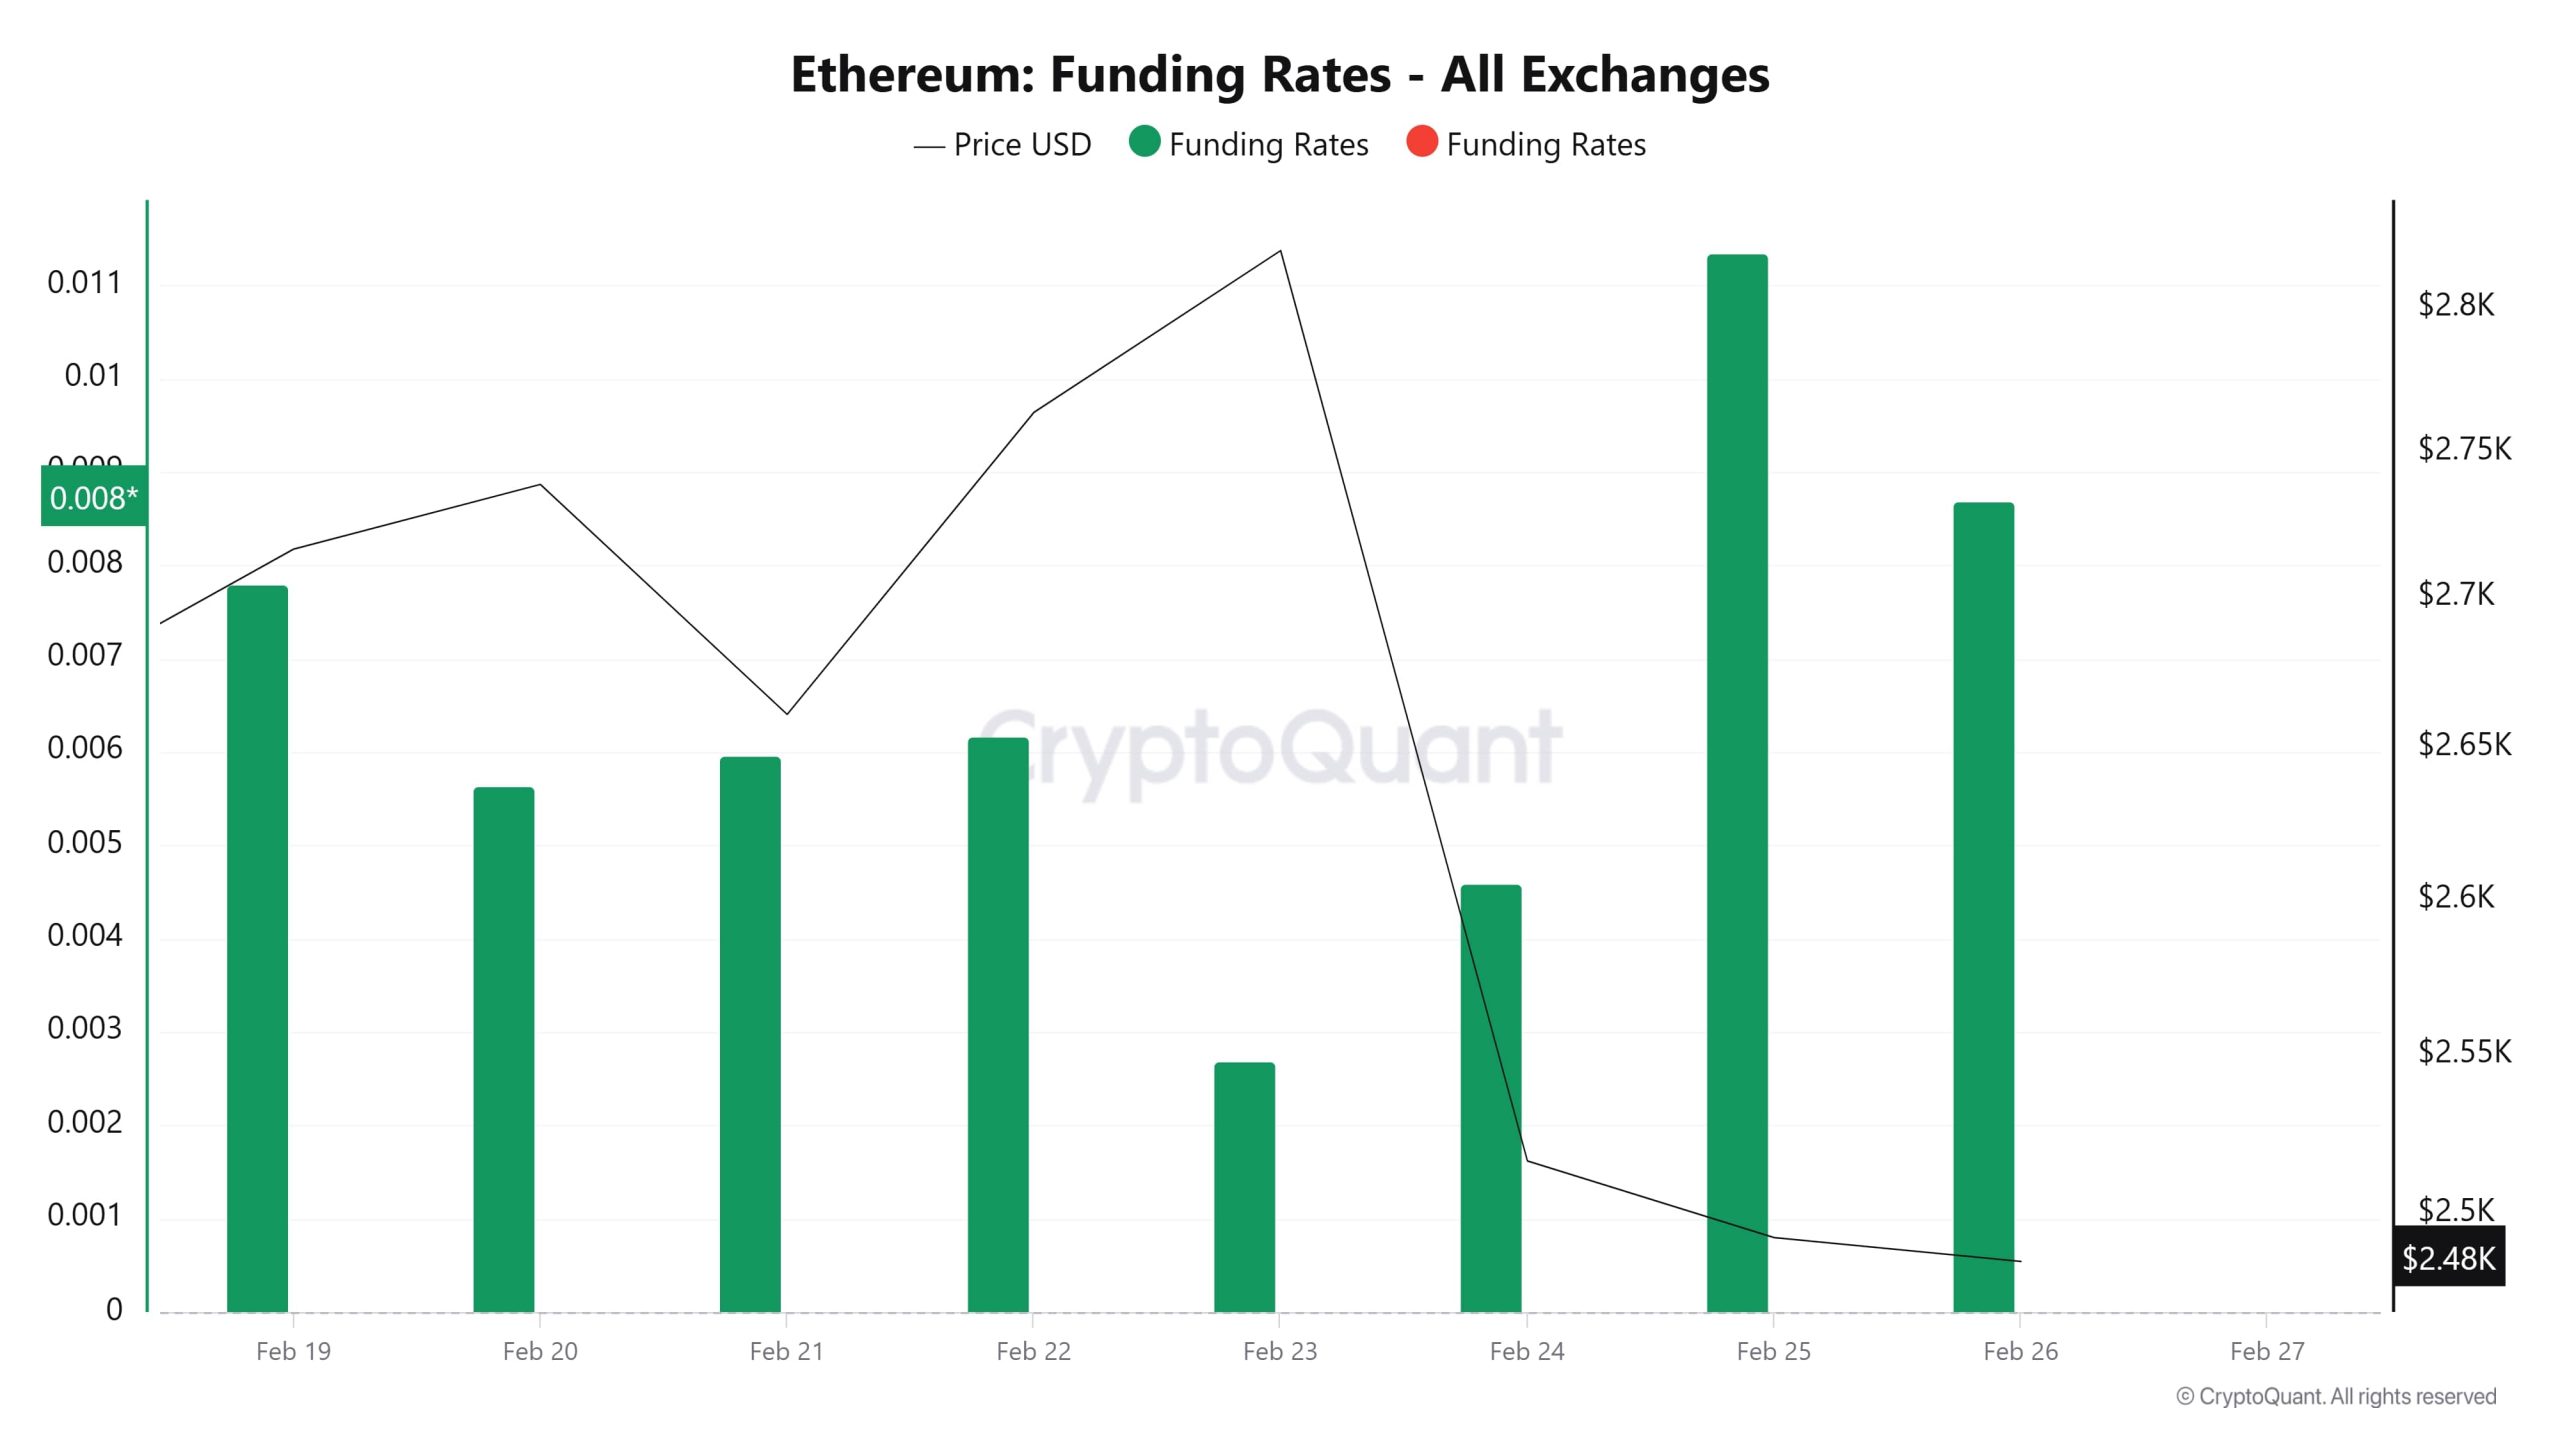
Los índices de financiación de Ethereum son generalmente positivos, lo que indica que predominan las posiciones largas. Aunque el índice de financiación y el precio fluctuaron entre el 19 y el 23 de febrero, a partir del 24 de febrero, el índice de financiación disminuyó junto con la caída del precio. Esto sugiere que las posiciones cortas están aumentando y que el mercado se enfrenta a una presión vendedora.
Aunque el tipo de financiación volvió a subir los días 25 y 26 de febrero, el precio se mantuvo en niveles bajos. Esto sugiere que los inversores ven el descenso como una oportunidad de compra, aunque las posiciones excesivamente apalancadas pueden aumentar el riesgo de liquidación.
Liquidaciones largas y cortas
El precio de ETH, que ha estado en una banda estrecha durante mucho tiempo, cayó bruscamente a 2.368 tras el hackeo de la cartera Bybit. Con este movimiento del precio, se liquidó un nivel muy alto de posiciones largas y cortas. En total, se liquidaron 277 millones de dólares de posiciones largas y 240 millones de dólares de posiciones cortas.
Importes largos vs cortos
| Fecha | Largo Importe (Millones $) | Corto Importe (Millones $) |
|---|---|---|
| 20 de enero | 10.84 | 14.05 |
| 21 de enero | 54.33 | 118.34 |
| 22 de enero | 5.18 | 14.70 |
| 23 de enero | 8.17 | 23.64 |
| 24 de enero | 84.28 | 12.11 |
| 25 de enero | 106.61 | 55.09 |
| 26 de enero | 8.36 | 2.66 |
| Total | 277.77 | 240.59 |
Distribución de suministros
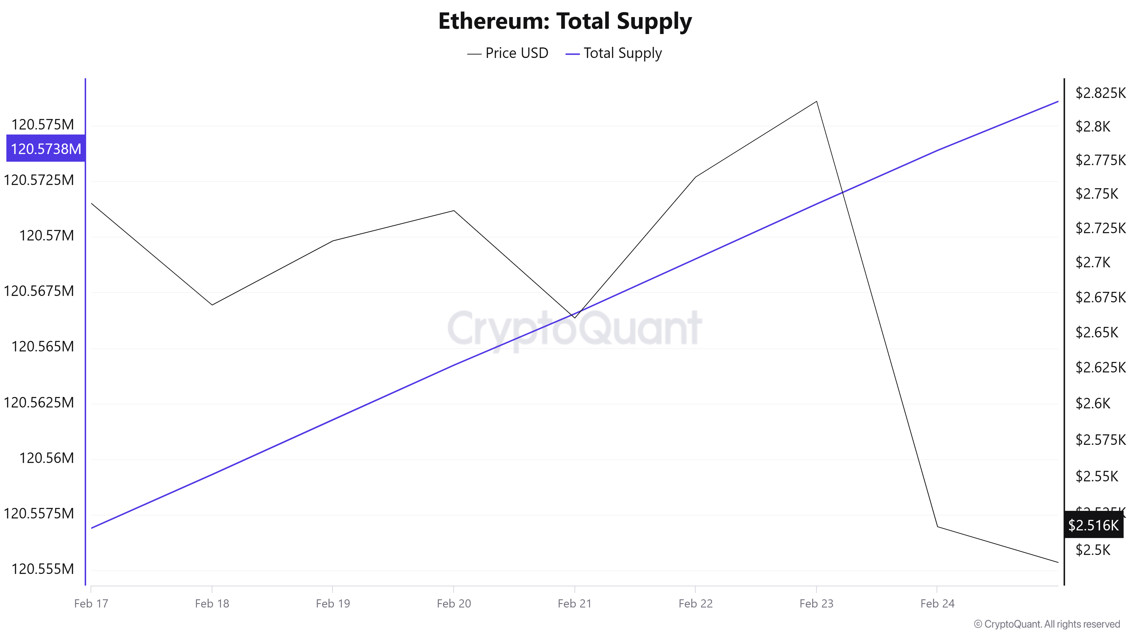
Oferta total: Alcanzó las 120.574.885 unidades, un 0,013% más que la semana pasada.
Nuevo suministro: La cantidad de ETH producida esta semana fue de 15.575.
Velocidad: La velocidad, que era de 7,49 la semana pasada, era de 7,56 el 24 de febrero.
| Categoría de carteras | 17.02.2025 | 24.02.2025 | Cambio (%) |
|---|---|---|---|
| 100 - 1k ETH | 9.5078M | 9.4311M | -0.81% |
| 1k - 10k ETH | 12.6109M | 12.6353M | 0.19% |
| 10k - 100k ETH | 16.9121M | 17.3297M | 2.47% |
| 100k+ ETH | 4.5869M | 4.7562M | 3.69% |
Hubo cambios notables en la distribución de Ethereum según el tamaño de los monederos. Mientras que se produjo un descenso del -0,81% en el número de ethereum en la categoría de 100 - 1K ETH, hubo un aumento limitado del 0,19% en la categoría de 1K - 10K ETH. Los grandes inversores en el rango de 10K - 100K ETH aumentaron sus tenencias en un 2,47%, mientras que el segmento de 100K+ ETH, que representa a las mayores ballenas, experimentó un notable crecimiento del 3,69%.
Reserva de cambio
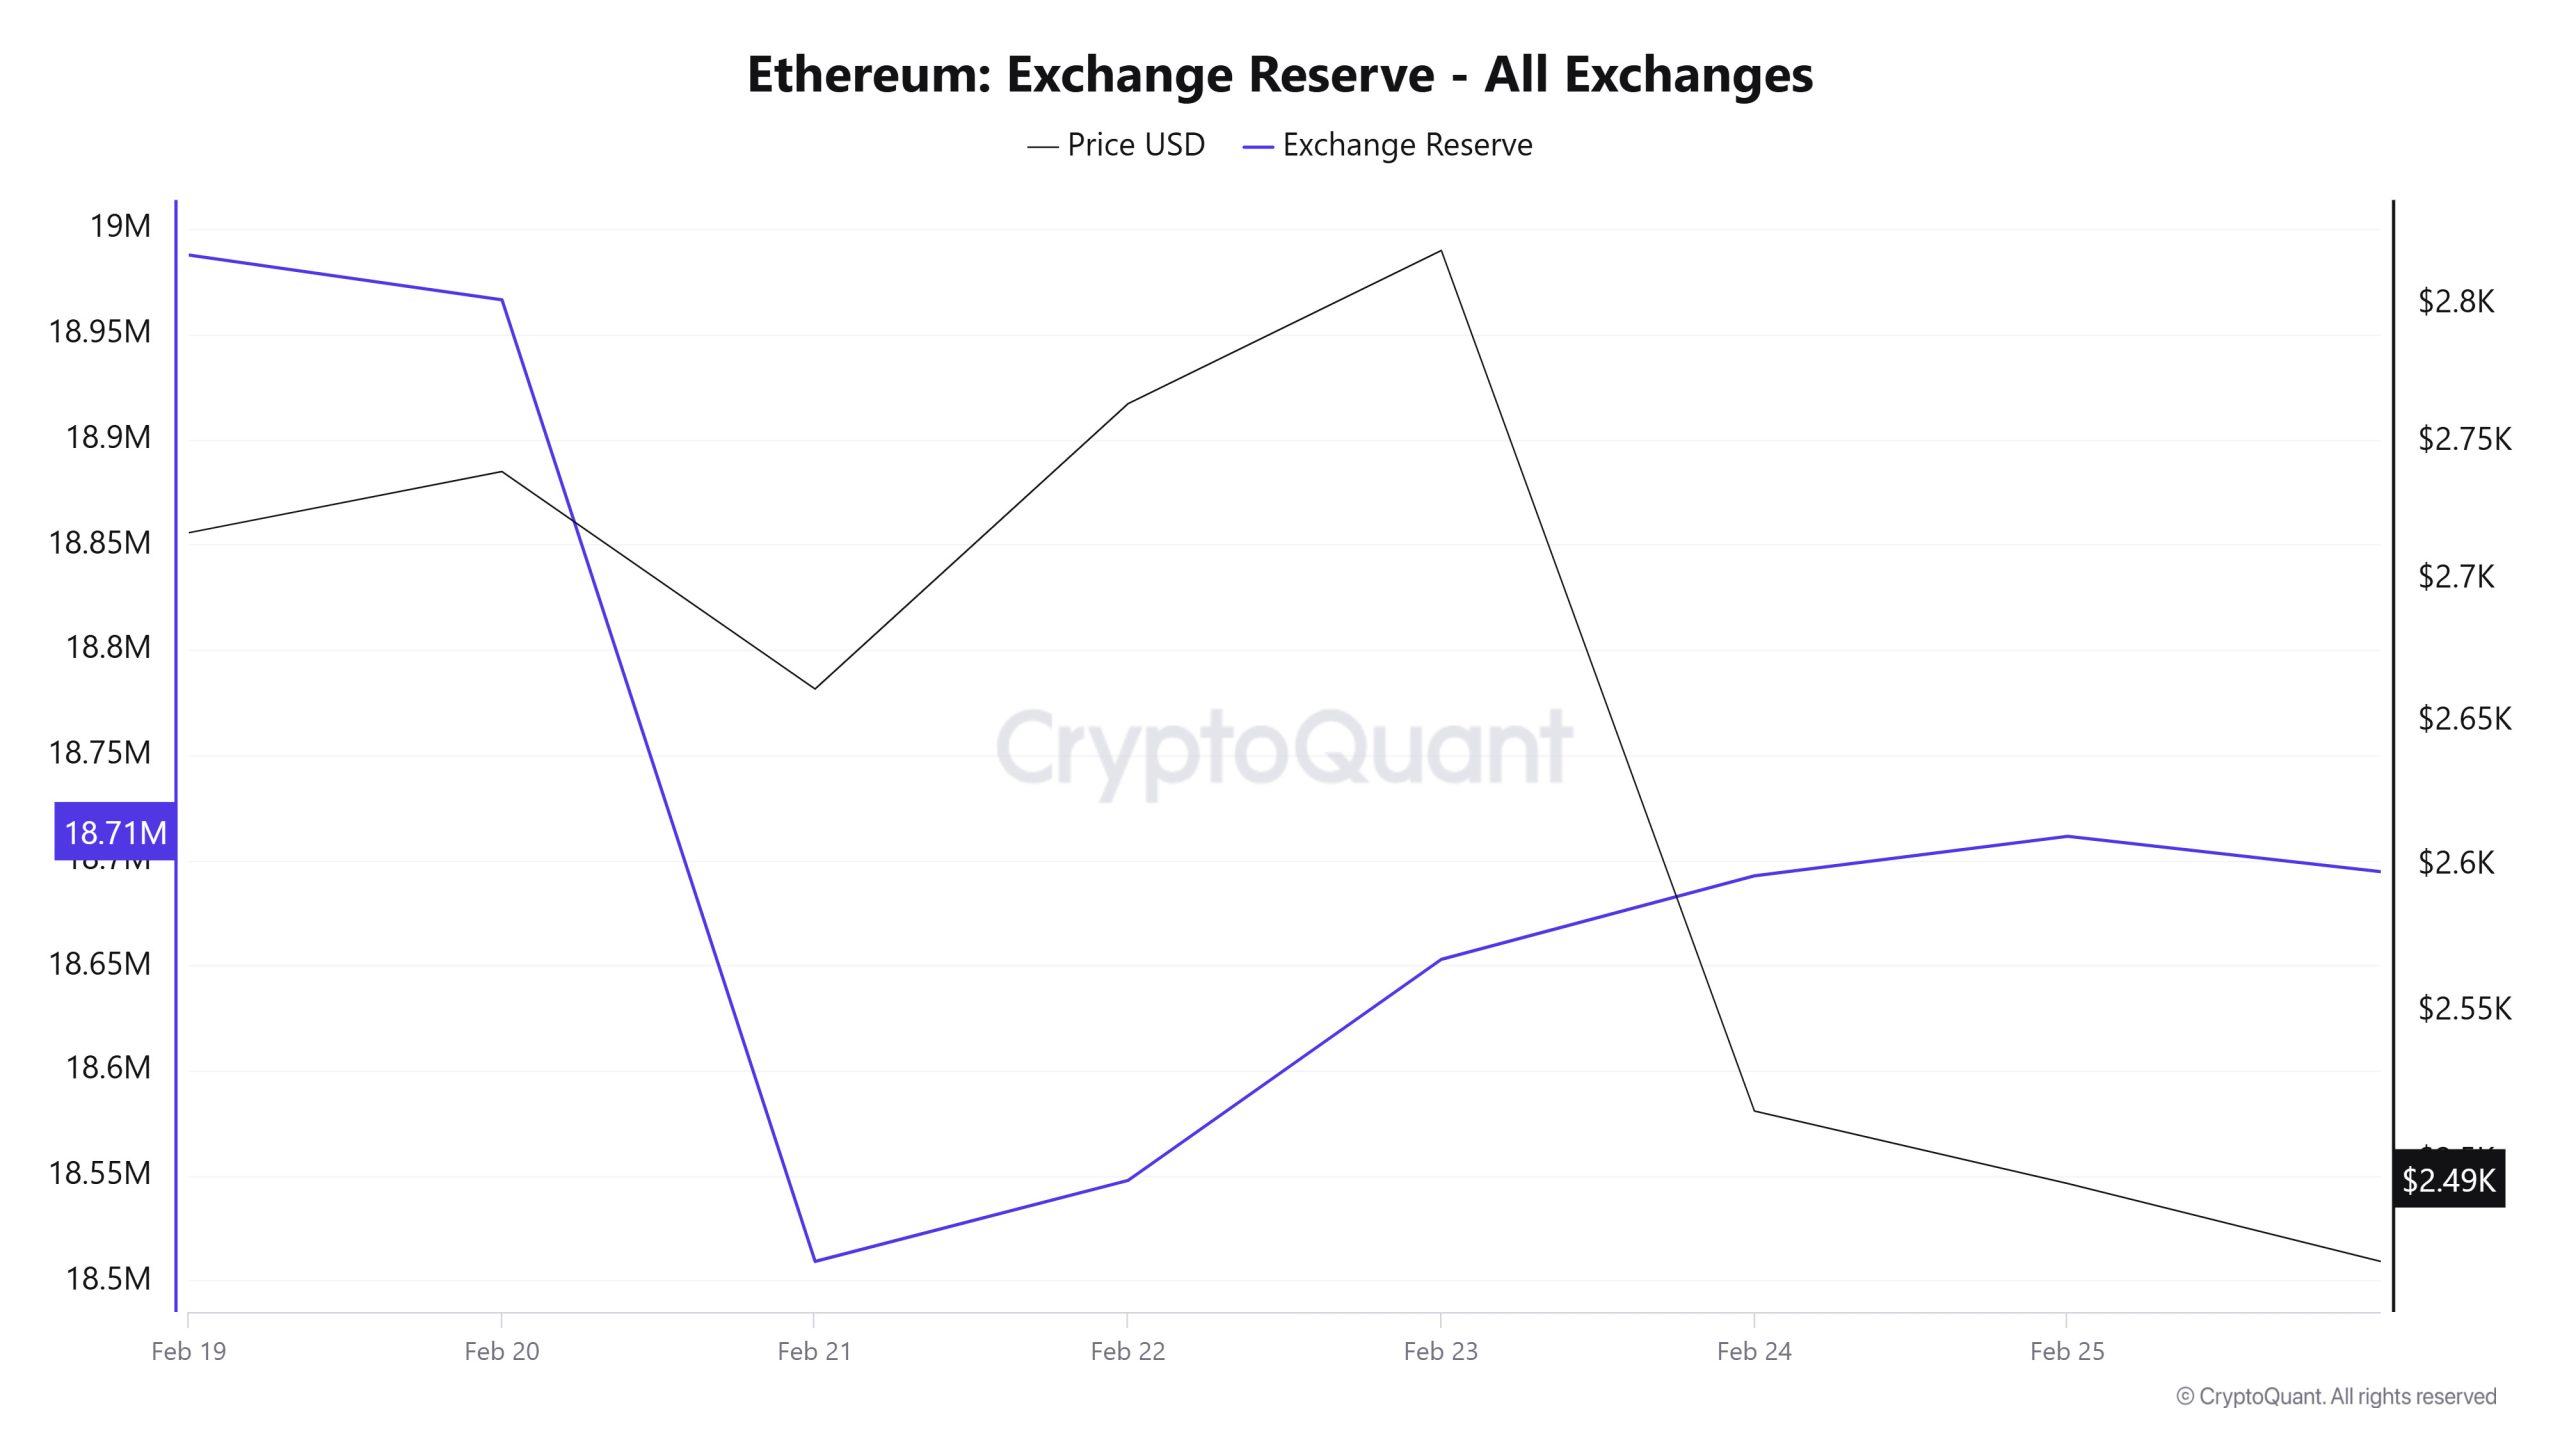
Entre el 19 y el 25 de febrero, las reservas de Ethereum en las bolsas disminuyeron de 18.987.706 ETH a 18.711.285 ETH. Durante este periodo, se produjo una salida neta total de 276.421 ETH y las reservas de Ethereum de las bolsas disminuyeron un 1,46%. El precio de Ethereum cayó aproximadamente un 8,2% durante este periodo. El 19 de febrero de 2025, Ethereum cerró a 2.717 dólares y el 25 de febrero de 2025, a 2.493 dólares.
| Fecha | 19-Feb | 20-Feb | 21-Feb | 22-Feb | 23-Feb | 24-Feb | 25-Feb |
|---|---|---|---|---|---|---|---|
| Entrada de divisas | 559,114 | 566,547 | 1,331,890 | 1,176,831 | 821,473 | 1,153,225 | 2,138,689 |
| Salida de divisas | 561,224 | 587,856 | 1,789,099 | 1,138,279 | 716,408 | 1,113,485 | 2,119,948 |
| Intercambio Netflow | -2,109 | -21,308 | -457,209 | 38,552 | 105,065 | 39,740 | 18,740 |
| Reserva de cambio | 18,987,706 | 18,966,397 | 18,509,188 | 18,547,740 | 18,652,805 | 18,692,544 | 18,711,285 |
| Precio del ETH | 2,717 | 2,739 | 2,661 | 2,763 | 2,820 | 2,517 | 2,493 |
Tasas e ingresos
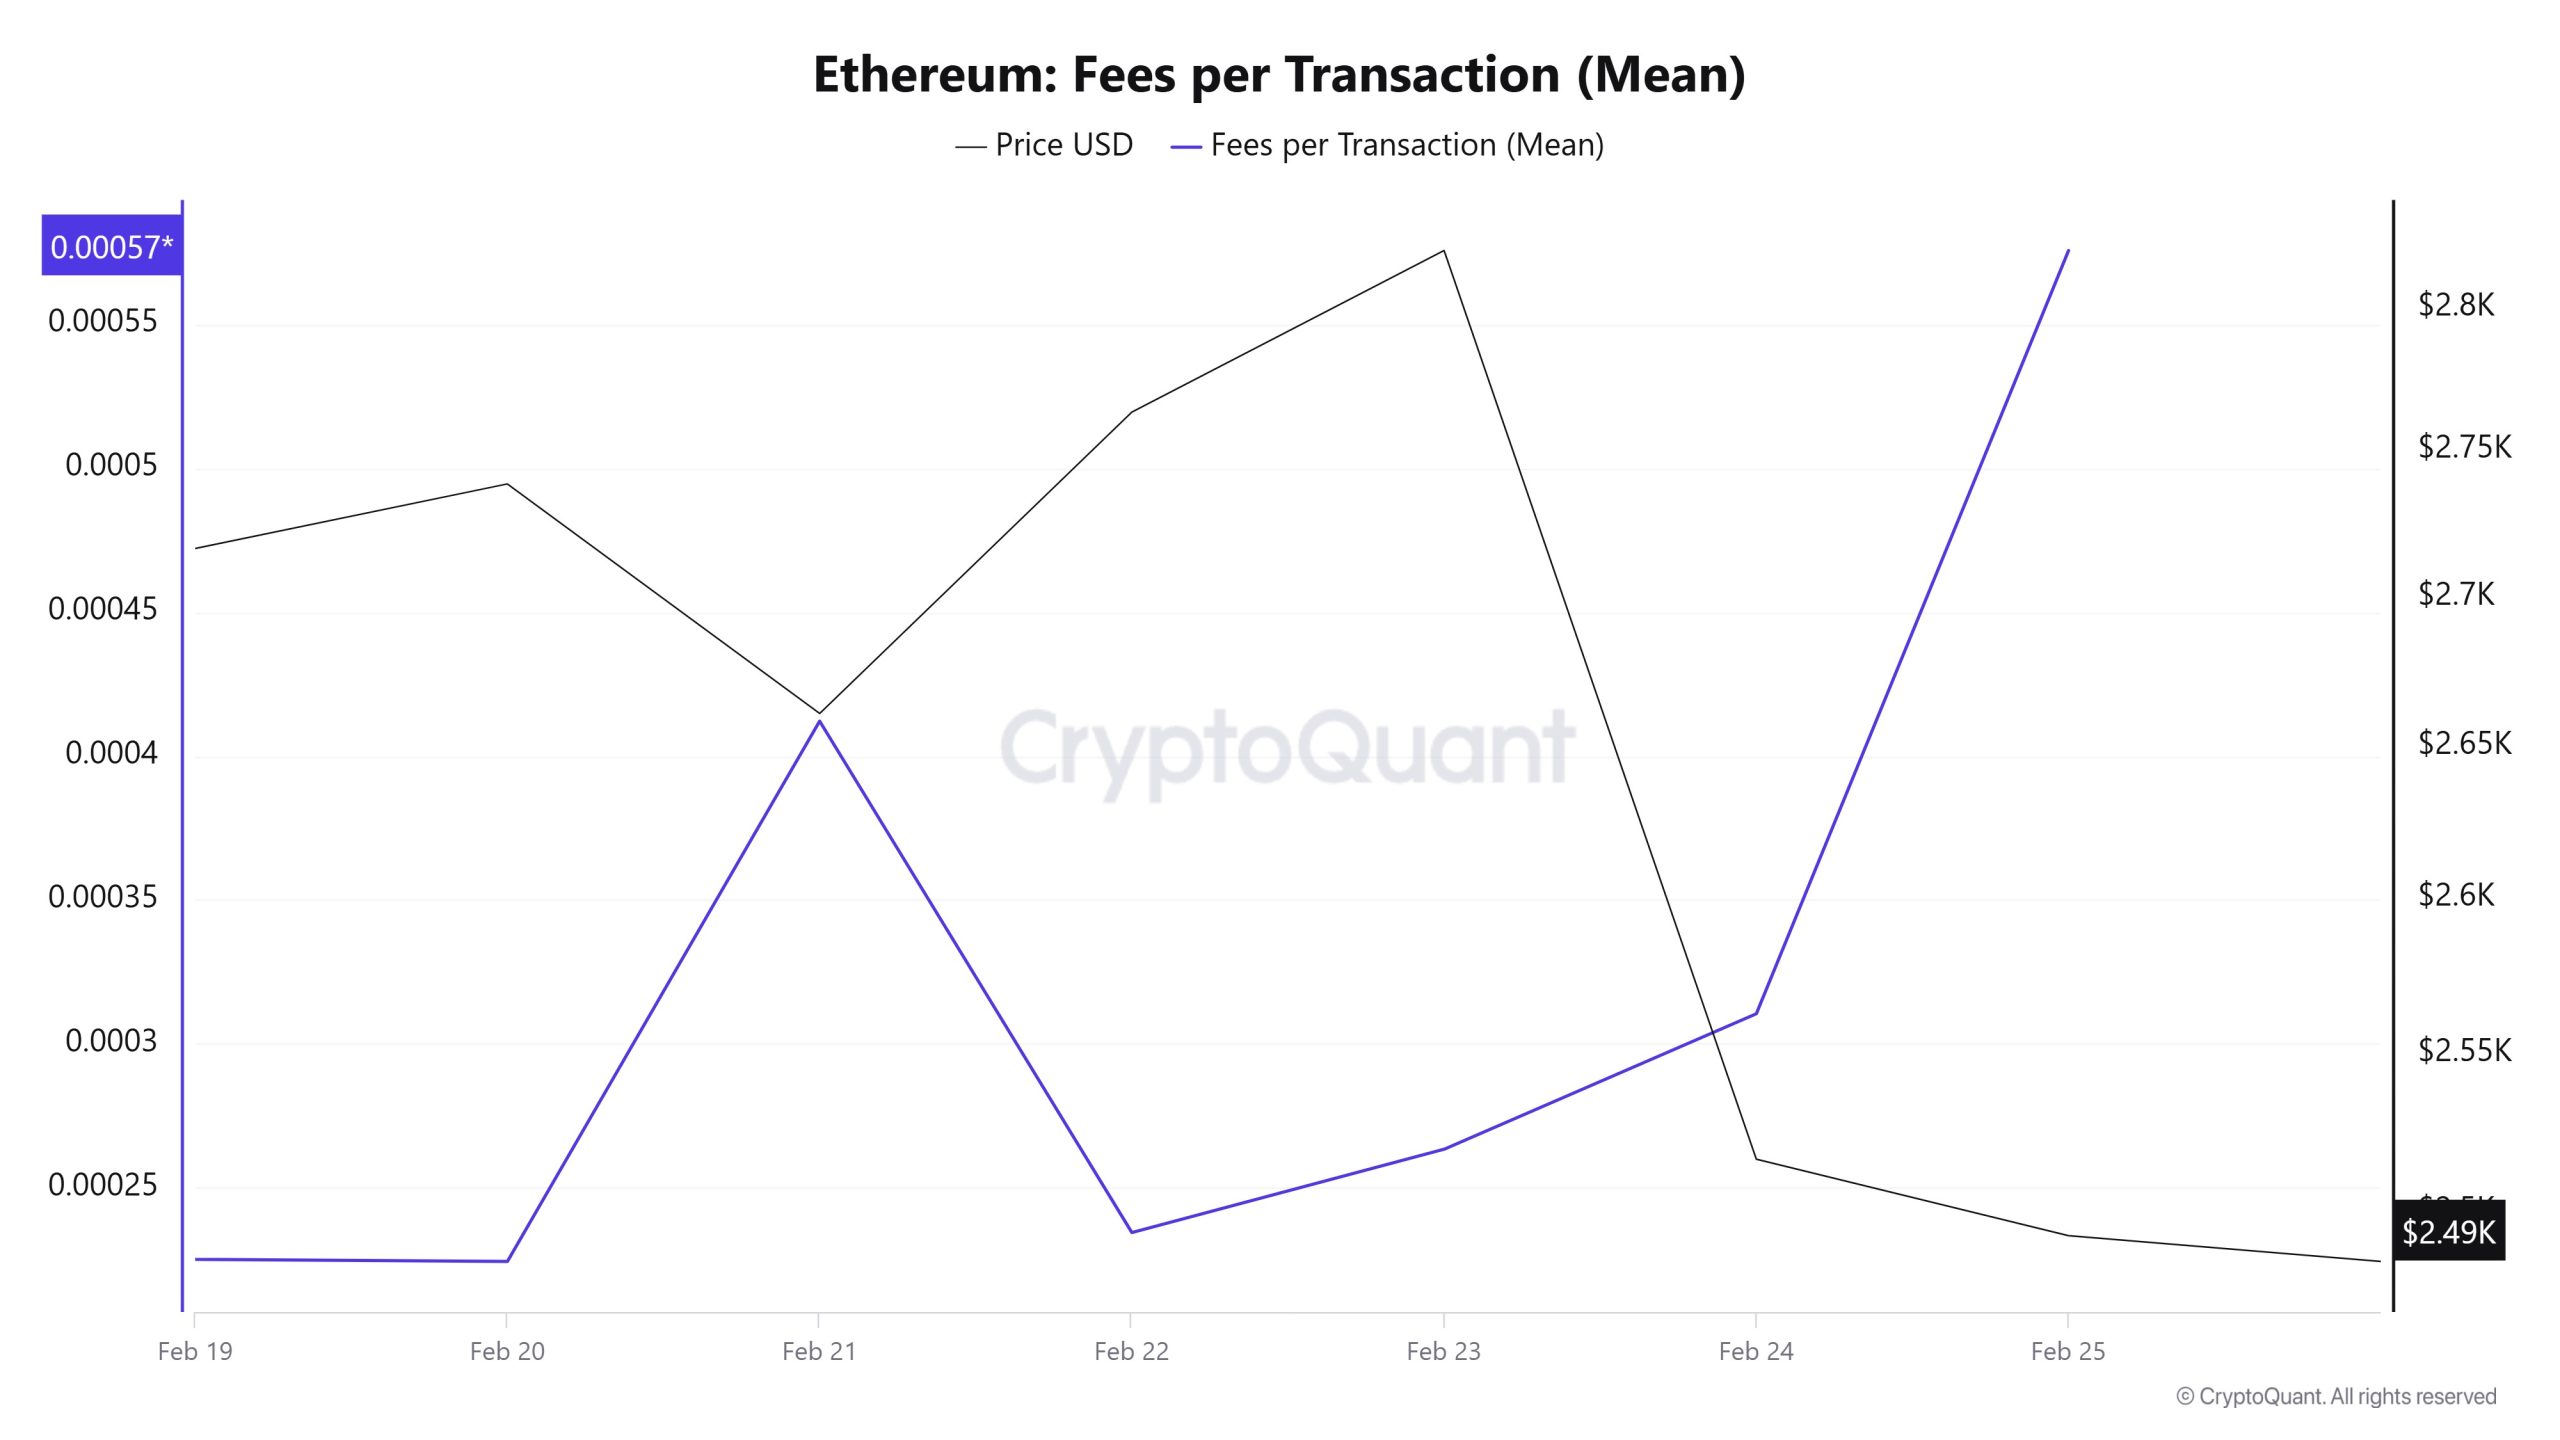
Entre el 19 y el 25 de febrero, cuando se analizaron los datos de las comisiones por transacción (media) de Ethereum, se vio que este valor estaba en el nivel de 0,000225115340297586 el 19 de febrero, el primer día de la semana. En los días siguientes, el valor, que siguió un curso opuesto al movimiento del precio de Ethereum, alcanzó 0,000412149960911027 el 21 de febrero y luego experimentó cierto retroceso. A partir del 22 de febrero, el valor de la comisión por transacción (media), que empezó a subir debido a la gran volatilidad observada en el precio de Ethereum, cerró en 0,000575701359538742 el 25 de febrero, último día del periodo semanal.
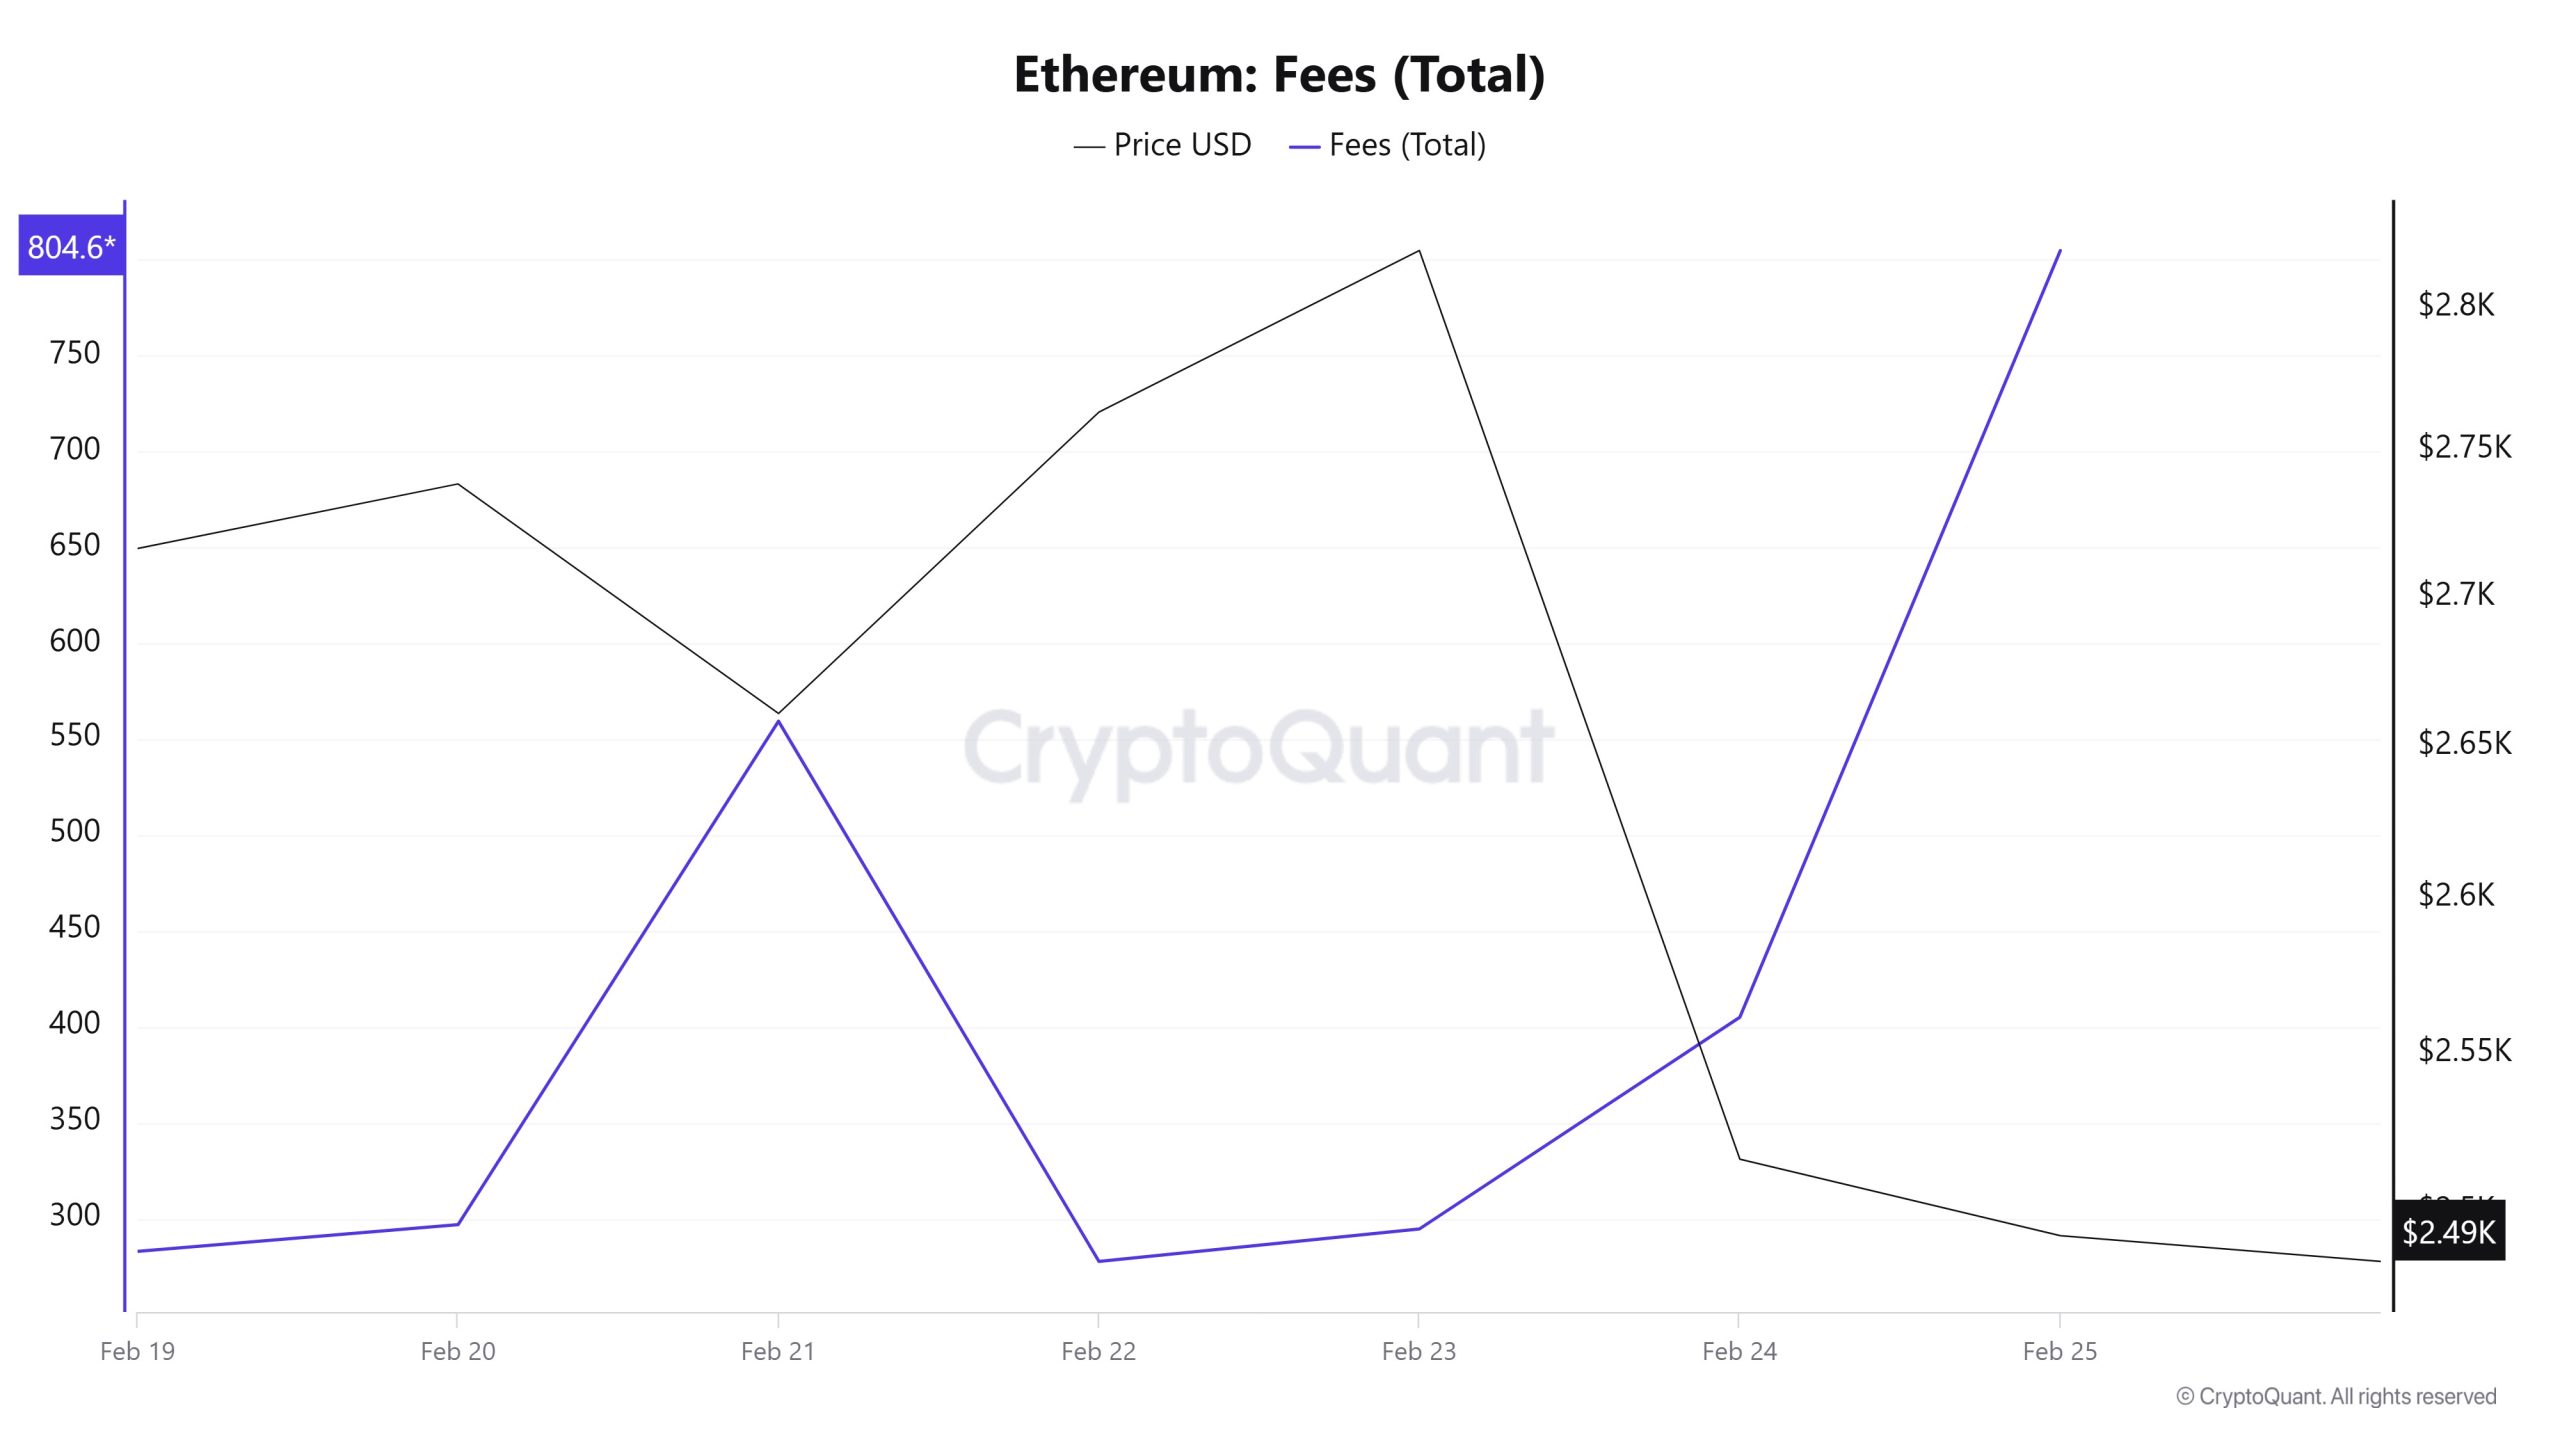
Del mismo modo, cuando se analizaron los datos de las cotizaciones de Ethereum (Total) entre el 19 y el 25 de febrero, se vio que este valor estaba en 283,05282519929506 el 19 de febrero, el primer día de la semana. En los días siguientes, el valor, que siguió un curso opuesto al movimiento del precio de Ethereum, alcanzó los 296,9555966991278 el 21 de febrero y luego experimentó cierto retroceso. A partir del 22 de febrero, el valor Fees (Total), que empezó a subir debido a la gran volatilidad observada en el precio de Ethereum, cerró en 804,6468519014691 el 25 de febrero, último día del periodo semanal.
Bloque minado
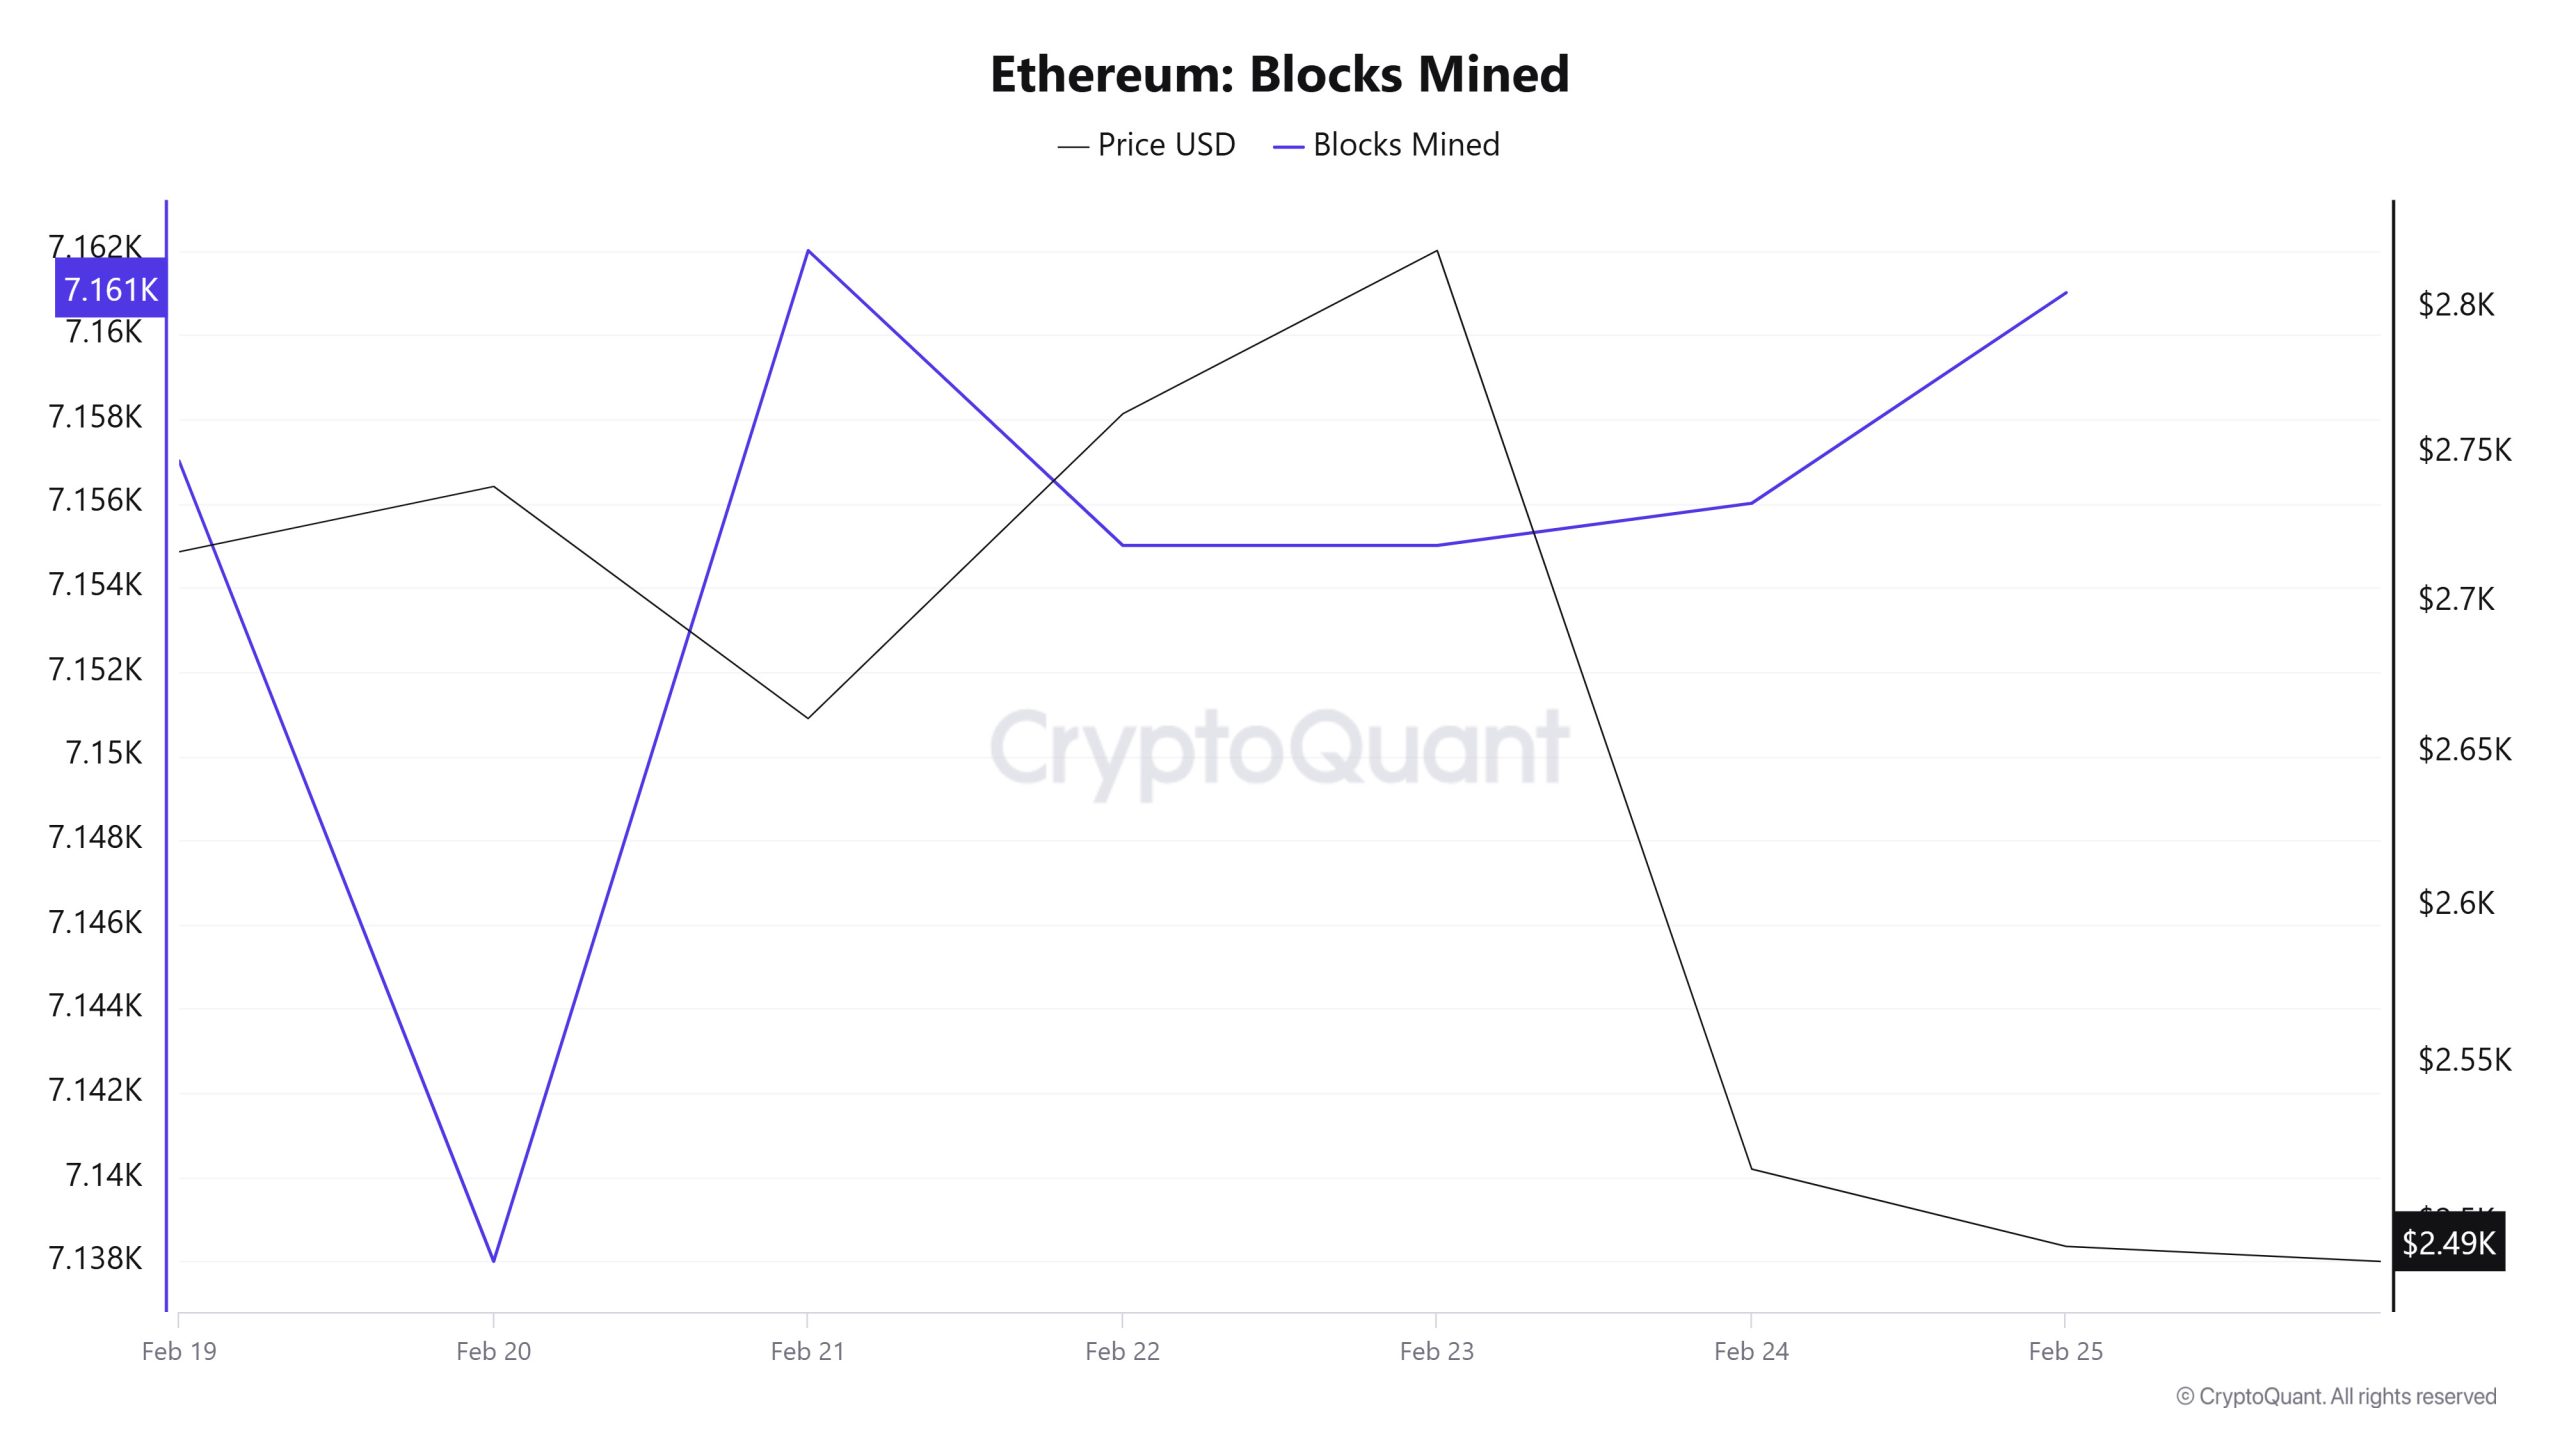
Entre el 19 y el 25 de febrero, cuando examinamos la tabla Ethereum Blocks Mined, el número de bloques producidos aumentó a lo largo de la semana. Mientras que el 19 de febrero se produjeron 7.157 bloques, esta cifra alcanzó los 7.161 bloques el 25 de febrero. Hubo una correlación negativa entre los bloques minados y el precio de Ethereum durante la semana.
Bloque
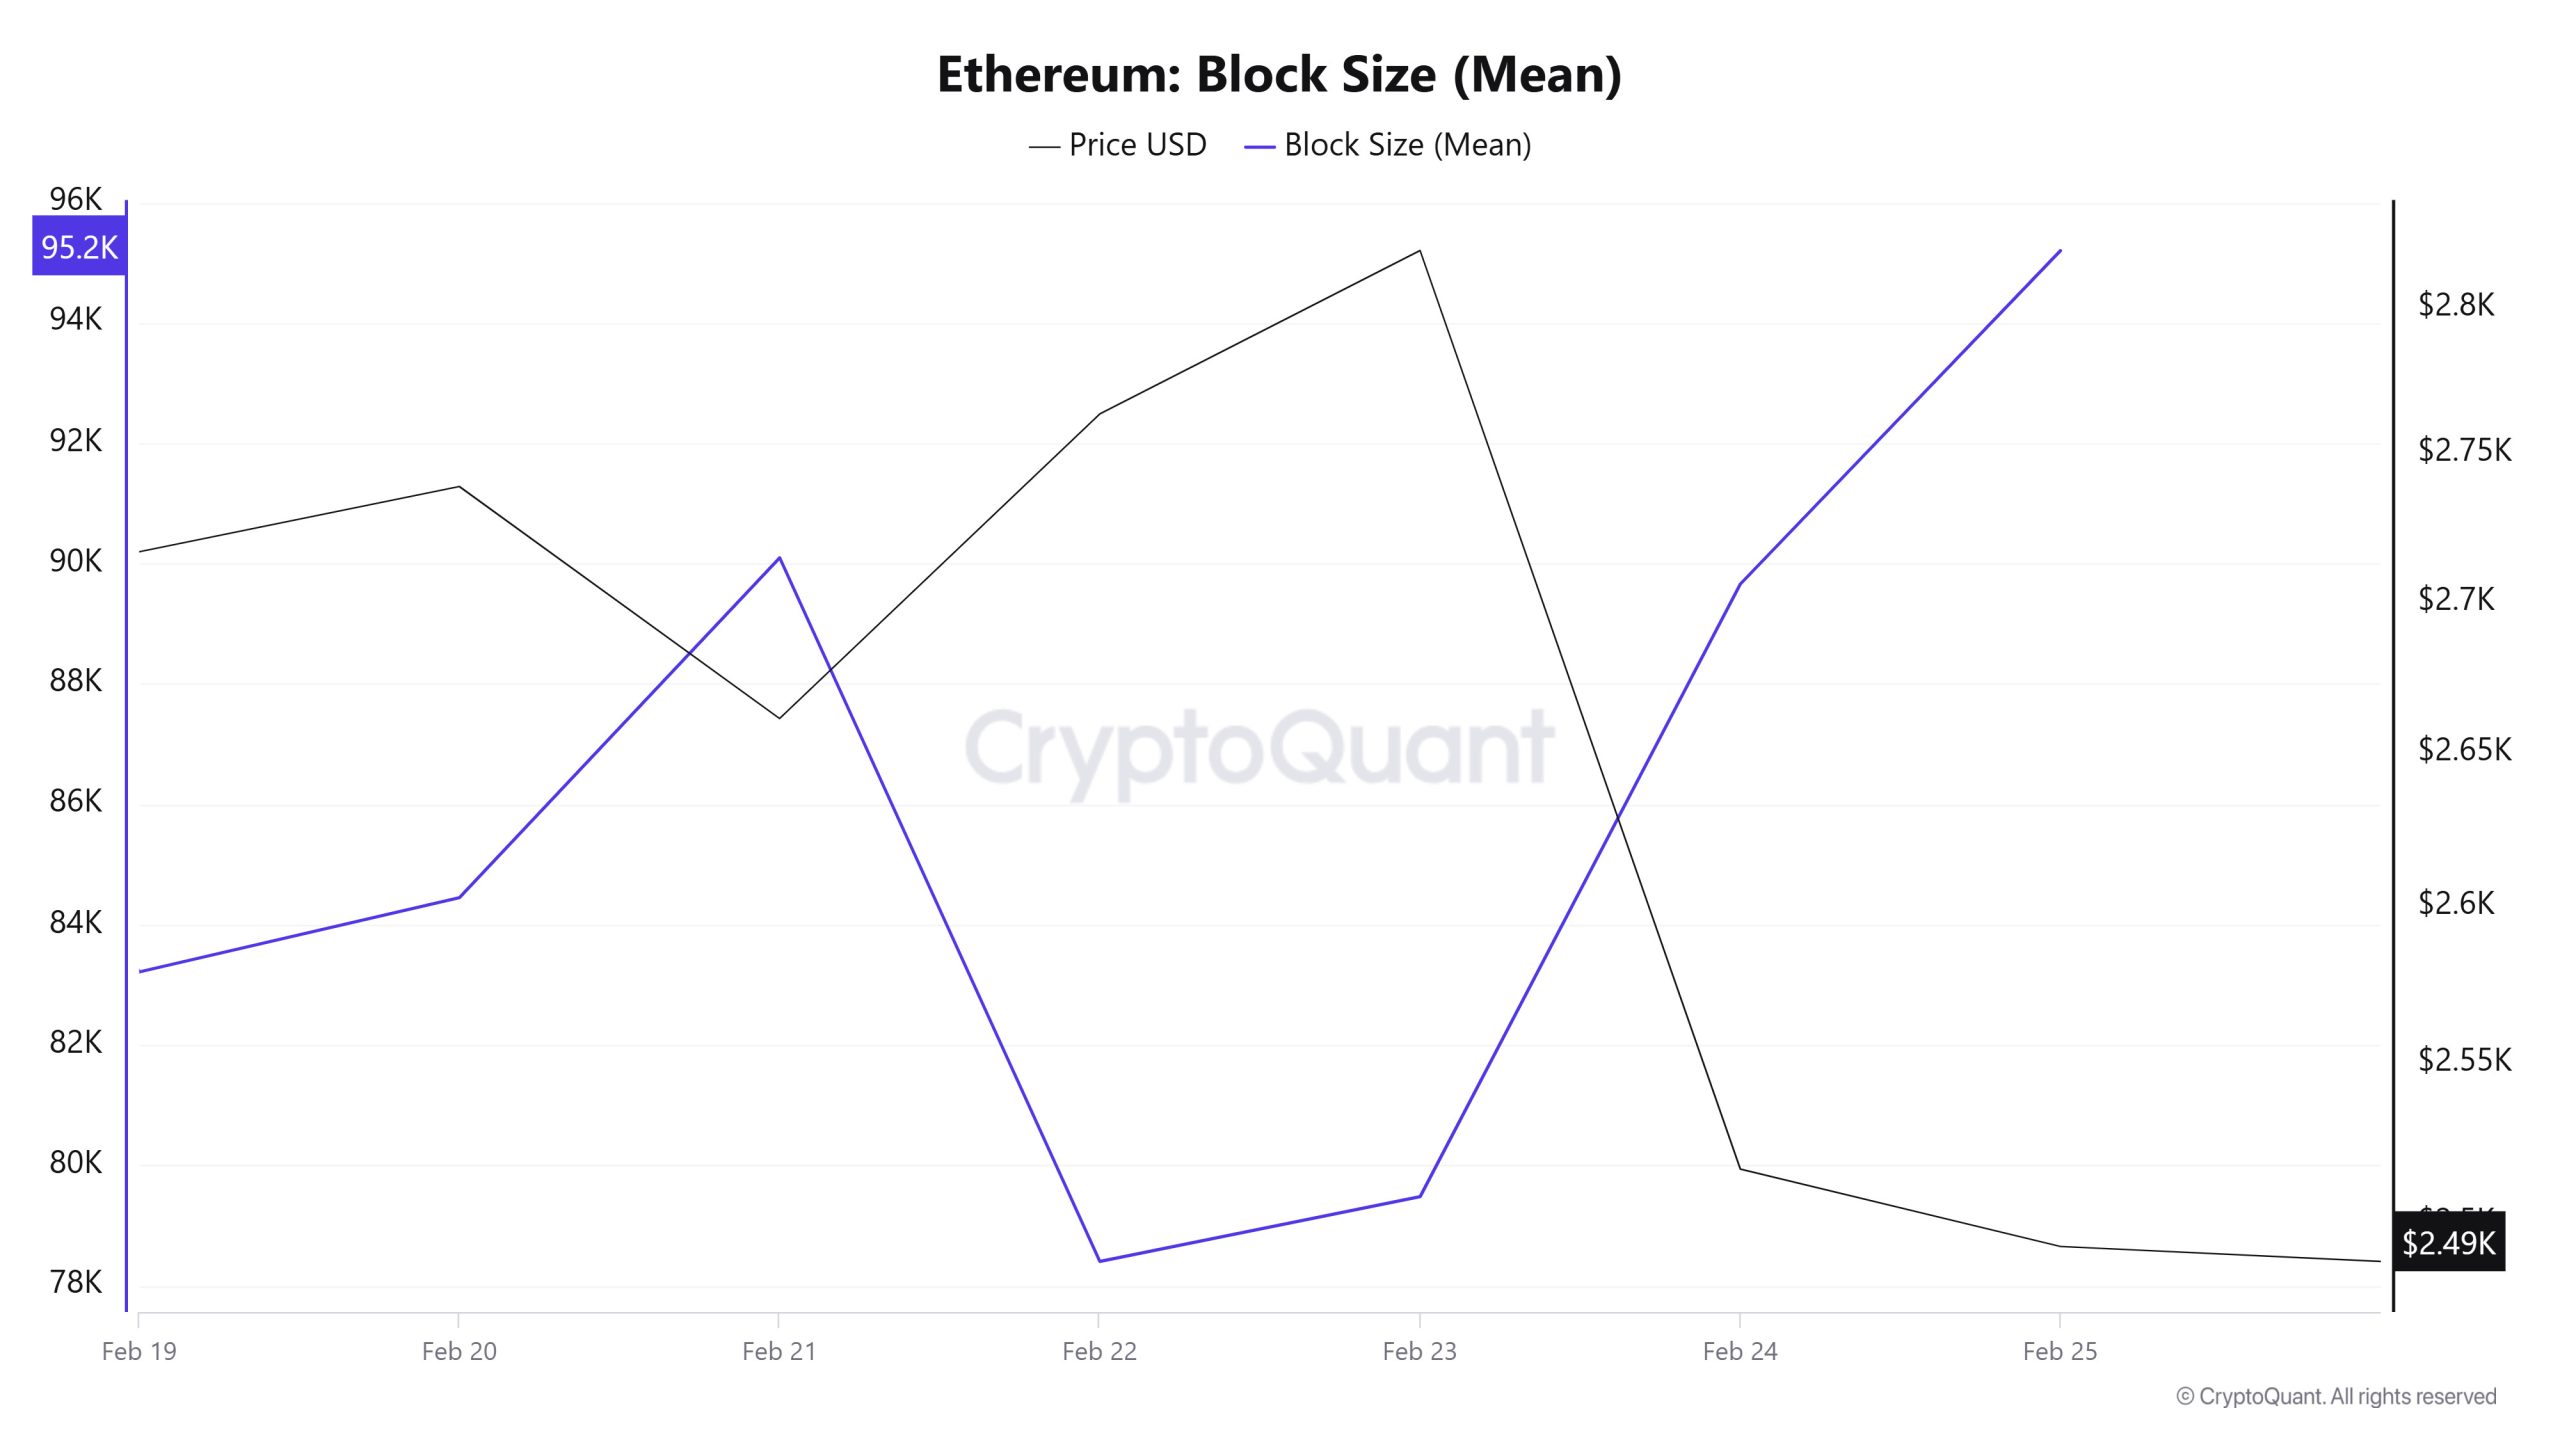
Entre el 19 y el 25 de febrero, cuando examinamos la tabla del tamaño de los bloques de Ethereum, tras la disminución del tamaño de los bloques hacia la mitad de la semana, aumentó hacia el final de la misma. De 83.213 bytes el 19 de febrero, el tamaño de bloque alcanzó los 95.200 bytes el 25 de febrero. Hubo una correlación negativa entre el tamaño de bloque y el precio de Ethereum durante la semana.
Intervalo en bloque
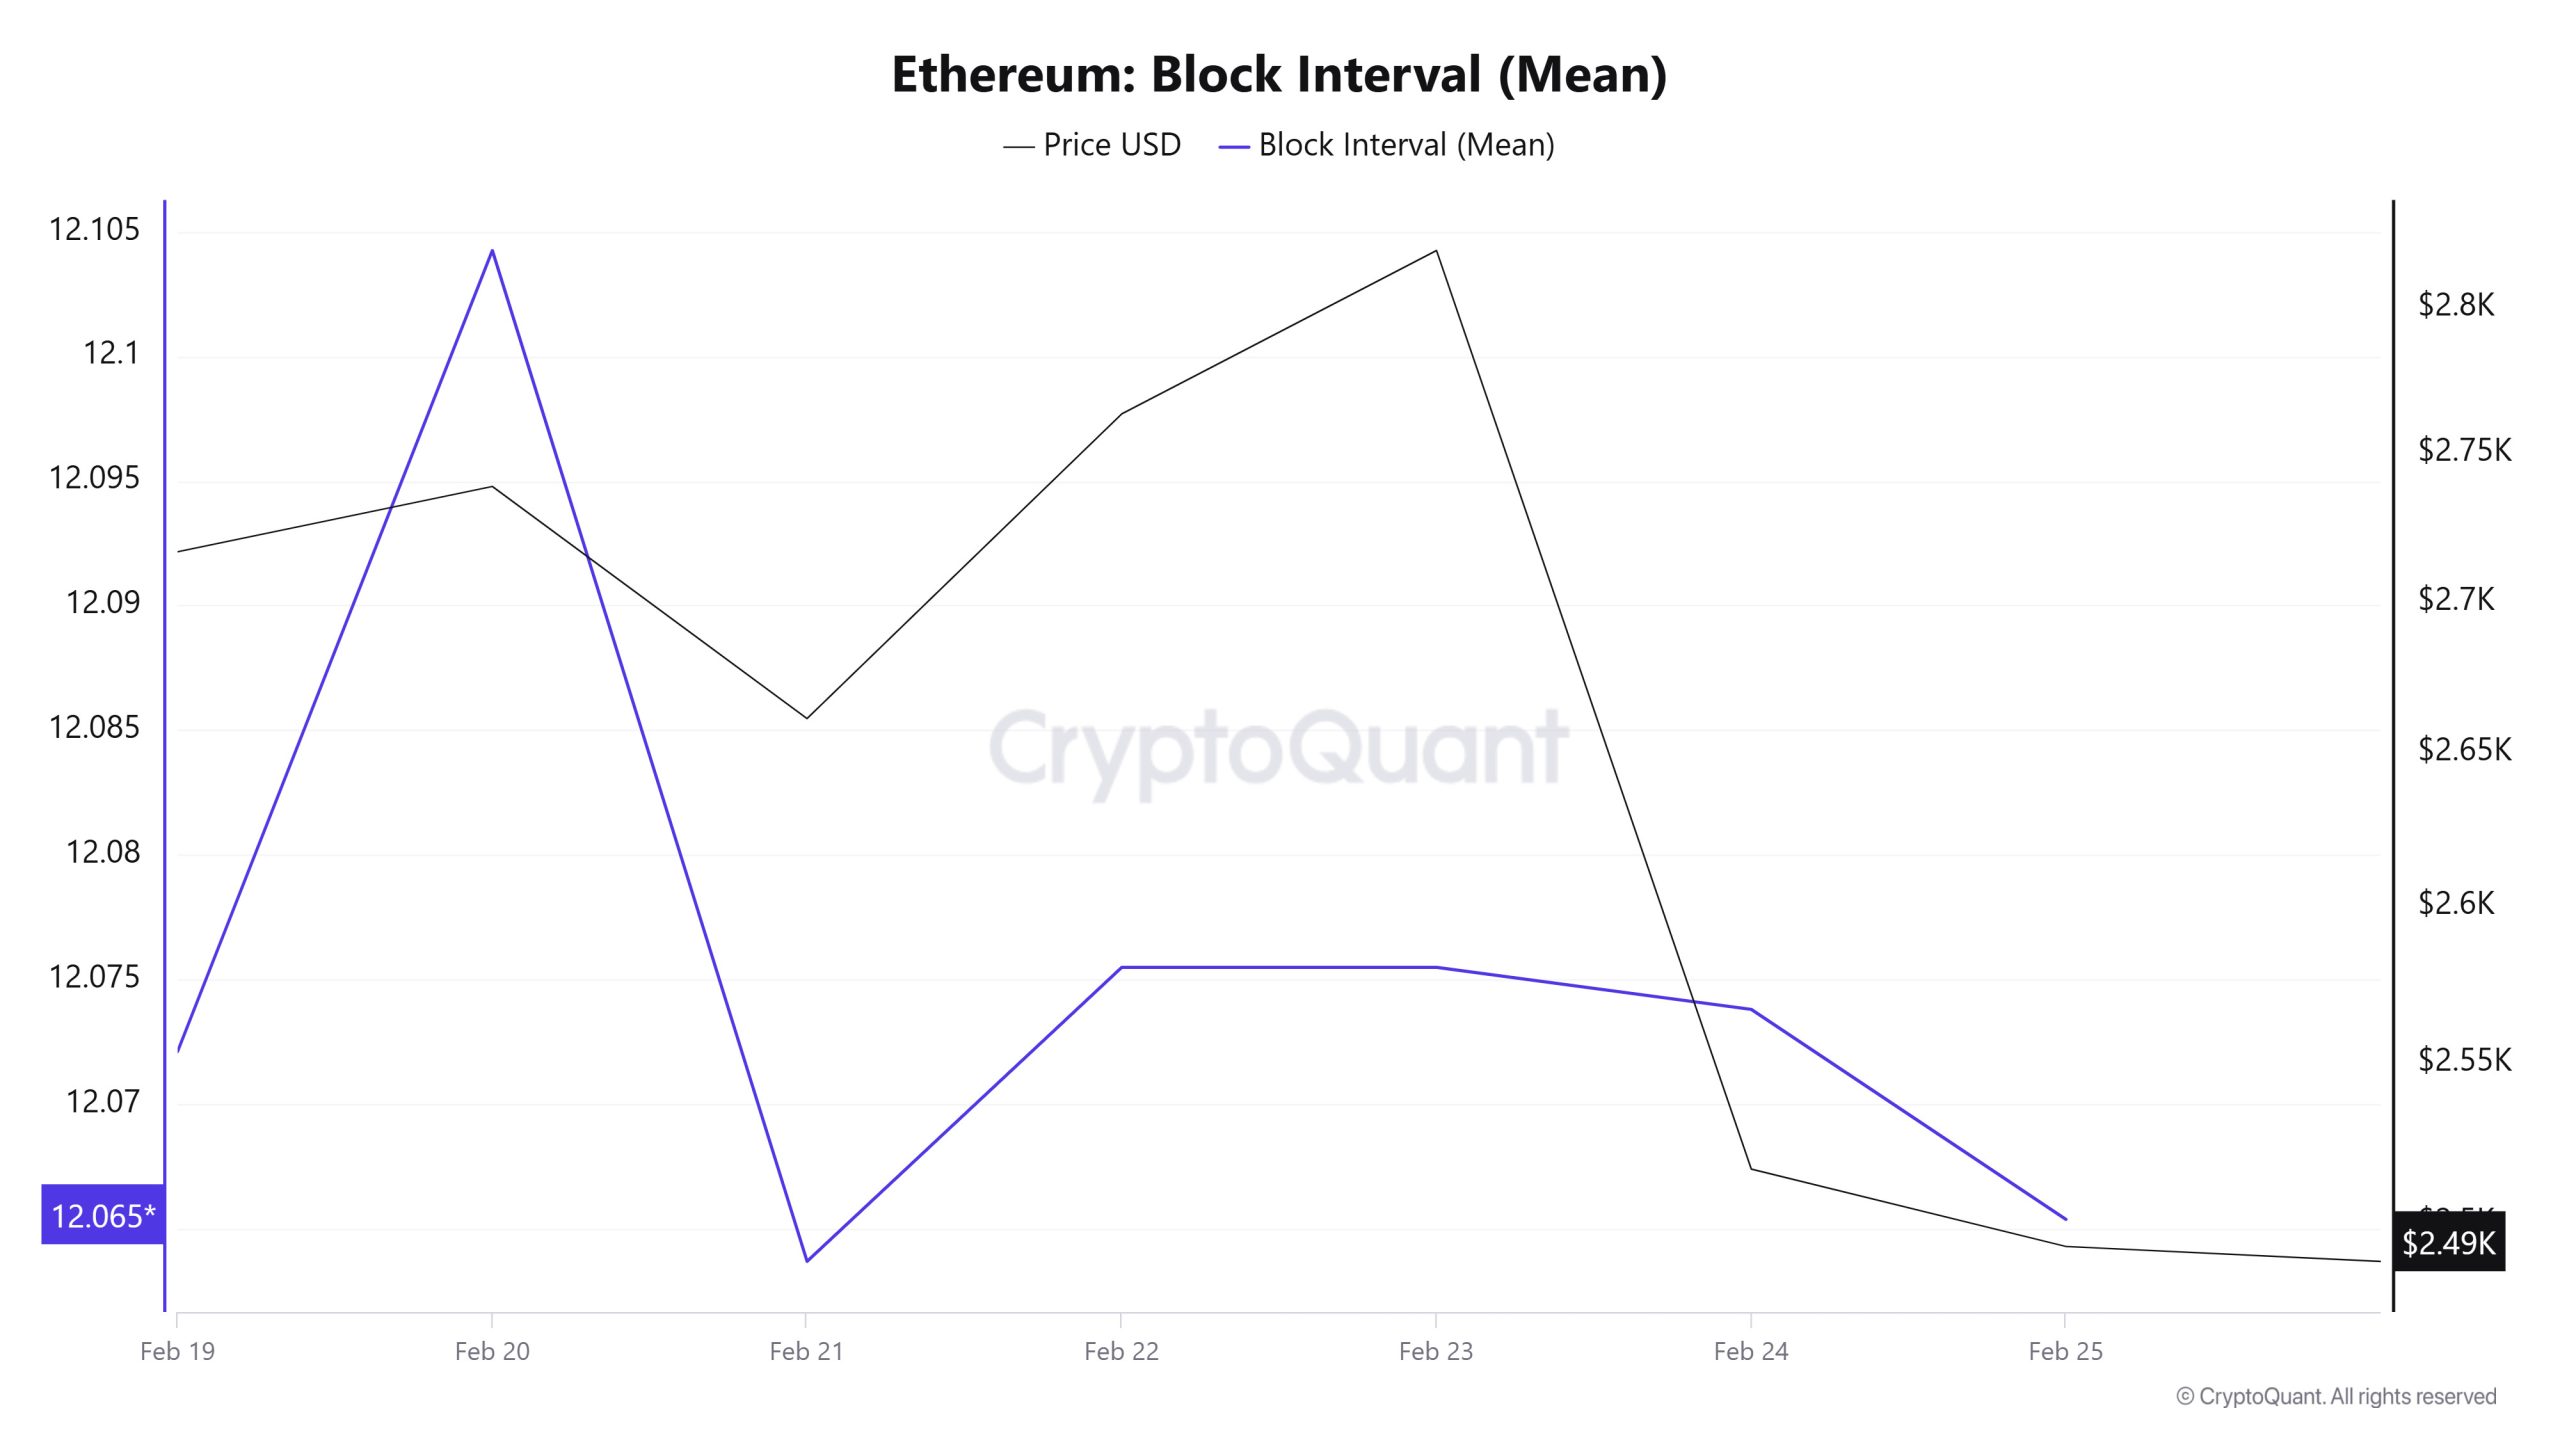
Entre el 19 y el 25 de febrero, cuando examinamos la tabla de intervalos entre bloques de Ethereum, se observa una disminución del tiempo entre bloques a lo largo de la semana. El 19 de febrero, el tiempo entre bloques fue de 12,07 segundos, que disminuyó a 12,06 segundos el 25 de febrero. Hubo una correlación positiva entre el Intervalo entre Bloques y el precio de Ethereum durante la semana.
Transacción
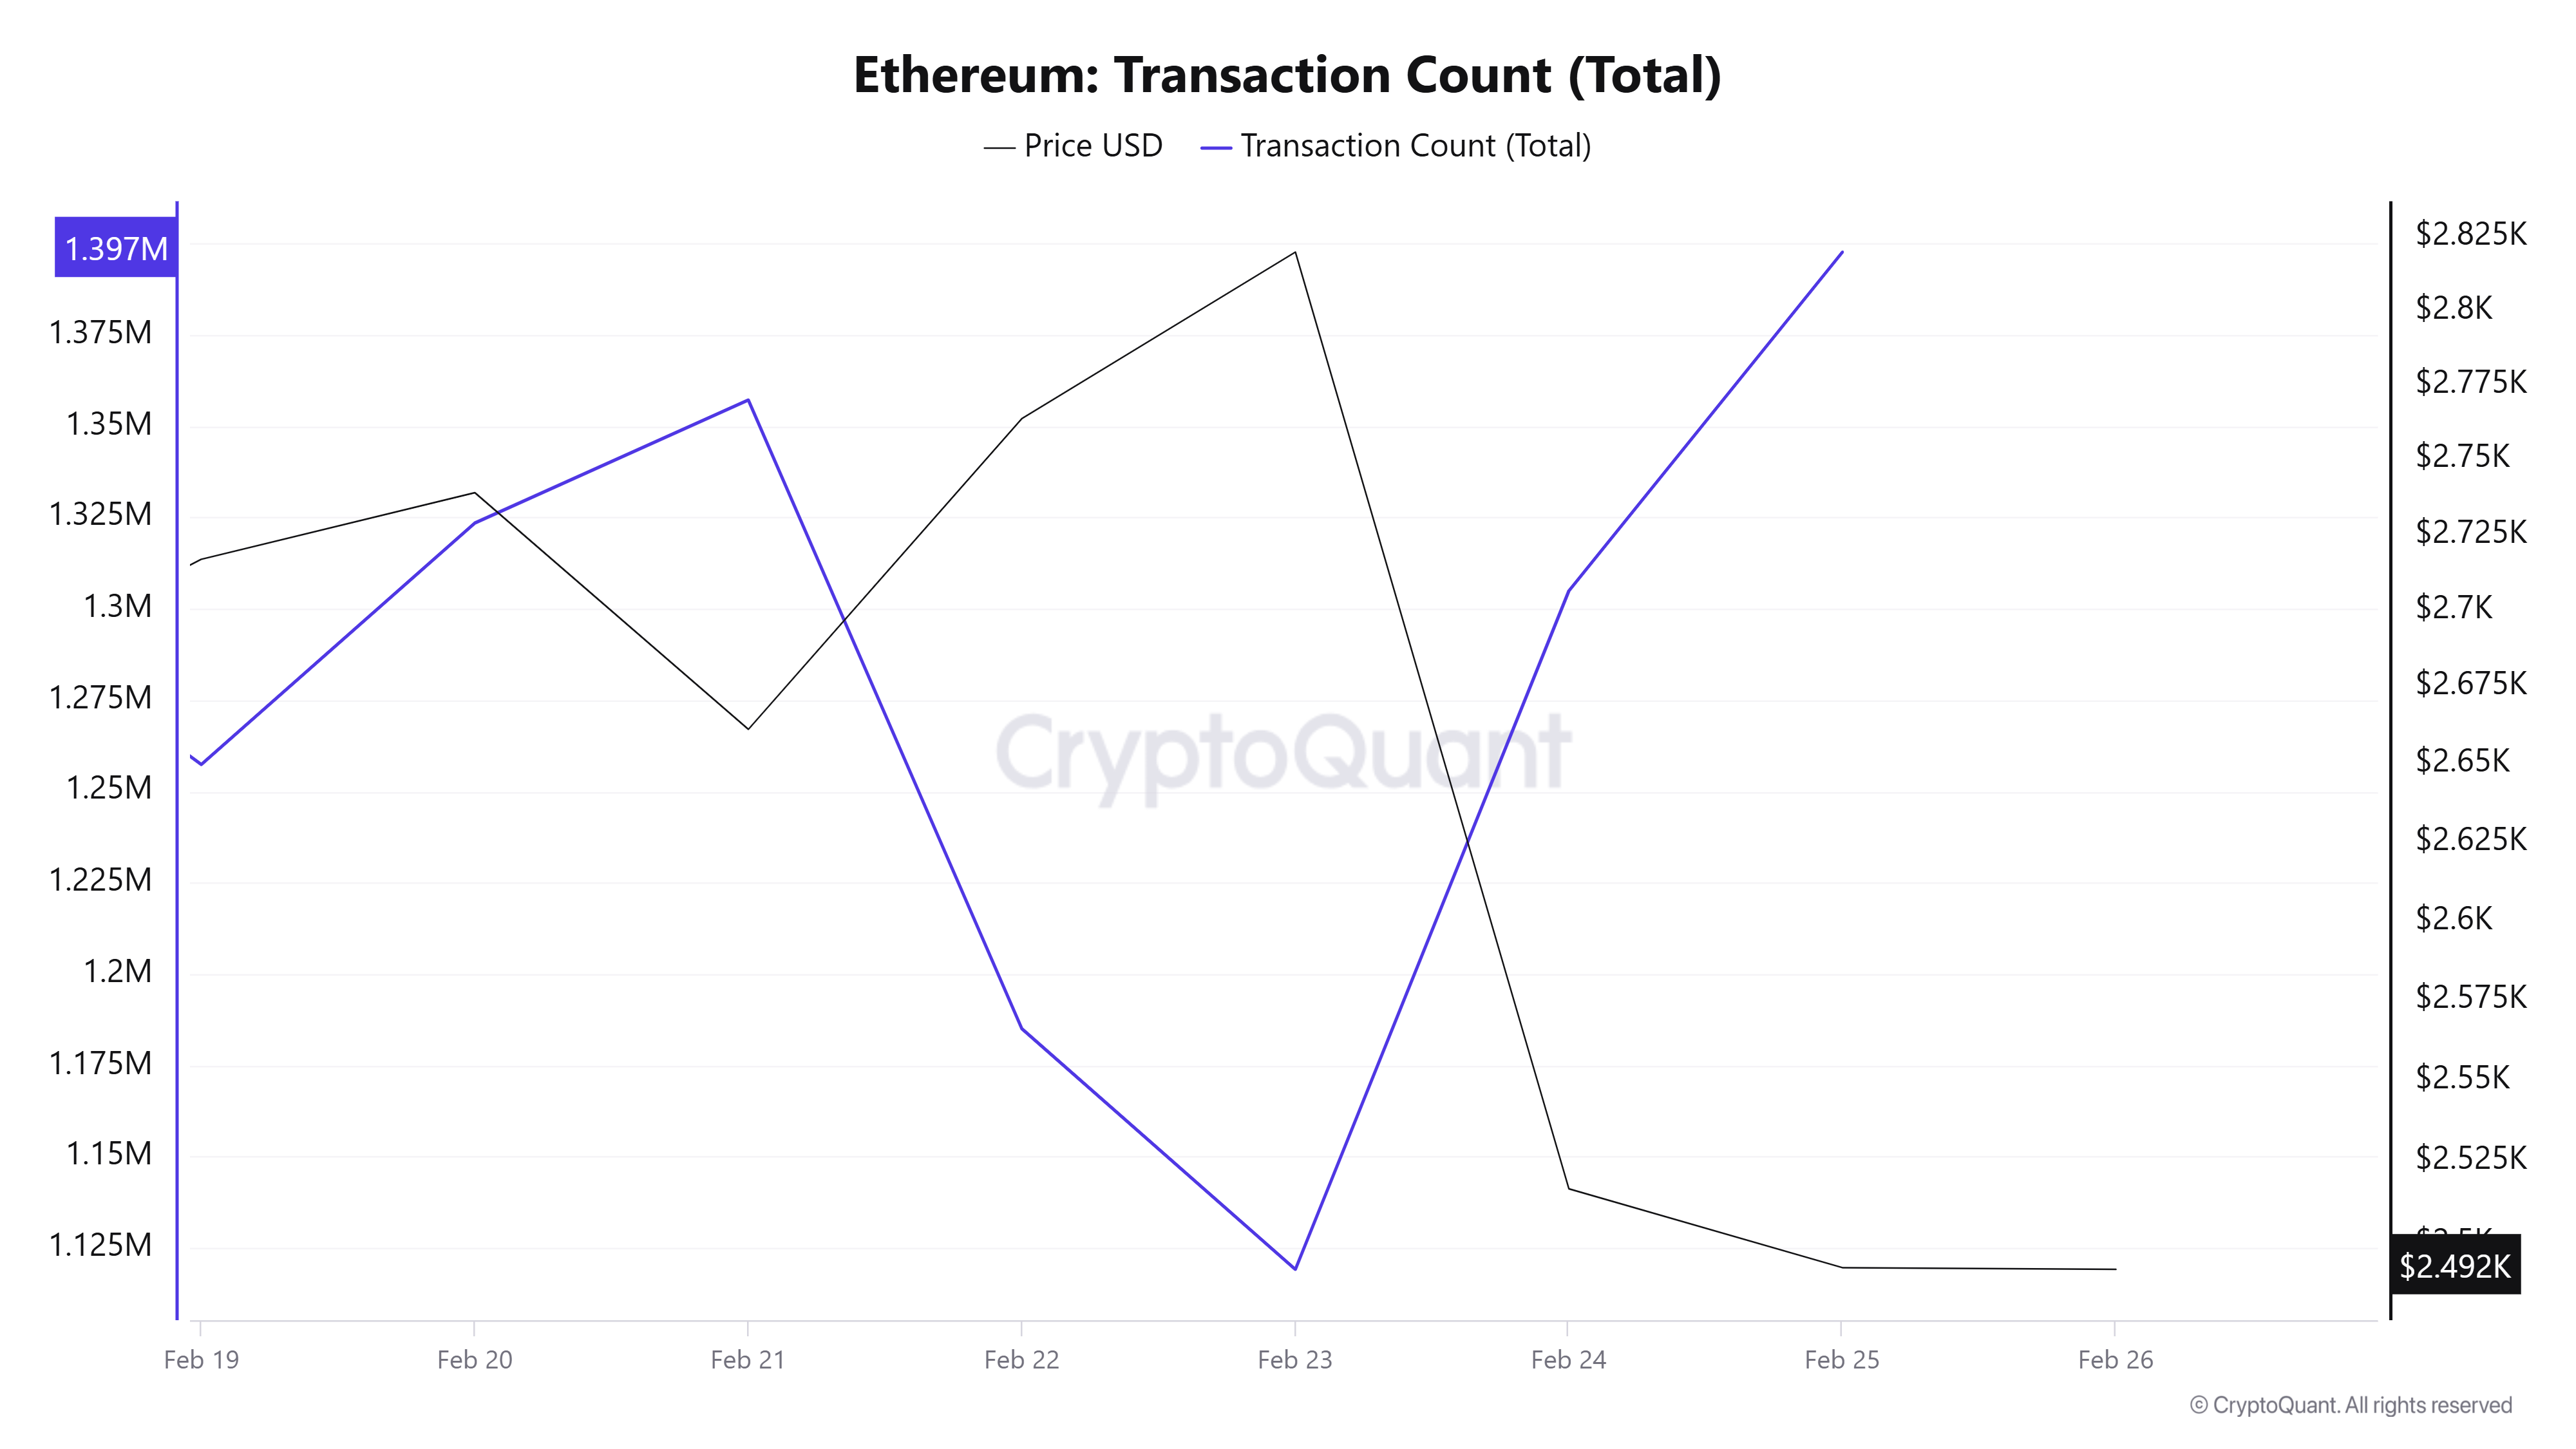
mostrando 8.944.880 transacciones. El mayor número de transacciones fue de 1.397.681 el 25 de febrero, mientras que el 22 de febrero fue el día del fin de semana con el menor número de transacciones de la semana con 1.119.166. Aunque no hubo muchos cambios en el número de transacciones en comparación con la semana pasada, el descenso del precio indica que las transacciones de esta semana fueron del lado vendedor. No obstante, si hay que comentar únicamente el "número de transacciones", no parece que haya una situación inusual.
Fichas transferidas
Entre el 12 y el 18 de febrero, se transfirieron 9.730.277 unidades de Ethereum, mientras que entre el 19 y el 25 de febrero, el número de Ethereum transferidos ascendió a 17.551.792, un aumento del 80,04% en comparación con la semana anterior. El 25 de febrero se transfirieron 4.085.240 Ethereum, la mayor cantidad transferida en un día desde el 3 de febrero. Teniendo en cuenta los efectos sobre el precio y las salidas en el lado de los ETF, es posible que estemos viendo los reflejos de la presión vendedora de los inversores institucionales sobre la oncahína.
Aunque esta semana se produjo un ligero aumento del número de transacciones en comparación con la semana pasada, la cantidad total de Ethereum transferida fue mucho mayor, lo que indica que el tamaño medio de las transferencias, es decir, la cantidad de Ethereum por transacción, aumentó. Esto demuestra que los inversores están realizando movimientos volátiles en el mercado, y si nos fijamos en el tamaño de las cantidades según las transaciones y su impacto en el precio, se entiende que estamos viendo el efecto de oleadas de venta por parte de inversores institucionales.
Ratio de apalancamiento estimado
Al principio del periodo de 7 días, la métrica subió, y hacia el final, empezó a caer. Esto tuvo un impacto negativo en el precio de Ethereum, provocando una caída de alrededor del 16%. El ELR (ratio de apalancamiento estimado), que tenía un valor de 0,584 al principio del proceso, se encuentra actualmente en 0,596. Su nivel más alto fue de 0,625 a mediados del proceso. Un ELR más alto significa que los participantes están dispuestos a asumir más riesgo y suele indicar condiciones o expectativas alcistas. Cabe señalar que estas subidas también pueden deberse a una disminución de las reservas. Si nos fijamos en las reservas de Ethereum, al principio del proceso había 18,98 millones de reservas y siguieron disminuyendo hacia el final del proceso. En la actualidad, destaca el número de reservas de aproximadamente 18,70 millones. Al mismo tiempo, el Interés Abierto de Ethereum ha caído de 24.310 millones de dólares a 21.880 millones en los últimos días, revelando la razón del descenso de la métrica. Esto coincide con una caída correspondiente en el precio del activo de 2.800 a 2.450 dólares. Este descenso del interés abierto, así como la caída del apalancamiento, sugieren que los inversores se están volviendo más pesimistas sobre los movimientos del precio de Ethereum. Como resultado, a pesar de la caída de las reservas, la métrica ELR también está cayendo, lo que dificulta la subida. Si el precio rompe el umbral de los 3.000 dólares, trades apalancadas podrían aumentar a medida que los participantes recuperen la confianza.
AVISO LEGAL
La información sobre inversiones, los comentarios y las recomendaciones contenidas en este documento no constituyen servicios de asesoramiento en materia de inversiones. Los servicios de asesoramiento en materia de inversión son prestados por instituciones autorizadas a título personal, teniendo en cuenta las preferencias de riesgo y rentabilidad de los particulares. Los comentarios y recomendaciones contenidos en este documento son de tipo general. Estas recomendaciones pueden no ser adecuadas para su situación financiera y sus preferencias de riesgo y rentabilidad. Por lo tanto, tomar una decisión de inversión basándose únicamente en la información contenida en este documento puede no dar lugar a resultados acordes con sus expectativas.
NOTA: Todos los datos utilizados en el análisis de Bitcoin onchain se basan en Cryptoqaunt.
