Averías
MRVR
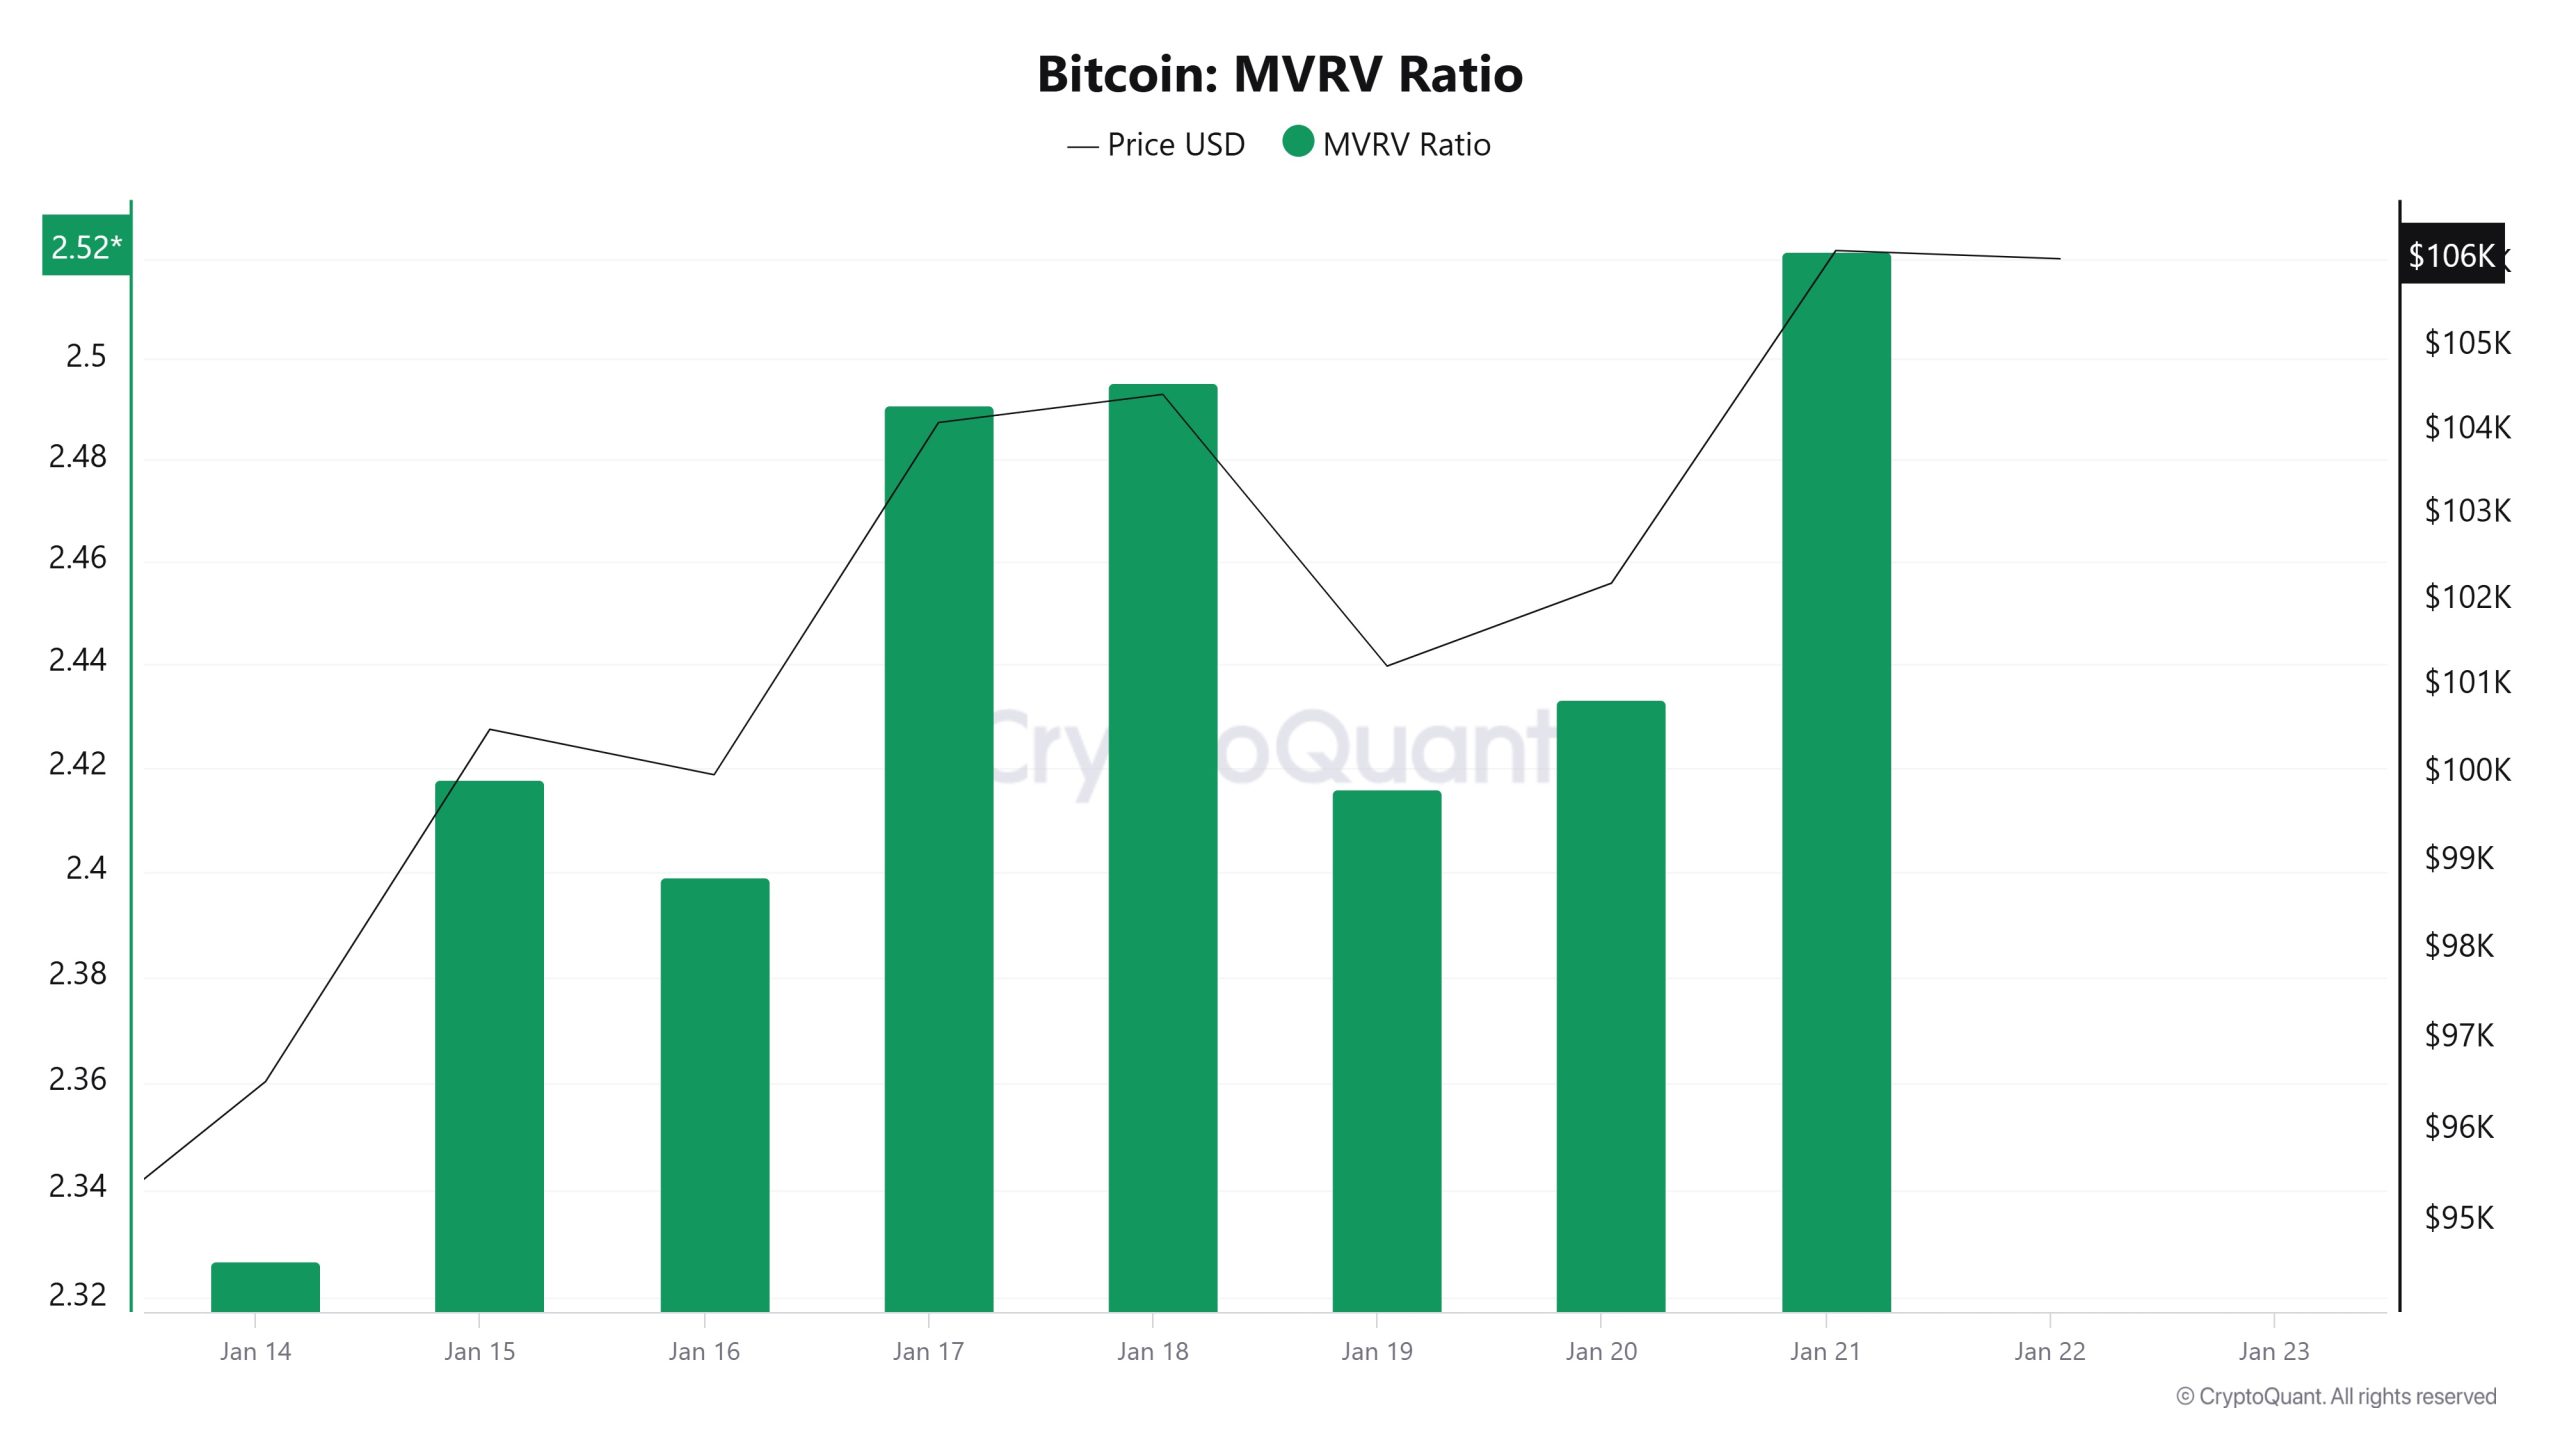
El 15 de enero, el precio del Bitcoin era de 100.503 mientras que el Ratio MVRV era de 2,41. El 21 de enero, el precio del Bitcoin era de 106.164, mientras que el Ratio MVRV era de 2,52. En comparación con la semana pasada, el precio del Bitcoin aumentó un 5,63% y el Ratio MVRV aumentó un 4,56%.
Precio realizado
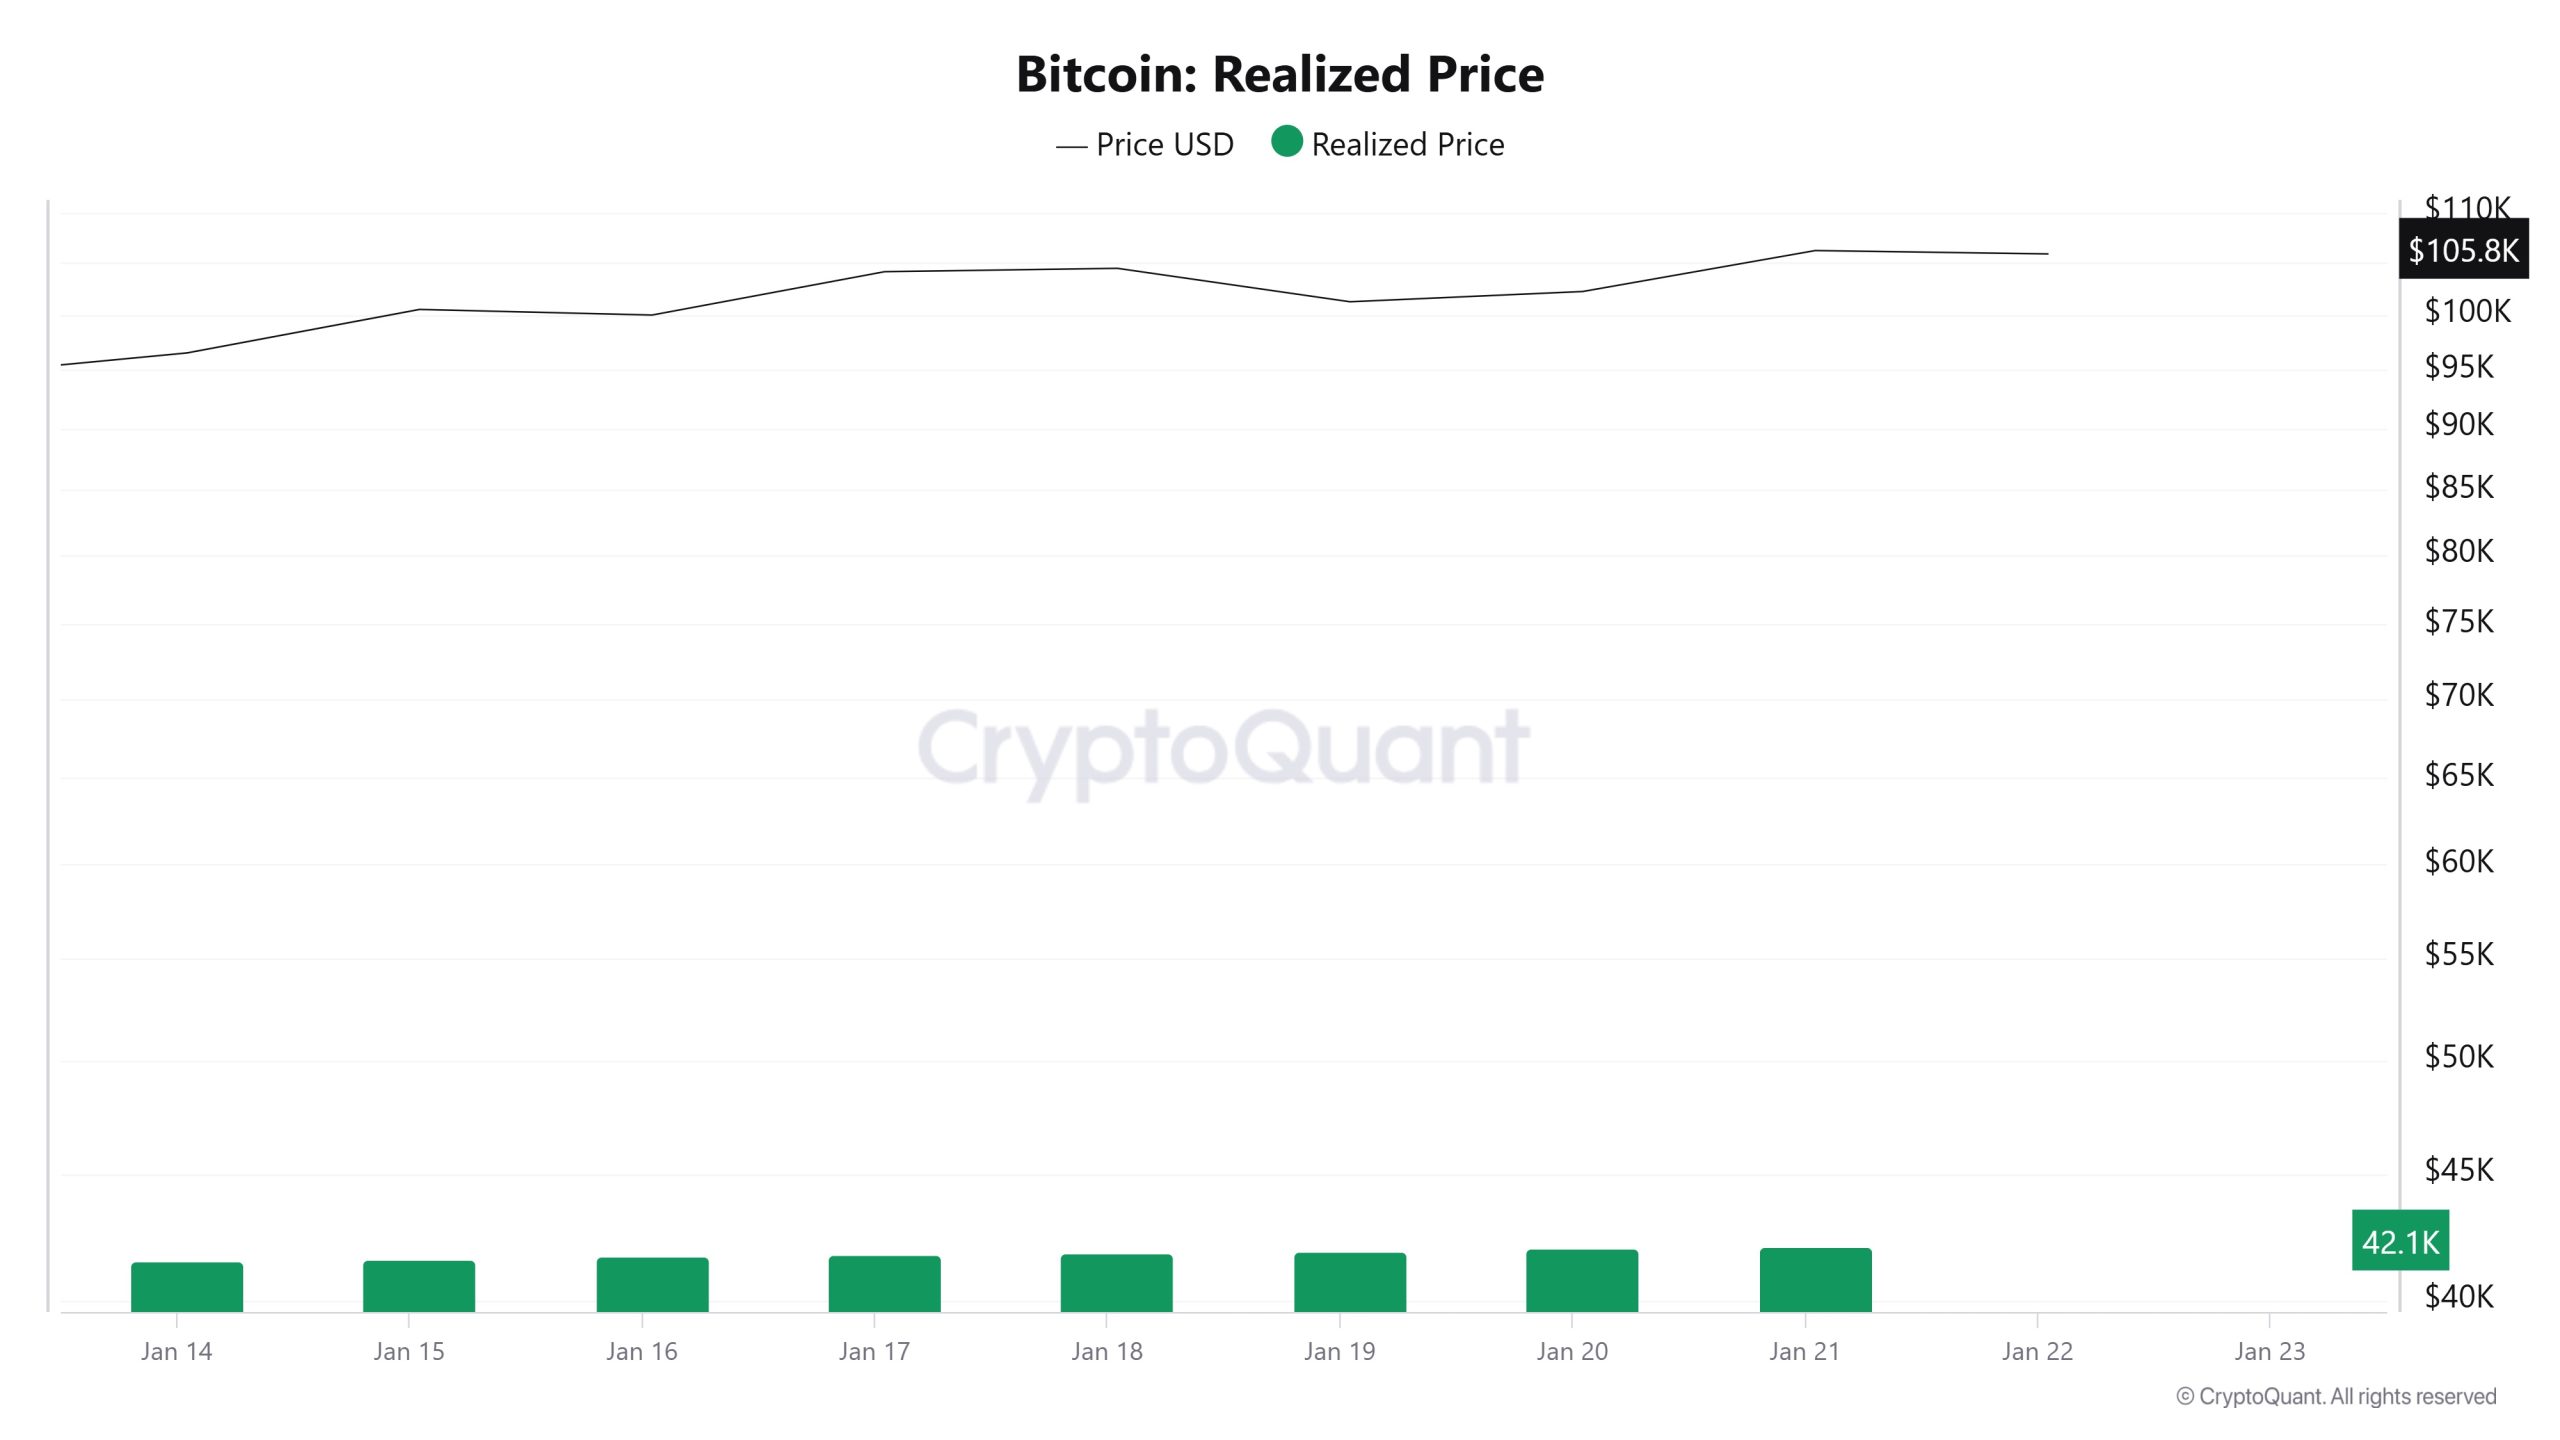
El 15 de enero, el precio del Bitcoin era de 100.503 mientras que el Precio Realizado era de 41.571. El 21 de enero, el precio del Bitcoin subió a 106.164 mientras que el Precio Realizado aumentó a 42.101. En comparación con la semana pasada, el precio del Bitcoin aumentó un 5,63% y el Precio Realizado aumentó un 1,27
Ratio de beneficio de la producción gastada (SOPR)
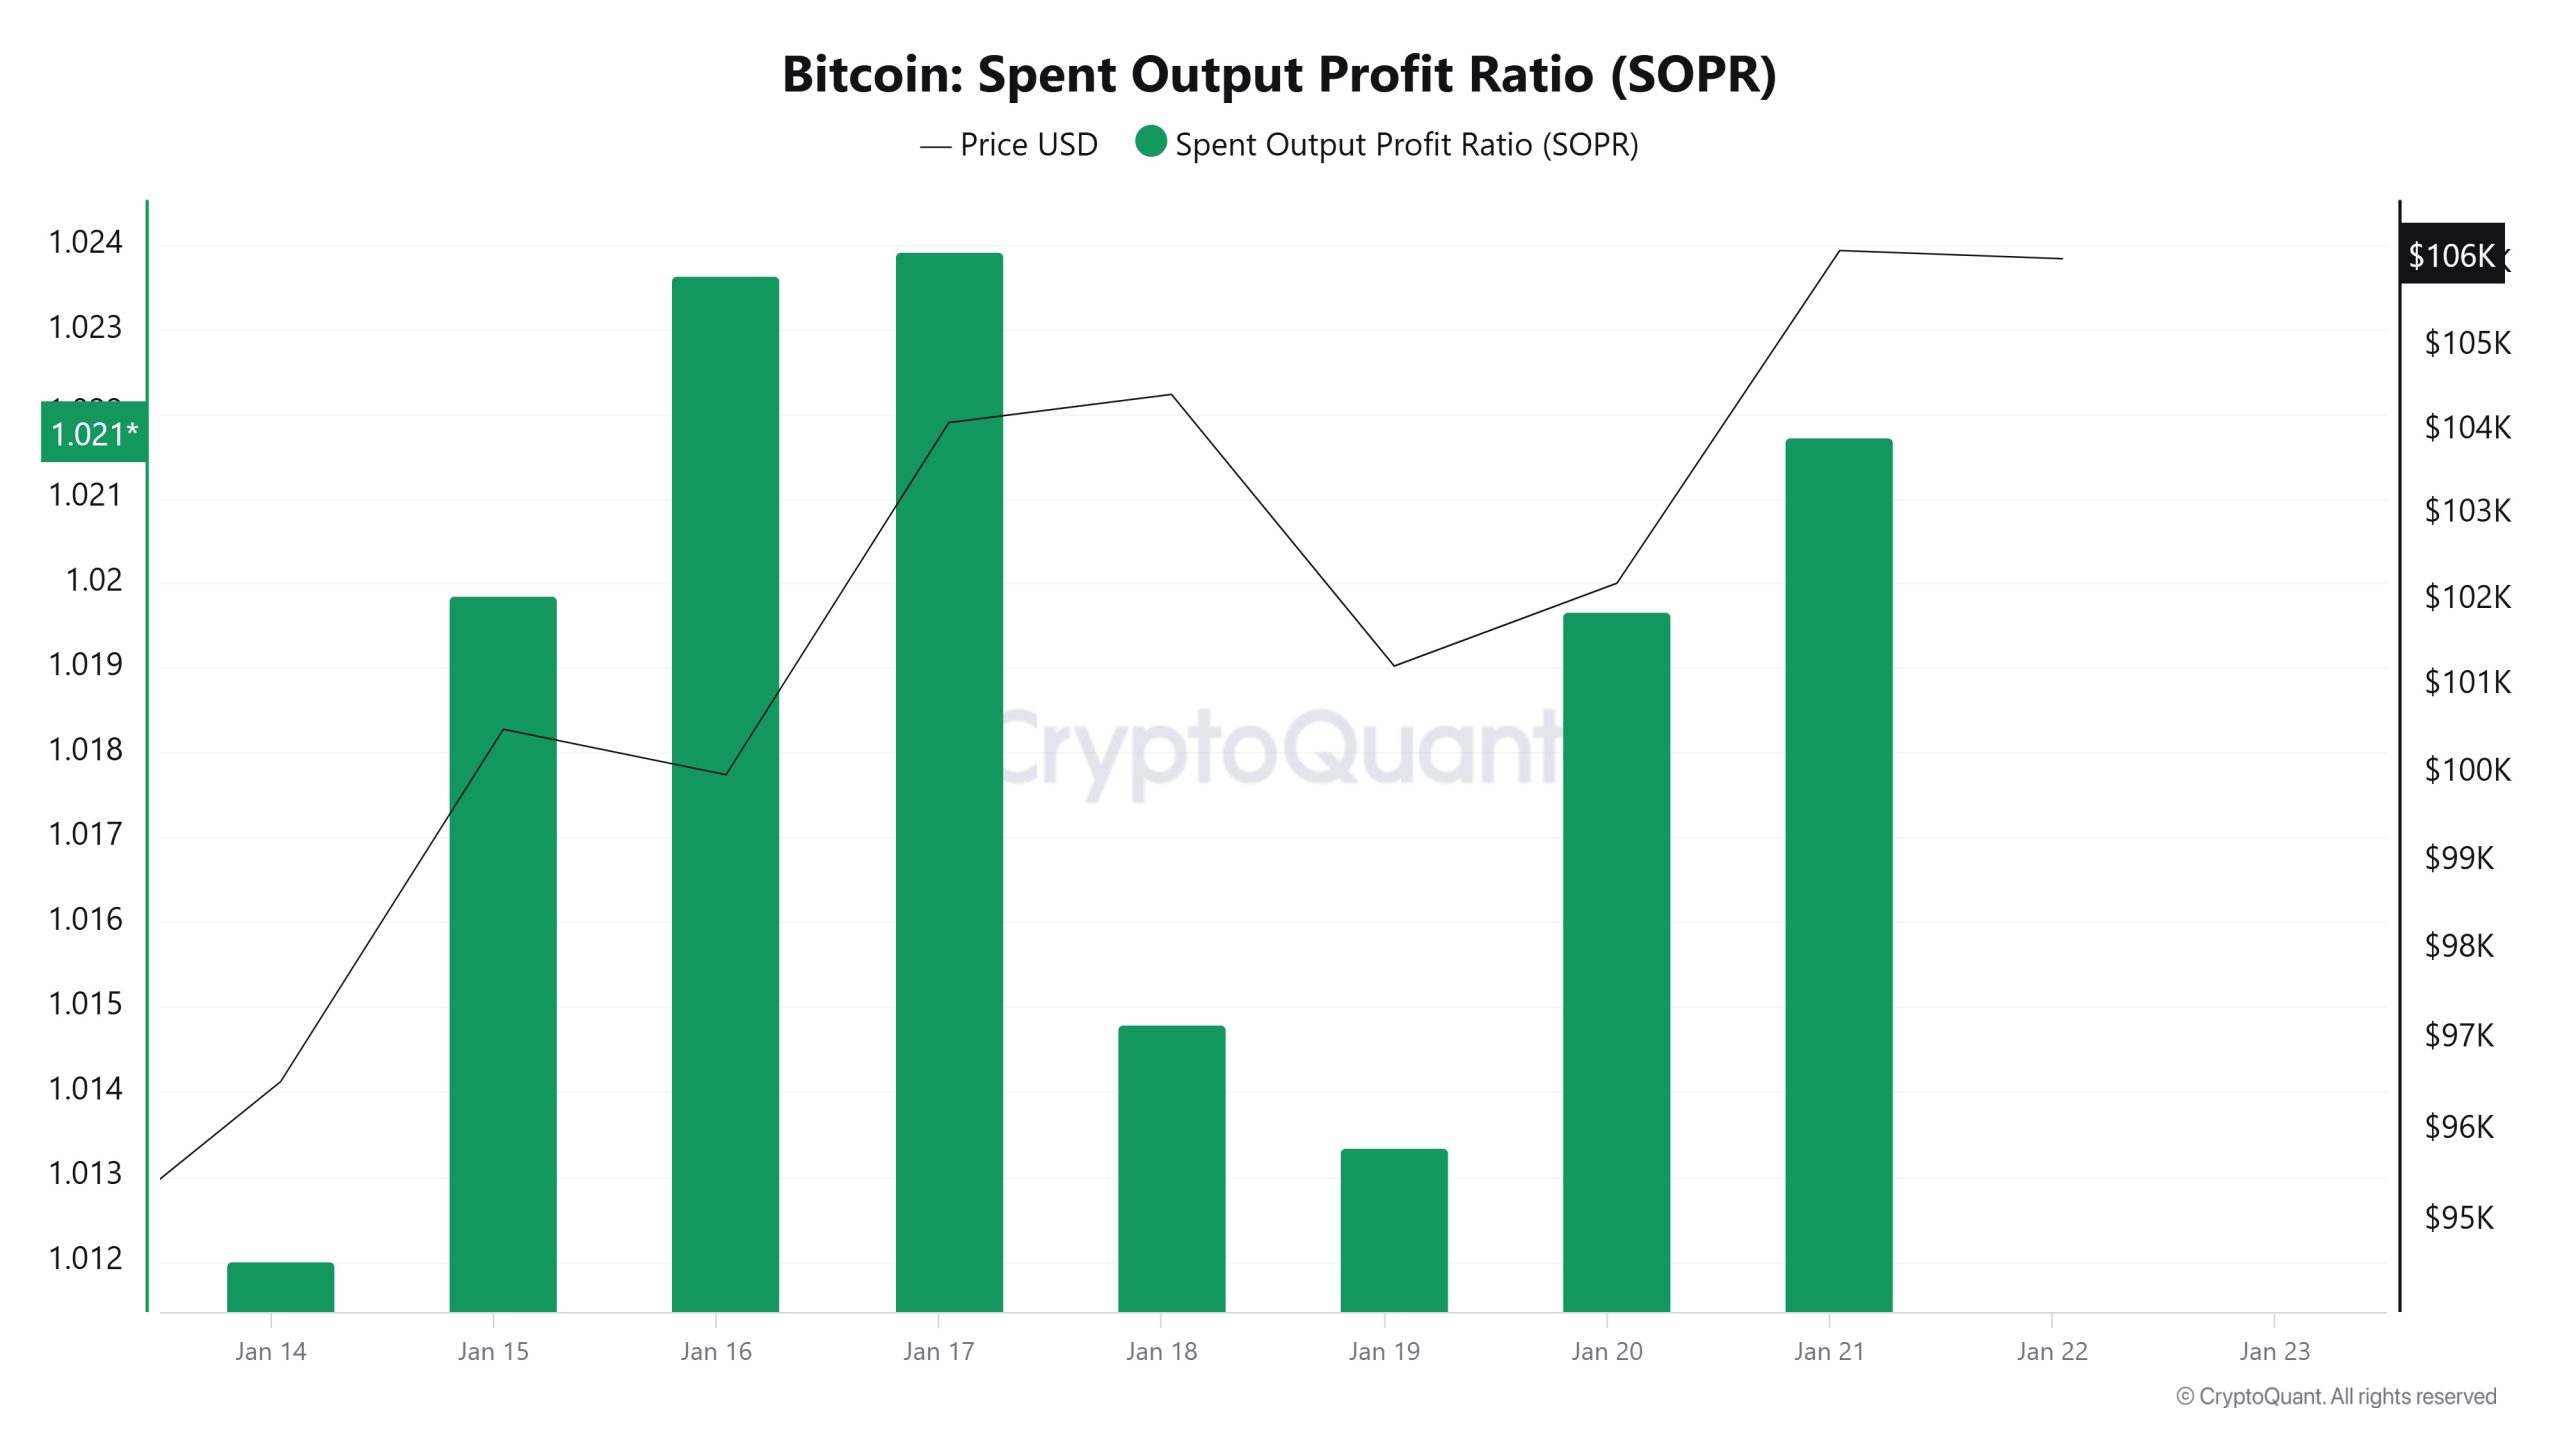
El 15 de enero, el precio del Bitcoin estaba en 100.503 mientras que la métrica SOPR era de 1,01. El 21 de enero, el precio del Bitcoin estaba en 106.164 mientras que la métrica SOPR estaba en 1,02. En comparación con la semana pasada, el precio del Bitcoin ha aumentado un 5,63% y la métrica SOPR ha aumentado aproximadamente un 1%.
Derivados
Interés abierto
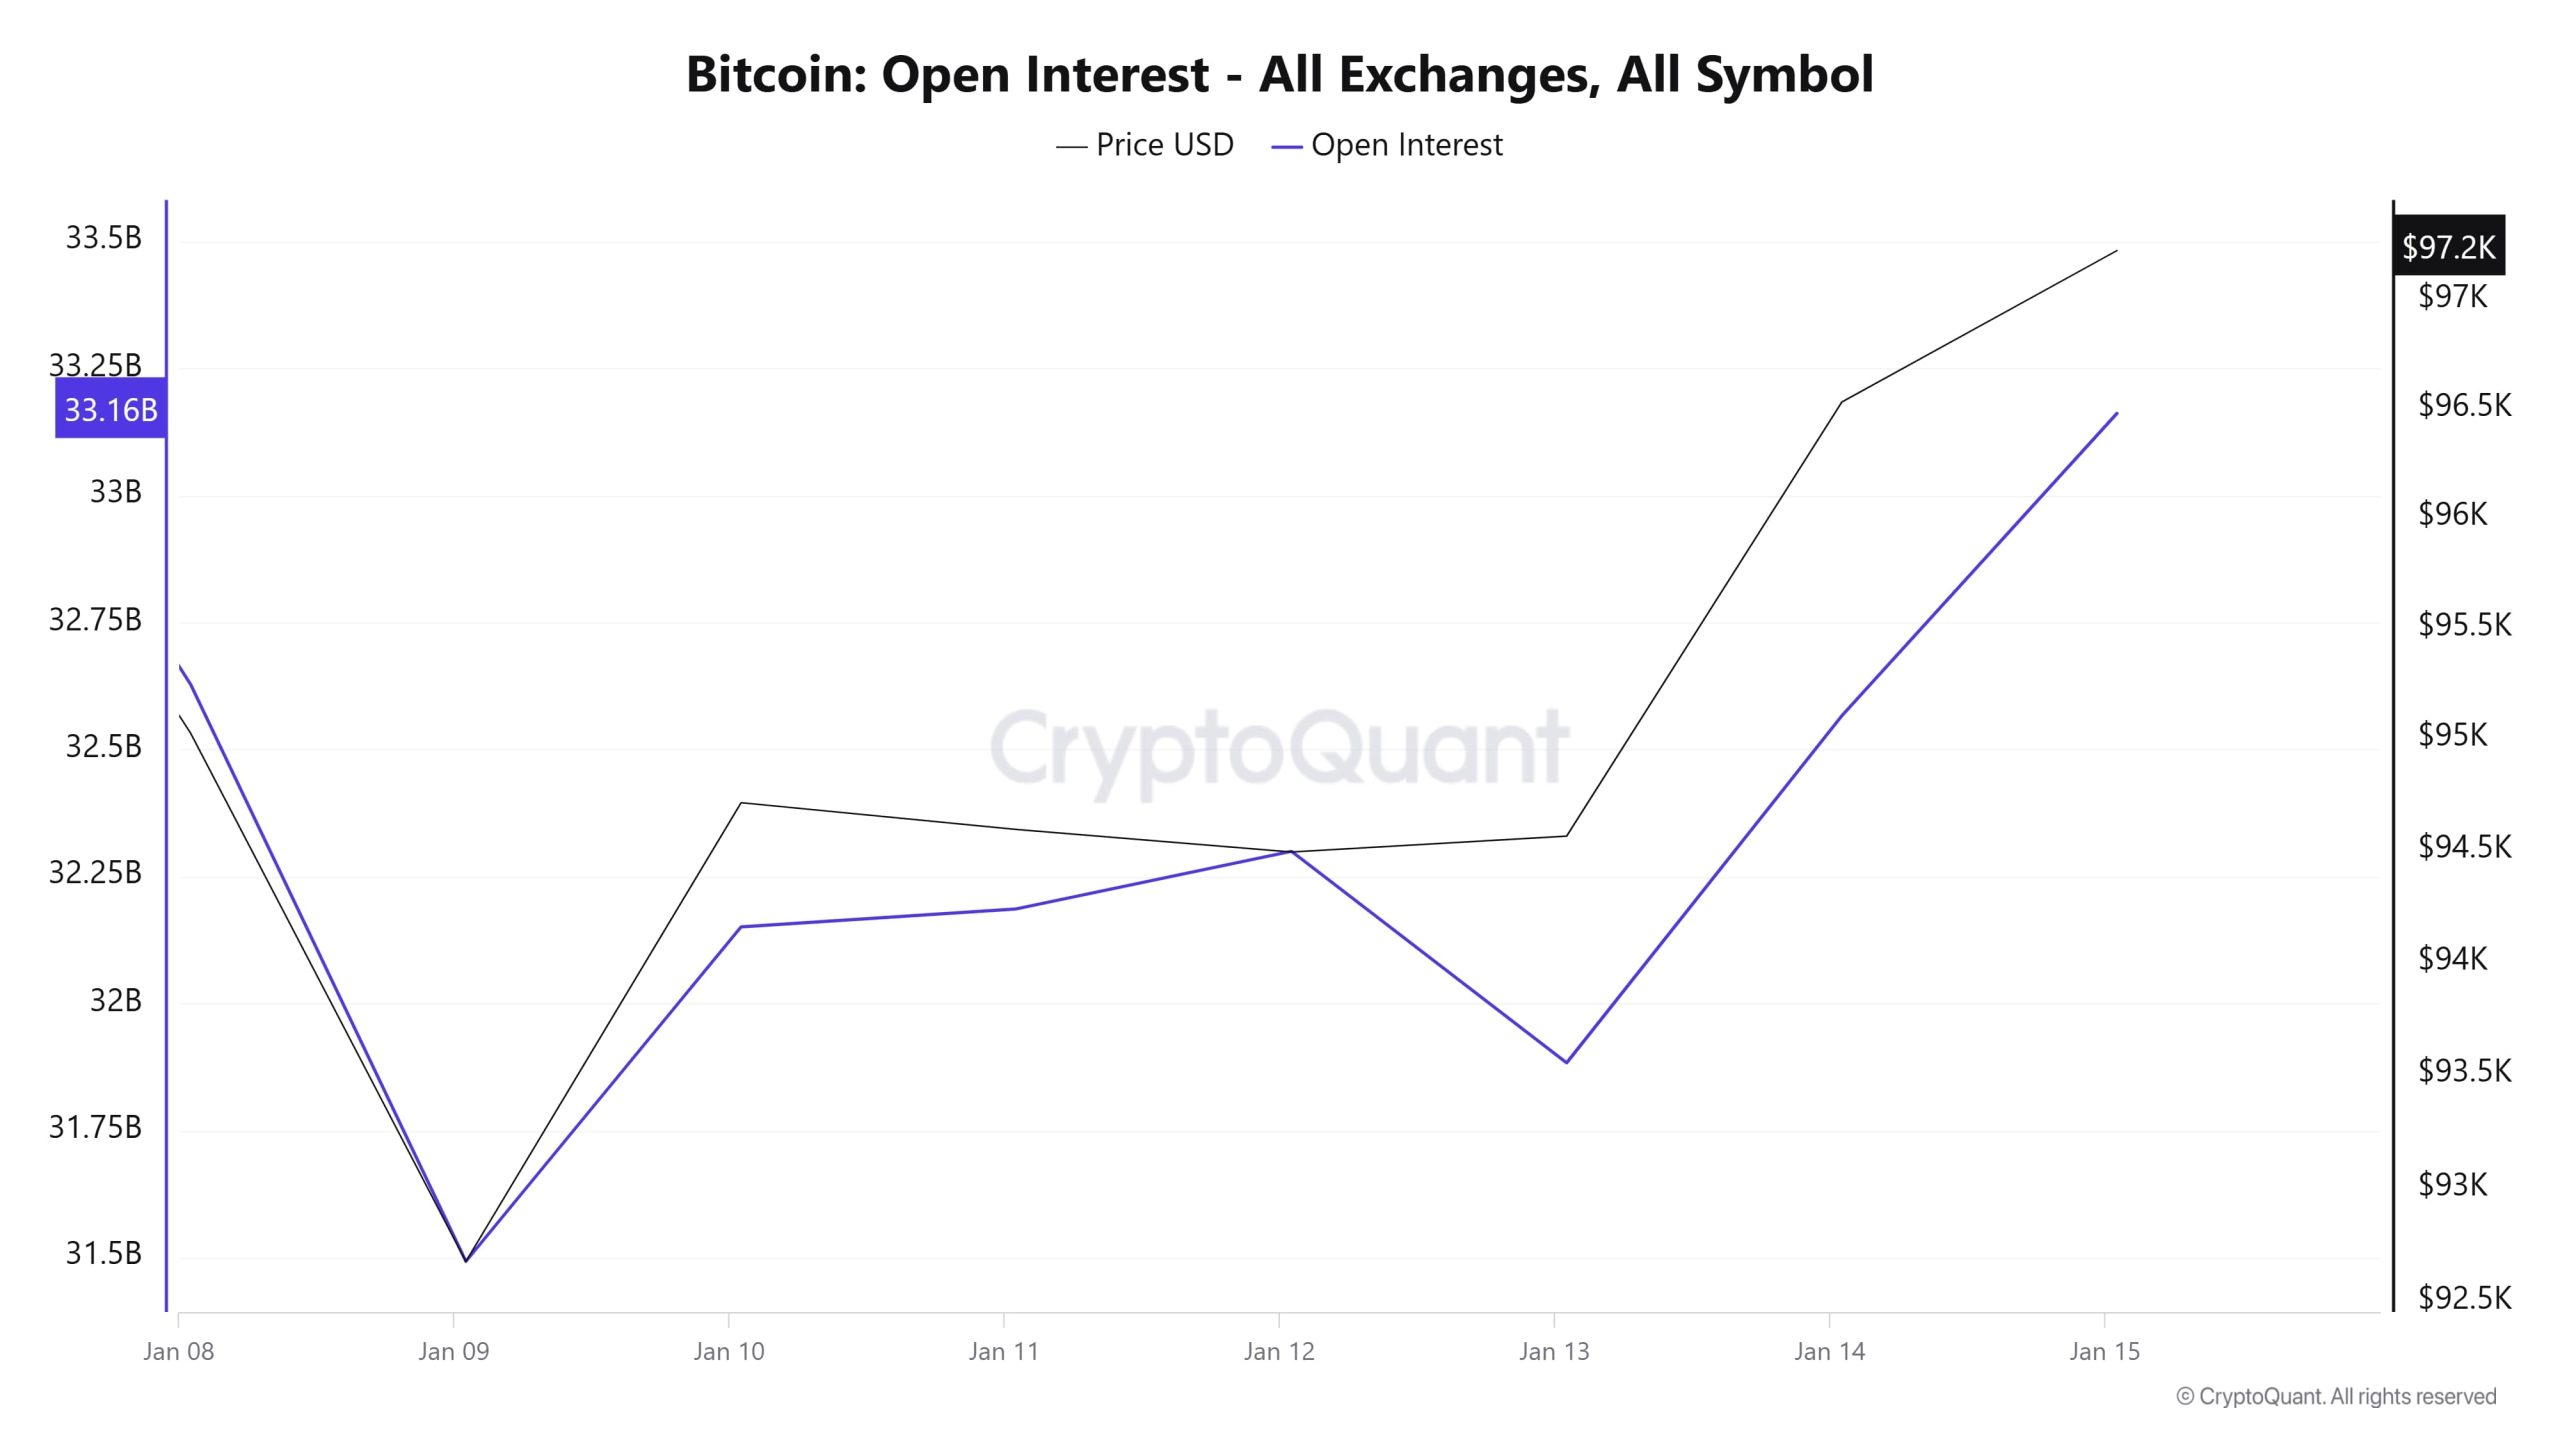
Esta semana, el Interés Abierto y el precio parecen moverse en línea con la correlación positiva. El interés abierto ha seguido una tendencia alcista constante, lo que indica un mayor interés de los inversores por el mercado de futuros y un mayor flujo de capital hacia el mercado. La subida del precio que le acompaña indica que el sentimiento alcista es fuerte en el mercado actual y que las expectativas de mercado de los inversores se perfilan en una dirección positiva.
Los bruscos descensos del 9 y el 13 de enero, que se produjeron simultáneamente tanto en el precio como en el interés abierto, indican que las posiciones en el mercado se cerraron rápidamente. Este tipo de descensos suelen producirse en periodos en los que los inversores adoptan estrategias de reducción del riesgo debido a la incertidumbre a corto plazo. Sin embargo, desde el 14 de enero se ha vuelto a producir un fuerte aumento del precio y del interés abierto. Esta subida muestra claramente que han entrado nuevas posiciones en el mercado y que el apetito por el riesgo de los participantes ha vuelto a aumentar. Especialmente el aumento paralelo del precio y del interés abierto es un indicador importante de la sostenibilidad del impulso alcista.
Sin embargo, el rápido aumento del interés abierto también sugiere que el mercado se ha apalancado en exceso, un riesgo que podría provocar grandes liquidaciones si los movimientos de los precios se invierten. Aunque el aumento del interés abierto suele indicar el fortalecimiento de una tendencia, si el precio se aplana o desciende, podría ser un signo de estrechez del mercado o del comienzo de la realización de beneficios. Un escenario así podría provocar una gran volatilidad, especialmente cuando el apalancamiento es elevado.
Tasa de financiación
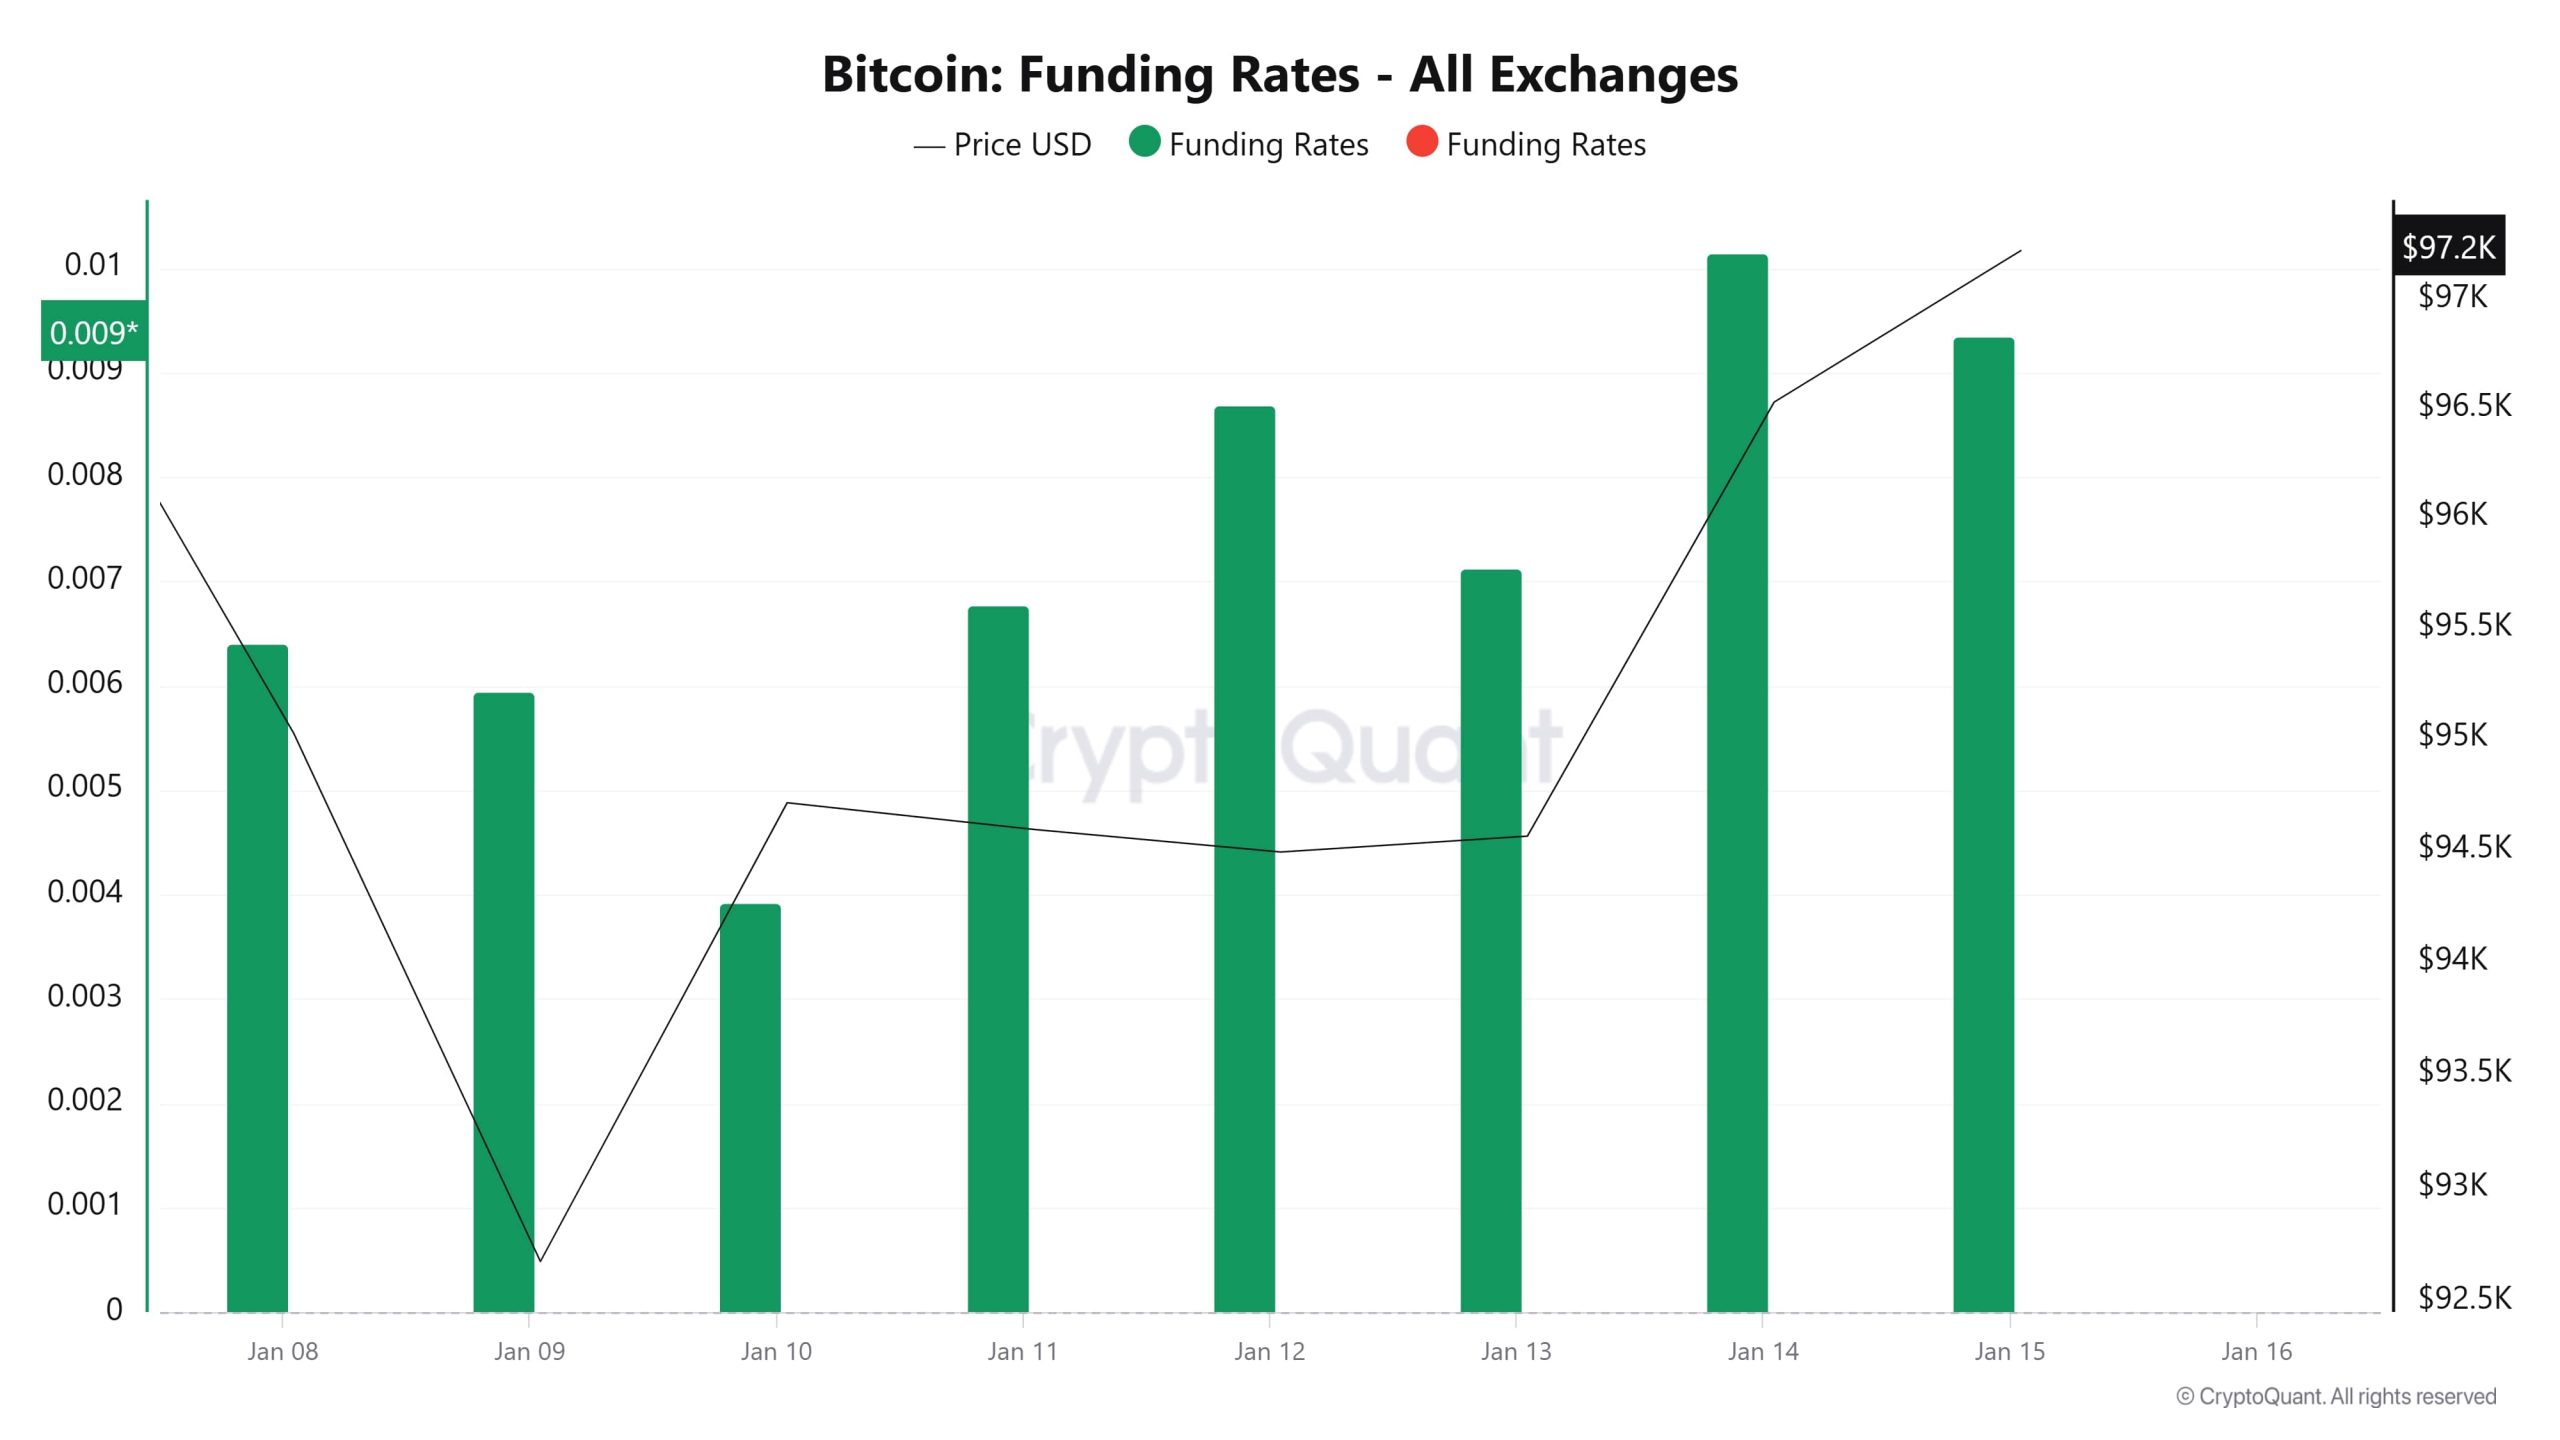
Las tasas de financiación del bitcoin siguen siendo positivas y el precio mantiene una tendencia alcista. Las tasas de financiación positivas indican que el mercado está formado en gran parte por posiciones largas y que los inversores tienen fuertes expectativas alcistas. El descenso en torno al 9 de enero sugiere que hubo un retroceso tanto en las tasas de financiación como en el precio, lo que sugiere que los inversores cerraron posiciones o que las posiciones cortas ganaron peso. Sin embargo, la subida de la tasa de financiación después del 14 de enero sugiere que las expectativas alcistas vuelven a fortalecerse en el mercado. Sin embargo, si la tasa de financiación se mantiene en niveles elevados durante un periodo prolongado, el mercado podría sobreapalancarse y correr el riesgo de una posible corrección
Liquidaciones largas y cortas
Tras una semana muy activa, similar a la anterior, el Bitcoin sigue cotizando de nuevo por encima de los 96.000 dólares. Con las profundas caídas de los días 8, 9 y 13 de enero, destacan las altas cantidades de liquidaciones tanto en posiciones largas como cortas. Cuando se analiza el mapa térmico de liquidaciones, destaca el bloque de liquidaciones formado hasta los niveles de 99.000. Aunque las subidas hasta estos niveles parecen posibles, la falta de suficiente soporte al contado y los datos de bajo volumen pueden indicar que Bitcoin se encuentra en una fase de decisión crítica que requiere precaución.
| Fecha | Largo Importe (Millones $) | Corto Importe (Millones $) |
|---|---|---|
| 08 de enero | 26.44 | 17.08 |
| 09 de enero | 21.53 | 5.48 |
| 10 de enero | 7.21 | 23.29 |
| 11 de enero | 1.74 | 2.01 |
| 12 de enero | 12.31 | 1.16 |
| 13 de enero | 22.69 | 23.06 |
| 14 de enero | 6.31 | 10.84 |
| Total | 98.23 | 82.92 |
Distribución de suministros
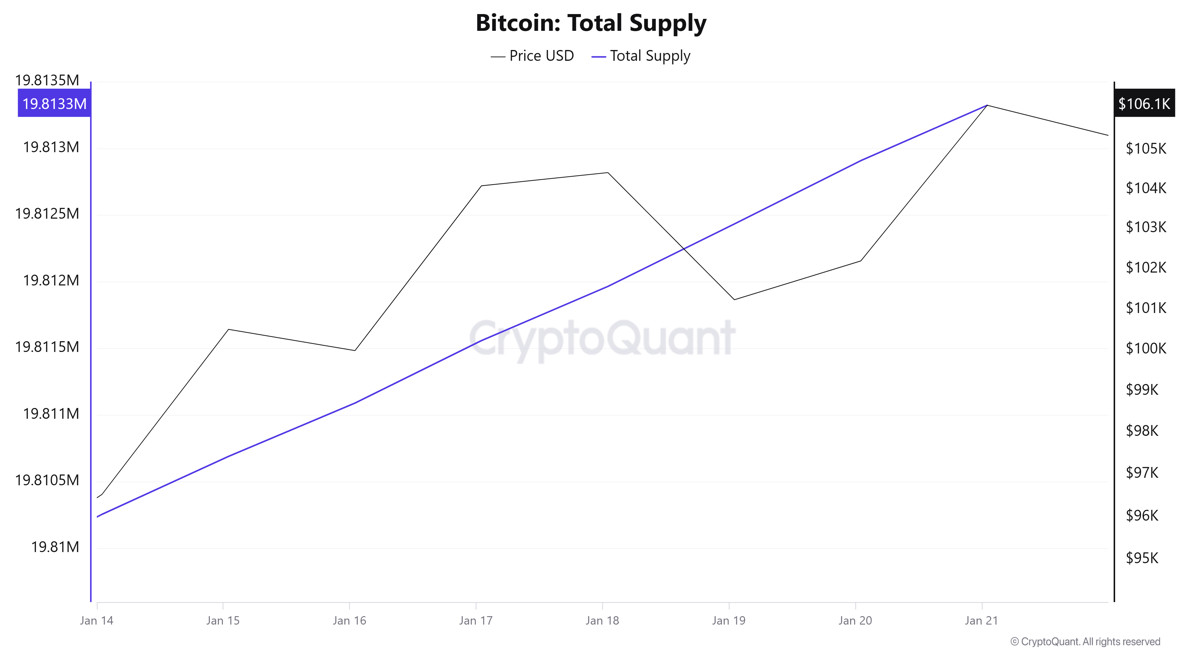
Oferta total: Alcanzó las 19.813.324 unidades, un 0,0155% más que la semana pasada.
Nuevo suministro: La cantidad de BTC producida esta semana fue de 3.069.
Velocidad: Descenso continuado en comparación con la semana anterior.
| Categoría de carteras | 14.01.2025 | 21.01.2025 | Cambio (%) |
|---|---|---|---|
| < 0.1 BTC | 1.590% | 1.590% | - |
| 0,1 - 1 BTC | 5.417% | 5.409% | -0.148% |
| 1 - 100 BTC | 32.320% | 32.266% | -0.167% |
| 100 - 1k BTC | 22.569% | 22.646% | 0.341% |
| 1k - 100k BTC | 34.835% | 34.818% | -0.049% |
| > 100k BTC | 3.270% | 3.270% | - |
When we look at the supply distribution, the highest change was seen in the “100 – 1k BTC” category with an increase of 0.341%. In addition, there were decreases of 0.148% and 0.167% in the “0.1 – 1 BTC” and “1 – 100 BTC” categories, respectively. A small decrease of 0.049% was recorded in the “1k – 100k BTC” category, while there was no change in the “< 0.1 BTC” and “> 100k BTC” categories.
Reserva de cambio
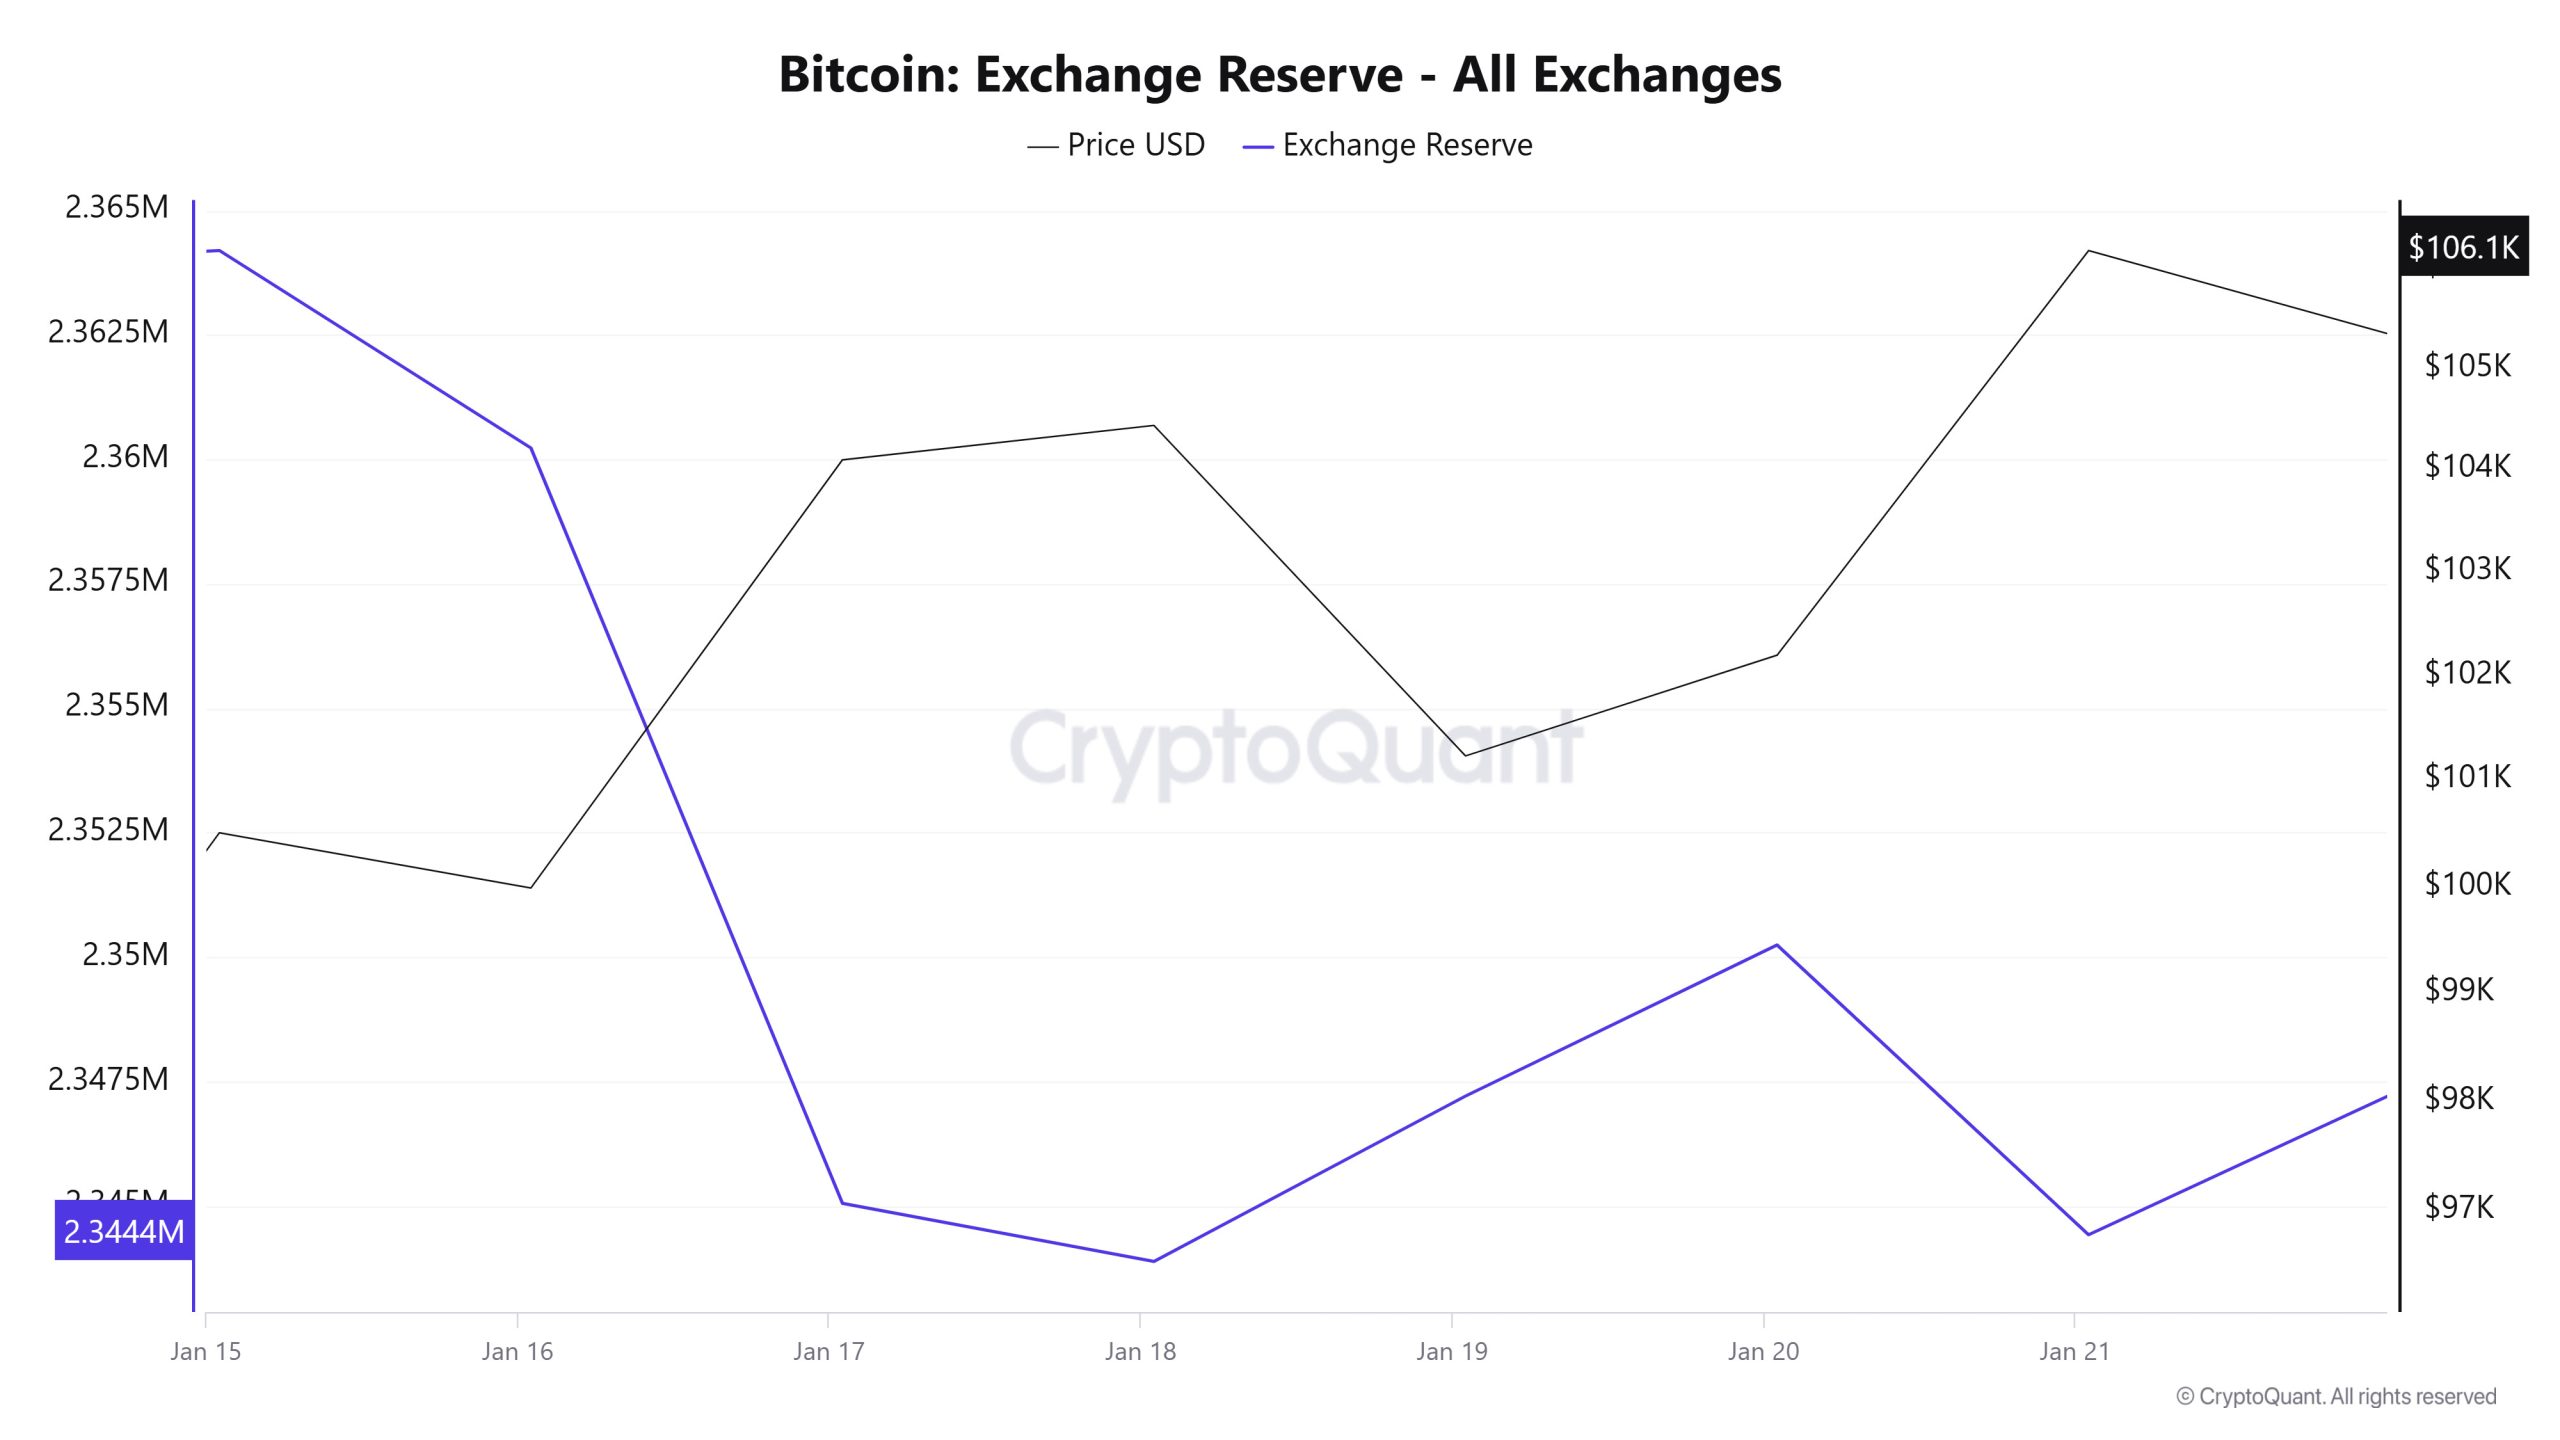 Entre el 15 y el 21 de enero de 2025, las reservas de Bitcoin en las bolsas disminuyeron de 2.363.886 BTC a 2.344.417 BTC. En total, se produjo una salida neta de 19.469 BTC durante este periodo y las reservas de Bitcoin de las bolsas disminuyeron un 0,82%. Los movimientos más notables durante este periodo se produjeron el 17 de enero de 2025. En esta fecha, las bolsas registraron una salida neta de 15.178 BTC y una caída significativa de las reservas. Sin embargo, los días 19 y 20 de enero destacaron entradas netas de 3.323 BTC y 3.036 BTC, respectivamente. El precio del Bitcoin aumentó aproximadamente un 5,6% durante este periodo. El Bitcoin, que cerró a 100.504 $ el 15 de enero de 2025, cerró a 106.165 $ el 21 de enero de 2025.
| Fecha | 15-Ene | 16-Ene | 17-Ene | 18-Ene | 19-Ene | 20-Ene | 21-Ene |
|---|---|---|---|---|---|---|---|
| Entrada de divisas | 33,081 | 46,294 | 51,280 | 20,095 | 26,701 | 43,643 | 50,811 |
| Salida de divisas | 32,772 | 50,262 | 66,457 | 21,263 | 23,378 | 40,608 | 56,634 |
| Intercambio Netflow | 309 | -3,968 | -15,178 | -1,168 | 3,323 | 3,036 | -5,823 |
| Reserva de cambio | 2,364,194 | 2,360,227 | 2,345,049 | 2,343,881 | 2,347,204 | 2,350,240 | 2,344,417 |
| Precio del BTC*. | 100,504 | 99,982 | 104,095 | 104,431 | 101,233 | 102,198 | 106,165 |
Tasas e ingresos
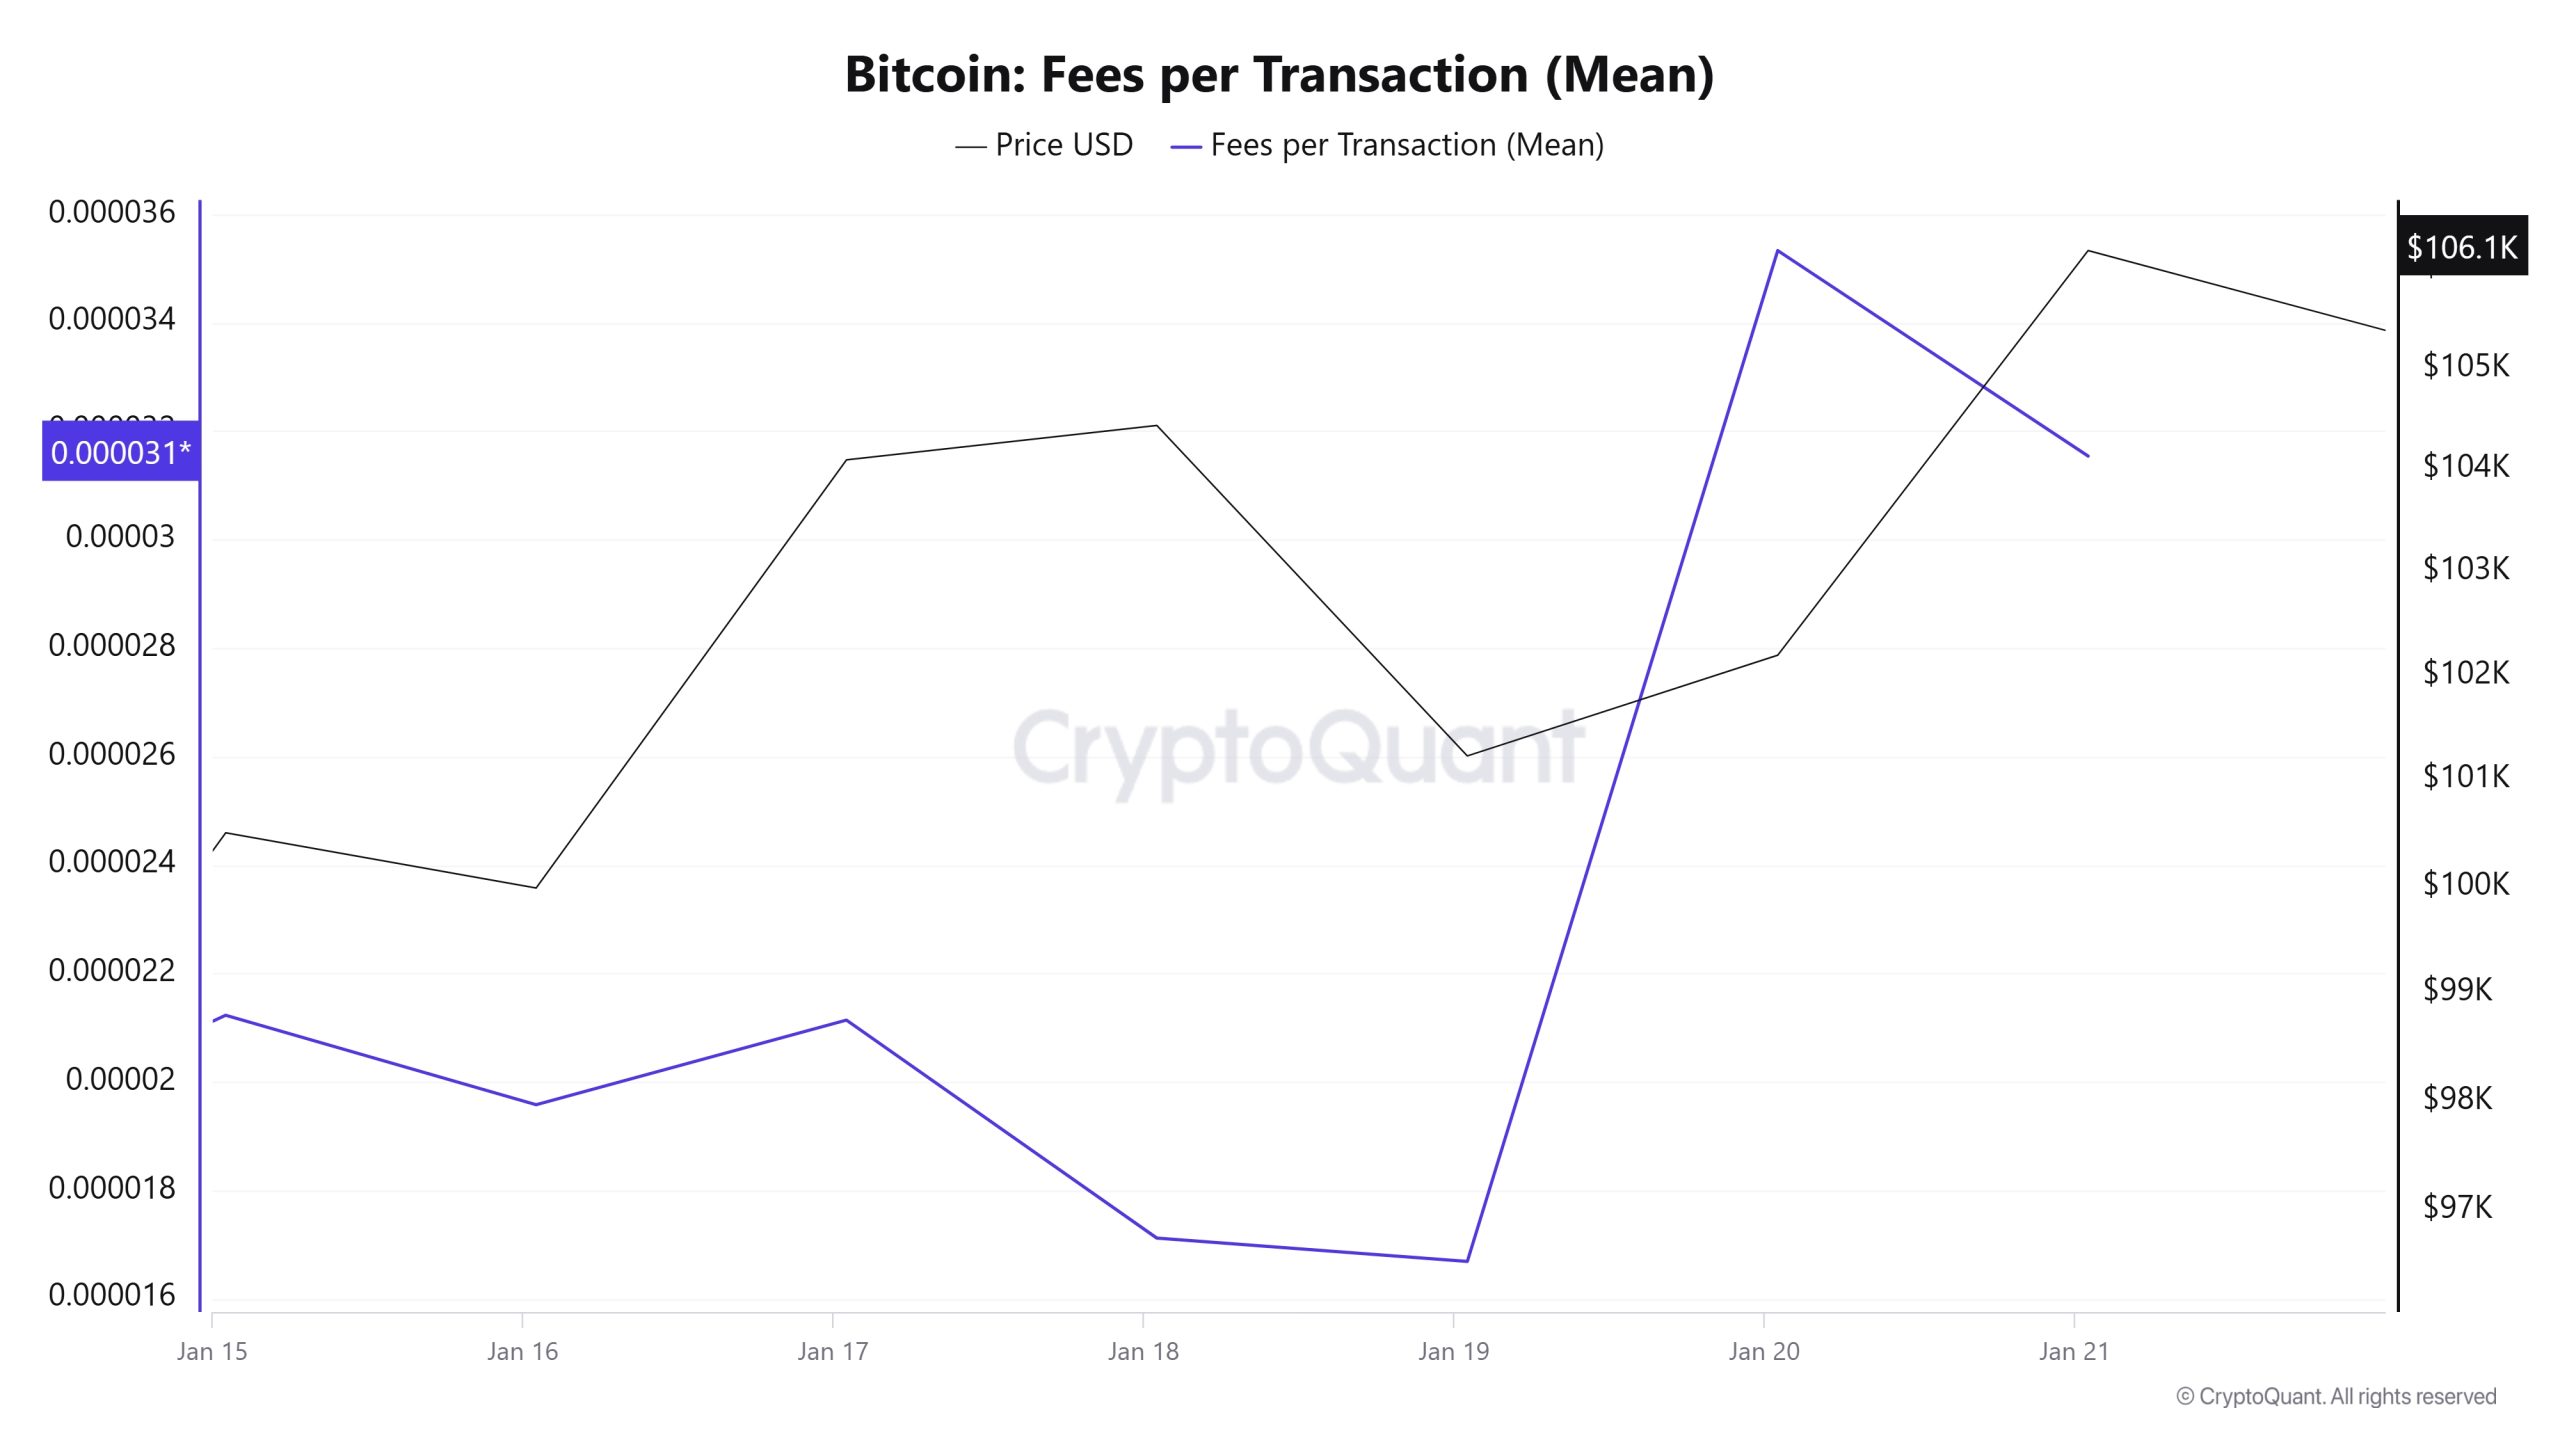 Analizando los datos de Bitcoin Fees per Transaction (Mean) entre el 15 y el 21 de enero, se observó que este valor estaba en 0,00002123 el 15 de enero, el primer día de la semana. Hasta el 19 de enero, Bitcoin Fees per Transaction (Mean), que siguió un curso paralelo al precio del Bitcoin, alcanzó su nivel más bajo de la semana en 0,00001669 el 19 de enero. A continuación, se observó un curso volátil hasta el discurso de juramento presidencial de Donald Trump, que fue reelegido presidente de EE.UU. el 20 de enero. En este contexto, subió a 0,00003533 el 20 de enero, alcanzando el valor más alto de la semana.
El 21 de enero, último día del periodo semanal, el valor de las Comisiones por Transacción (Media) comenzó a descender de nuevo y cayó a 0,00003154 con el curso relativamente tranquilo y la volatilidad decreciente observados en el precio del Bitcoin.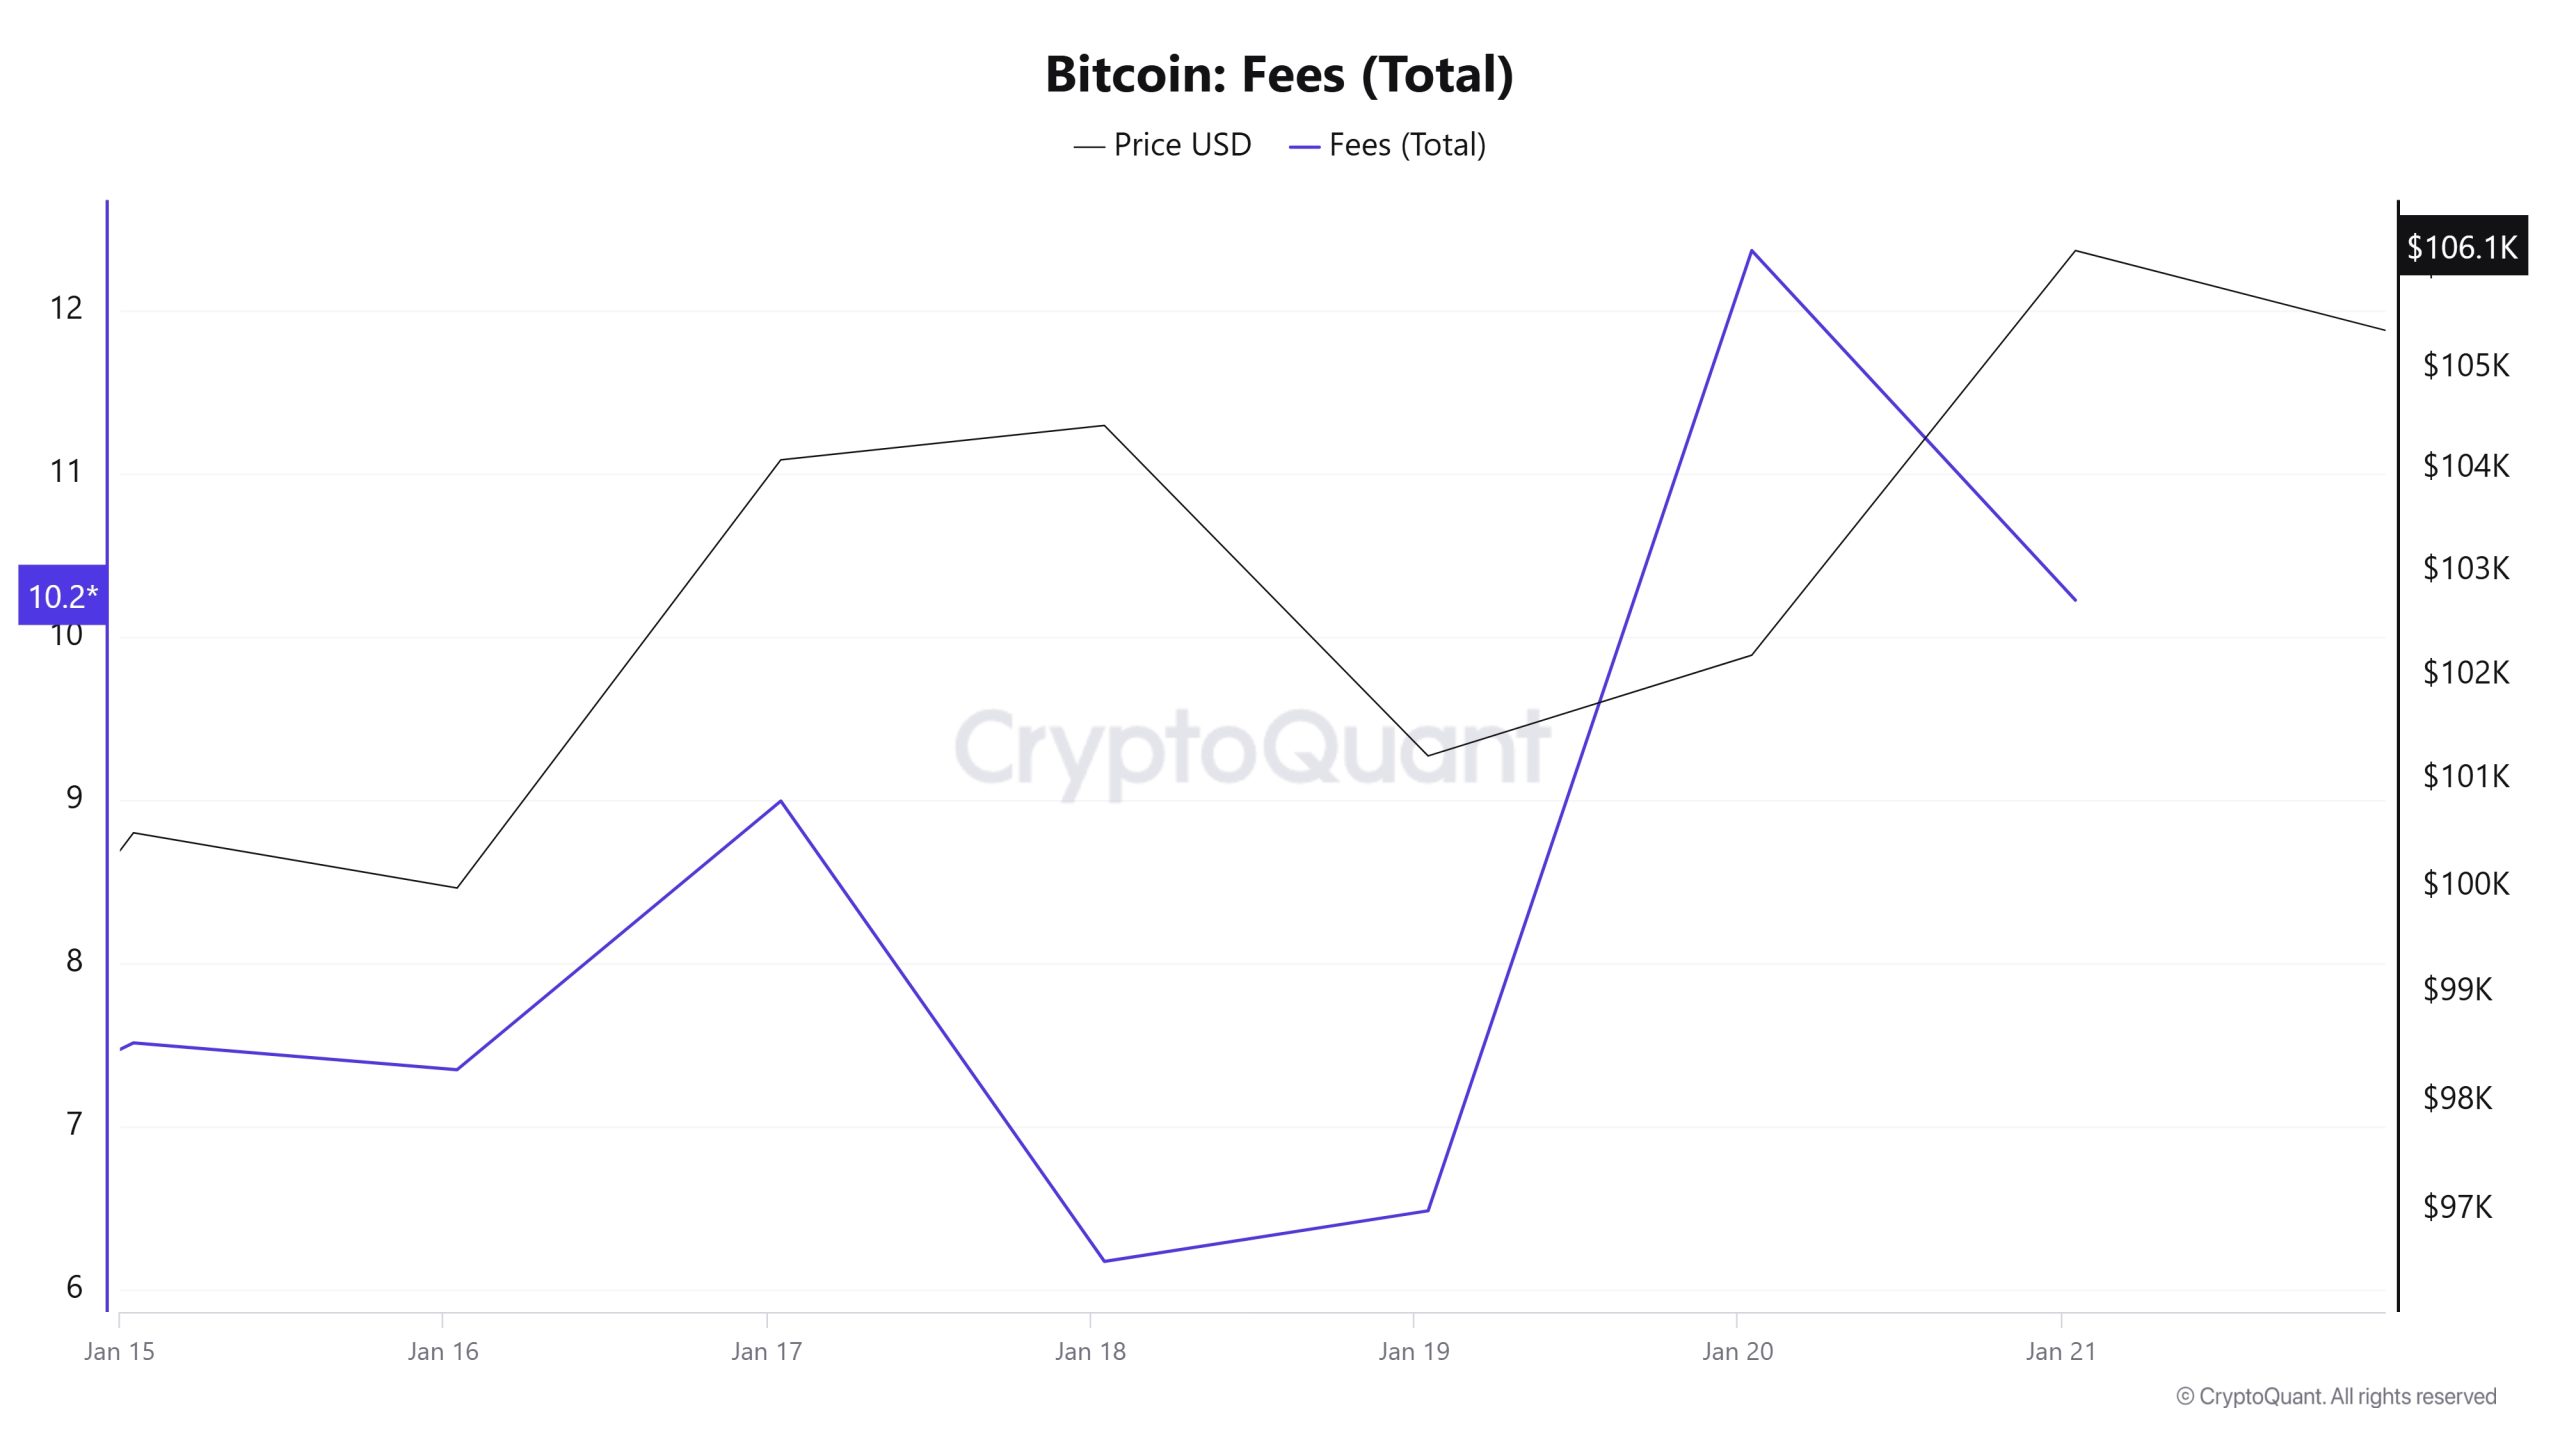 Del mismo modo, cuando se analizan los datos de Bitcoin Fees (Total) entre el 15 y el 21 de enero, se observa que el valor de Bitcoin Fees (Total), que estaba en 7,51249449 el 15 de enero, el primer día de la semana, mostró un descenso gradual hasta el 18 de enero y alcanzó el nivel más bajo de la semana con un valor de 6,1723701.
Sin embargo, a partir del 19 de enero, el valor del Bitcoin Fees (Total) también empezó a subir con la creciente volatilidad del precio del Bitcoin. En este contexto, el 20 de enero, el valor alcanzó los 12.37123961 y se registró como el valor más alto de la semana.
Flujos mineros
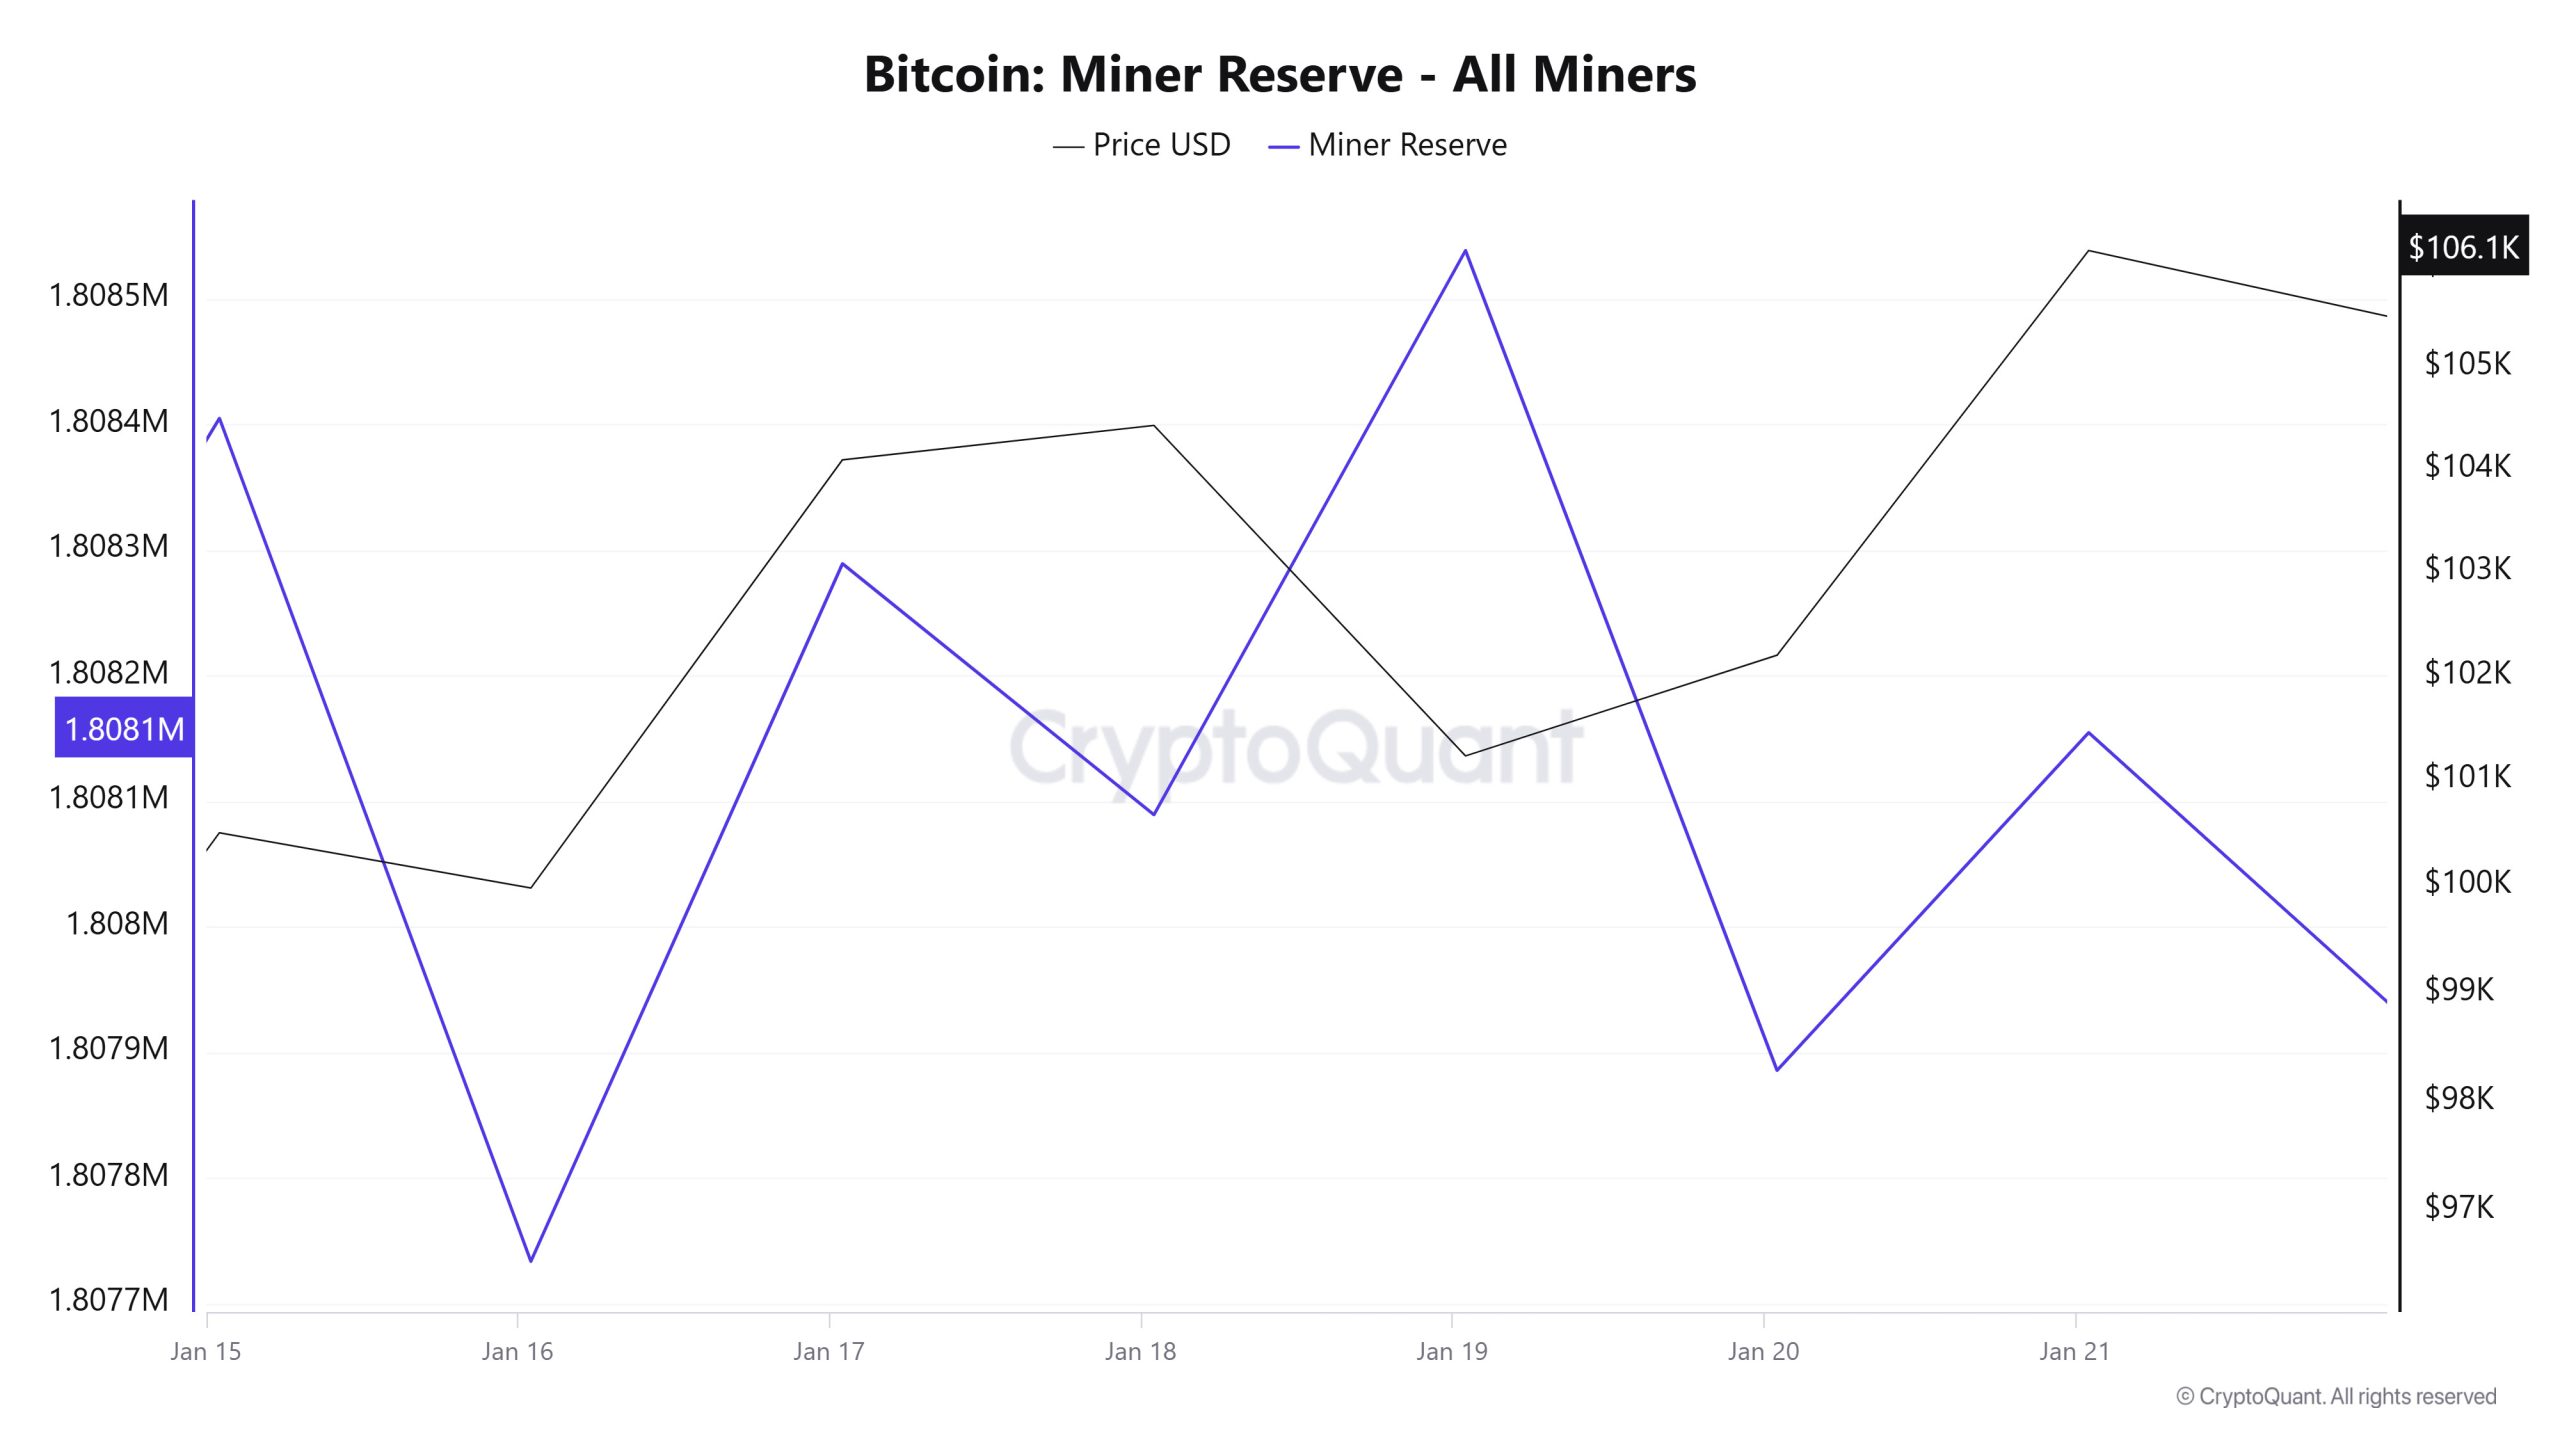
Como puede verse en la tabla Reserva de mineros, el número de Bitcoins en las carteras de los mineros disminuyó esta semana. Aunque la semana comenzó con una correlación positiva entre la Reserva de Mineros y el precio del Bitcoin, esta correlación se volvió negativa hacia el final de la semana.
Miner Inflow, Outflow y NetFlow
Entre el 15 y el 21 de enero, 59.863 Bitcoins salieron de los monederos de los mineros, y 60.025 Bitcoins entraron en los monederos de los mineros entre las mismas fechas. El flujo neto de mineros para esta semana fue de 162 Bitcoin. Mientras tanto, mientras que el precio del Bitcoin era de 100.503 dólares el 15 de enero, se observó como de 106.164 dólares el 21 de enero.
Durante la semana, el flujo neto (Miner NetFlow) fue en general positivo, ya que la entrada de Bitcoin en los monederos de los mineros (Miner Inflow) fue superior a la salida de Bitcoin de los monederos de los mineros (Miner Outflow).
| Fecha | 15 de enero | 16 de enero | 17 de enero | 18 de enero | 19 de enero | 20 de enero | 21 de enero |
|---|---|---|---|---|---|---|---|
| Entrada de mineros | 6,702.90 | 6,677.28 | 9,374.66 | 6,364.79 | 9,187.06 | 11,957.79 | 9,760.73 |
| Salida de mineros | 6,290.94 | 7,348.77 | 8,818.98 | 6,564.68 | 8,737.76 | 12,610.73 | 9,491.72 |
| Miner NetFlow | 411.96 | -671.49 | 555.68 | -199.89 | 449.30 | -652.94 | 269.01 |
Transacción
 Recuento de transacciones
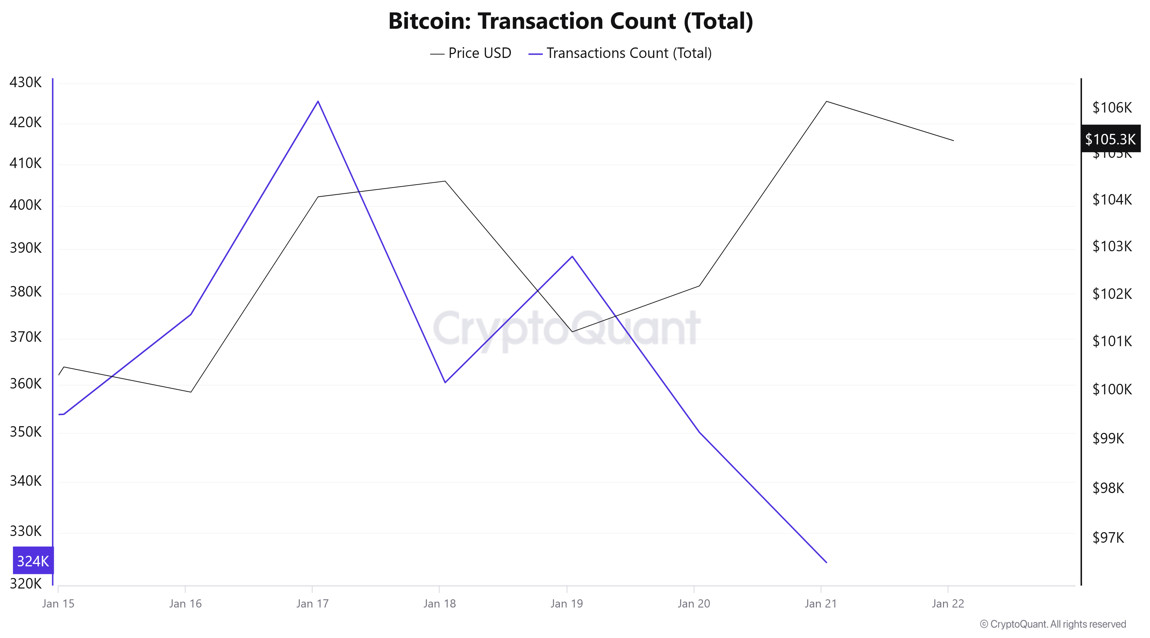
Durante la semana del 8 al 14 de enero, se produjeron un total de 3.196.381 transacciones, mientras que durante la semana del 15 al 21 de enero, el número de transacciones se redujo a 2.578.010, un descenso de aproximadamente el 19,35% en comparación con la semana anterior. Sorprendentemente, el volumen más bajo de transacciones en la red se produjo el lunes y el martes, 20-21 de enero. Esto supone un cambio con respecto a los descensos en las trading que suelen ser característicos de los fines de semana. El mayor número de transacciones de la semana fue de 425.511 el 17 de enero. Aunque hubo una correlación positiva entre el número de trades y el precio hasta esa fecha, la relación se invirtió durante el resto de la semana, con una correlación inversa entre el precio y el número de trades.
Fichas transferidas
En la semana del 8 al 14 de enero, la cantidad de Bitcoin transferida fue de 4.760.329, mientras que en la semana del 15 al 21 de enero, esta cantidad aumentó un 26,16% hasta alcanzar los 6.005.751. Los niveles más bajos en la cantidad de Bitcoin transferida se observaron generalmente el sábado y el domingo, como en periodos anteriores. Los días 16, 18 y 21 de enero, hubo una relación inversa entre la cantidad de Bitcoin transferida y el precio, mientras que los días 15, 17, 19 y 20 de enero, la relación fue directamente proporcional.
Actividades con ballenas
 La empresa de análisis de criptodivisas Alphractal descubrió que las ballenas traders a gran escala- desempeñan un papel importante en la conformación de las tendencias de los precios, mientras que traders individuales proporcionan liquidez pero a menudo quedan rezagados en el proceso de toma de decisiones. Según Alphractal, las ballenas de las bolsas favorecen cada vez más las posiciones cortas y cierran las largas. Por el contrario, traders operadores individuales, definidos como aquellos con posiciones que oscilan entre 1.000 y 10.000 dólares, han aumentado constantemente sus posiciones largas.
Datos de ballenas
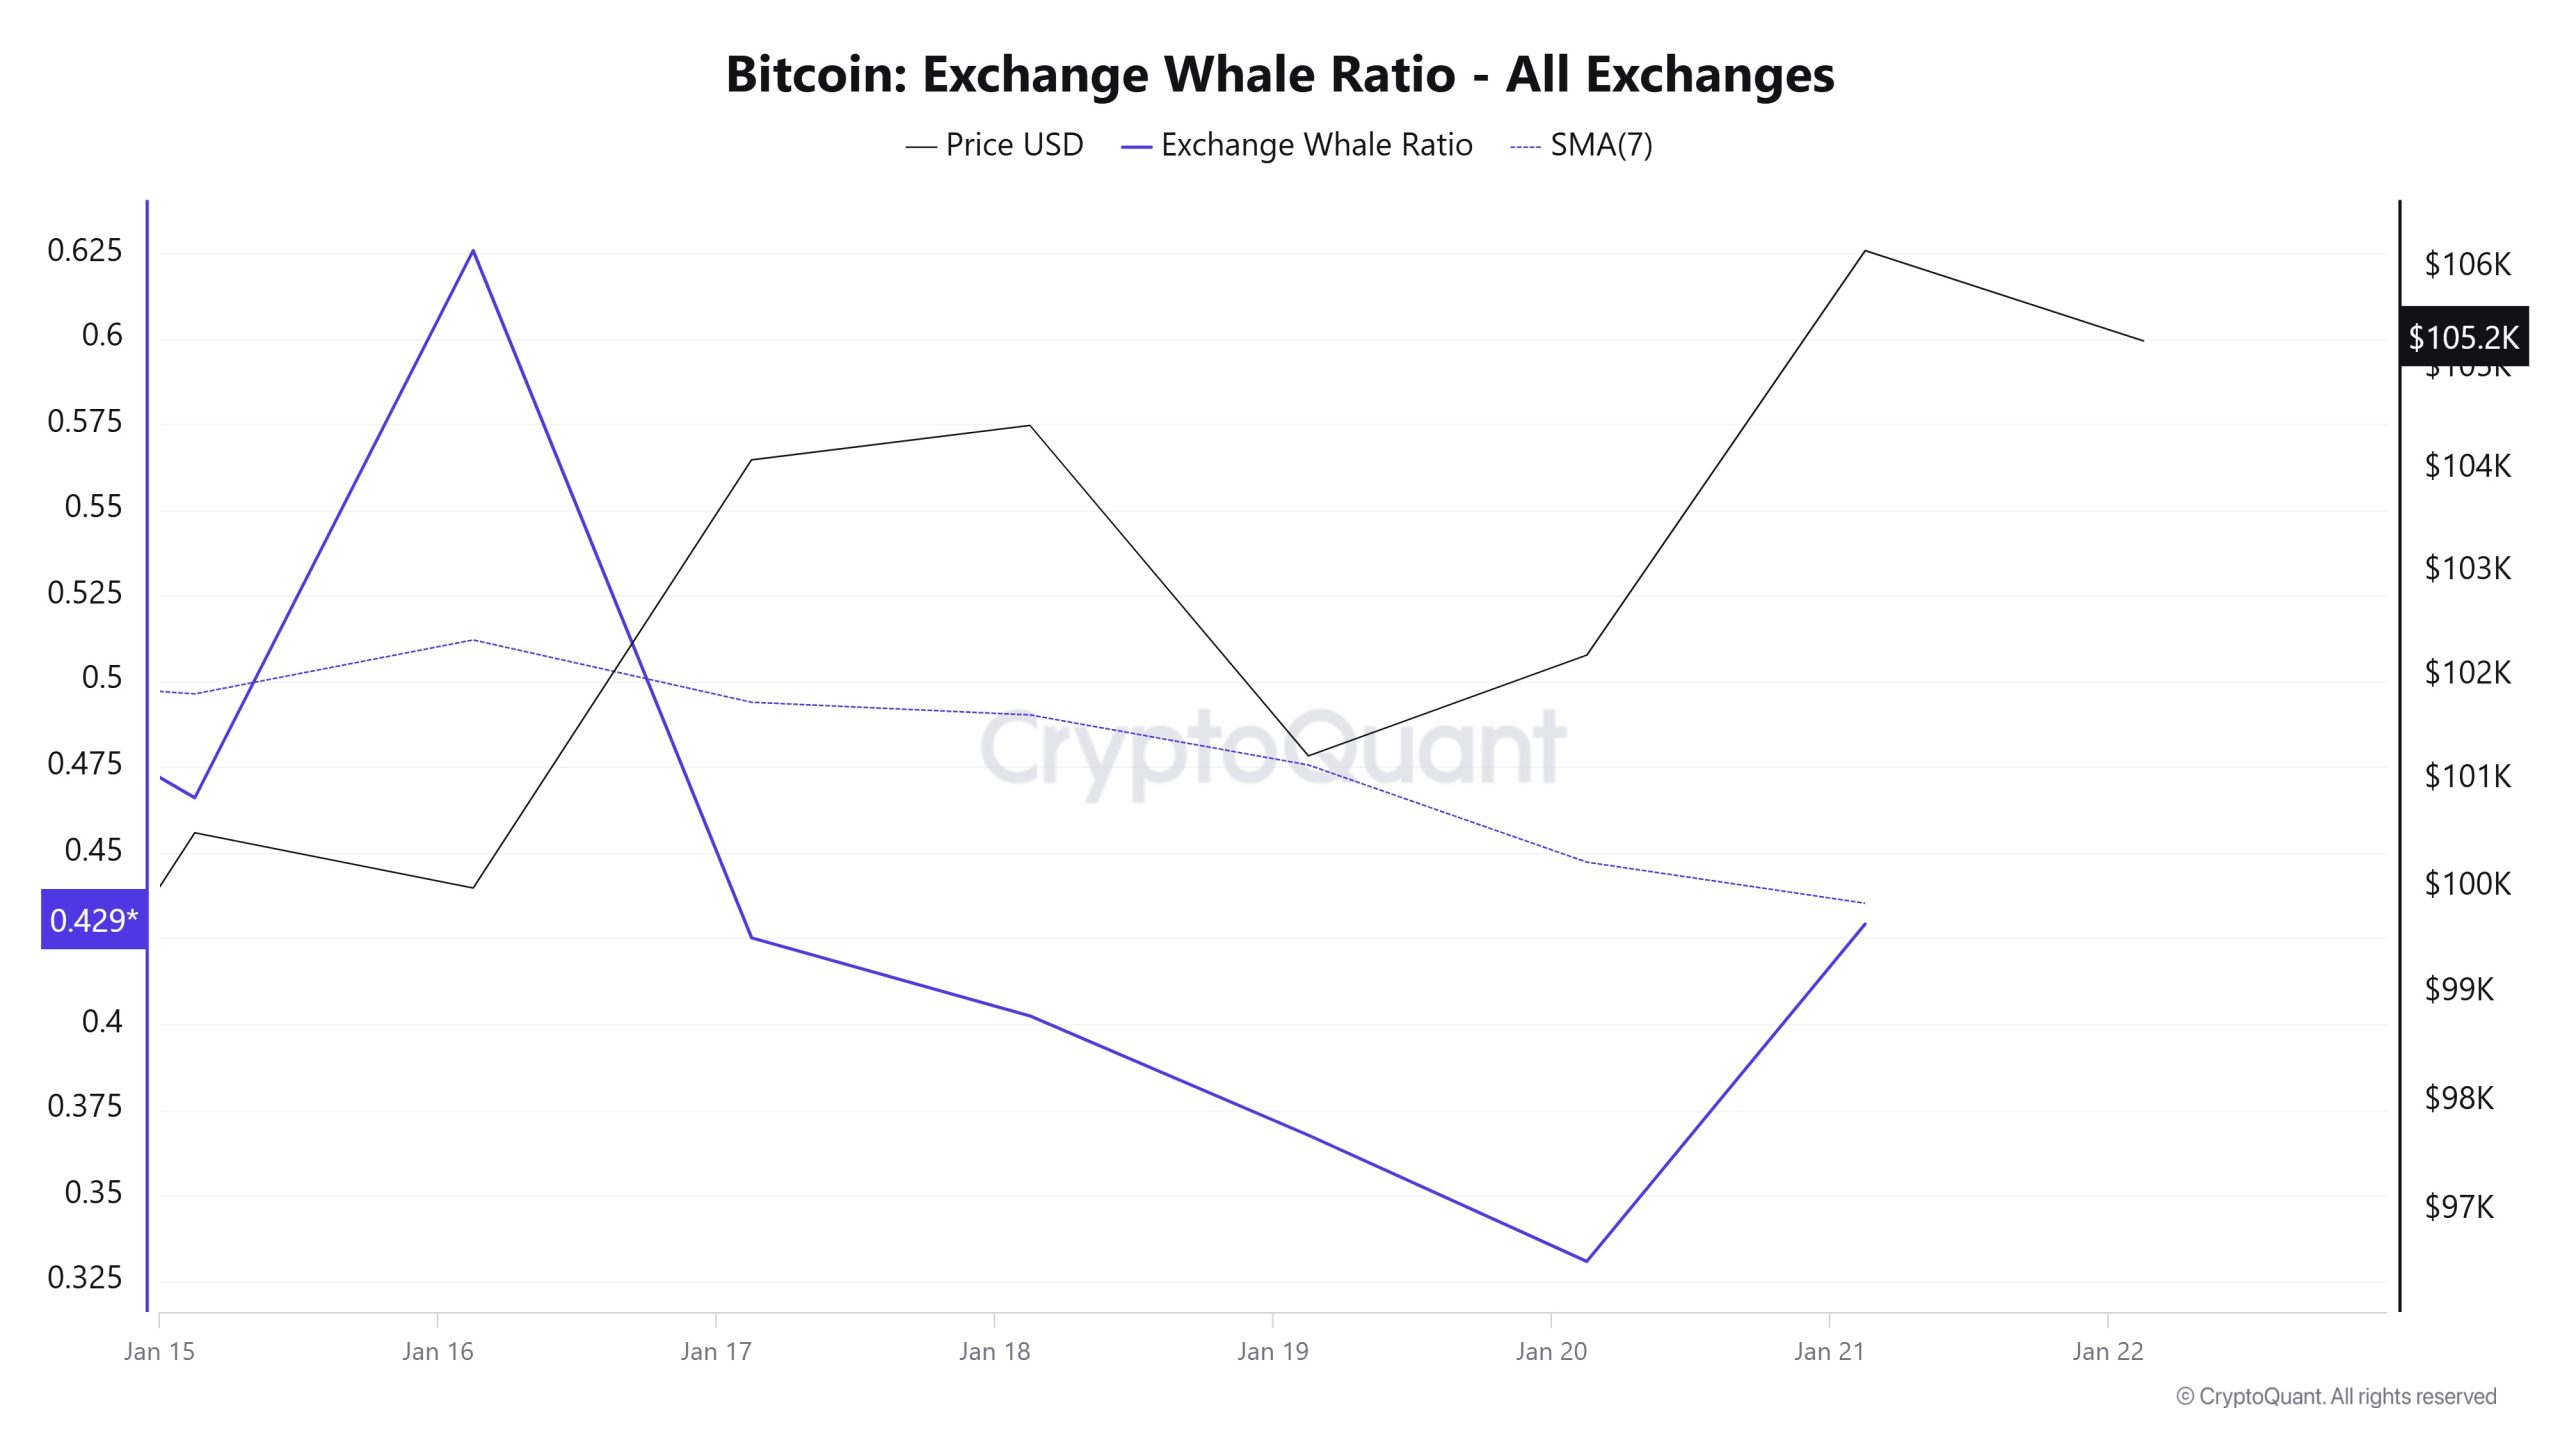
Según los datos que han llamado la atención en el mercado de criptodivisas en los últimos 7 días, la actividad de las ballenas en el intercambio centralizado ha alcanzado niveles más altos que nunca. Cuando observamos los últimos 7 días de actividad de ballenas, se muestra que las bolsas centralizadas están siendo utilizadas por las ballenas de forma excesiva. Cuando observamos la métrica Exchange Whale Ratio, esta métrica, que era de 0,62 el 16 de enero, alcanzó máximos históricos, y ahora las ballenas han comenzado a retirar Bitcoin de los intercambios. Este ratio se sitúa actualmente en 0,42. Cuando este ratio está por encima de 0,350, suele significar que las ballenas utilizan con frecuencia los intercambios centralizados. En la primera mitad de este periodo de 7 días, se vio que la mayoría de los vendedores de BTC utilizaban intercambios centralizados. Sin embargo, con la toma de posesión de Trump en los últimos días del proceso, se ha producido una fuerte acumulación de Bitcoin en las carteras de los balleneros. Al mismo tiempo, si nos fijamos en el total de transferencias de BTC, vemos que se movieron 6.005.751 BTC, un aumento de alrededor del 26% en comparación con la semana pasada.
AVISO LEGAL
La información sobre inversiones, los comentarios y las recomendaciones contenidas en este documento no constituyen servicios de asesoramiento en materia de inversiones. Los servicios de asesoramiento en materia de inversión son prestados por instituciones autorizadas a título personal, teniendo en cuenta las preferencias de riesgo y rentabilidad de los particulares. Los comentarios y recomendaciones contenidos en este documento son de tipo general. Estas recomendaciones pueden no ser adecuadas para su situación financiera y sus preferencias de riesgo y rentabilidad. Por lo tanto, tomar una decisión de inversión basándose únicamente en la información contenida en este documento puede no dar lugar a resultados acordes con sus expectativas.
NOTA: Todos los datos utilizados en el análisis de Bitcoin onchain se basan en Cryptoqaunt.