
Technical Analysis
BTC/USDT
US President Donald Trump announced that the current 25% import tariffs on Indian goods will be significantly increased within the next 24 hours due to India’s continued purchases of Russian oil. Trump also criticized India’s high tariffs on US products. Additionally, he claimed that data from the Bureau of Labor Statistics was manipulated for political purposes. Trump stated that Fed Chairman Jerome Powell was late in cutting interest rates and mentioned that Kevin Warsh and Kevin Hassett were on the shortlist for the presidency. He also indicated that the vacant Fed seats could be used for these appointments.
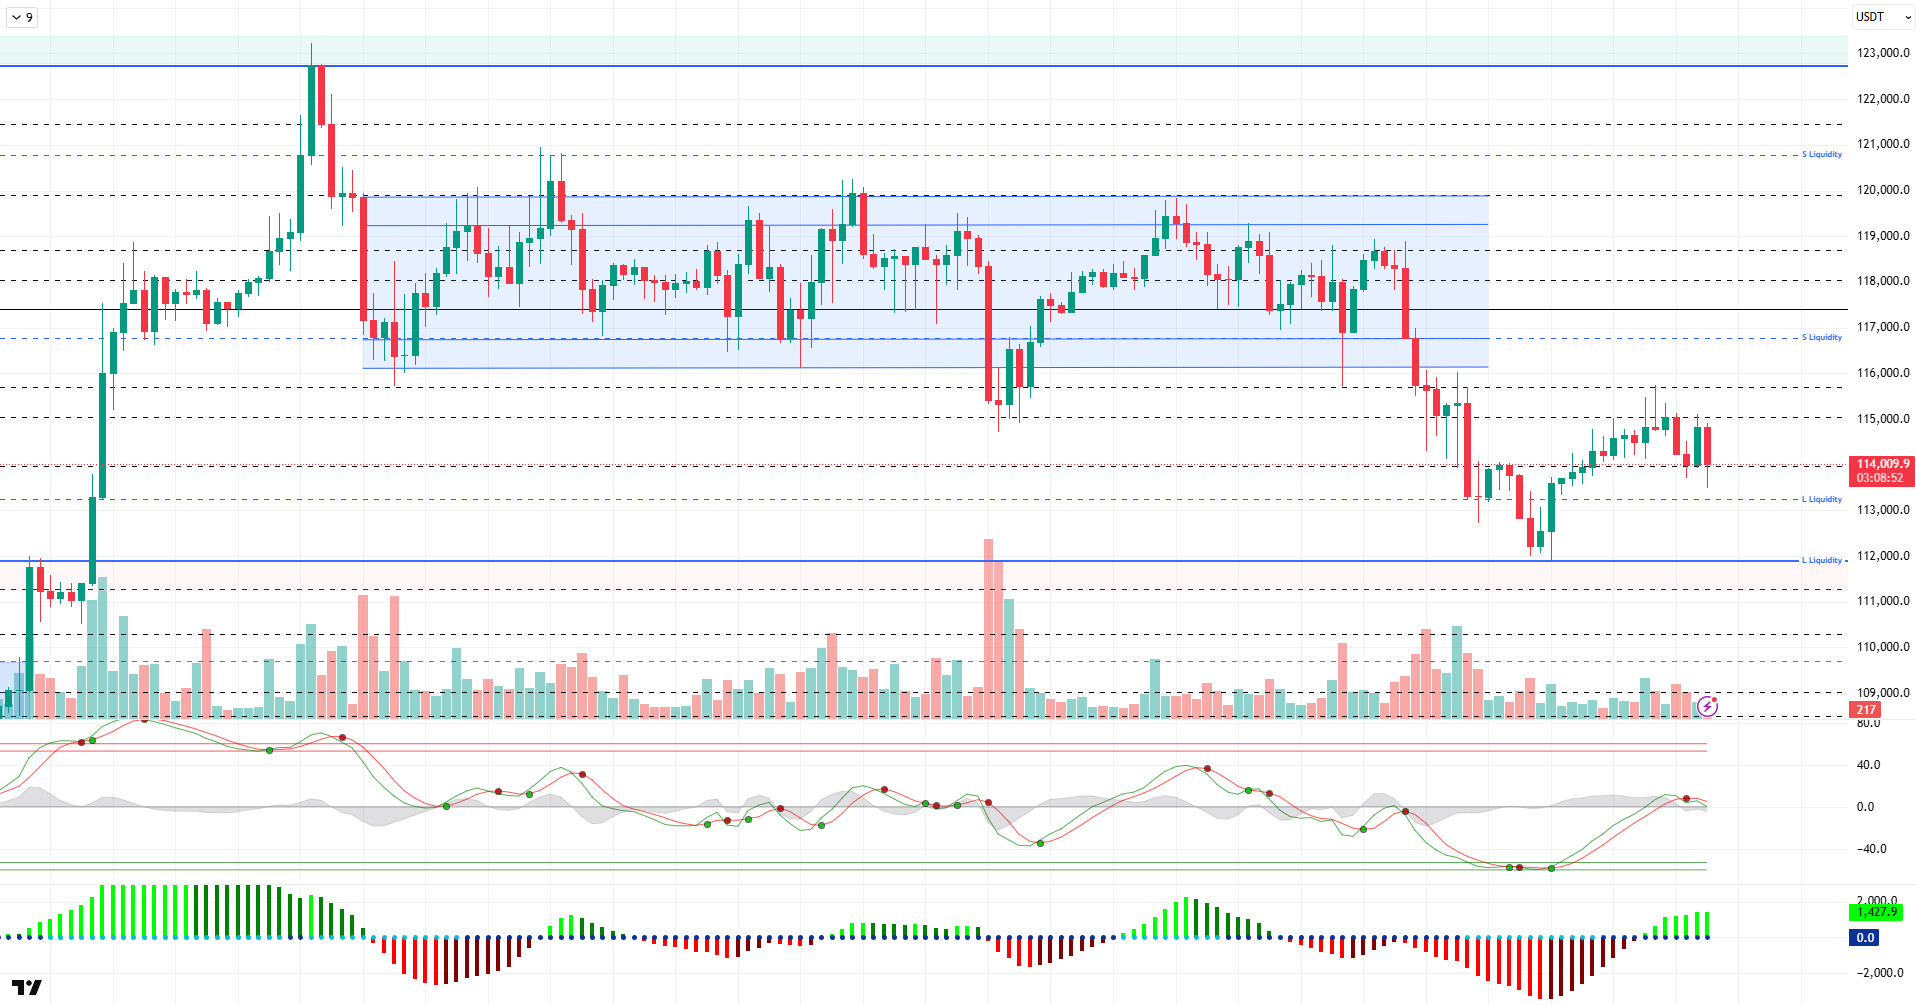
Looking at the technical picture, BTC corrected its decline with support from the 112,000 level and tested the 115,700 level. However, the price failed to maintain this level and fell back to the 114,000 level with selling pressure. At the time of writing, BTC continues to trade at the 114,000 level. From a technical perspective, the possibility of the price forming a double bottom formation at the previous low stands out.
Technical indicators show that the upward attack attempt at the middle band of the Wave Trend oscillator was weak, and the indicator has begun to produce downward reversal signals again. The Squeeze Momentum indicator is attempting to remain in the positive zone but is struggling to gain momentum. The Kaufman moving average is positioned just above the price at the 114,500 level and is acting as short-term resistance.
Looking at liquidity data, we see that short-term sell positions opened at the 115,000 and 115,700 levels have been liquidated. On the other hand, it is noteworthy that sell accumulation above the 120,000 level continues in a broader time frame. Buy positions are beginning to re-emerge in the 111,500–112,000 range, while some long accumulation is also observed at the 113,000–114,000 levels.
In summary, looking at the key developments, while buying continues on the corporate front, macro, customs, and geopolitical steps continue to put pressure on the market. The technical outlook is losing the ground it had built for an uptrend, while liquidity data continues to draw price limits in the gap area. In this context, if selling pressure intensifies, the 114,000 level emerges as a minor support level, while the 113,200 price gap represents the last support point. On the other hand, the 115,000 level will continue to be monitored as a reference point for upward movement.
Support levels: 114,000 – 113,200 – 112,000
Resistance levels: 115,000 – 116,000 – 116,800
ETH/USDT
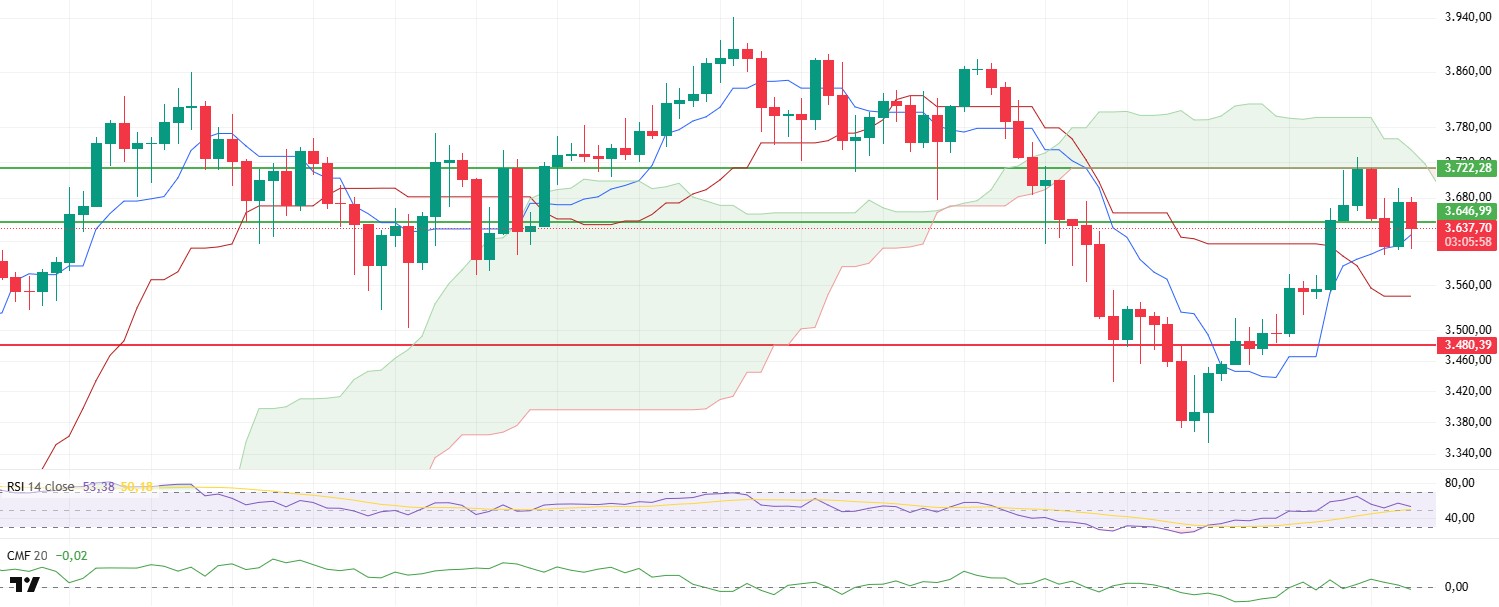
ETH showed a volatile price movement during the day, reaching a level of $3,646. The price, which was seeking equilibrium near this level in the morning hours, tested the $3,700 resistance level later in the day but was rejected from this area and retreated to the $3,620 level. This movement reflects the indecision of market participants, while technical indicators also support the weakening buying appetite.
The Chaikin Money Flow (CMF) indicator has moved into negative territory, signaling a significant outflow of liquidity from the market. This indicates increased selling pressure and a weakening of upward momentum. An increase in liquidity outflows, especially when combined with the price struggling at intermediate resistance levels, could lead to further downward pressure.
When examining the Ichimoku indicator, it can be seen that the price tests the tenkan level, which is critical for determining the short-term direction of the price, multiple times during the day. These repeated tests indicate that buyers are weakening and the risk of a decline in the short term is increasing. Additionally, the fact that the price is still trading below the kumo cloud and that this cloud has not yet broken upward confirms that the market has not yet produced a clear signal of recovery.
In this context, if the ETH price fails to remain above the $3,646 level towards the evening, downward pressure may increase and the price may continue to decline to the kijun support level at $3,545. This level is critical for short-term buyers to re-enter the market. On the other hand, if the price manages to hold above the $3,646 level and break through the kumo cloud resistance at $3,722, it could invalidate the current negative outlook. In such a scenario, the likelihood of sharp upward price movements gaining momentum would become quite strong as buyers regain strength.
Support levels: 3,480 – 3,285 – 3,081
Resistance levels: 3,646 – 3,722 – 4,084
XRP/USDT
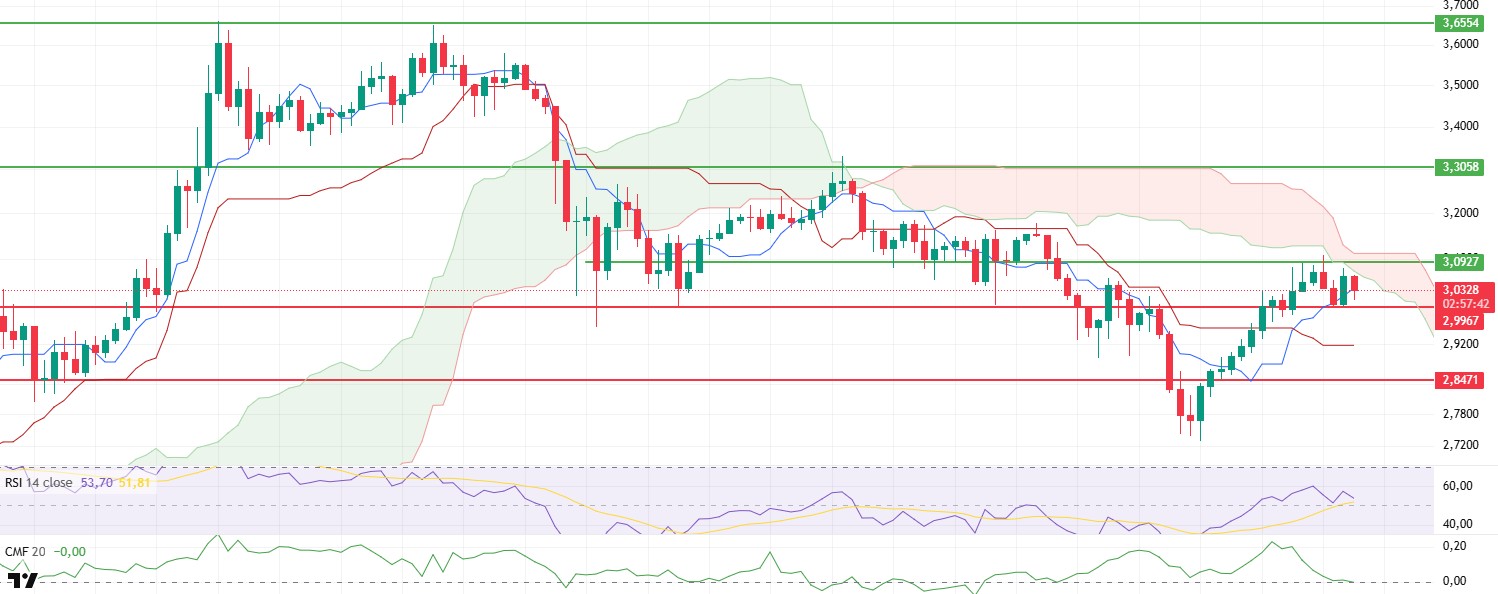
The XRP price fell to $2.99 during the day amid selling pressure. This area stands out as a critical support level that has been tested many times before and where buyers have stepped in. During intraday trading, the price attempted a short-term recovery driven by buying activity from this support level. However, this movement remained limited within the lower band of the cloud and retreated after encountering renewed selling pressure. This indicates that market participants lack the necessary strength to break above this resistance level and that there is indecision among buyers.
Technical indicators point to the continuation of a weak outlook. The Chaikin Money Flow (CMF) indicator has declined into negative territory, revealing a significant outflow of liquidity from the market. This indicates both a weakening of buying interest and a withdrawal of short-term investors from the market. The decline in CMF points to technical weakness that could pave the way for downward price movements.
A similar picture emerges on the Relative Strength Index (RSI). The RSI continues its downward movement throughout the day, forming lower peaks, which clearly indicates a loss of momentum in the market. This trend on the RSI confirms that sellers are in control and that pressure on prices is continuing.
Based on these technical data, if the XRP price breaks below the $2.99 support level in the evening, a pullback to the kijun line at the next strong support level of $2.92 may come into play. Closures below this level could lead to a deeper decline. On the other hand, if the price manages to hold the $2.99 support level and buyer interest increases, a recovery toward the kumo cloud could be seen. In this scenario, especially if the kumo resistance at the $3.11 level is broken, buying momentum could gain speed and sharp upward price movements could occur.
Supports: 2.9967 – 2.8471 – 2.6513
Resistances: 3.0927 – 3.3058 – 3.6554
SOL/USDT
Upexi increased Solana’s SOL holdings by 172% in July, surpassing 2 million SOL.
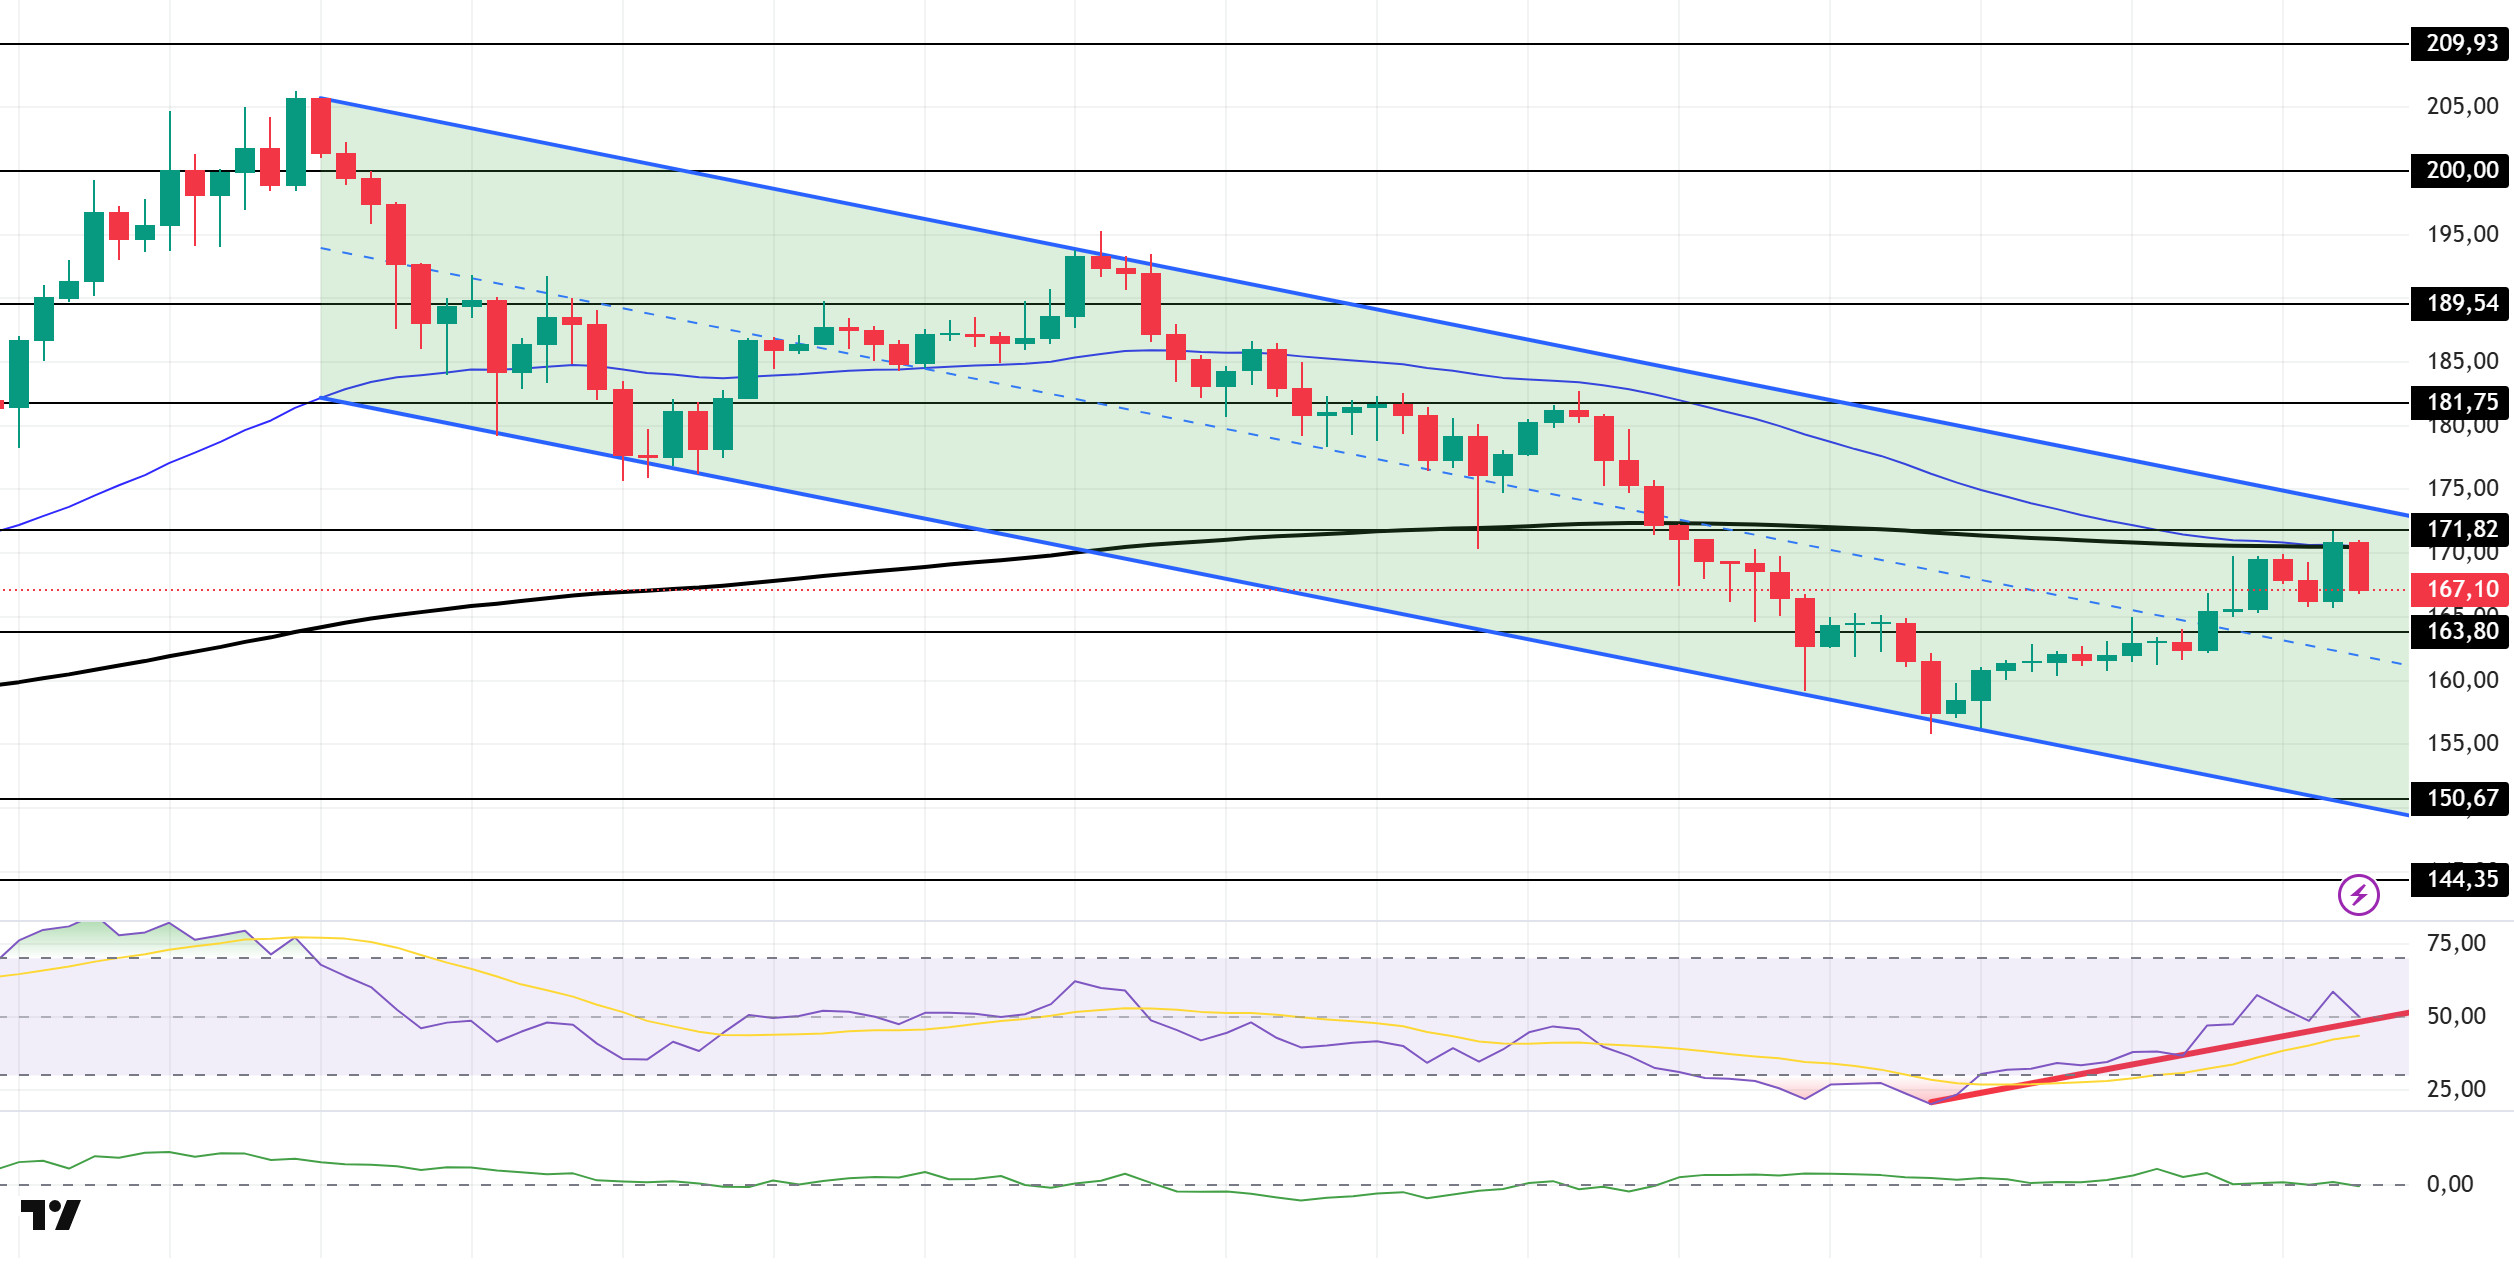
The SOL price continued its horizontal trend throughout the day. The asset remained within the downward trend that began on July 23. At the same time, the price, which continued to remain below the 200 EMA (Black Line) and 50 EMA (Blue Line) moving averages, showed a decline after encountering resistance from this level. If the declines continue, the 163.80 dollar level should be monitored. In the opposite scenario, the 181.75 dollar level should be monitored as a resistance point.
On the 4-hour chart, the 50 EMA (Blue Line) remains above the 200 EMA (Black Line). This indicates that the upward trend may continue in the medium term. At the same time, the price being below both moving averages shows that the market is currently in a downward trend. The Chaikin Money Flow (CMF-20) remains at a neutral level. However, an increase in money inflows could push the CMF into positive territory. The Relative Strength Index (RSI-14) is above the upward trend that began on August 2. This indicates that buying pressure is continuing. However, it is currently testing this upward trend. If there is an upward movement due to macroeconomic data or positive news related to the Solana ecosystem, the $181.75 level emerges as a strong resistance point. If this level is broken upward, the upward trend is expected to continue. In case of pullbacks due to developments in the opposite direction or profit-taking, the $163.80 level may be tested. A decline to these support levels could increase buying momentum, presenting a potential opportunity for an upward move.
Support levels: 163.80 – 150.67 – 144.35
Resistance levels: 171.82 – 181.75 – 189.54
DOGE/USDT
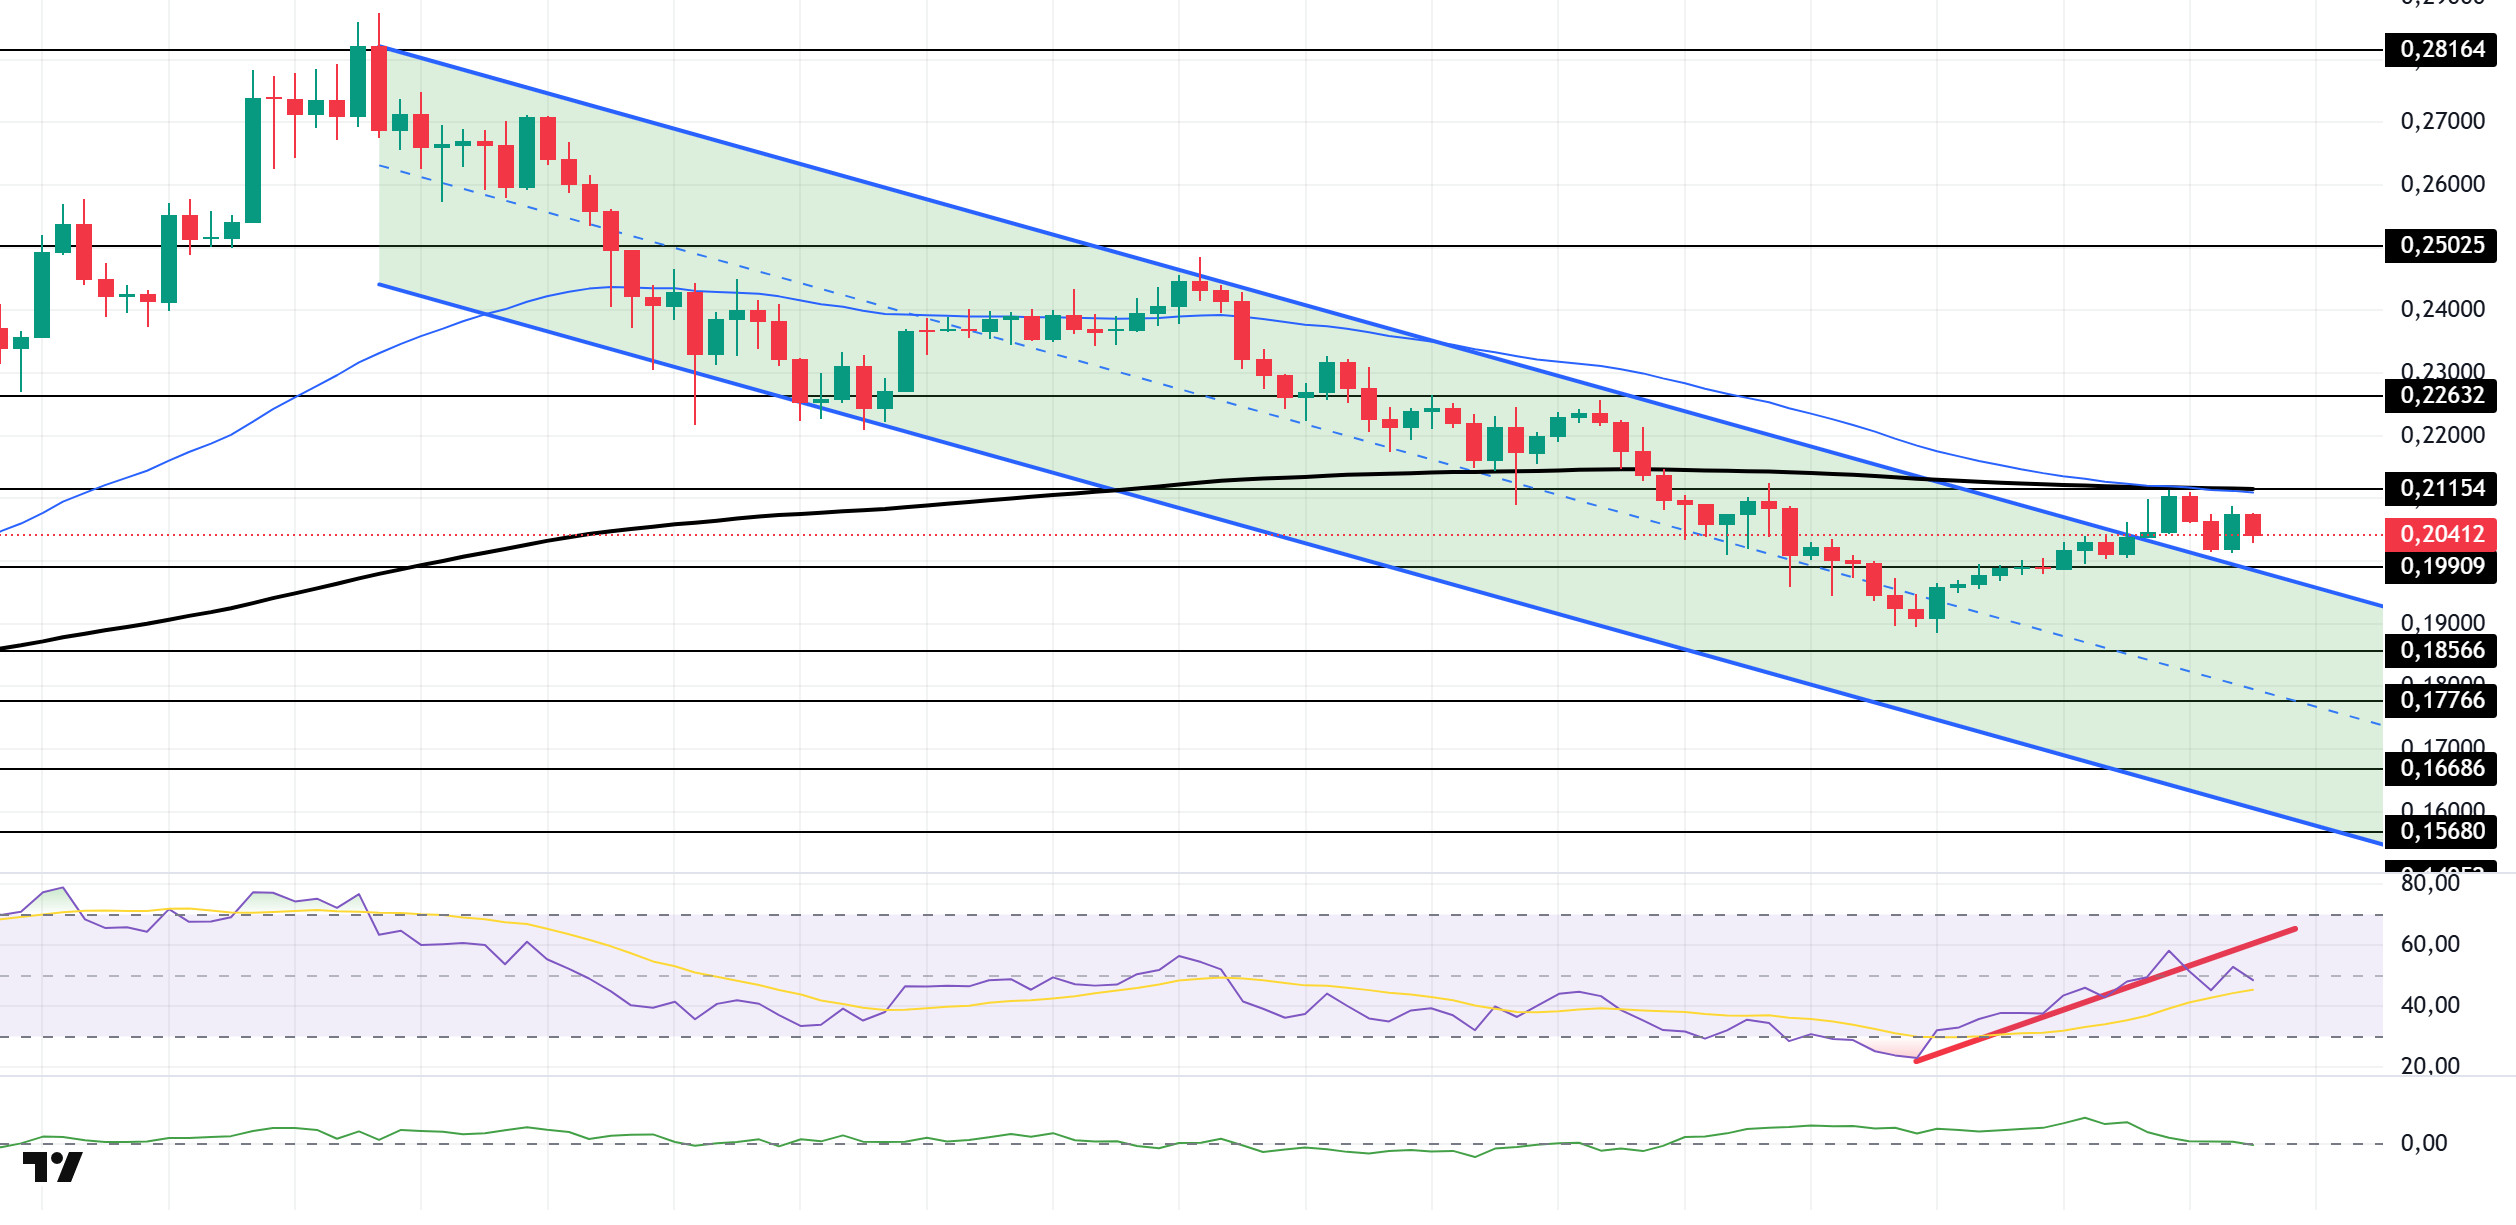
The DOGE price remained flat during the day. The asset broke above the downward trend that began on July 21 and has continued to hold above it. As of now, the price, which is below the 50 EMA (Blue Line) and 200 EMA (Black Line) moving averages, may test the ceiling of the upward trend. In the event of an upward movement, the 0.22632 dollar level can be monitored as resistance.
On the 4-hour chart, the 50 EMA (blue line) has started to fall below the 200 EMA (black line). This indicates that the asset is in a downward trend in the medium term. The fact that the price is below both moving averages also indicates that the asset is in a downward trend in the short term. The Chaikin Money Flow (CMF-20) remained at a neutral level. Additionally, positive cash inflows could push the CMF into the positive zone. The Relative Strength Index (RSI-14) has once again moved into the negative zone. Additionally, the indicator breaking below the upward trend that began on August 2 signals the formation of selling pressure. In the event of potential increases driven by political developments, macroeconomic data, or positive news flow within the DOGE ecosystem, the $0.22632 level emerges as a strong resistance zone. In the opposite scenario or in the event of negative news flow, the 0.19909 dollar level could be triggered. A decline to these levels could lead to increased momentum, potentially initiating a new upward wave.
Support levels: 0.19909 – 0.18566 – 0.17766
Resistance levels: 0.21154 – 0.22632 – 0.25025
Legal Notice
The investment information, comments, and recommendations contained herein do not constitute investment advice. Investment advisory services are provided individually by authorized institutions taking into account the risk and return preferences of individuals. The comments and recommendations contained herein are of a general nature. These recommendations may not be suitable for your financial situation and risk and return preferences. Therefore, making an investment decision based solely on the information contained herein may not produce results in line with your expectations.

