
Active Addresses
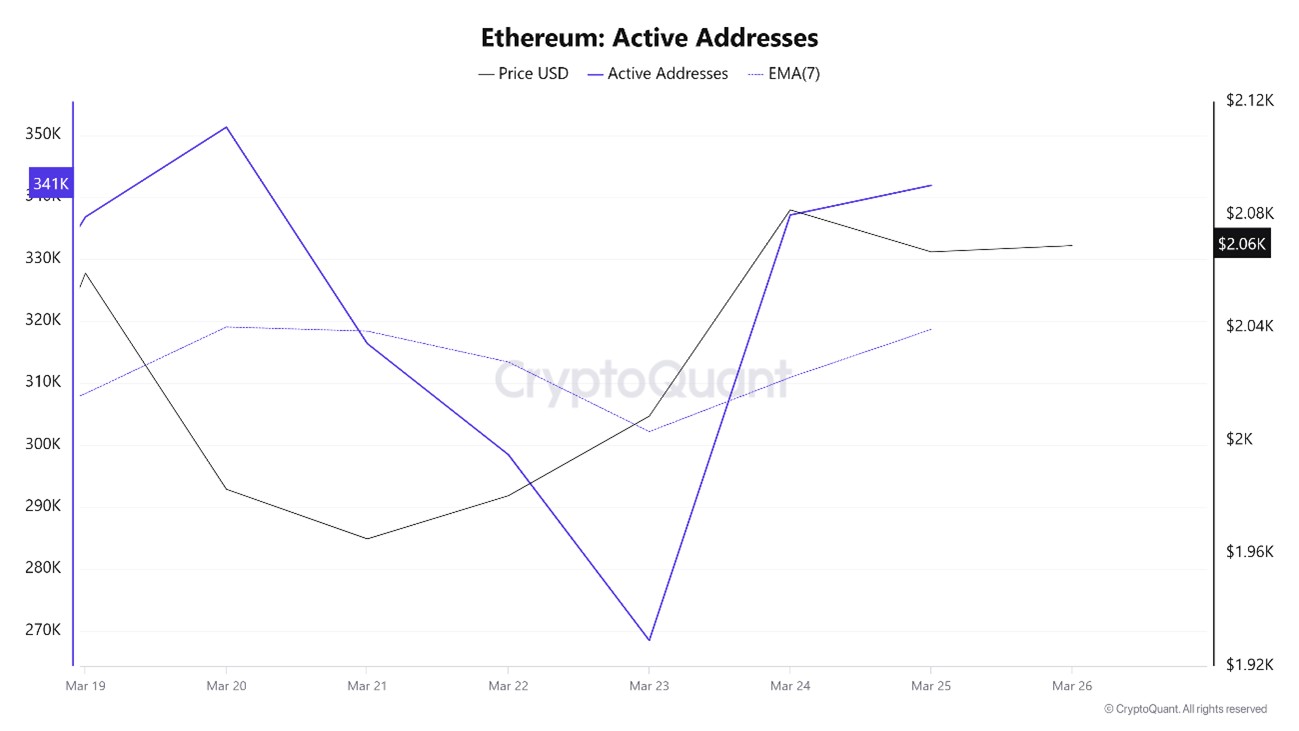
In terms of the number of active addresses, there were 337,136 active entries to the ETH network between Marzo 19 and Marzo 26, 2025 this week. During this period, Ethereum fell to $2.008. The chart shows that Ethereum purchases are gradually decreasing in the area where the price and the number of active addresses intersect. When we follow the 7-day simple moving average, it is observed that the price follows a downward trend on the dates when this average cuts the price. This situation indicates that the Ethereum price is experiencing inflows at $ 2,081 levels.
Active Sending Addresses
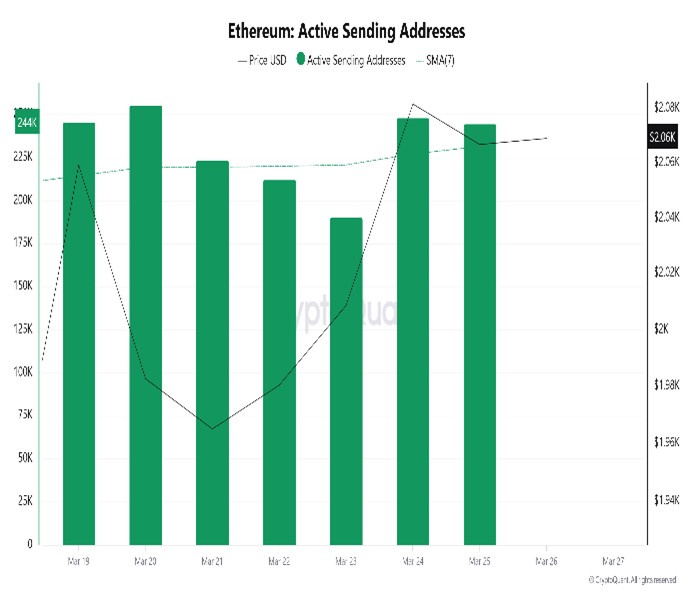
With the Black Line (price line) in active shipping addresses, there was a significant drop in active shipping addresses on Marzo 21. On the day when the price hit its lowest point, active shipping addresses fell as low as 223,420, indicating that buyers sold their positions as Ethereum remained at 1,965 for a while. As a result, it is seen that price drops cause an acceleration in sending addresses.
Active Receiving Addresses
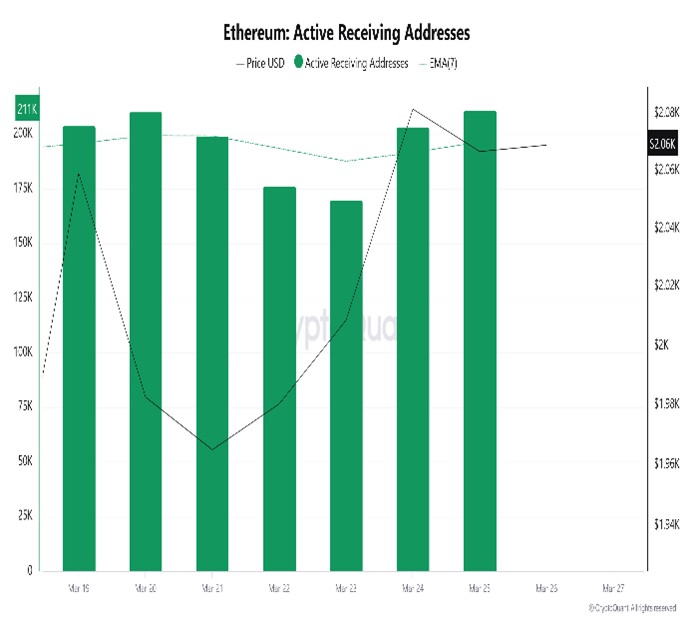
With the Black Line (price line) in active shipping addresses, there has been a significant drop in active shipping addresses after Marzo 23. On the day when the price hit its lowest point, active sending addresses rose as high as 170,096 , indicating that buyers sold their positions as Bitcoin stayed around the $2,008 level for a while. As a result, price drops seem to cause an acceleration in sending addresses.
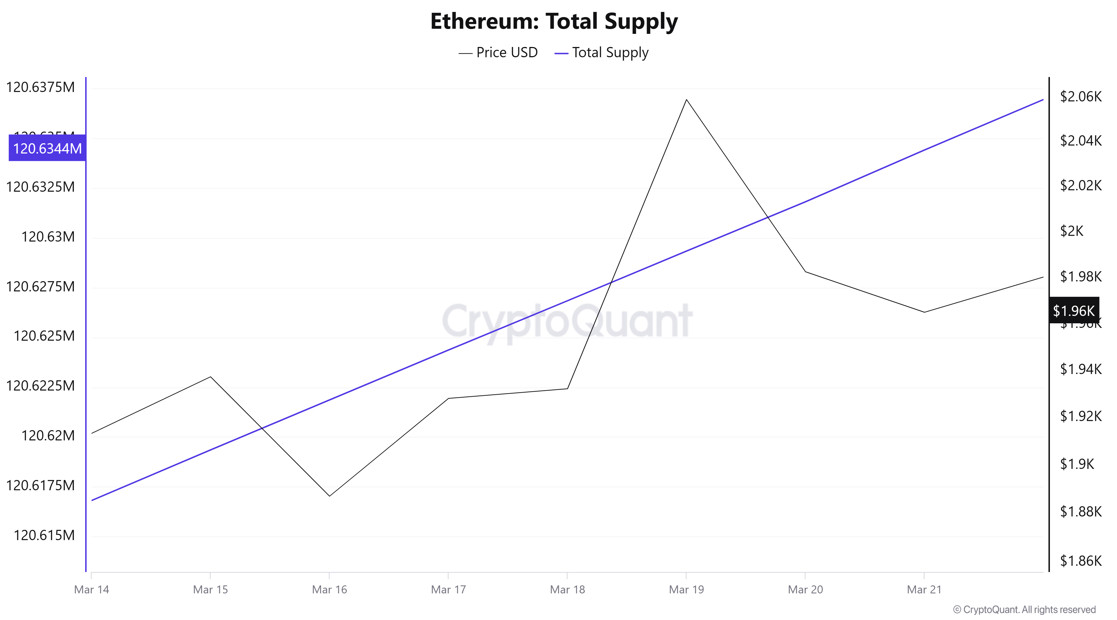
Total Value Staked
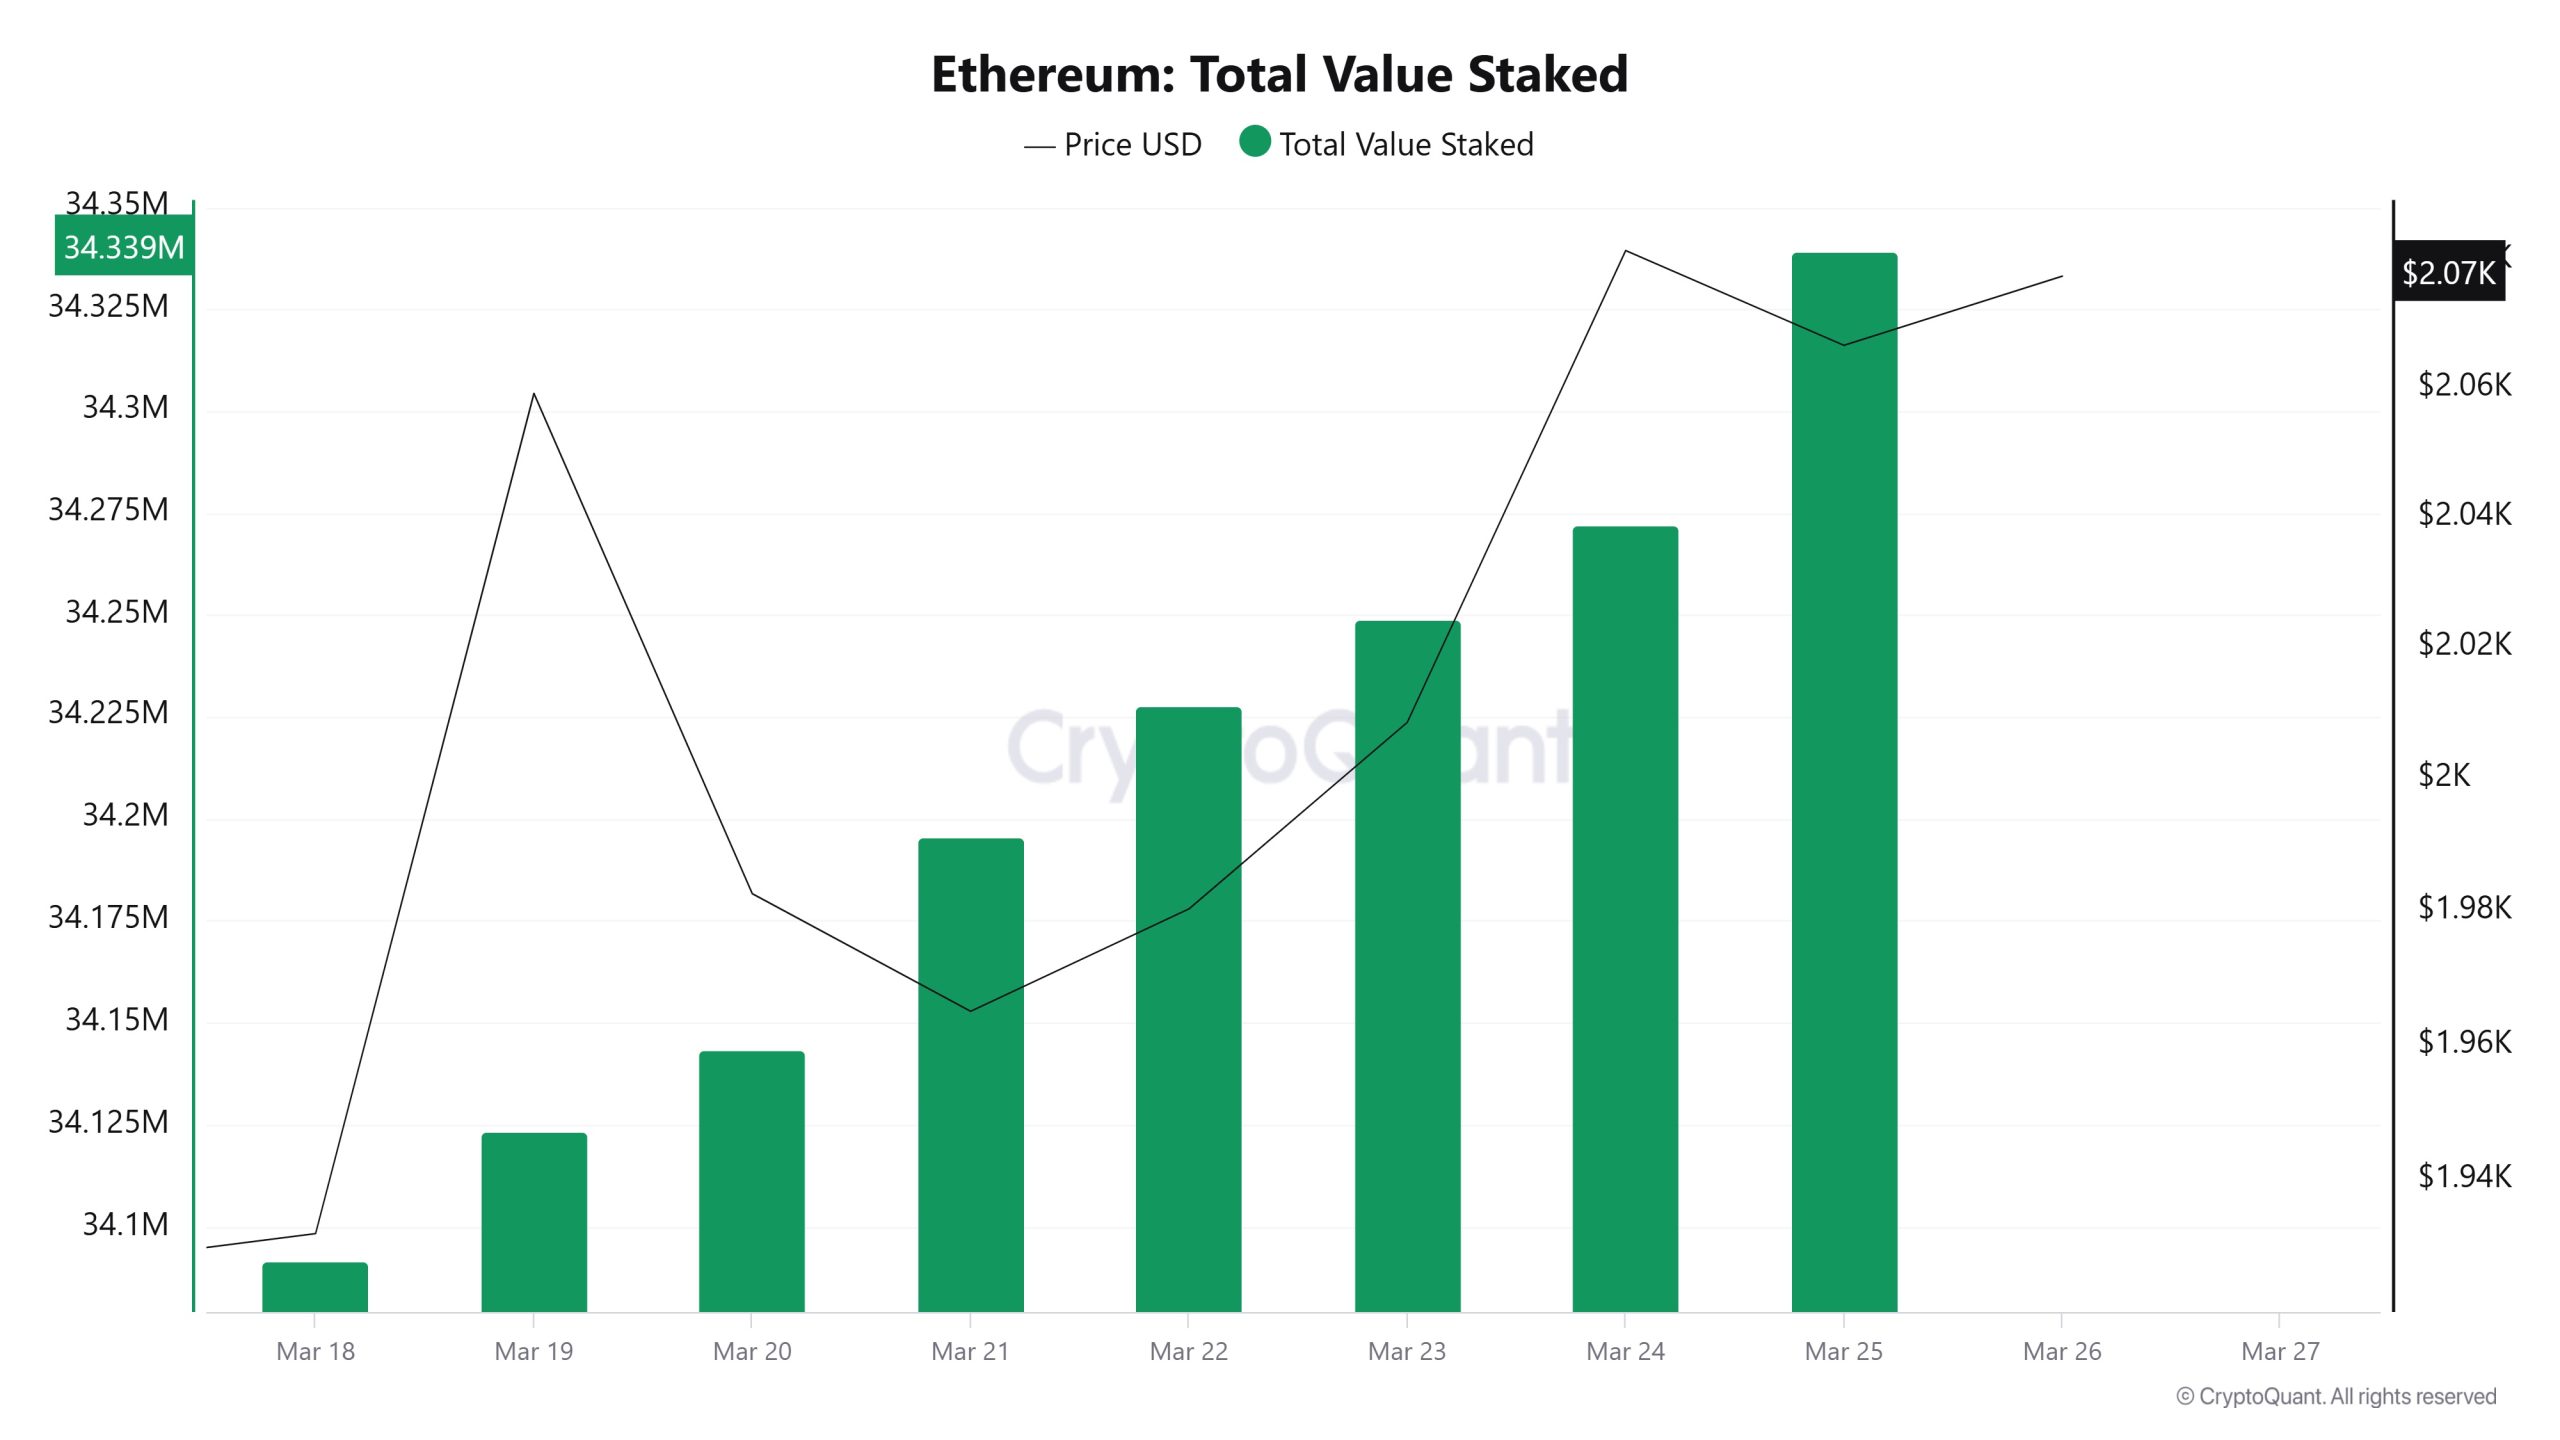
On Marzo 19, ETH price was 2,059 while Total Value Staked was 34,091,651. As of Marzo 25, ETH price was at 2,066 while Total Value Staked Ratio was 34,339,495. Compared to last week, ETH price increased by 0.34% and Total Value Staked Ratio increased by 0.73%.
Staking Inflows
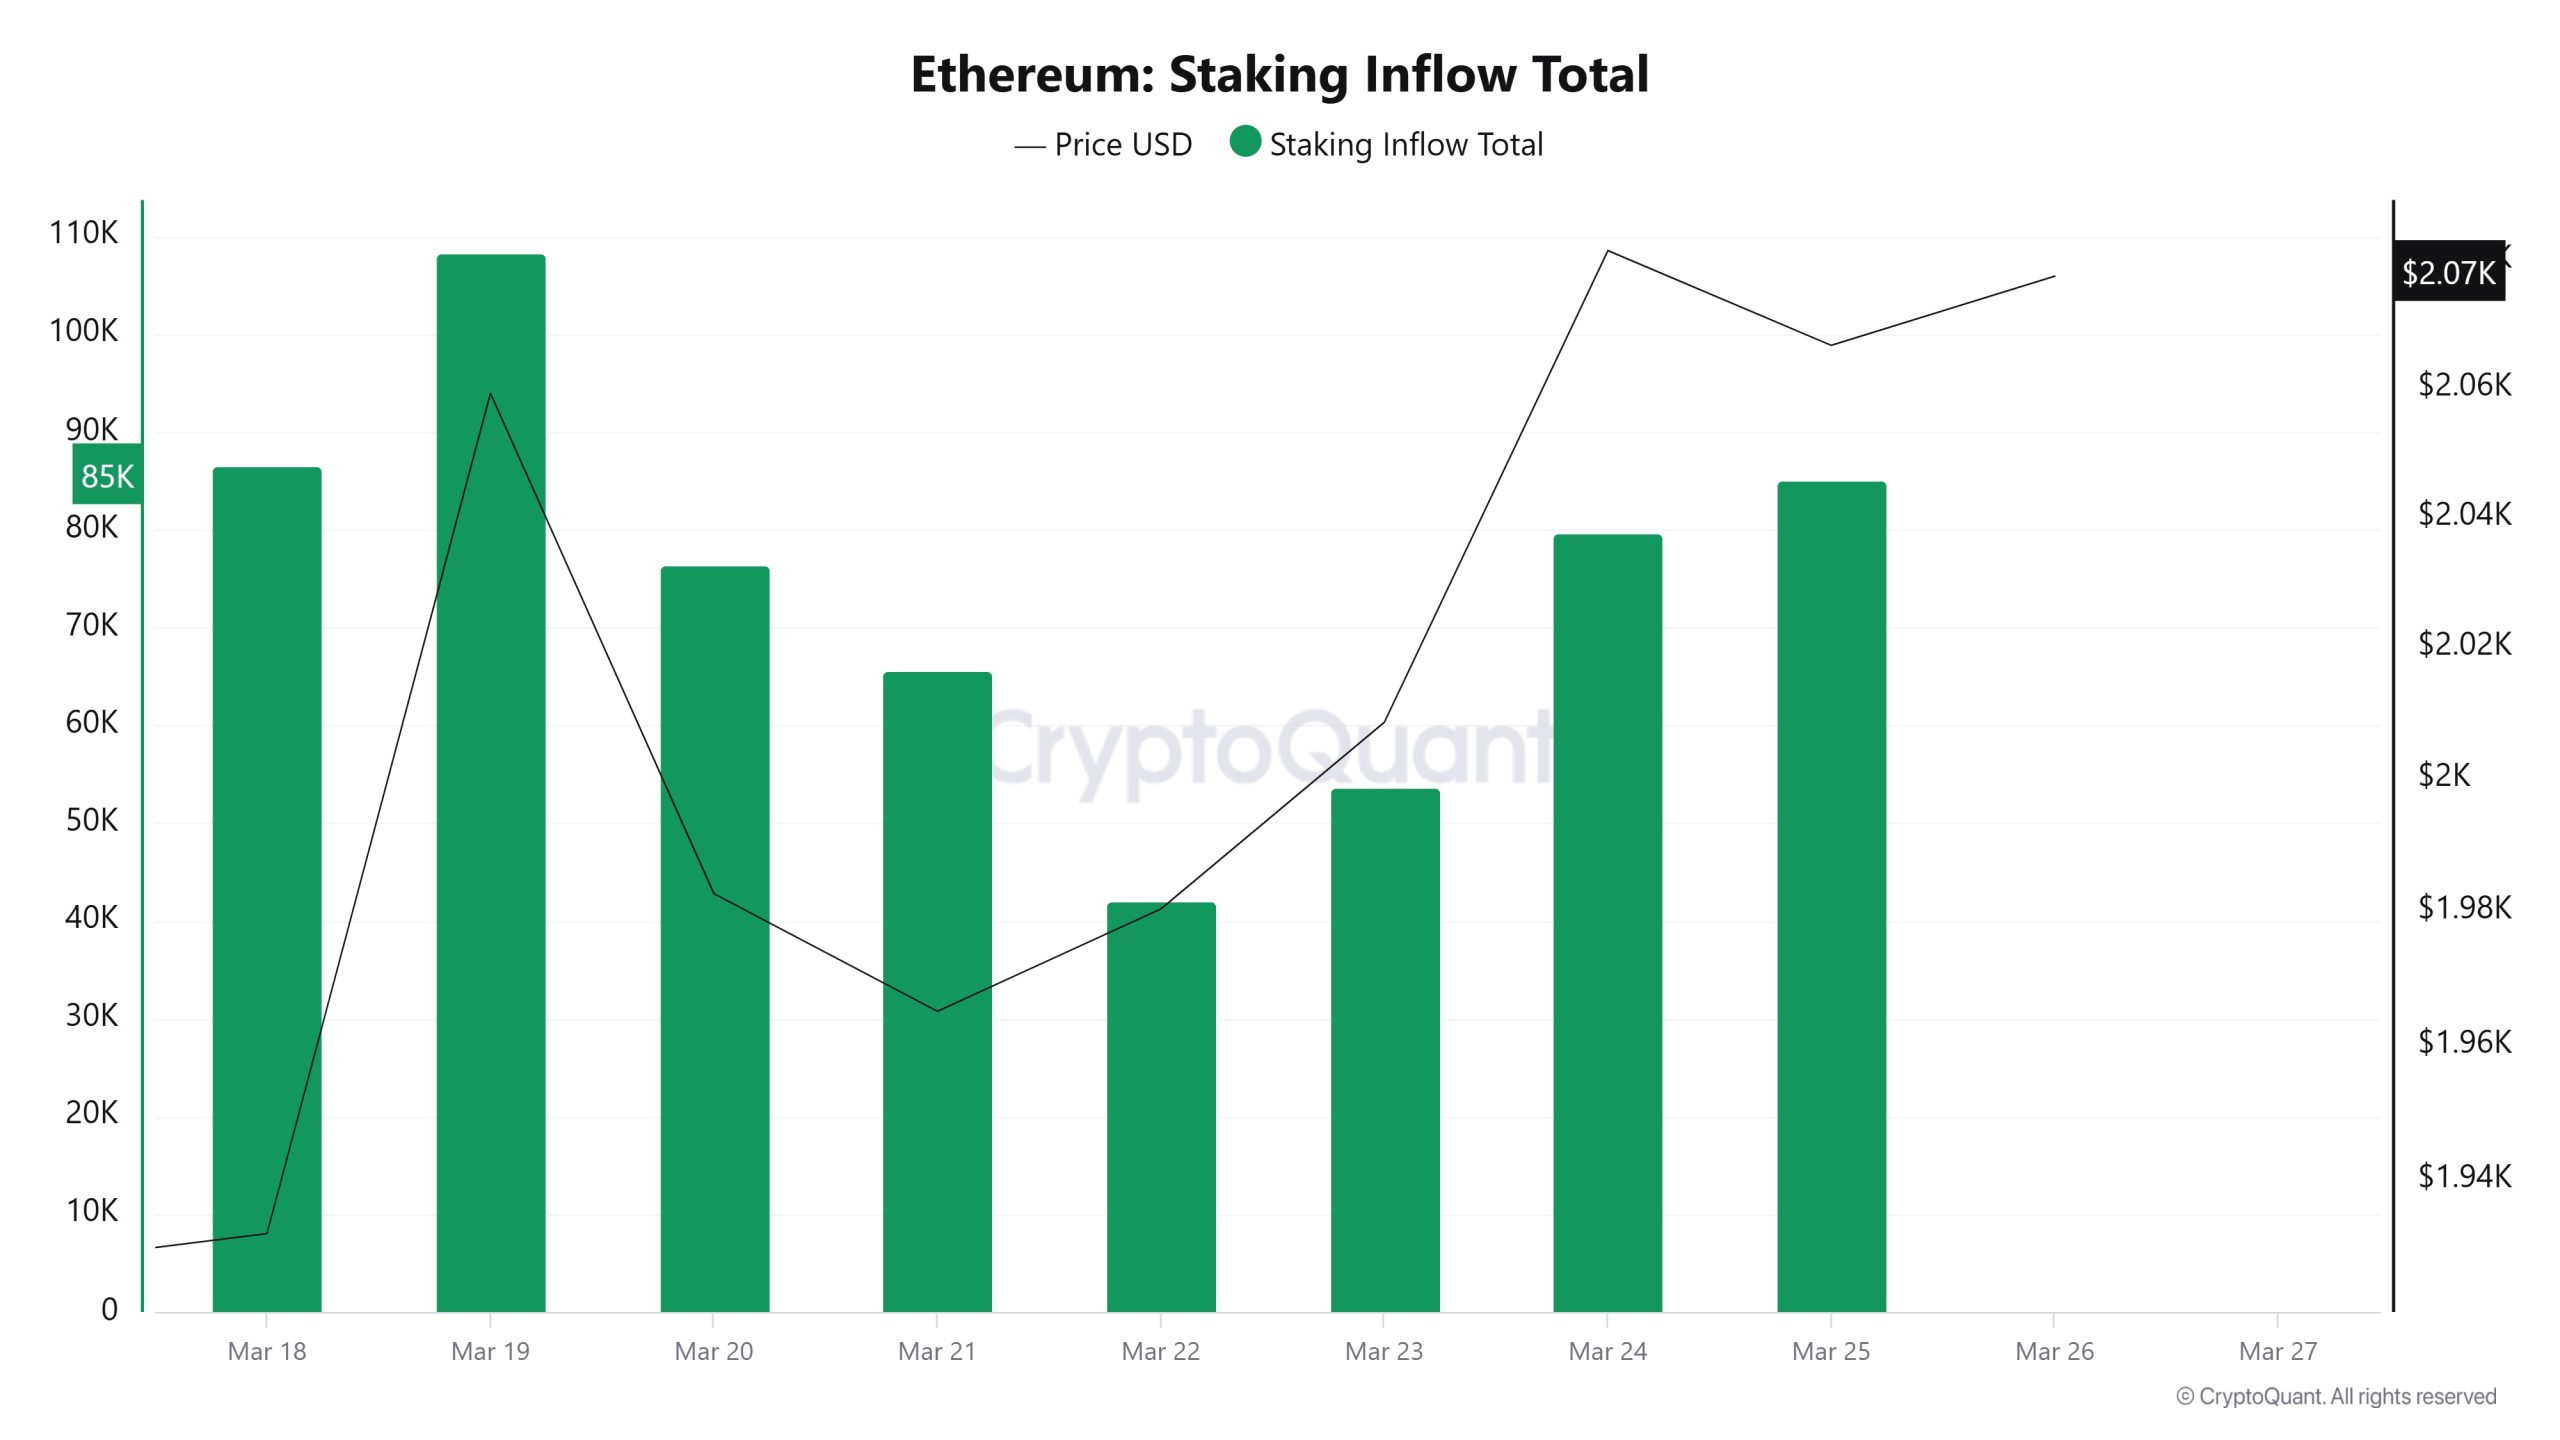
On Marzo 19, ETH price was 2,059 while Staking Inflow Ratio was 108,322. As of Marzo 25, the ETH price was at 2,066, while the Staking Inflow Ratio was at 85,162. Compared to last week, ETH price increased by 34% while Staking Inflow Ratio decreased by 21.38%.
Derivatives
Open Interest
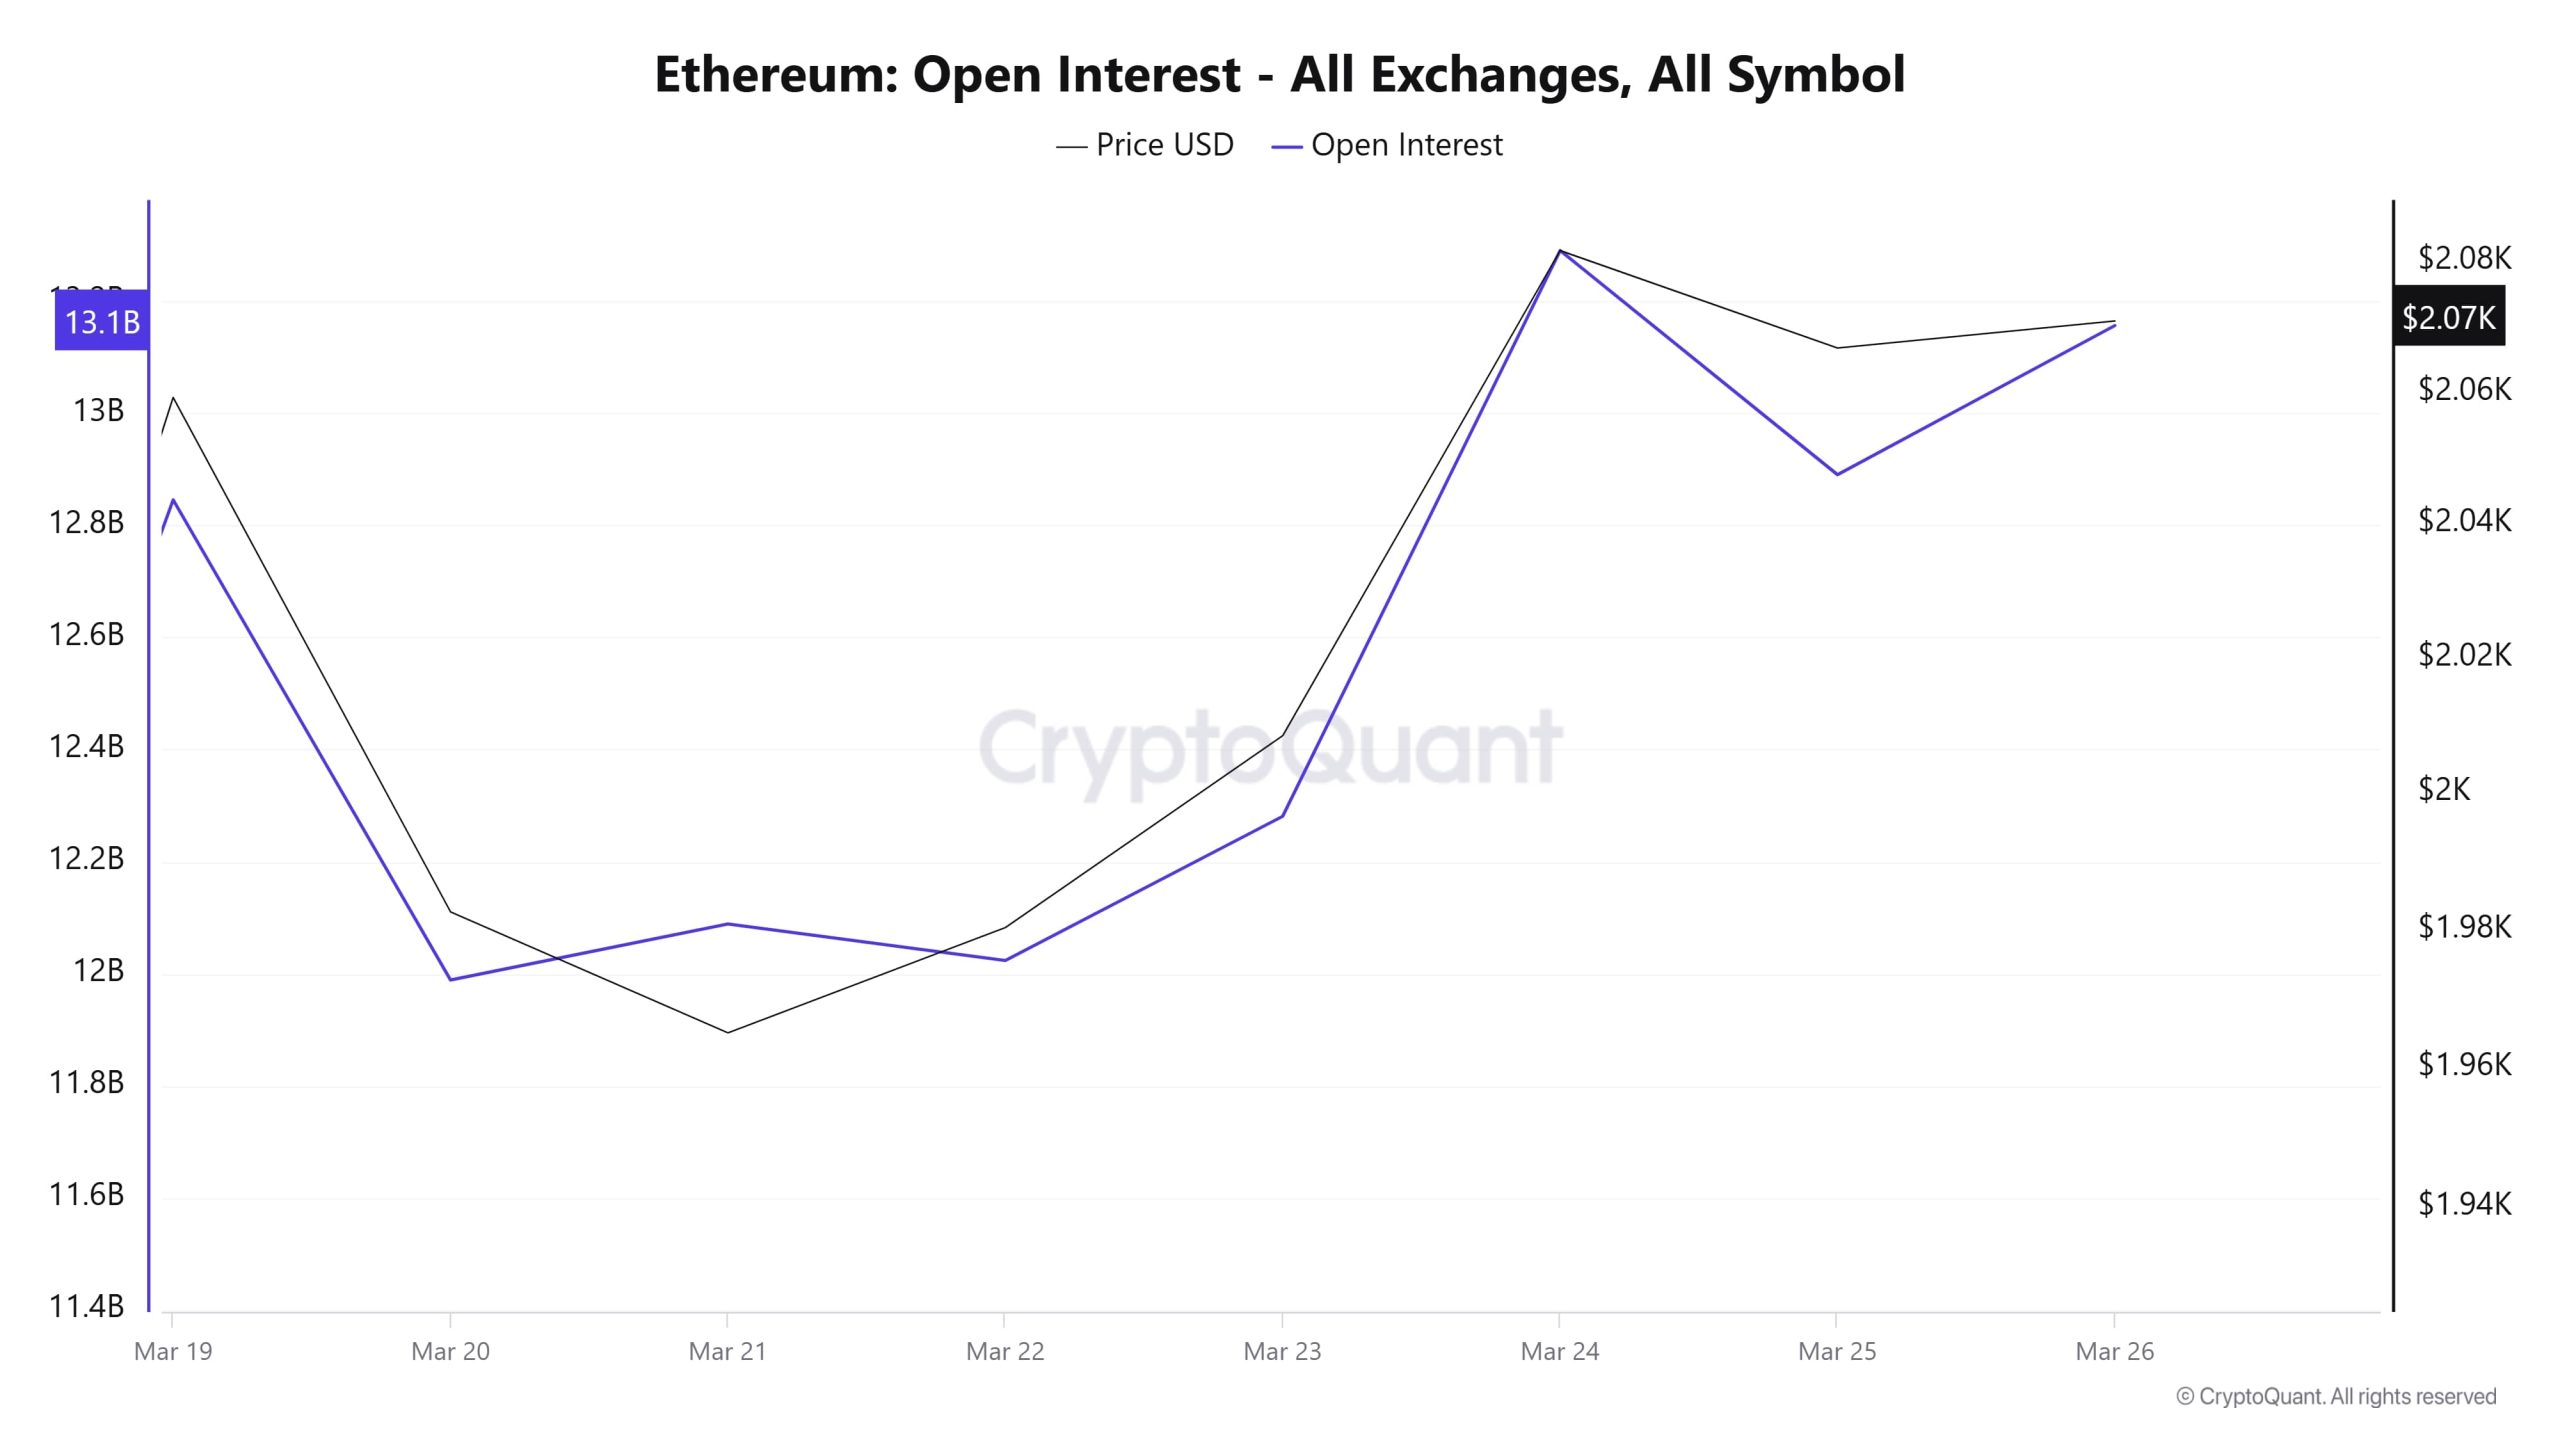
When we look at the ETH open interest chart, we see that the open interest, which started at a high level on Marzo 19, fell, then remained flat for a while and started to rise again as of Marzo 22. This movement indicates that the market first experienced a large liquidation or position closures, followed by the opening of new trades. In recent days, both price and open interest have been rising together. This indicates that new long positions have entered the market and the uptrend is leveraged. However, an excessive increase in open interest, if combined with excessive leverage, could bring the risk of a sharp correction . To summarize, the ETH market has seen increased interest and new positions being opened in recent days. Although the rise in OI along with the rise in price supports the momentum, caution should be exercised as excessive leverage could trigger a correction.
Funding Rate
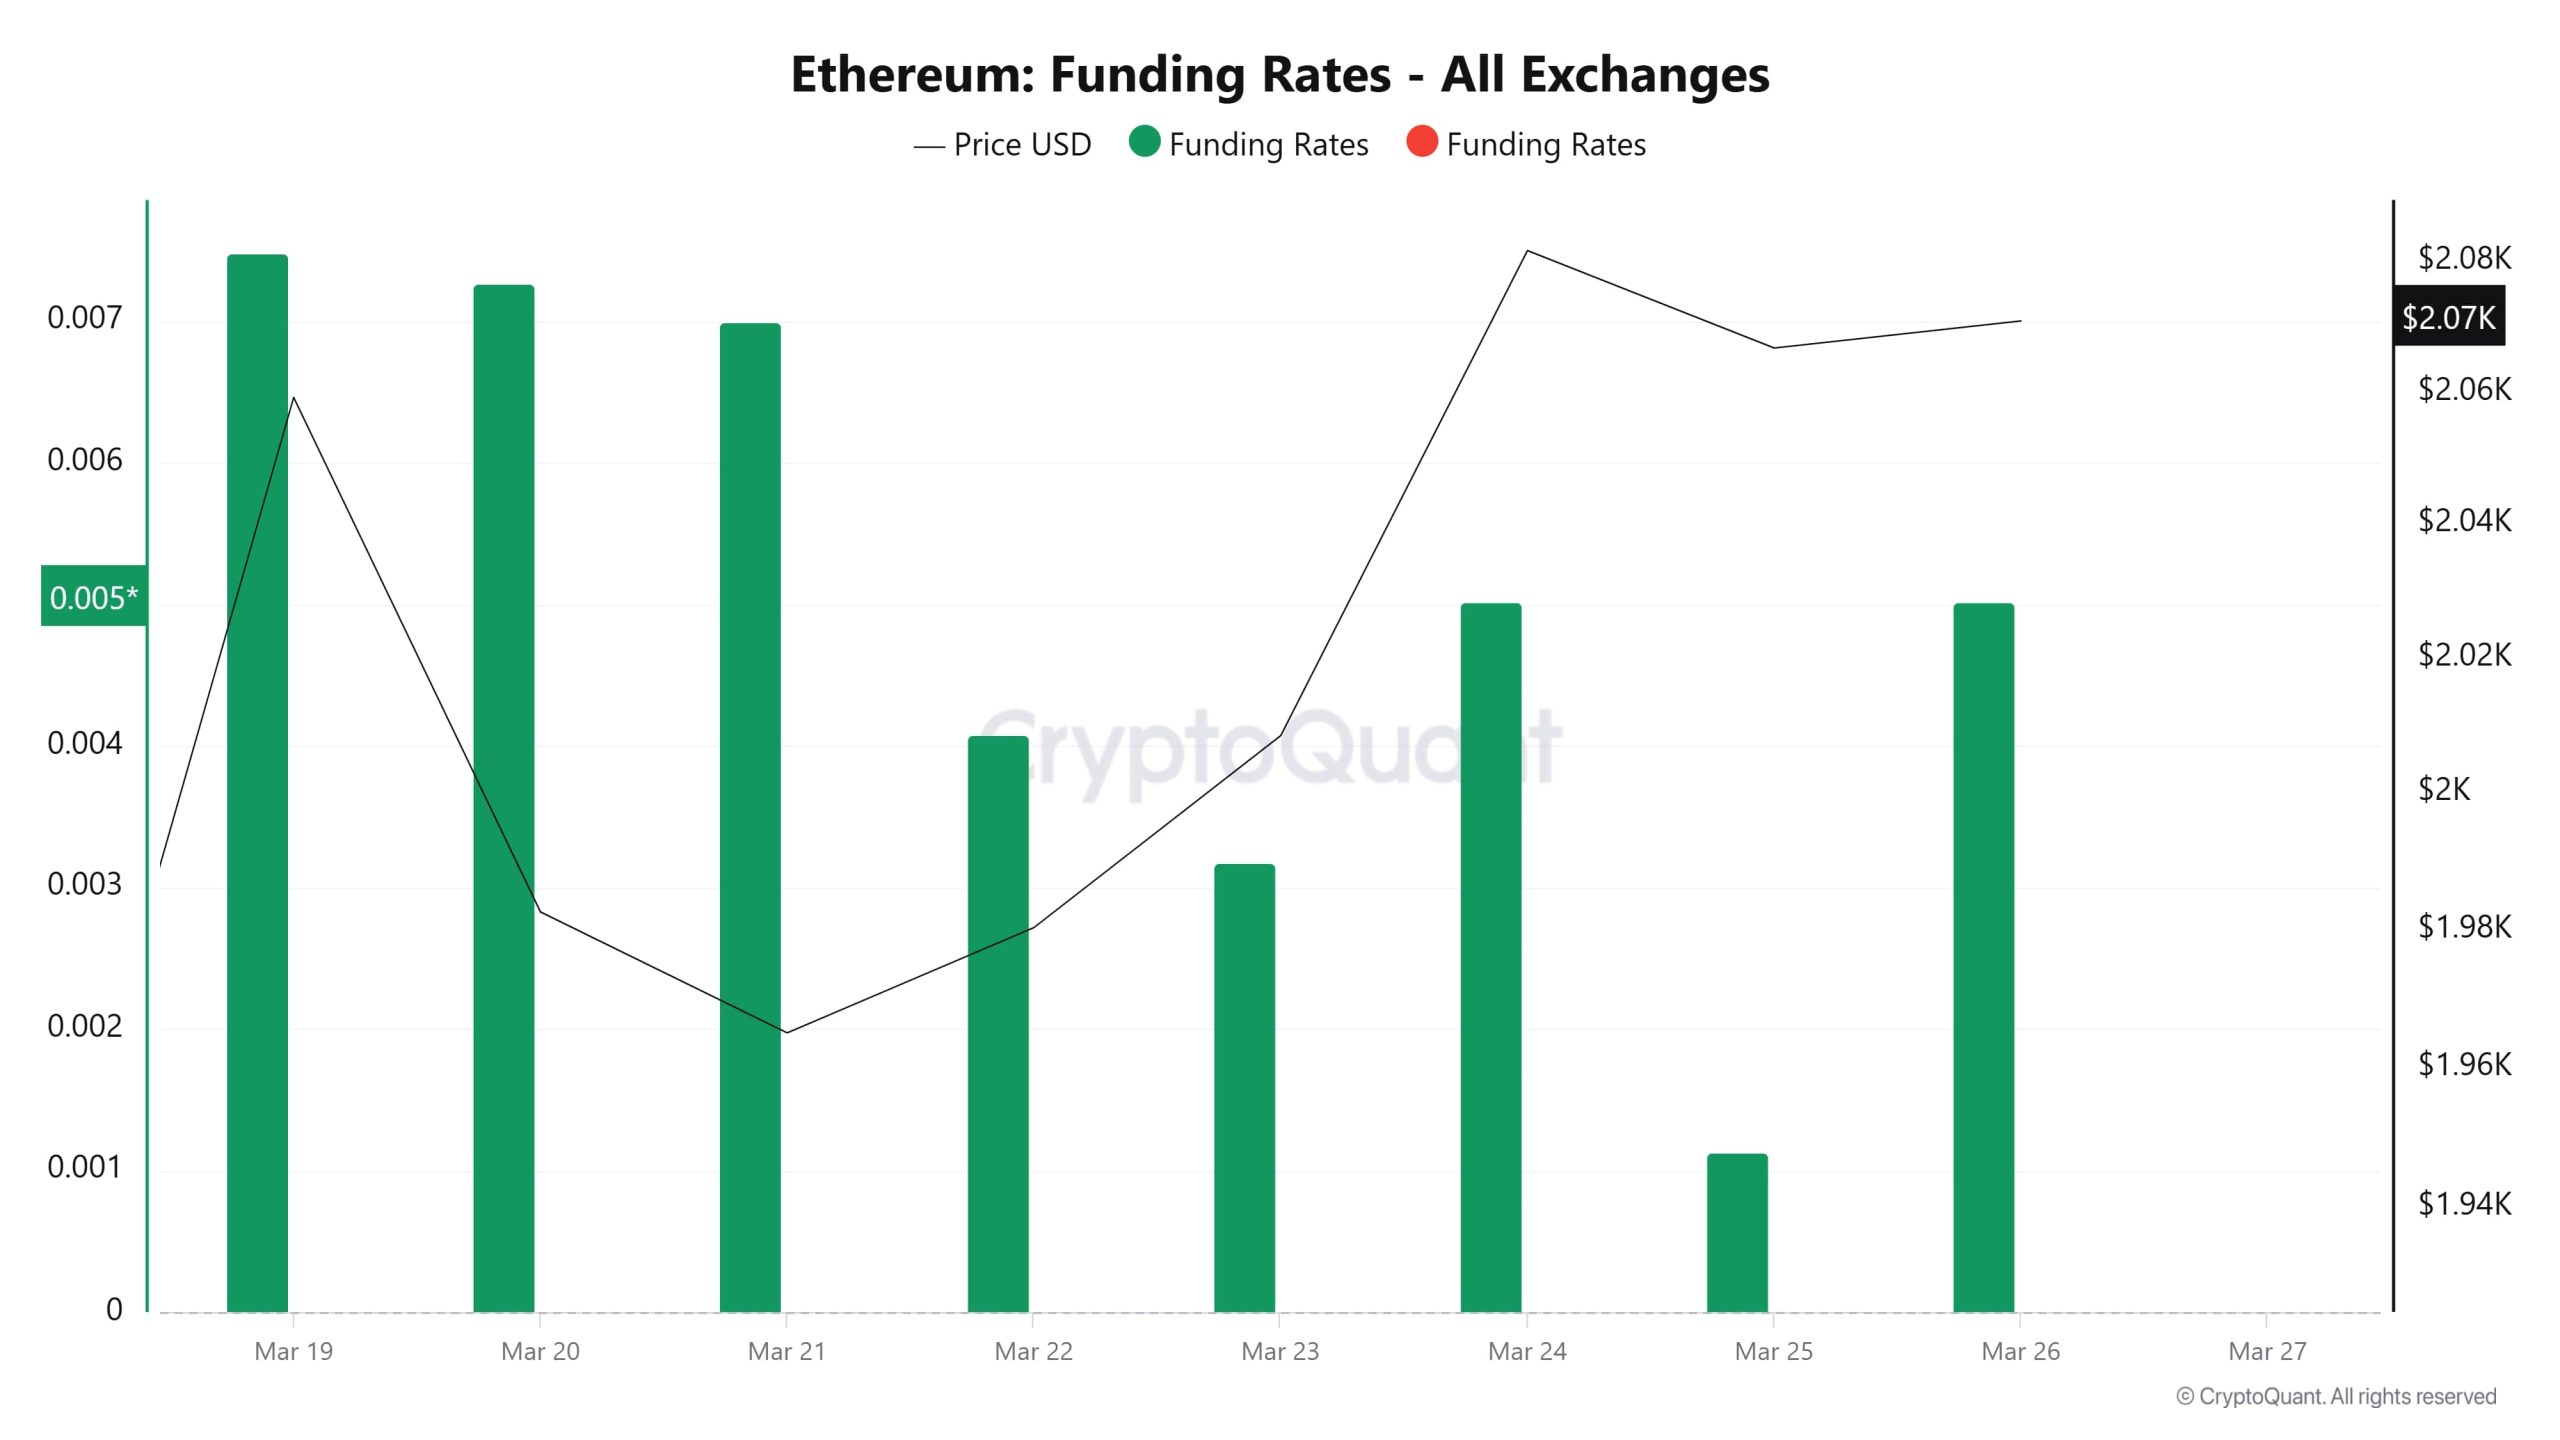
Looking at the relationship between ETH price and funding rate, it can be seen that on Marzo 19-20, when the price was rising, the funding rate was also high, but then the price remained relatively stable despite the funding rate falling. Between Marzo 24-26, the funding rate started to rise again and the price also increased. This suggests that the market opened more long positions and the bullish expectation persists.
The Marzo 26 funding rate hike is remarkable. If there is overheating at this level, liquidating highly leveraged positions could pose risks. A sudden rise in the funding rate could signal excessive long accumulation and a potential correction. For the time being, however, the market is generally supportive of an upside move
Long & Short Liquidations
Last week, as ETH surpassed the $2,000 level, it is seen that short liquidations occurred intensively. 219 million dollars of short positions and 12 million dollars of long positions were liquidated.
| Data | Long Amount (Million $) | Short Amount (Million $) |
|---|---|---|
| Marzo 19 | 19.51 | 118.19 |
| Marzo 20 | 37.07 | 10.88 |
| Marzo 21 | 20.09 | 9.30 |
| Marzo 22 | 7.86 | 10.47 |
| Marzo 23 | 8.01 | 8.96 |
| Marzo 24 | 12.53 | 45.27 |
| Marzo 25 | 22.95 | 15.99 |
| Total | 128.02 | 219.06 |
Supply Distribution
Total Supply: It reached 120,606,993 units, up about 0.0227% from last week.
New Supply: The amount of ETH produced this week was 27,413.
Velocity: Velocity, which was 7.71 last week, was 7.70 as of Marzo 3.
| Wallet Category | 14.03.2025 | 21.03.2025 | Variazione (%) |
|---|---|---|---|
| 100 – 1k ETH | 9.3929M | 9.4371M | 0.47% |
| 1k – 10k ETH | 12.7607M | 12.6219M | -1.09% |
| 10k – 100k ETH | 16.3194M | 16.5674M | 0.52% |
| 100k+ ETH | 5.1194M | 5.2205M | 1.97% |
According to the latest data, 100 – 1k ETH wallets increased by 0.47%, while 1k – 10k ETH holders experienced a 1.09% decrease. The 10k – 100k ETH category saw a remarkable 1.52% increase, while 100k+ ETH holders grew by 1.97%.
Exchange Reserve
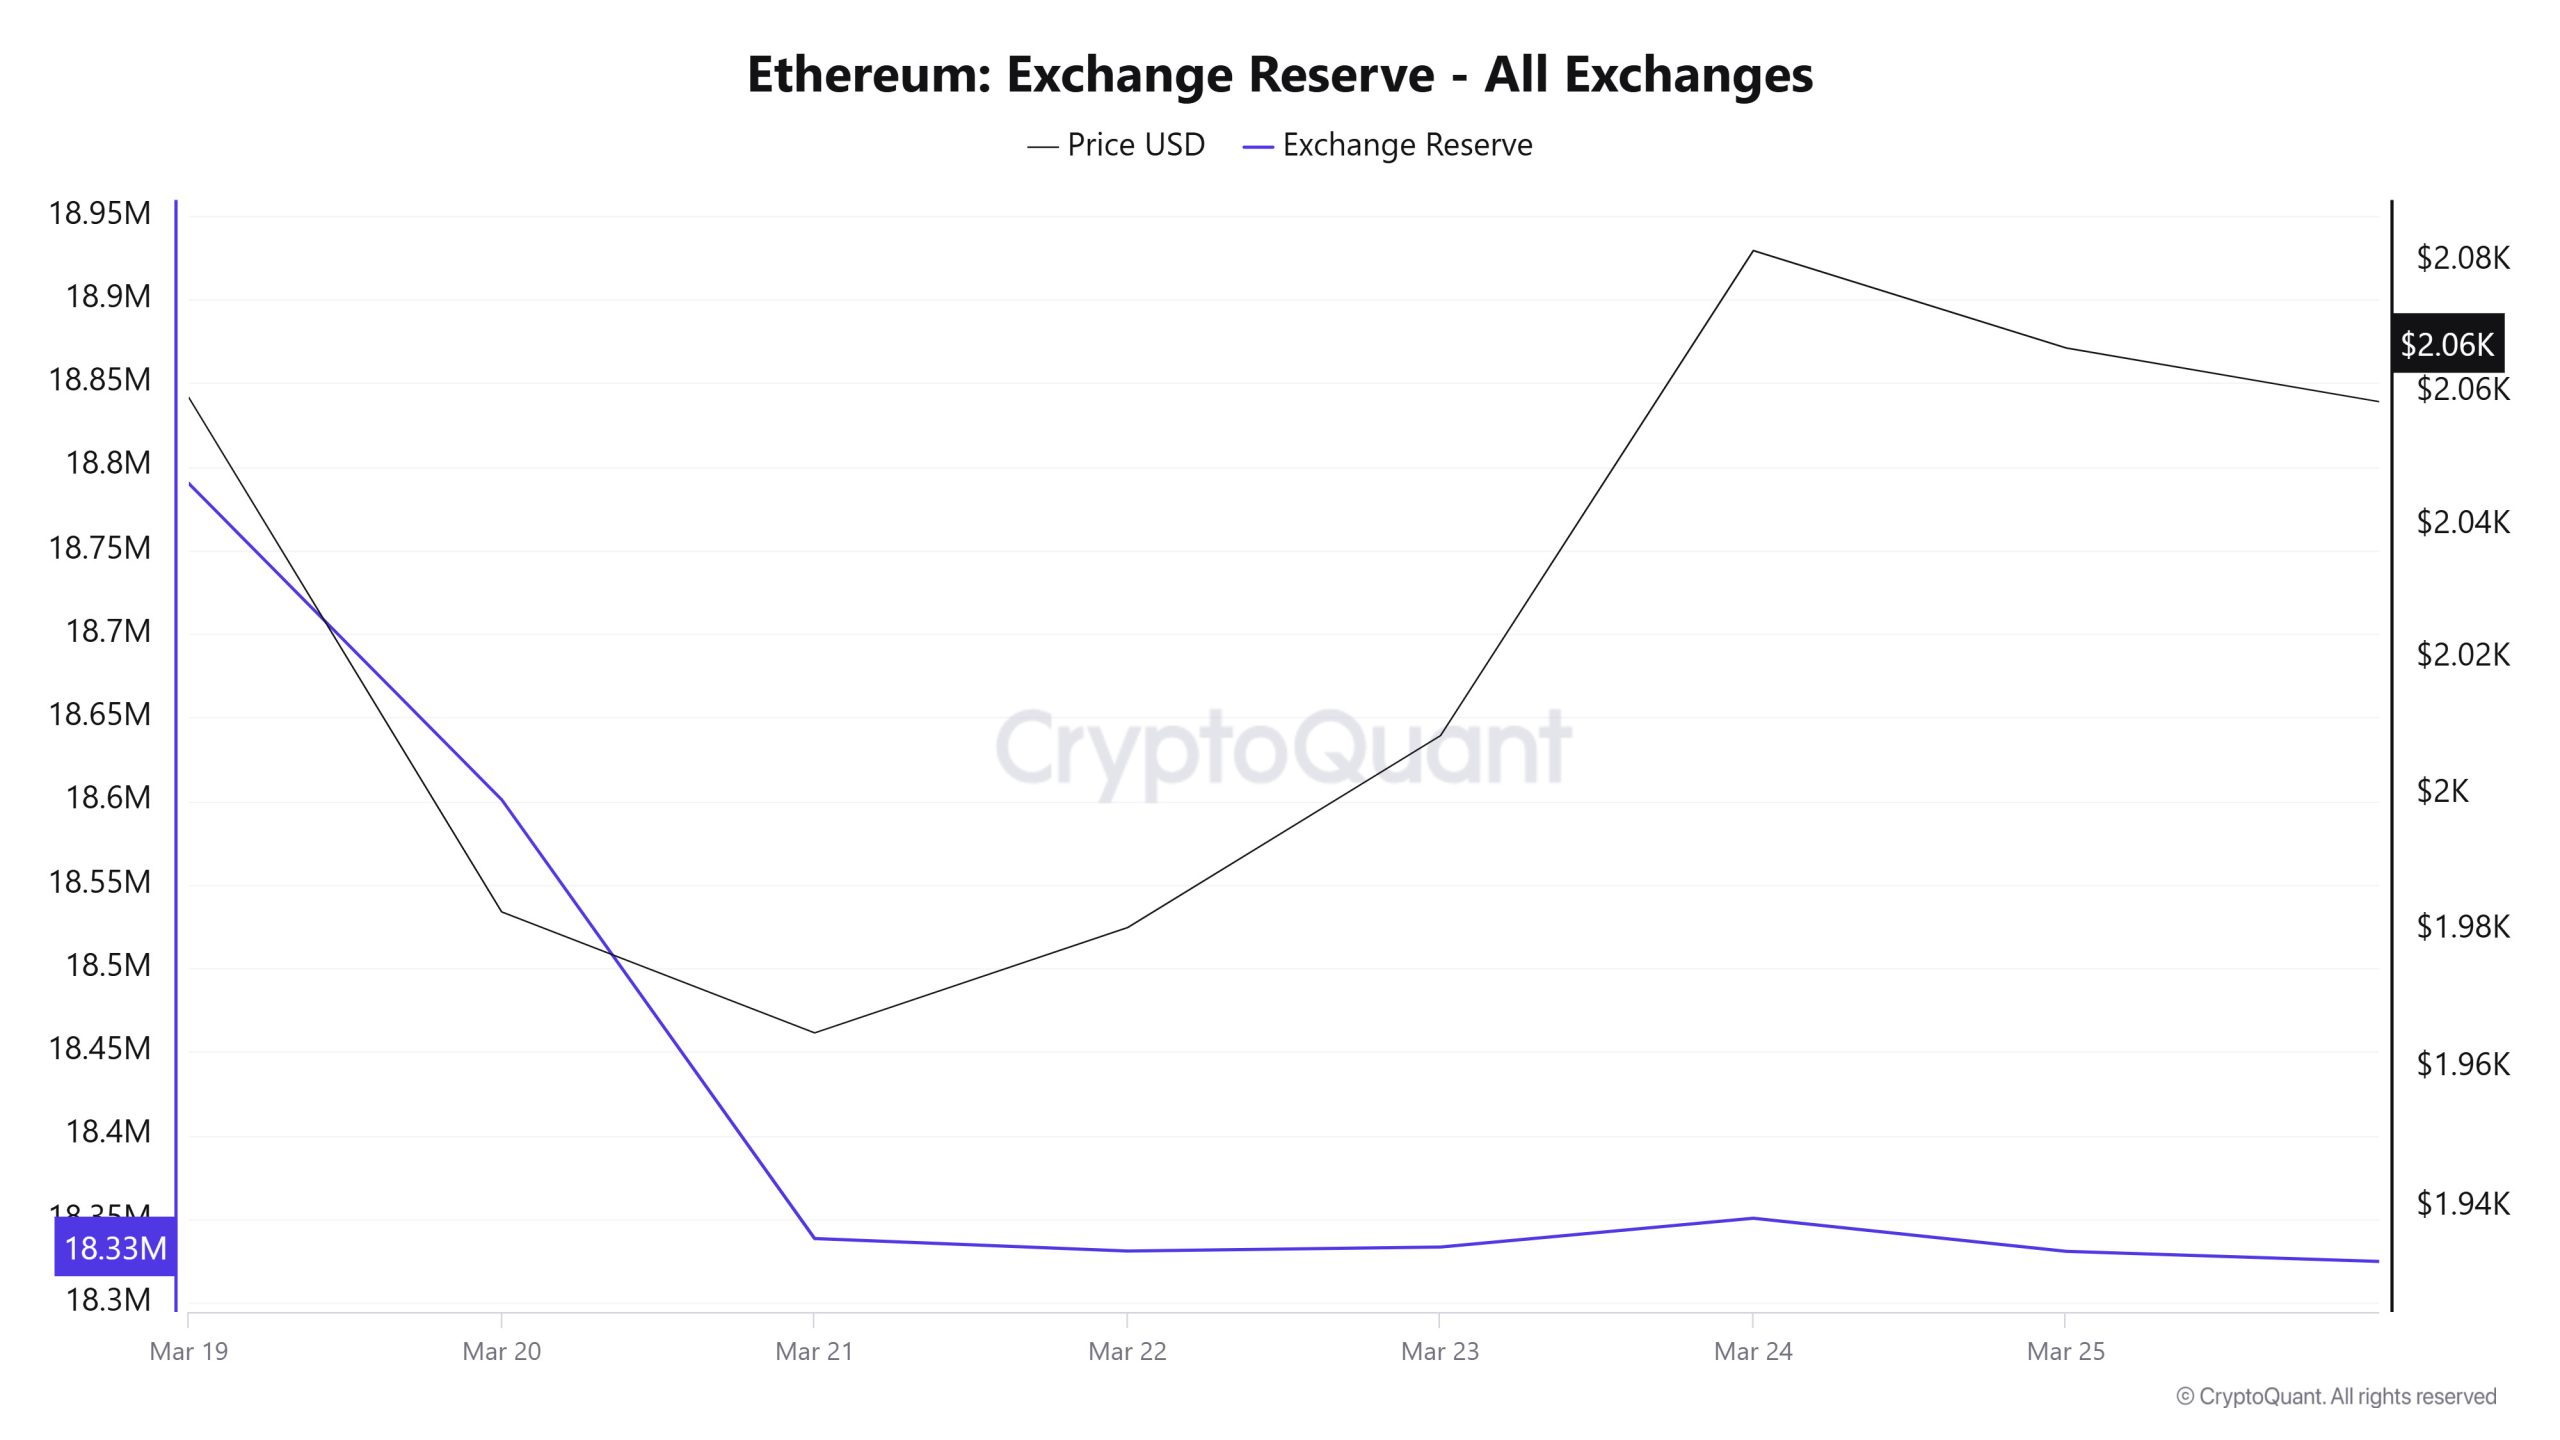
Between Marzo 19-25, 2025, Ethereum reserves on exchanges decreased from 18,789,803 ETH to 18,330,579 ETH. During this period, there was a total net outflow of 459,224 ETH and the Ethereum reserves of exchanges decreased by 2.44%. The Ethereum price increased by approximately 0.6% during this period. On Marzo 19, 2025, Ethereum closed at $2,059, and on Marzo 25, 2025, it closed at $2,067. High outflows from exchanges may put upward pressure on the price by reducing supply as investors turn to a long-term holding strategy.
| Data | Exchange Inflow | Exchange Outflow | Exchange Netflow | Exchange Reserve | ETH Price |
|---|---|---|---|---|---|
| 19-Mar | 900,773 | 1,040,097 | -139,324 | 18,789,803 | 2,059 |
| 20-Mar | 774,247 | 963,376 | -189,129 | 18,600,674 | 1,983 |
| 21-Mar | 499,335 | 761,709 | -262,375 | 18,338,300 | 1,965 |
| 22-Mar | 263,699 | 271,208 | -7,509 | 18,330,790 | 1,980 |
| 23-Mar | 296,658 | 294,202 | 2,456 | 18,333,246 | 2,009 |
| 24-Mar | 820,646 | 803,458 | 17,188 | 18,350,434 | 2,082 |
| 25-Mar | 455,365 | 475,220 | -19,855 | 18,330,579 | 2,067 |
Fees and Revenues
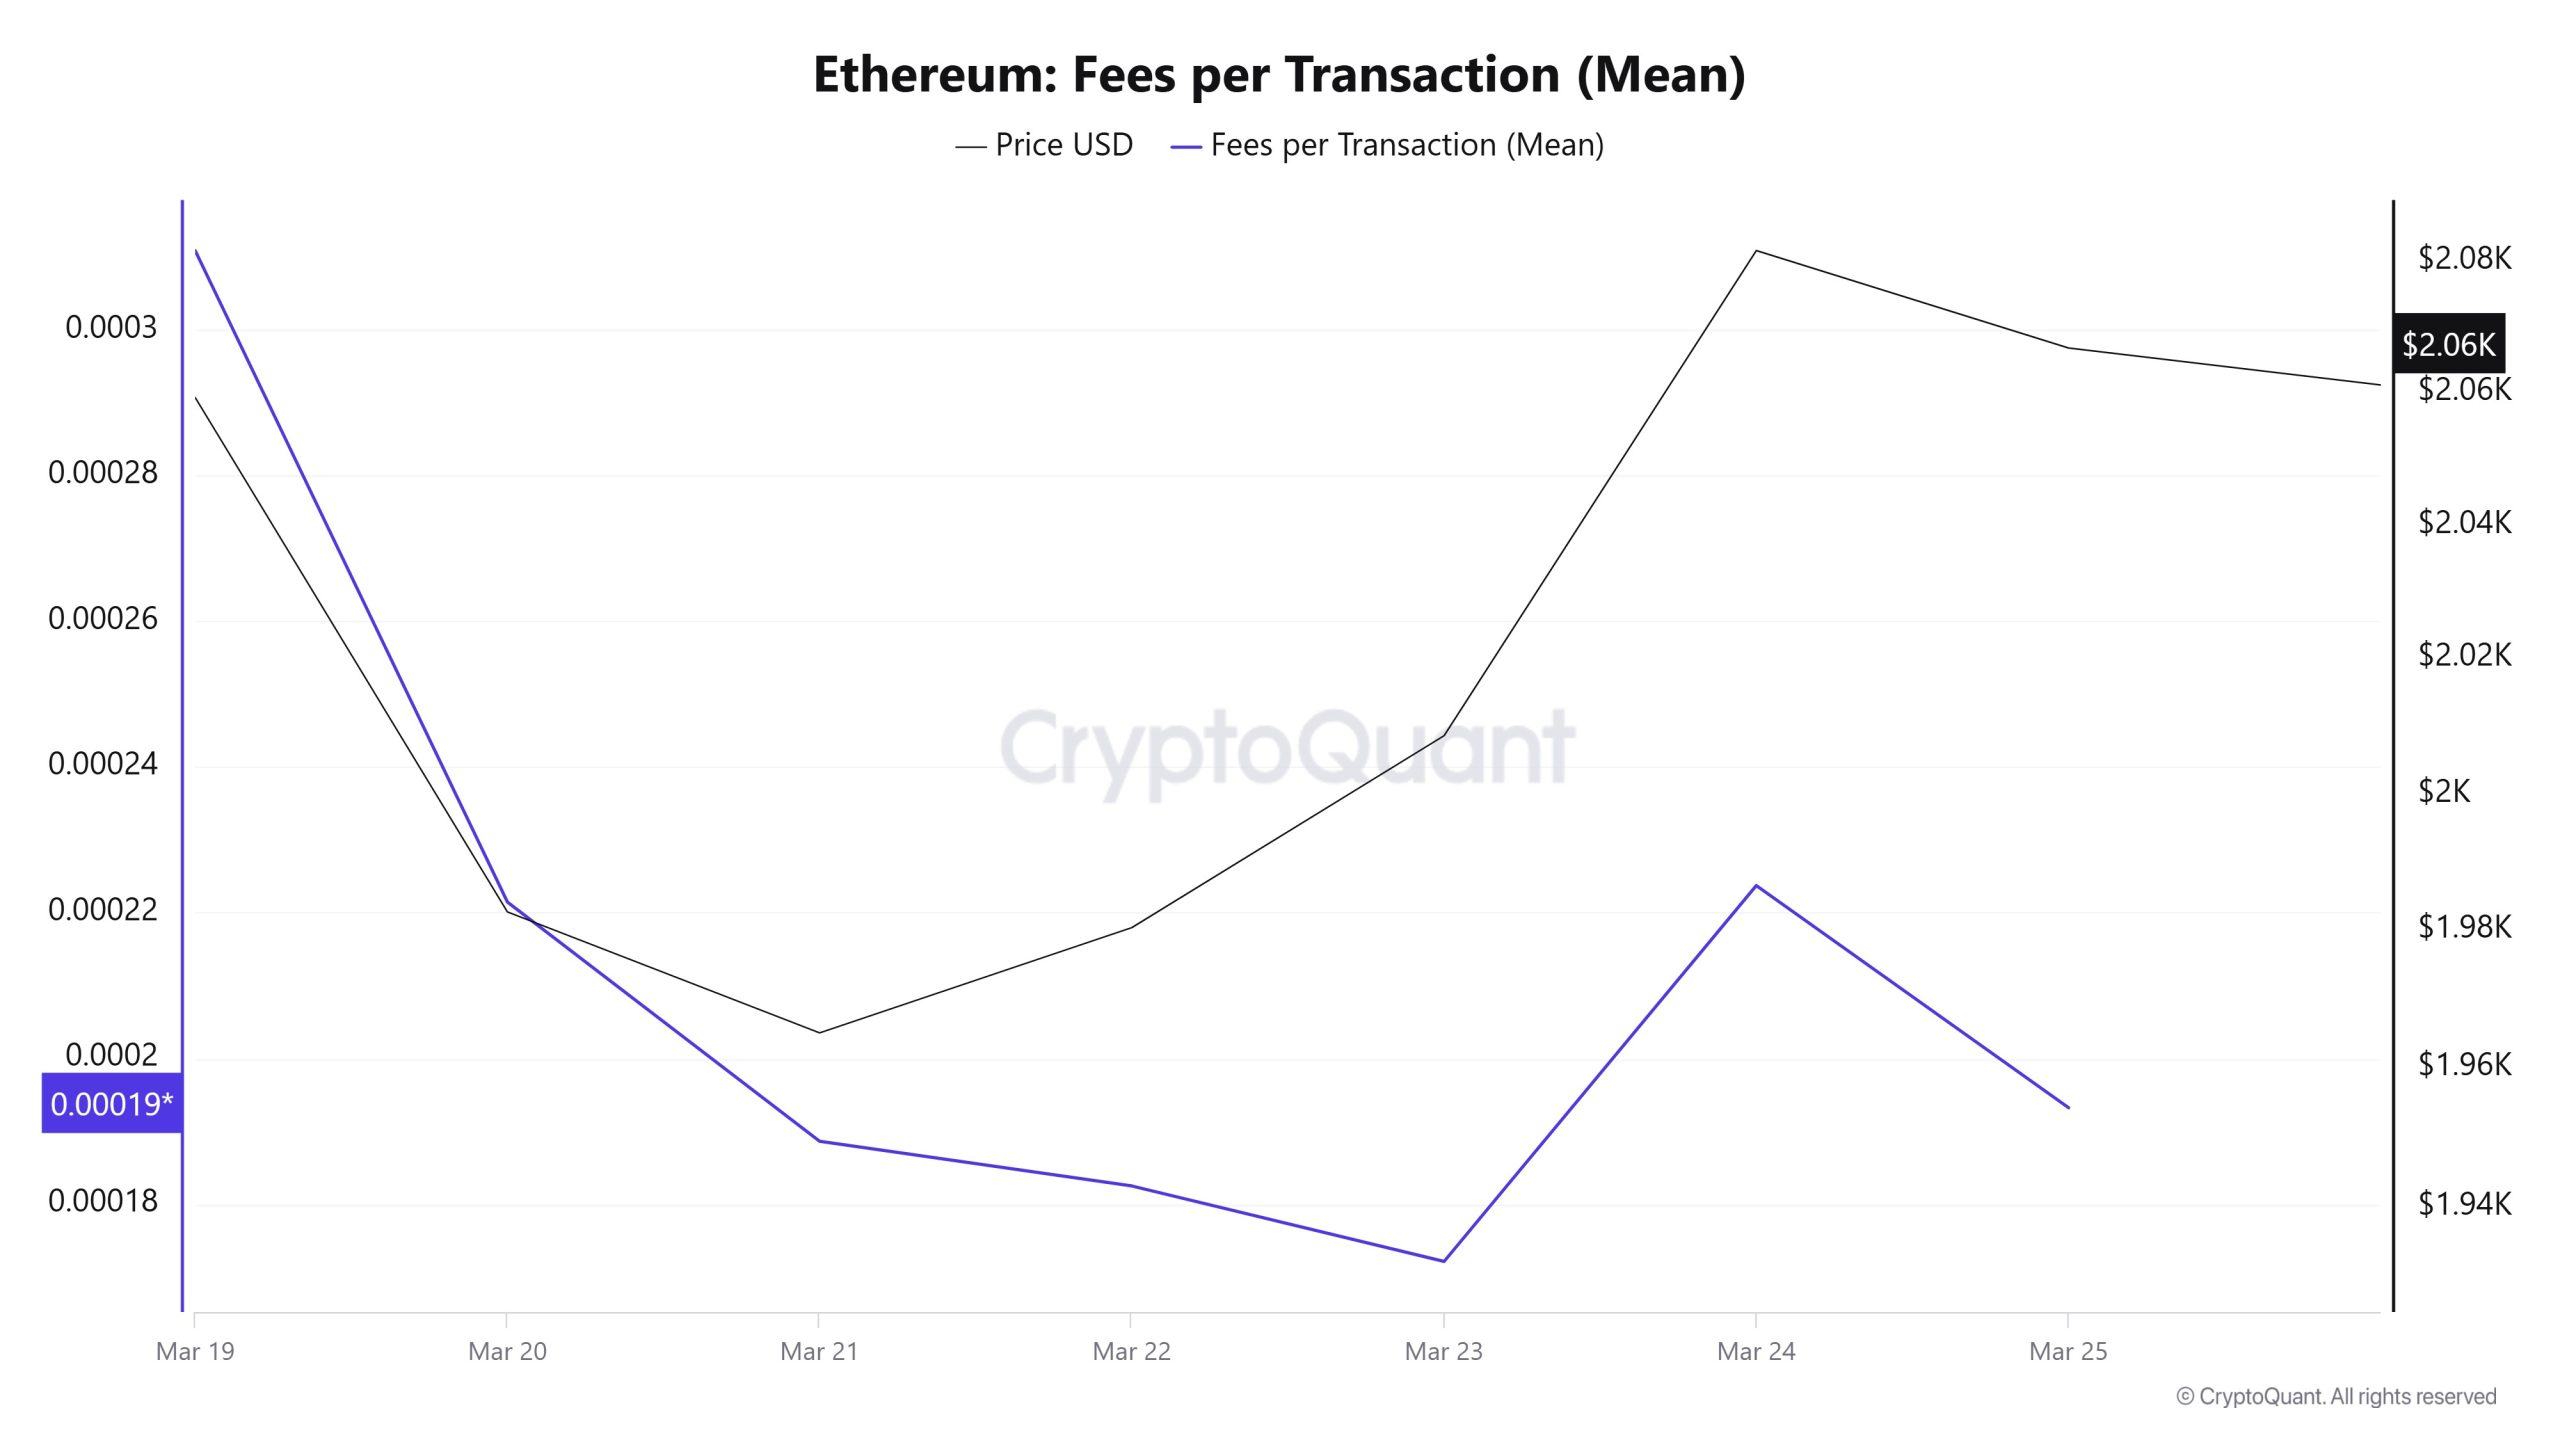 When Ethereum Fees per Transaction (Mean) data between Marzo 19- 25, is analyzed, it is seen that this value was at the level of 0.000310859884013044 on Marzo 19, the first day of the week. The value, which followed a decreasing course until Marzo 23, recorded the lowest value of the week with the level of 0.000172152916142432 on this date.
The value increased again in the following days and closed at 0.000193247808400229 on Marzo 25, the last day of the weekly period.
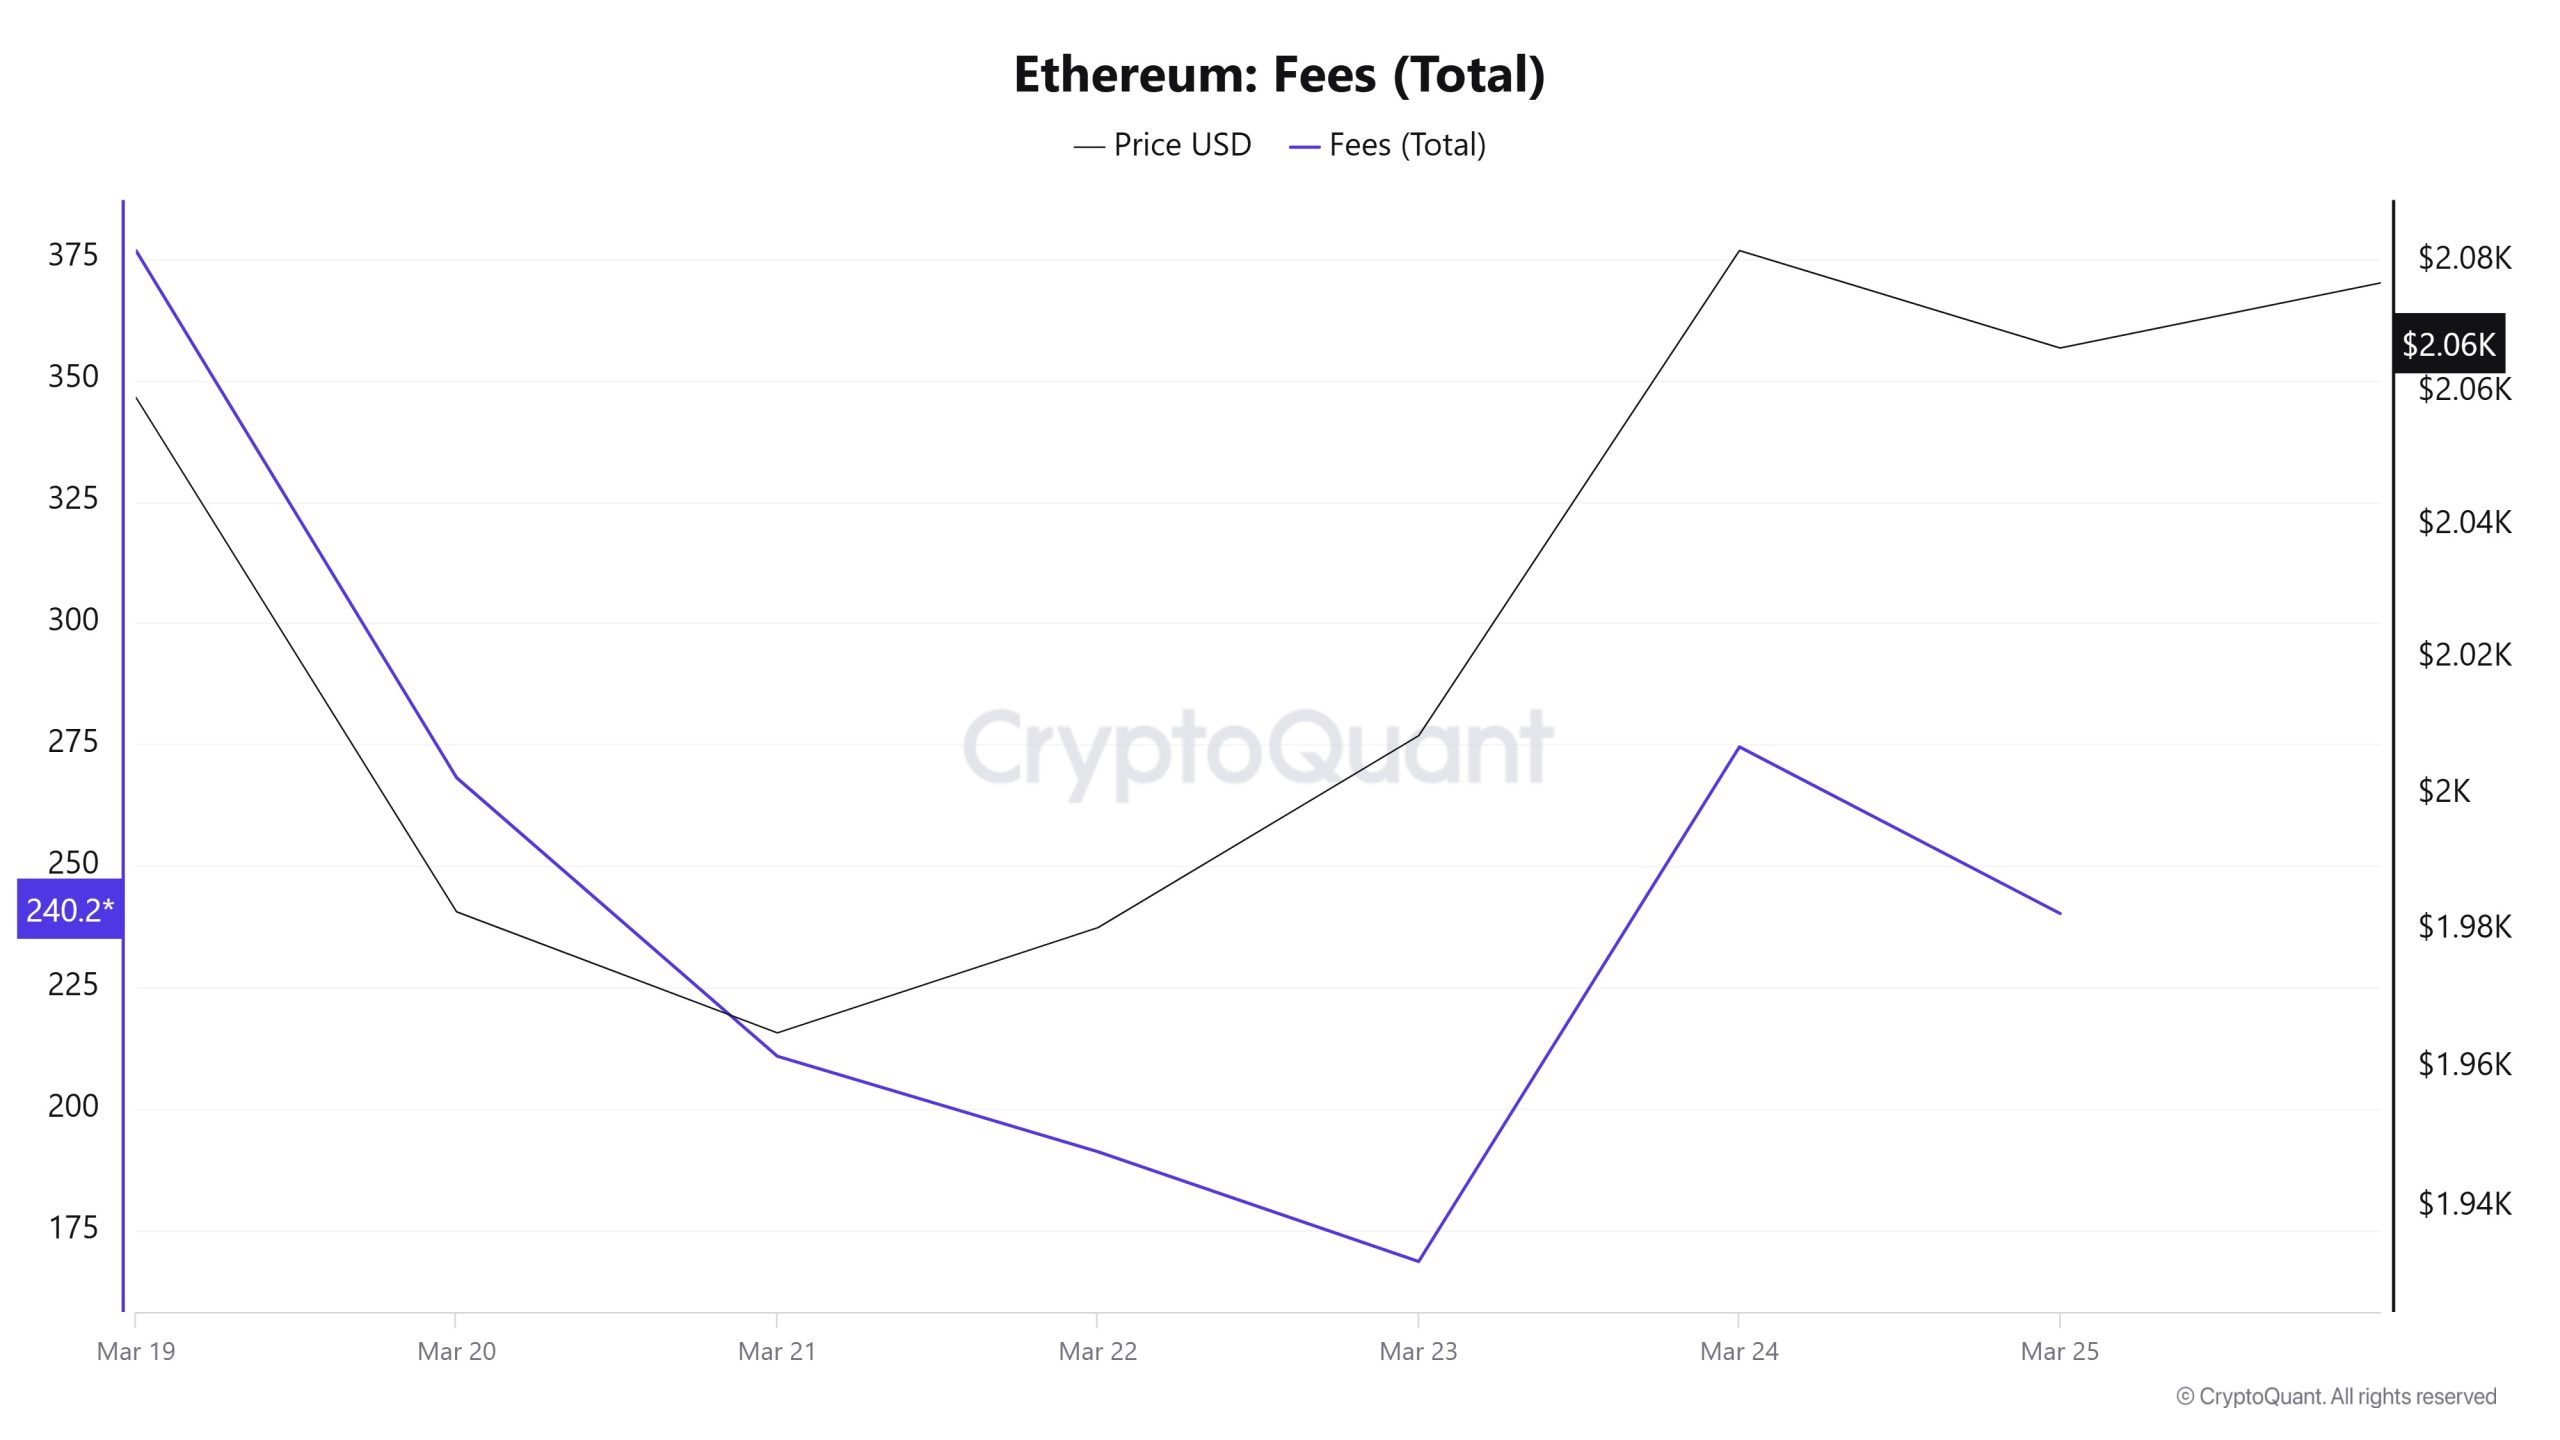
Similarly, when Ethereum Fees (Total) data between Marzo 19 and Marzo 25 were analyzed, it was seen that this value was 376.6530676045213 on Marzo 19, the first day of the week. The value, which followed a decreasing course until Marzo 23, recorded the lowest value of the week with the level of 168.69866788003446 on this date.
The value increased again in the following days and closed at 240.27601530908348 on Marzo 25, the last day of the weekly period.
Blocks Mined
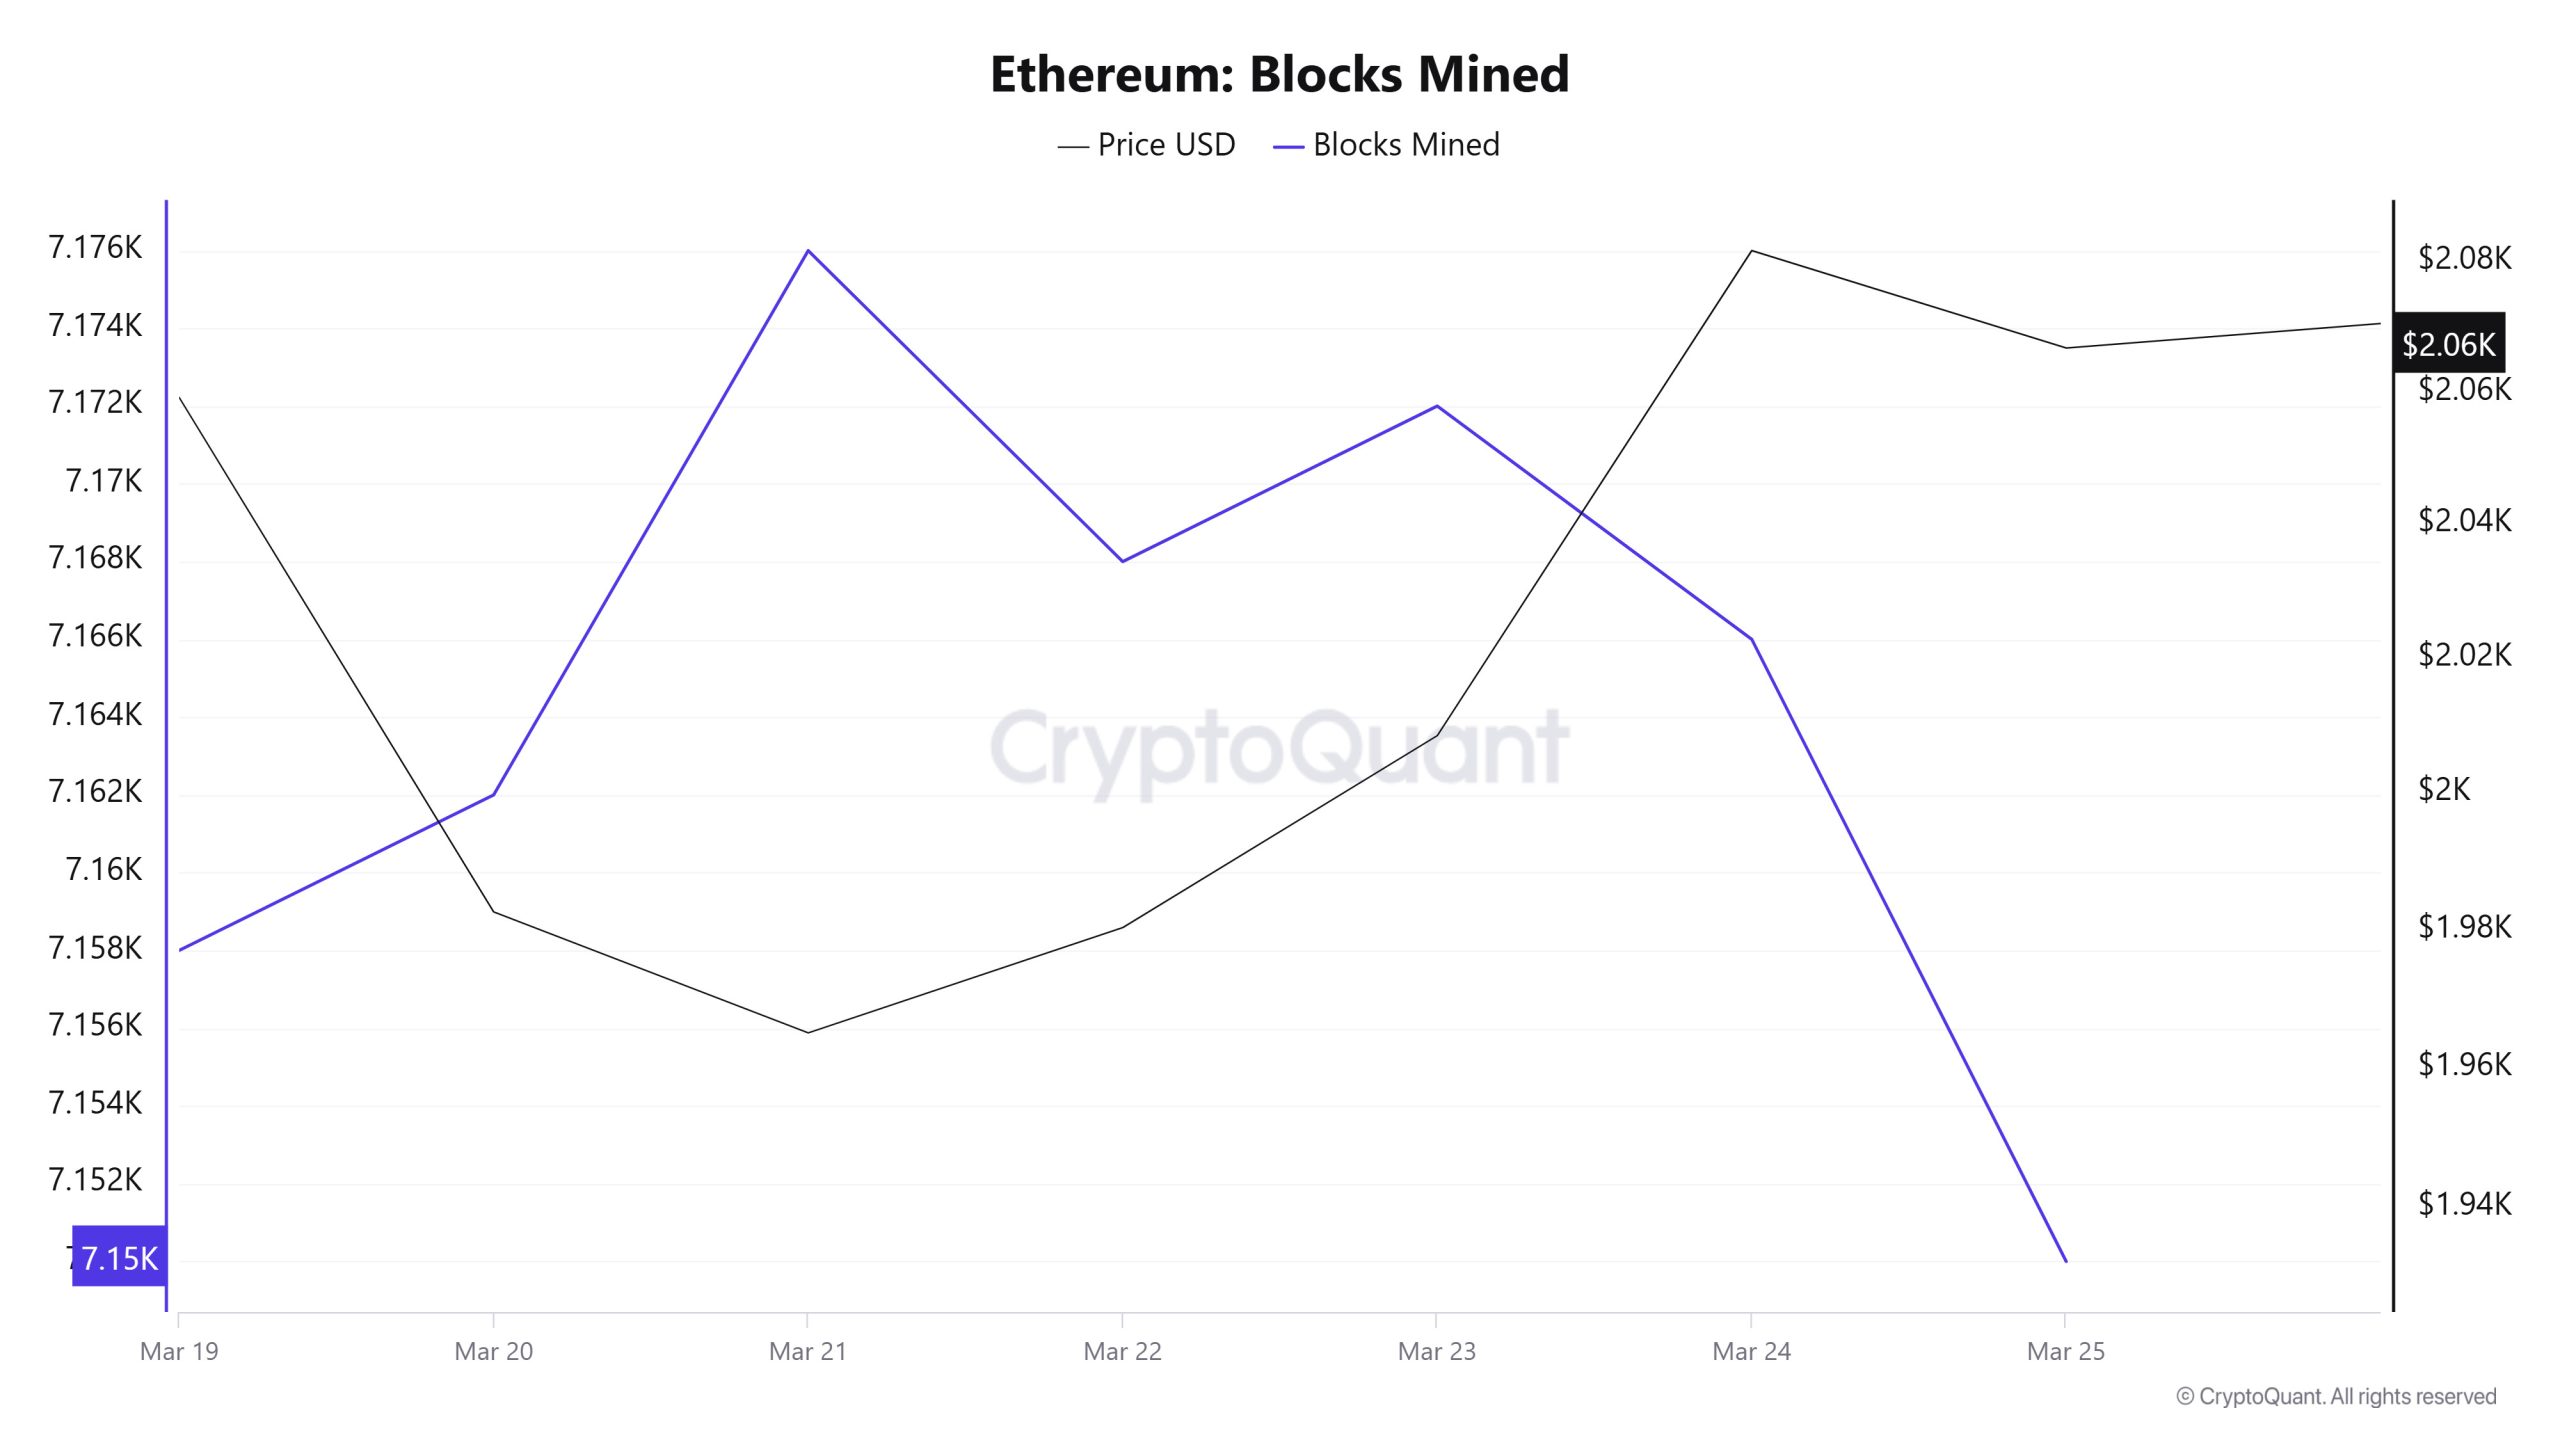
When we examine the Ethereum Blocks Mined table between Marzo 19-25, there was an increase in the number of blocks produced at the beginning of the week, but a decrease towards the end of the week. While 7,158 blocks were produced on Marzo 19, this number was 7,150 on Marzo 25. There was a negative correlation between Blocks Mined and Ethereum price throughout the week.
Block Size
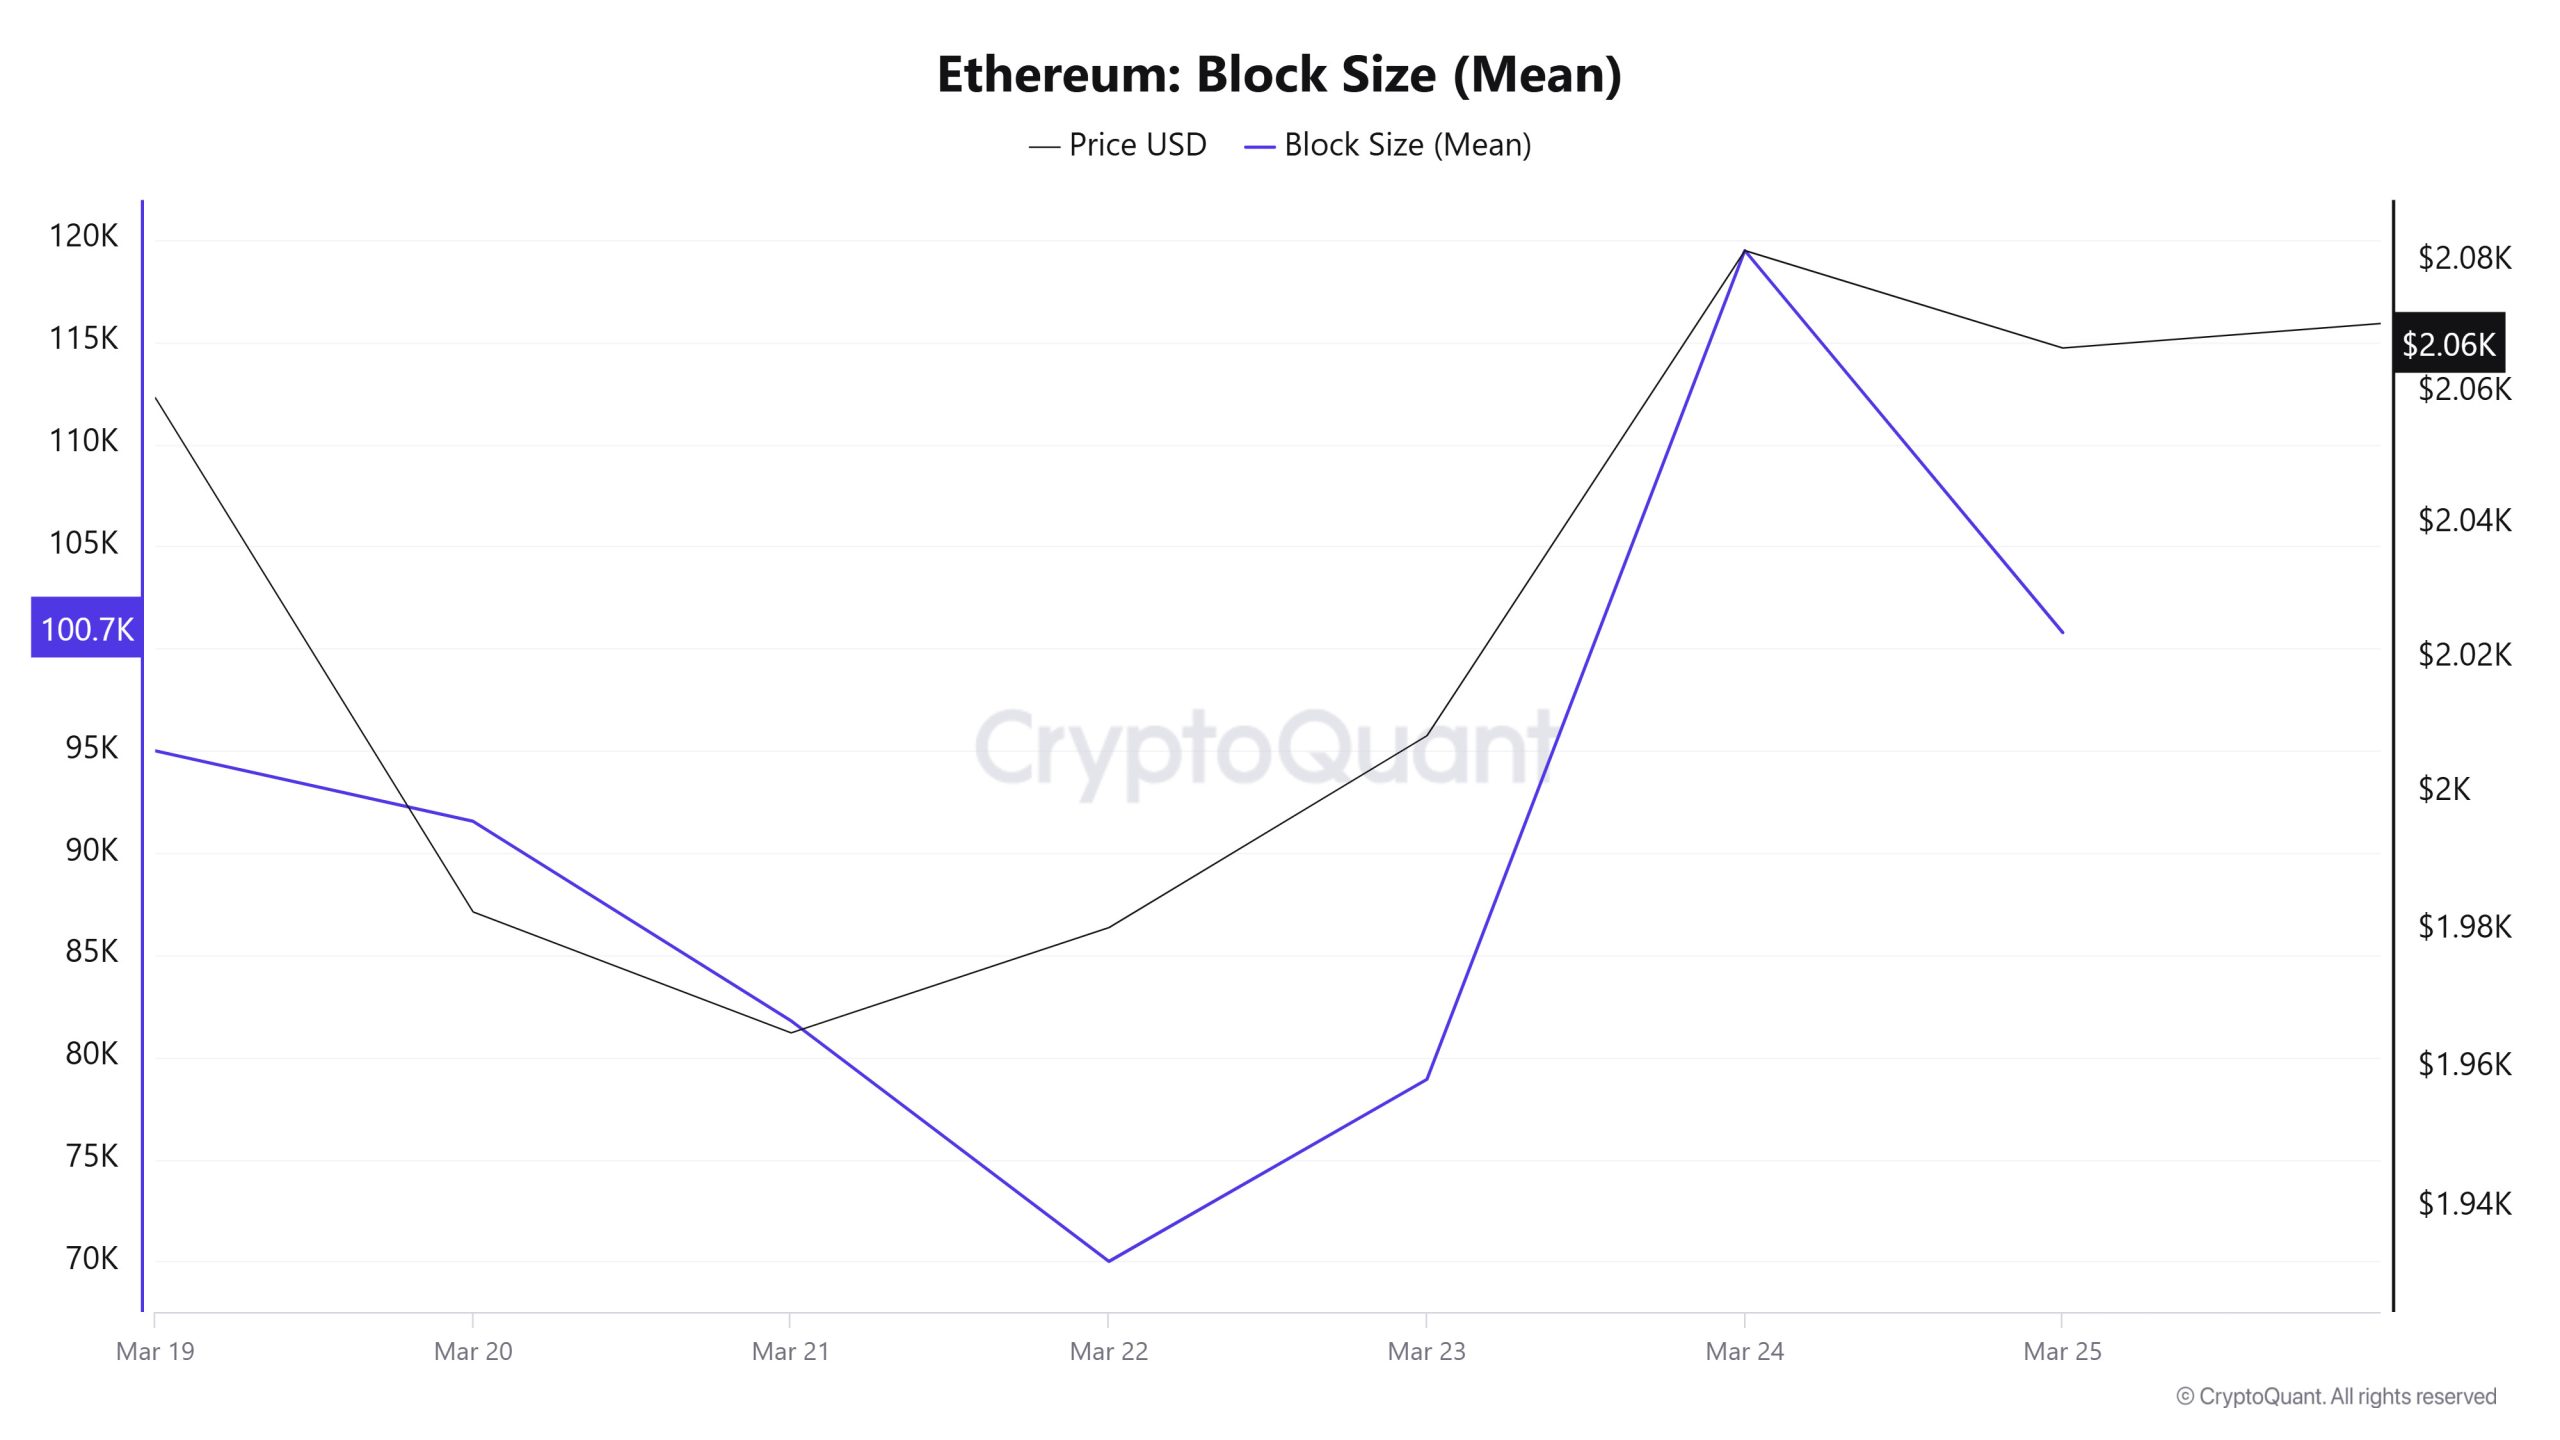
When we examine the Ethereum Block Size table between Marzo 19-25, there was a slight decrease in the middle of the week, but then it increased towards the end of the week. On Marzo 19, the block size was 94,991 bytes, reaching 100,771 bytes by Marzo 25. There was a positive correlation between Block Size and Ethereum price during the week.
Block Interval
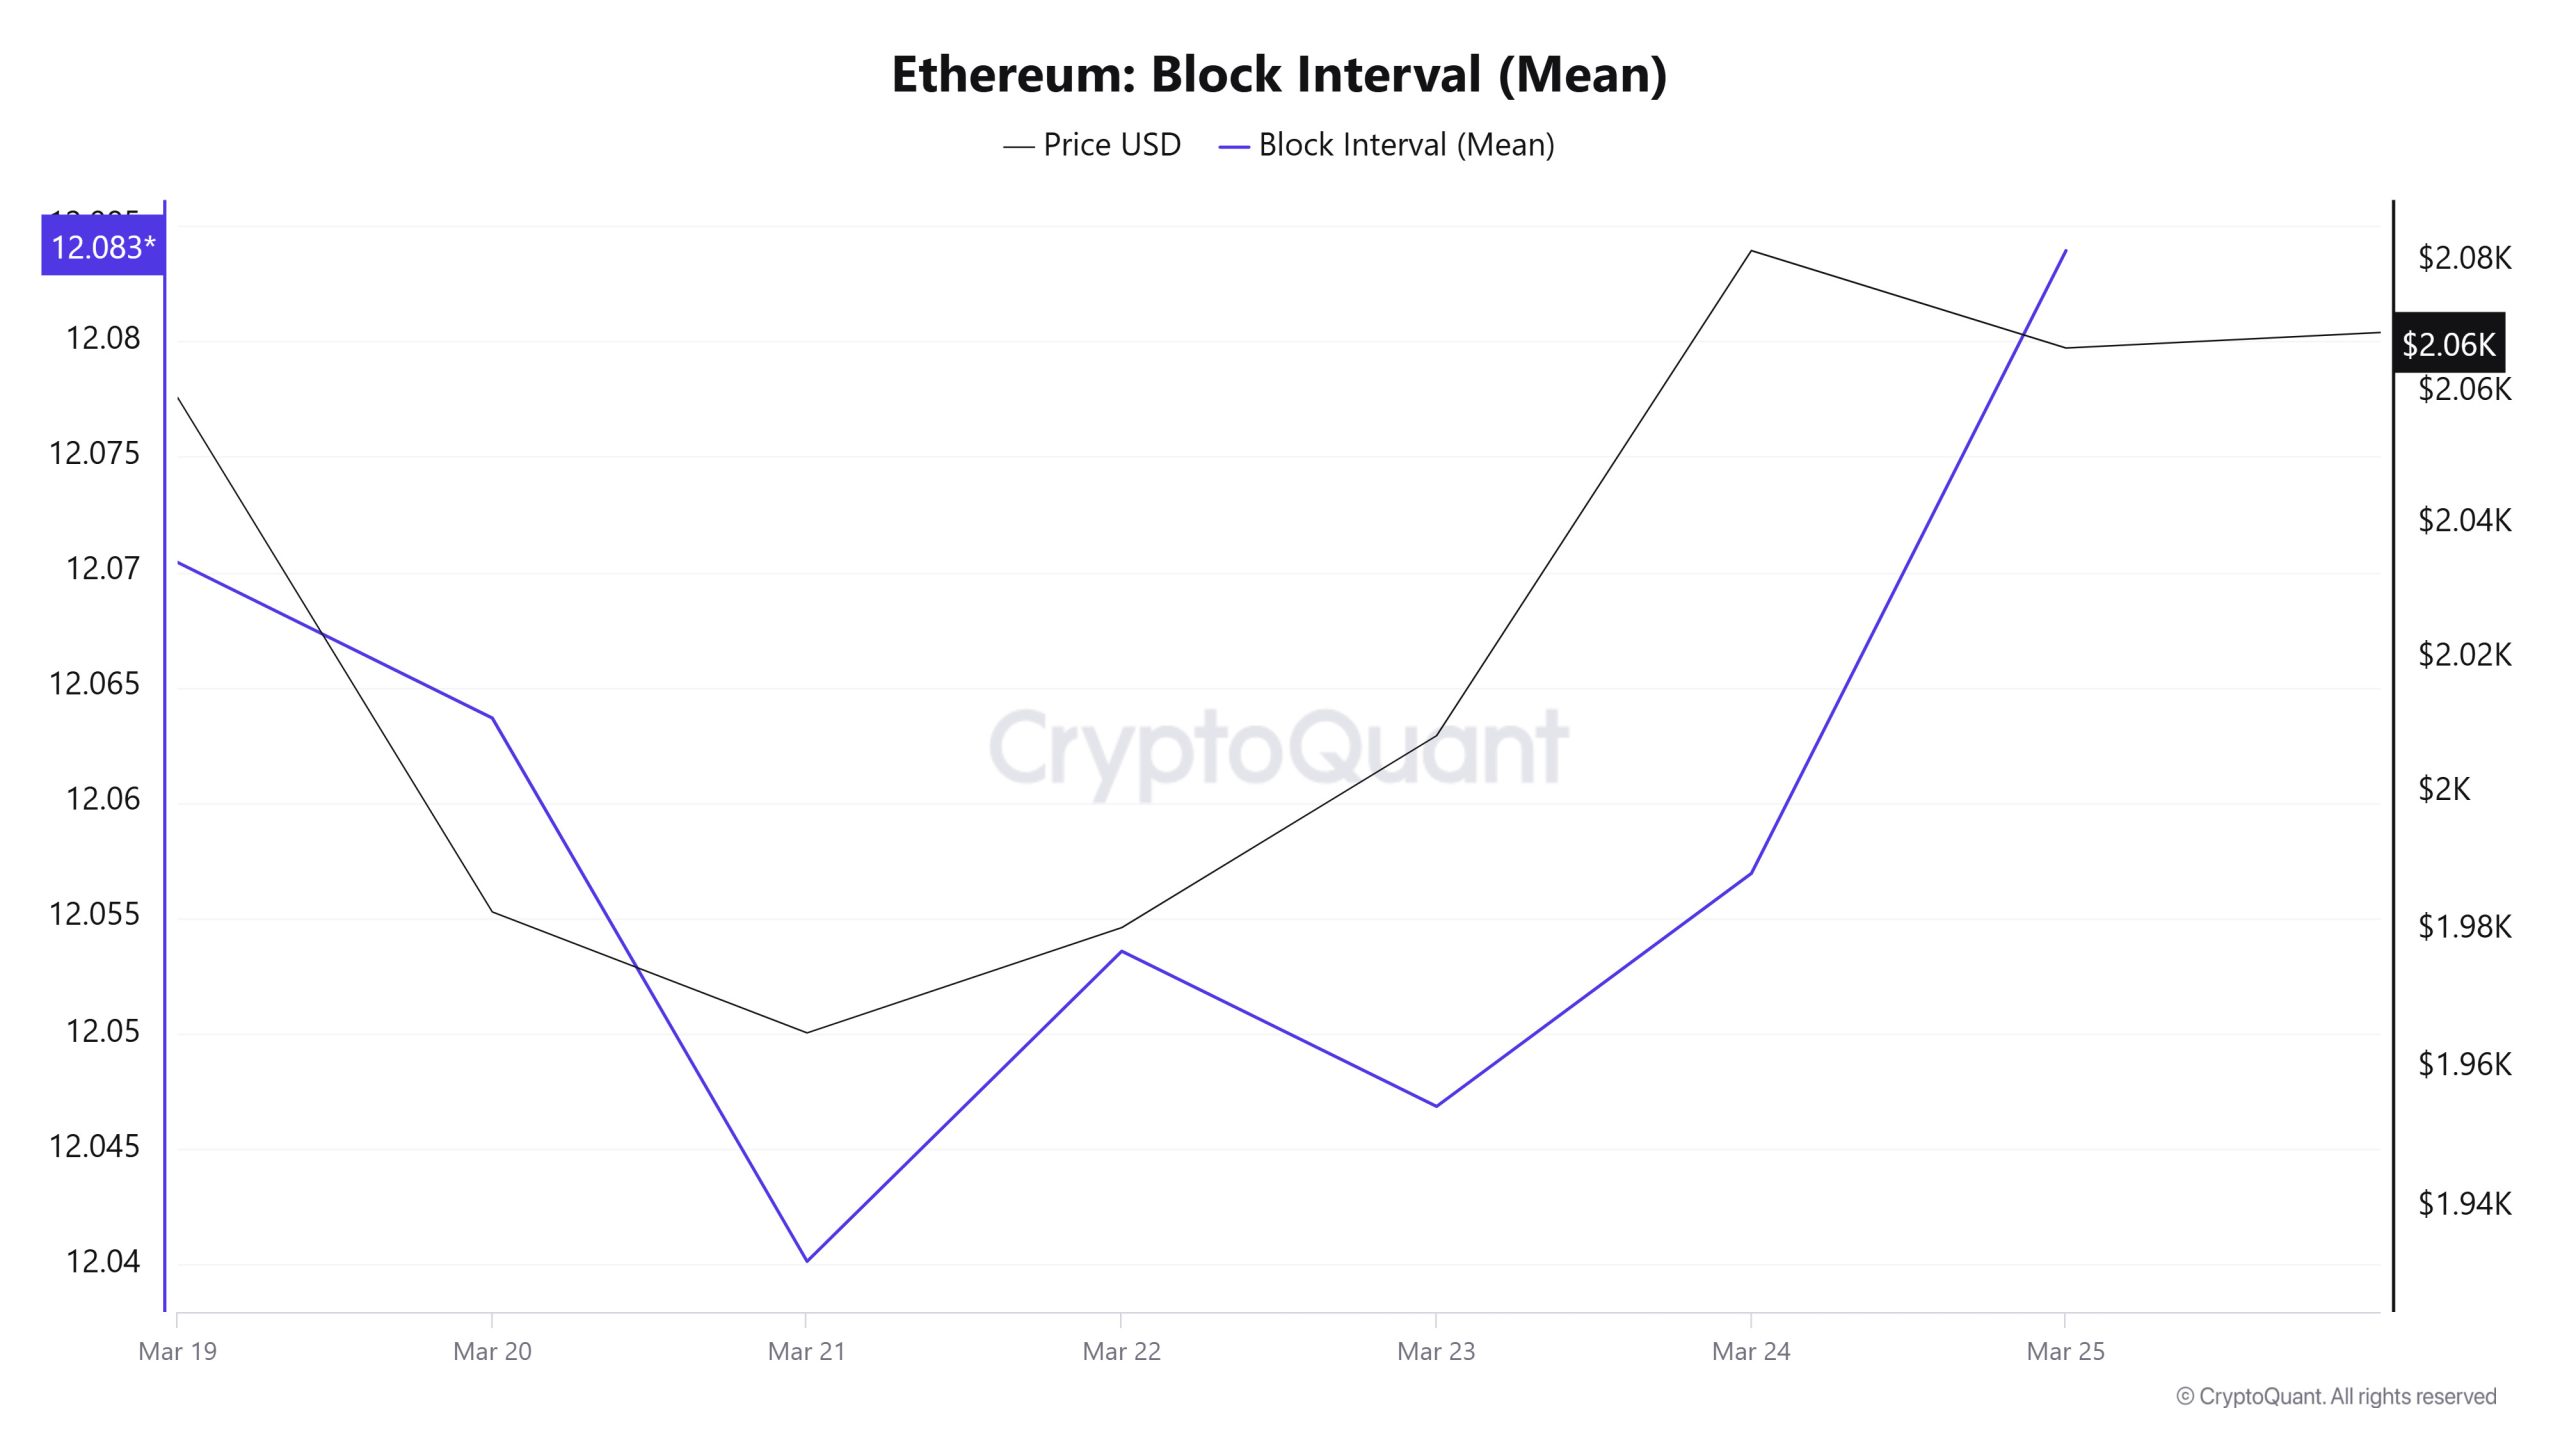
When we examine the Ethereum Block Interval table between Marzo 19-25, although there was a decrease towards the middle of the week, there was a slight increase in the time between blocks towards the end of the week. On Marzo 19, the time between blocks was 12.07 seconds, while on Marzo 25 it was 12.08 seconds. There was a positive correlation between Block Interval and Ethereum price during the week.
Transaction
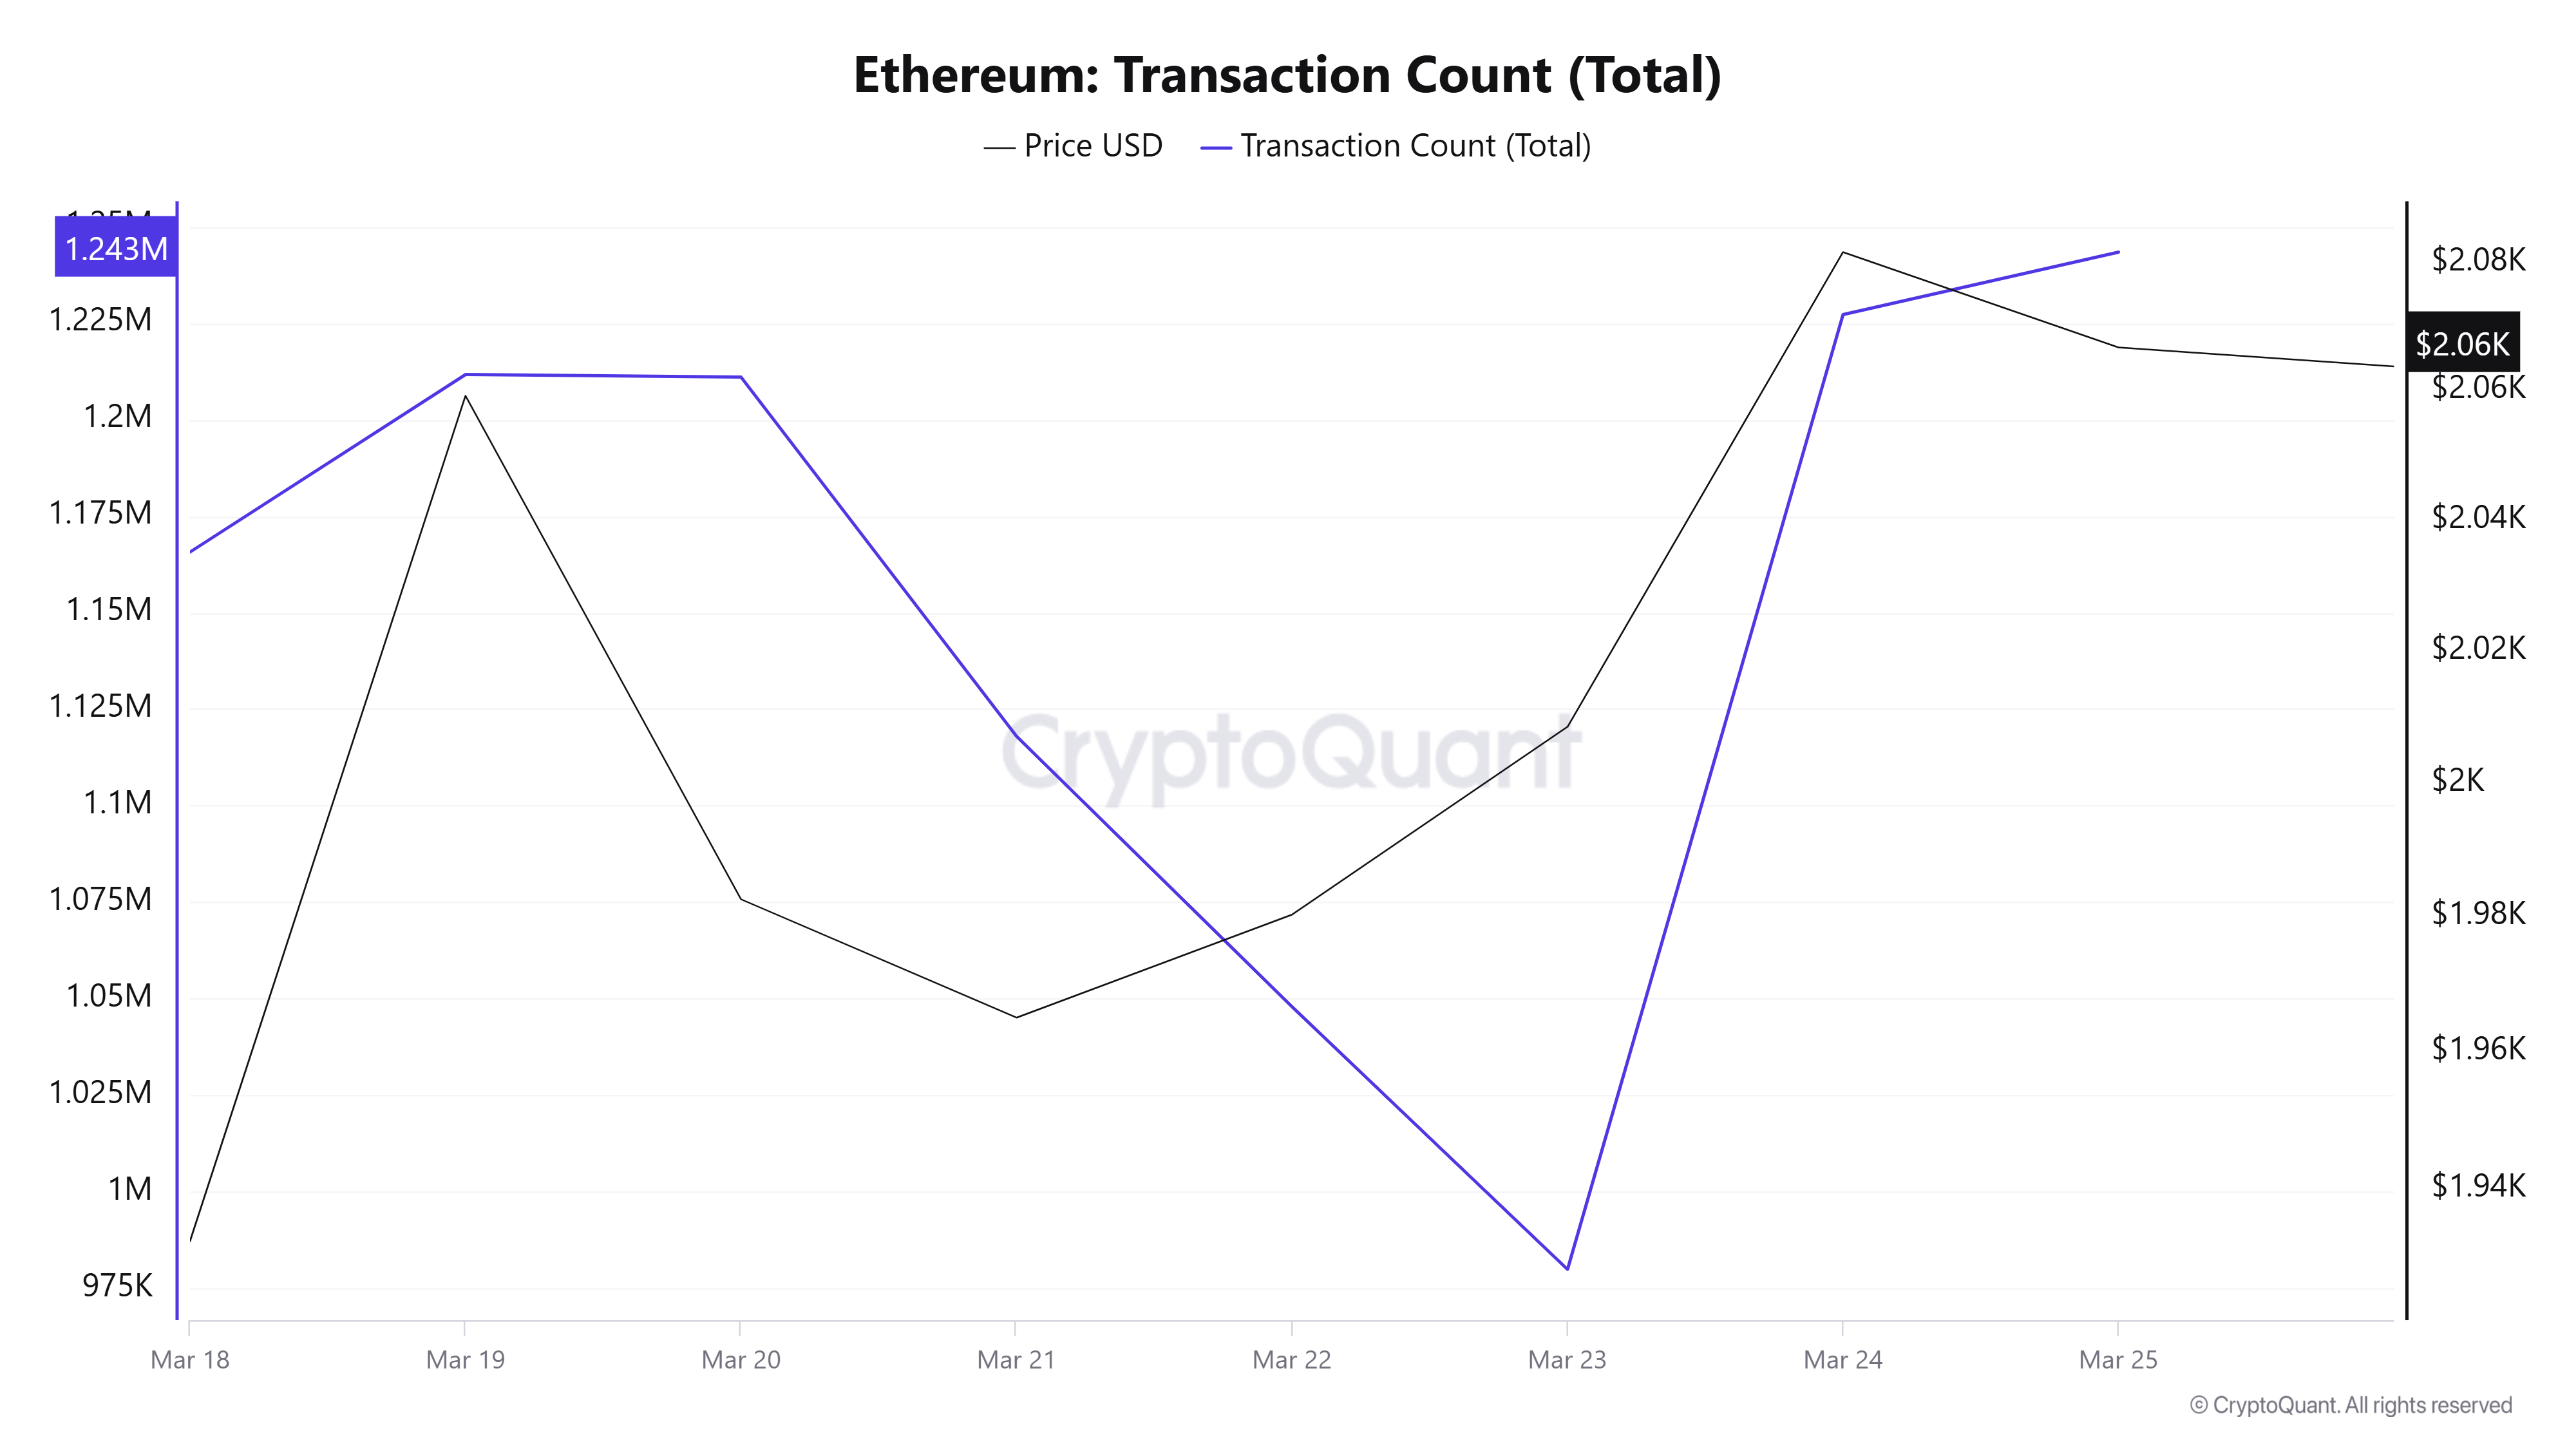
Last week, 7,848,719 transactions were processed, while this week’s number increased by about 2.43% to 8,039,057. The highest number of transactions was 1,243,357 on Marzo 25, while Marzo 23 had the lowest number of transactions on the network for the week with 979,935 transactions. The increase in the number of transactions compared to last week seems to be positive in terms of network utilization. The increase in price and the positive correlation between the number of transfers and price during the weekdays should be interpreted positively.
Tokens Transferred
While the amount of Ethereum transferred last week was 10,899,869, 9,638,895 Ethereum was transferred this week, a decrease of 11.58%. On Marzo 23, 667,158 Ethereum transfers were recorded as the lowest transfer amount of the week, while on Marzo 19, 2,187,160 Ethereum transfers were recorded as the highest transfer amount of the week.
The increase in the number of transactions, as well as the significant drop in the amount of Ethereum transferred, may indicate that institutional selling pressure is fading and the share of individual users on the network is starting to increase. The decline in institutional investor sales may indicate that major selling pressures are nearing an end . This strengthens the likelihood that small investors may continue their activity on the network in a sideways manner for a while.
Estimated Leverage Ratio
Ethereum-Transaction-Count-(Total)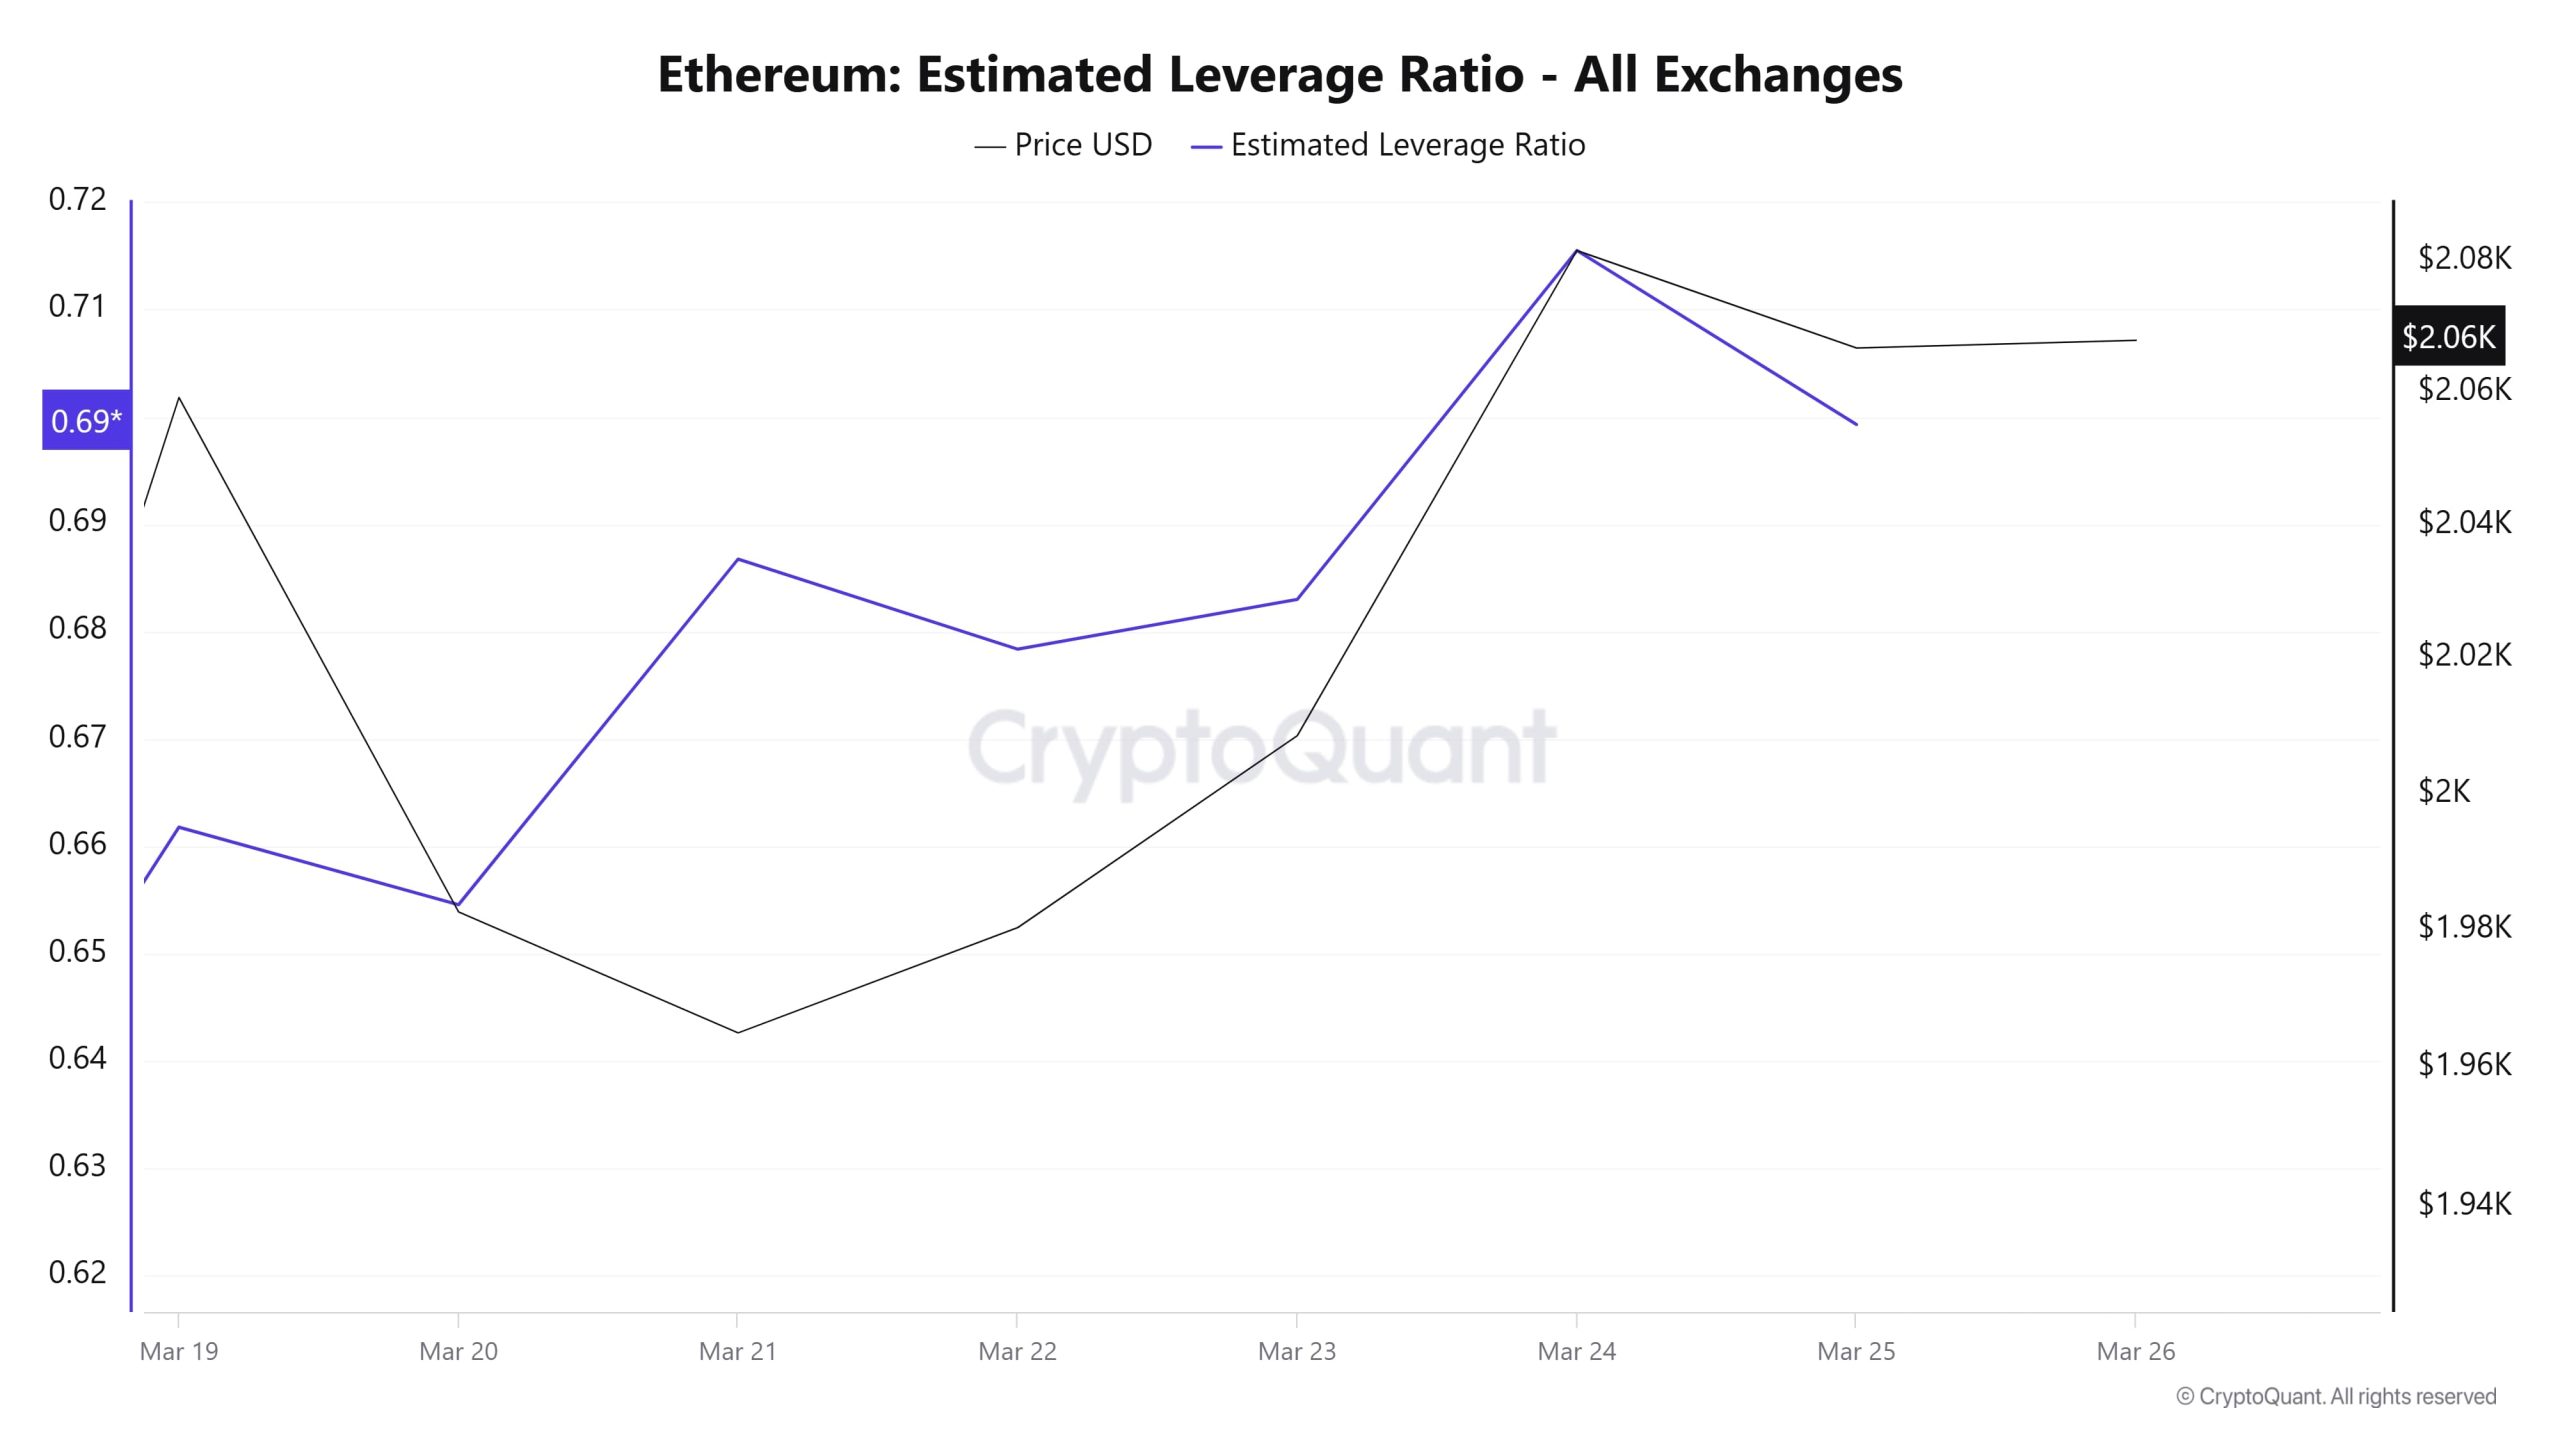
At the beginning of the 7-day period, the metric remained flat and then rose. Towards the end, it has entered a slightly downward trend. ELR (Estimated Leverage Ratio), which had a value of 0.661 at the beginning of the process, rose in the middle of the process and reached 0.683, but retreated from the peak in the last period of the process and is currently at 0.699. The peak in this process was measured as 0.715 on Marzo 24. A higher ELR means that participants are willing to take on more risk and usually indicates bullish conditions or expectations. It should be noted that these rises can also be caused by a decrease in reserves. When we look at Ethereum reserves, there were 18.79 million reserves at the beginning of the process, while this figure continued to decrease towards the end of the process and decreased to 18.22 million. Today, the amount of reserves, which has increased slightly, is approximately 18.37 million. At the same time, Ethereum’s Open Interest rate increased slightly. With all this data, we can say that the rise in the chart towards the end of the process is mostly due to reserve decreases. The price of the asset moved between $1,950 and $2,100 in parallel. The decrease in the amount of reserves and the slight increase in the open interest rate explain the rise in the ELR rate. As a result, the decline in reserves and the slight rise in the open interest rate show that some of the rise in the ELR metric is artificial
Avviso legale
Le informazioni, i commenti e le raccomandazioni sugli investimenti contenuti nel presente documento non costituiscono servizi di consulenza sugli investimenti. I servizi di consulenza sugli investimenti sono forniti da istituti autorizzati su base personale, tenendo conto delle preferenze di rischio e di rendimento dei singoli. I commenti e le raccomandazioni contenuti nel presente documento sono di tipo generale. Tali raccomandazioni potrebbero non essere adatte alla vostra situazione finanziaria e alle vostre preferenze di rischio e rendimento. Pertanto, prendere una decisione di investimento basandosi esclusivamente sulle informazioni contenute nel presente documento potrebbe non portare a risultati in linea con le vostre aspettative.
NOTE: All data used in Bitcoin onchain analysis is based on Cryptoqaunt
