
Indirizzi attivi
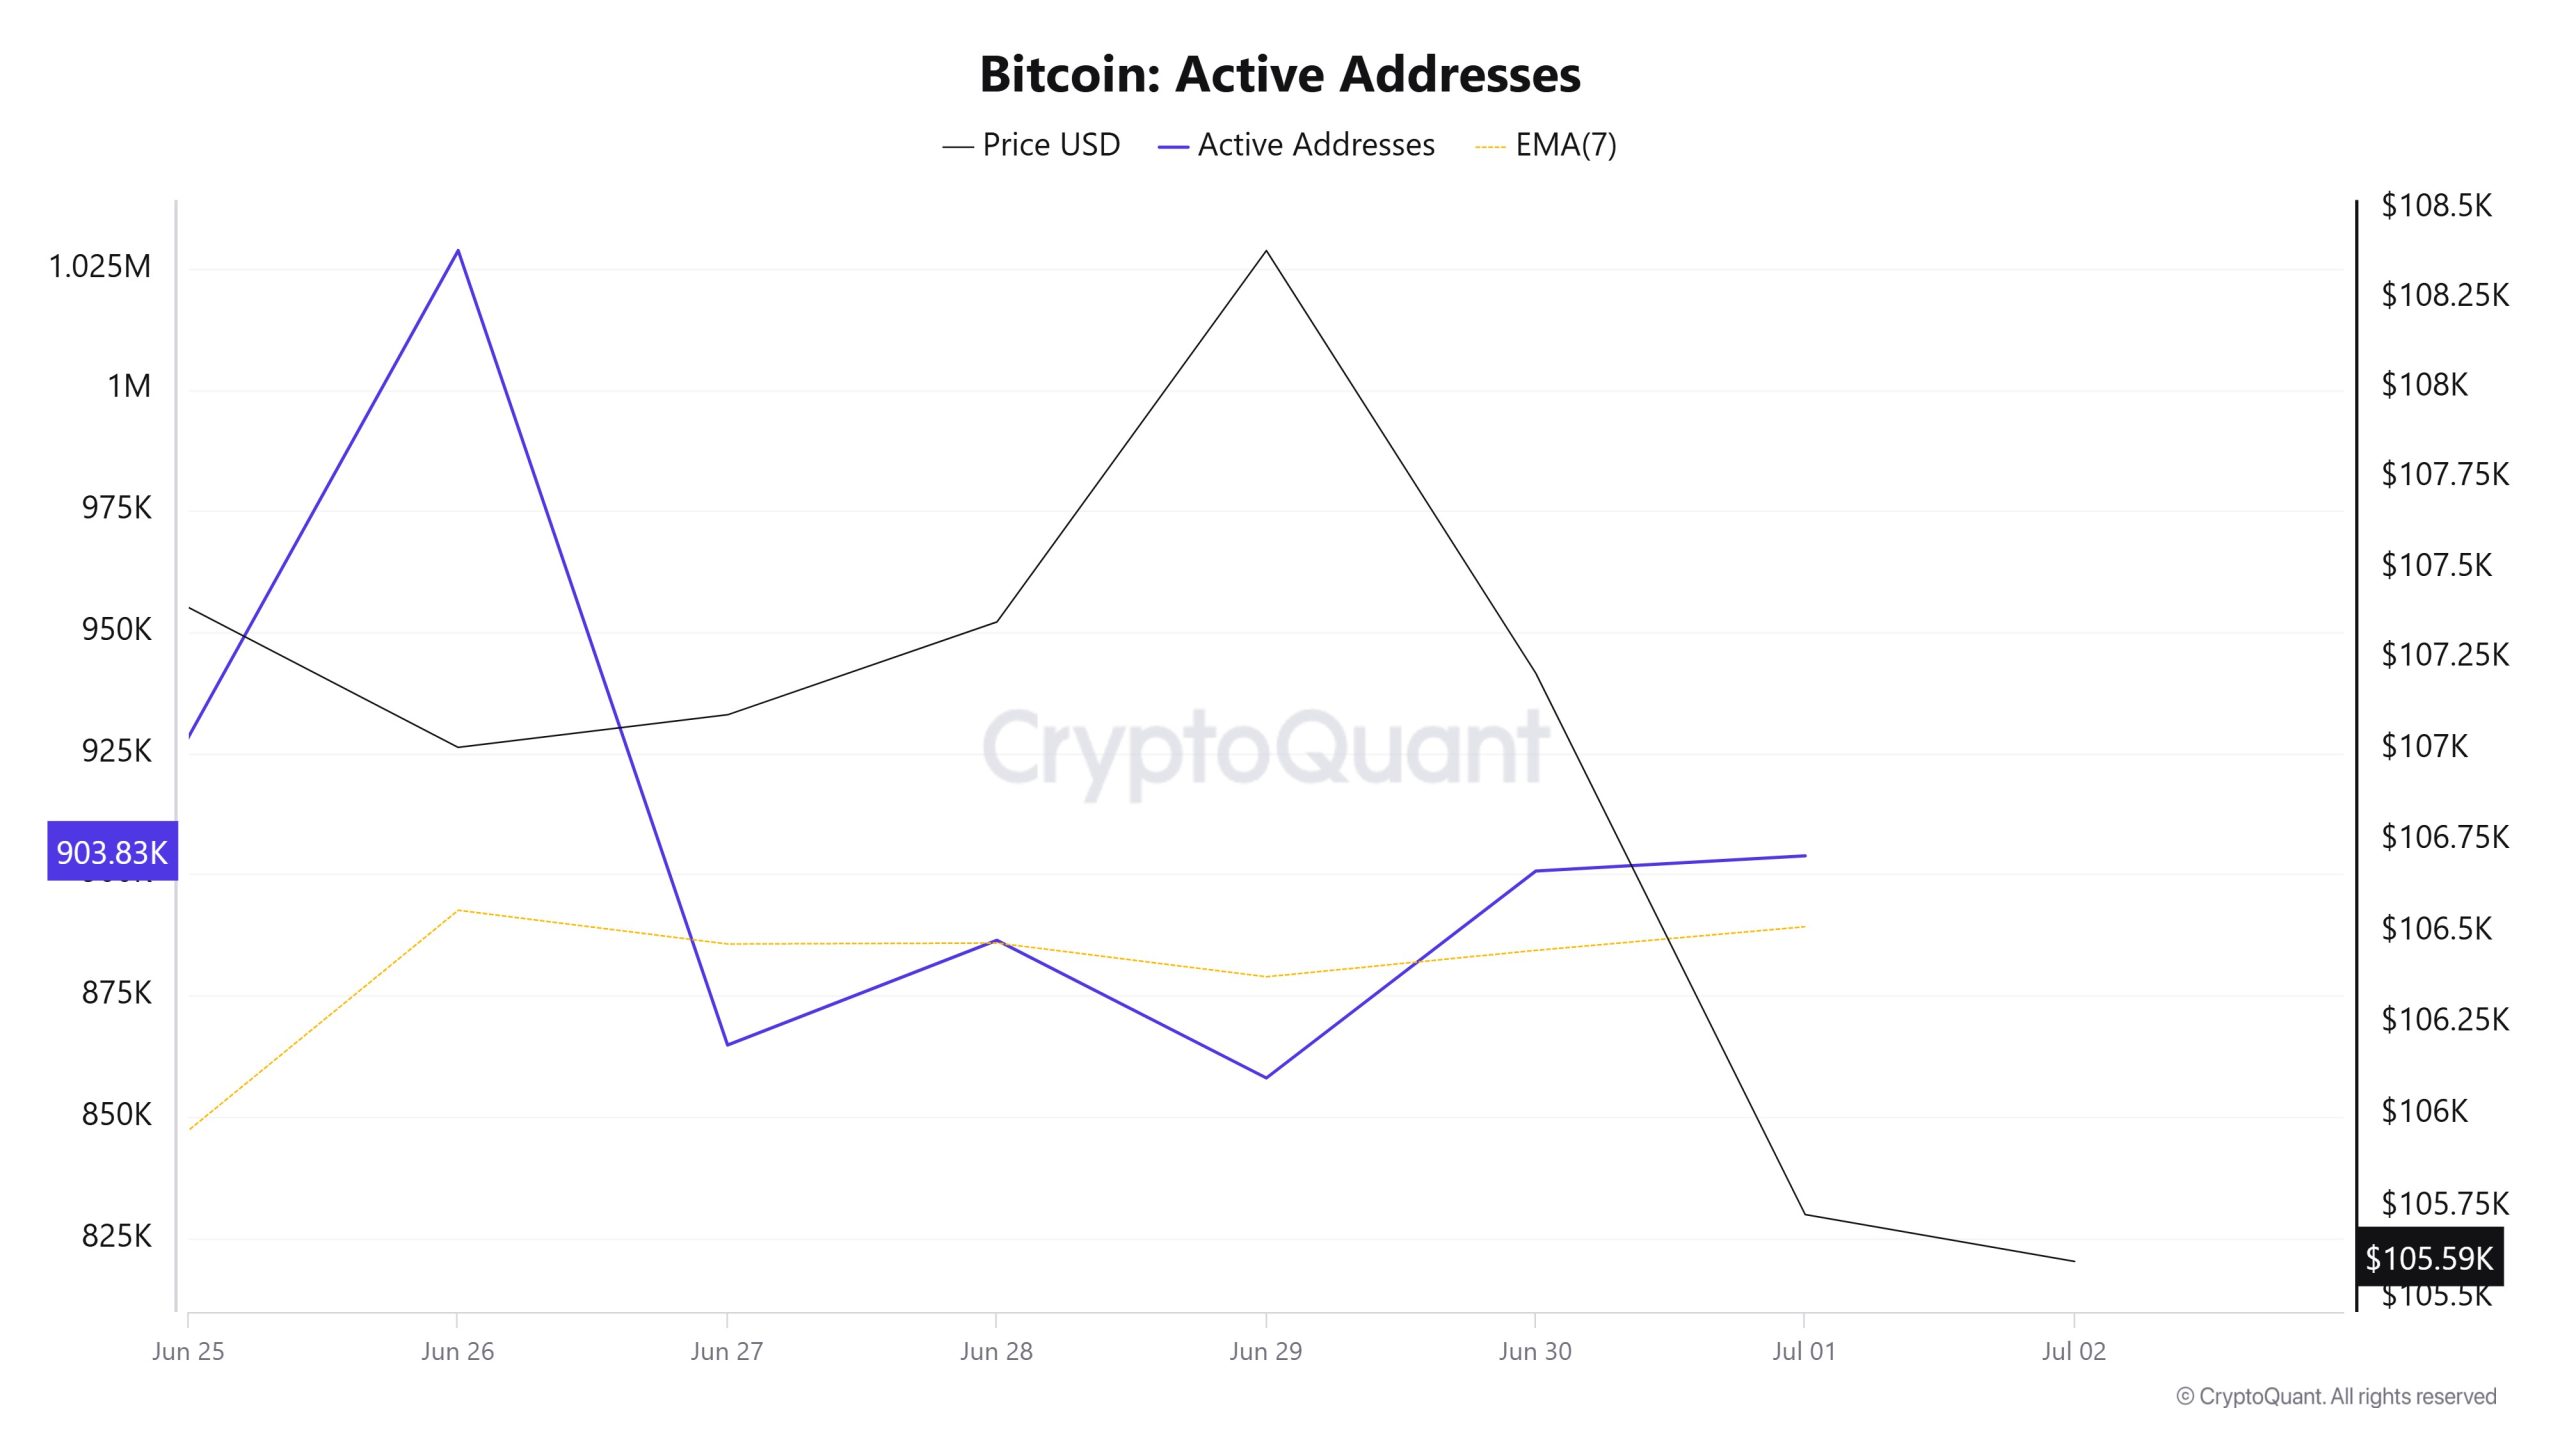
Between Giugno 25 and Luglio 2, 1,028,725 active addresses were added to the Bitcoin network. During this time, the Bitcoin price rose as high as $108,000. On Giugno 29, there was a drop in the number of active addresses, while Bitcoin saw an increase of $108,000. When the 7-day simple moving average (SMA) is analyzed, it is observed that the price follows a downward trend on the dates when this average crosses the price. This indicates that buying pressure is weakening.
Indirizzi di invio attivi
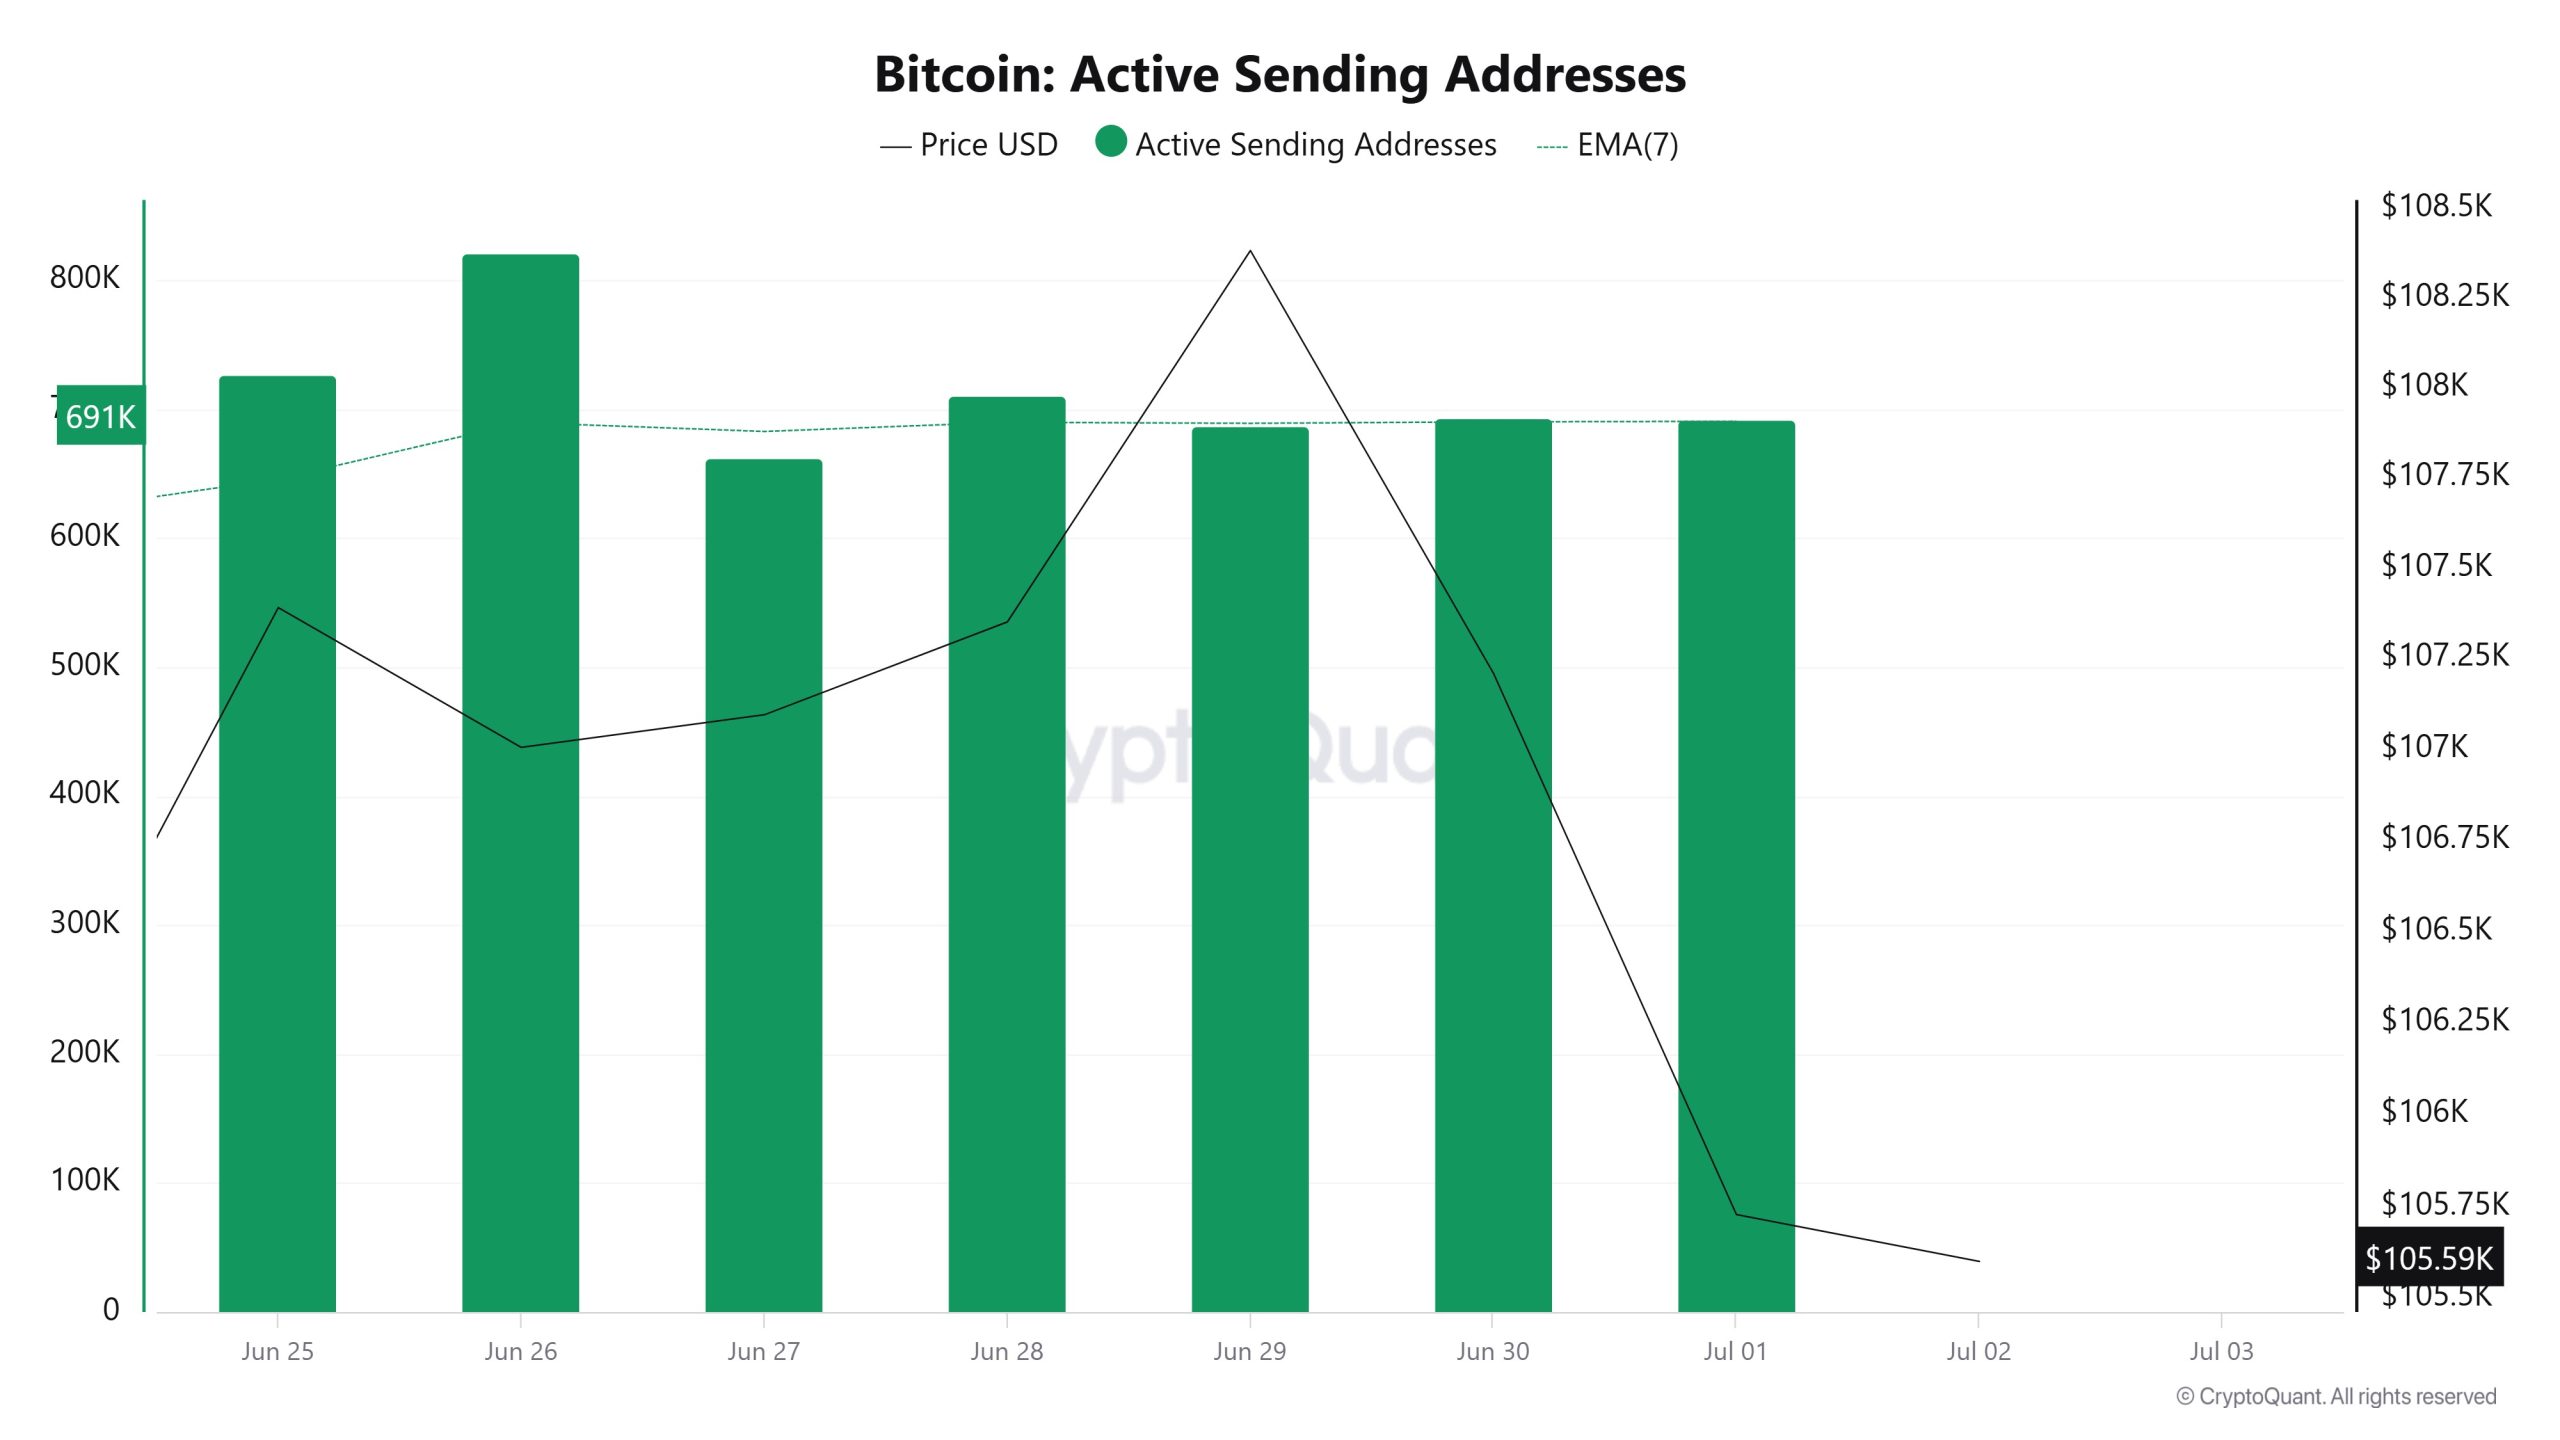
Between Giugno 25 and Luglio 2, there was a sideways movement in active shipping addresses. On the day of the price high, active sending addresses rose as high as 686,698, indicating that Bitcoin active address inflows were considering the $108,000 level. As a result, the ‘Active Sending Addresses’ metric was generally flat
Indirizzi di ricezione attivi
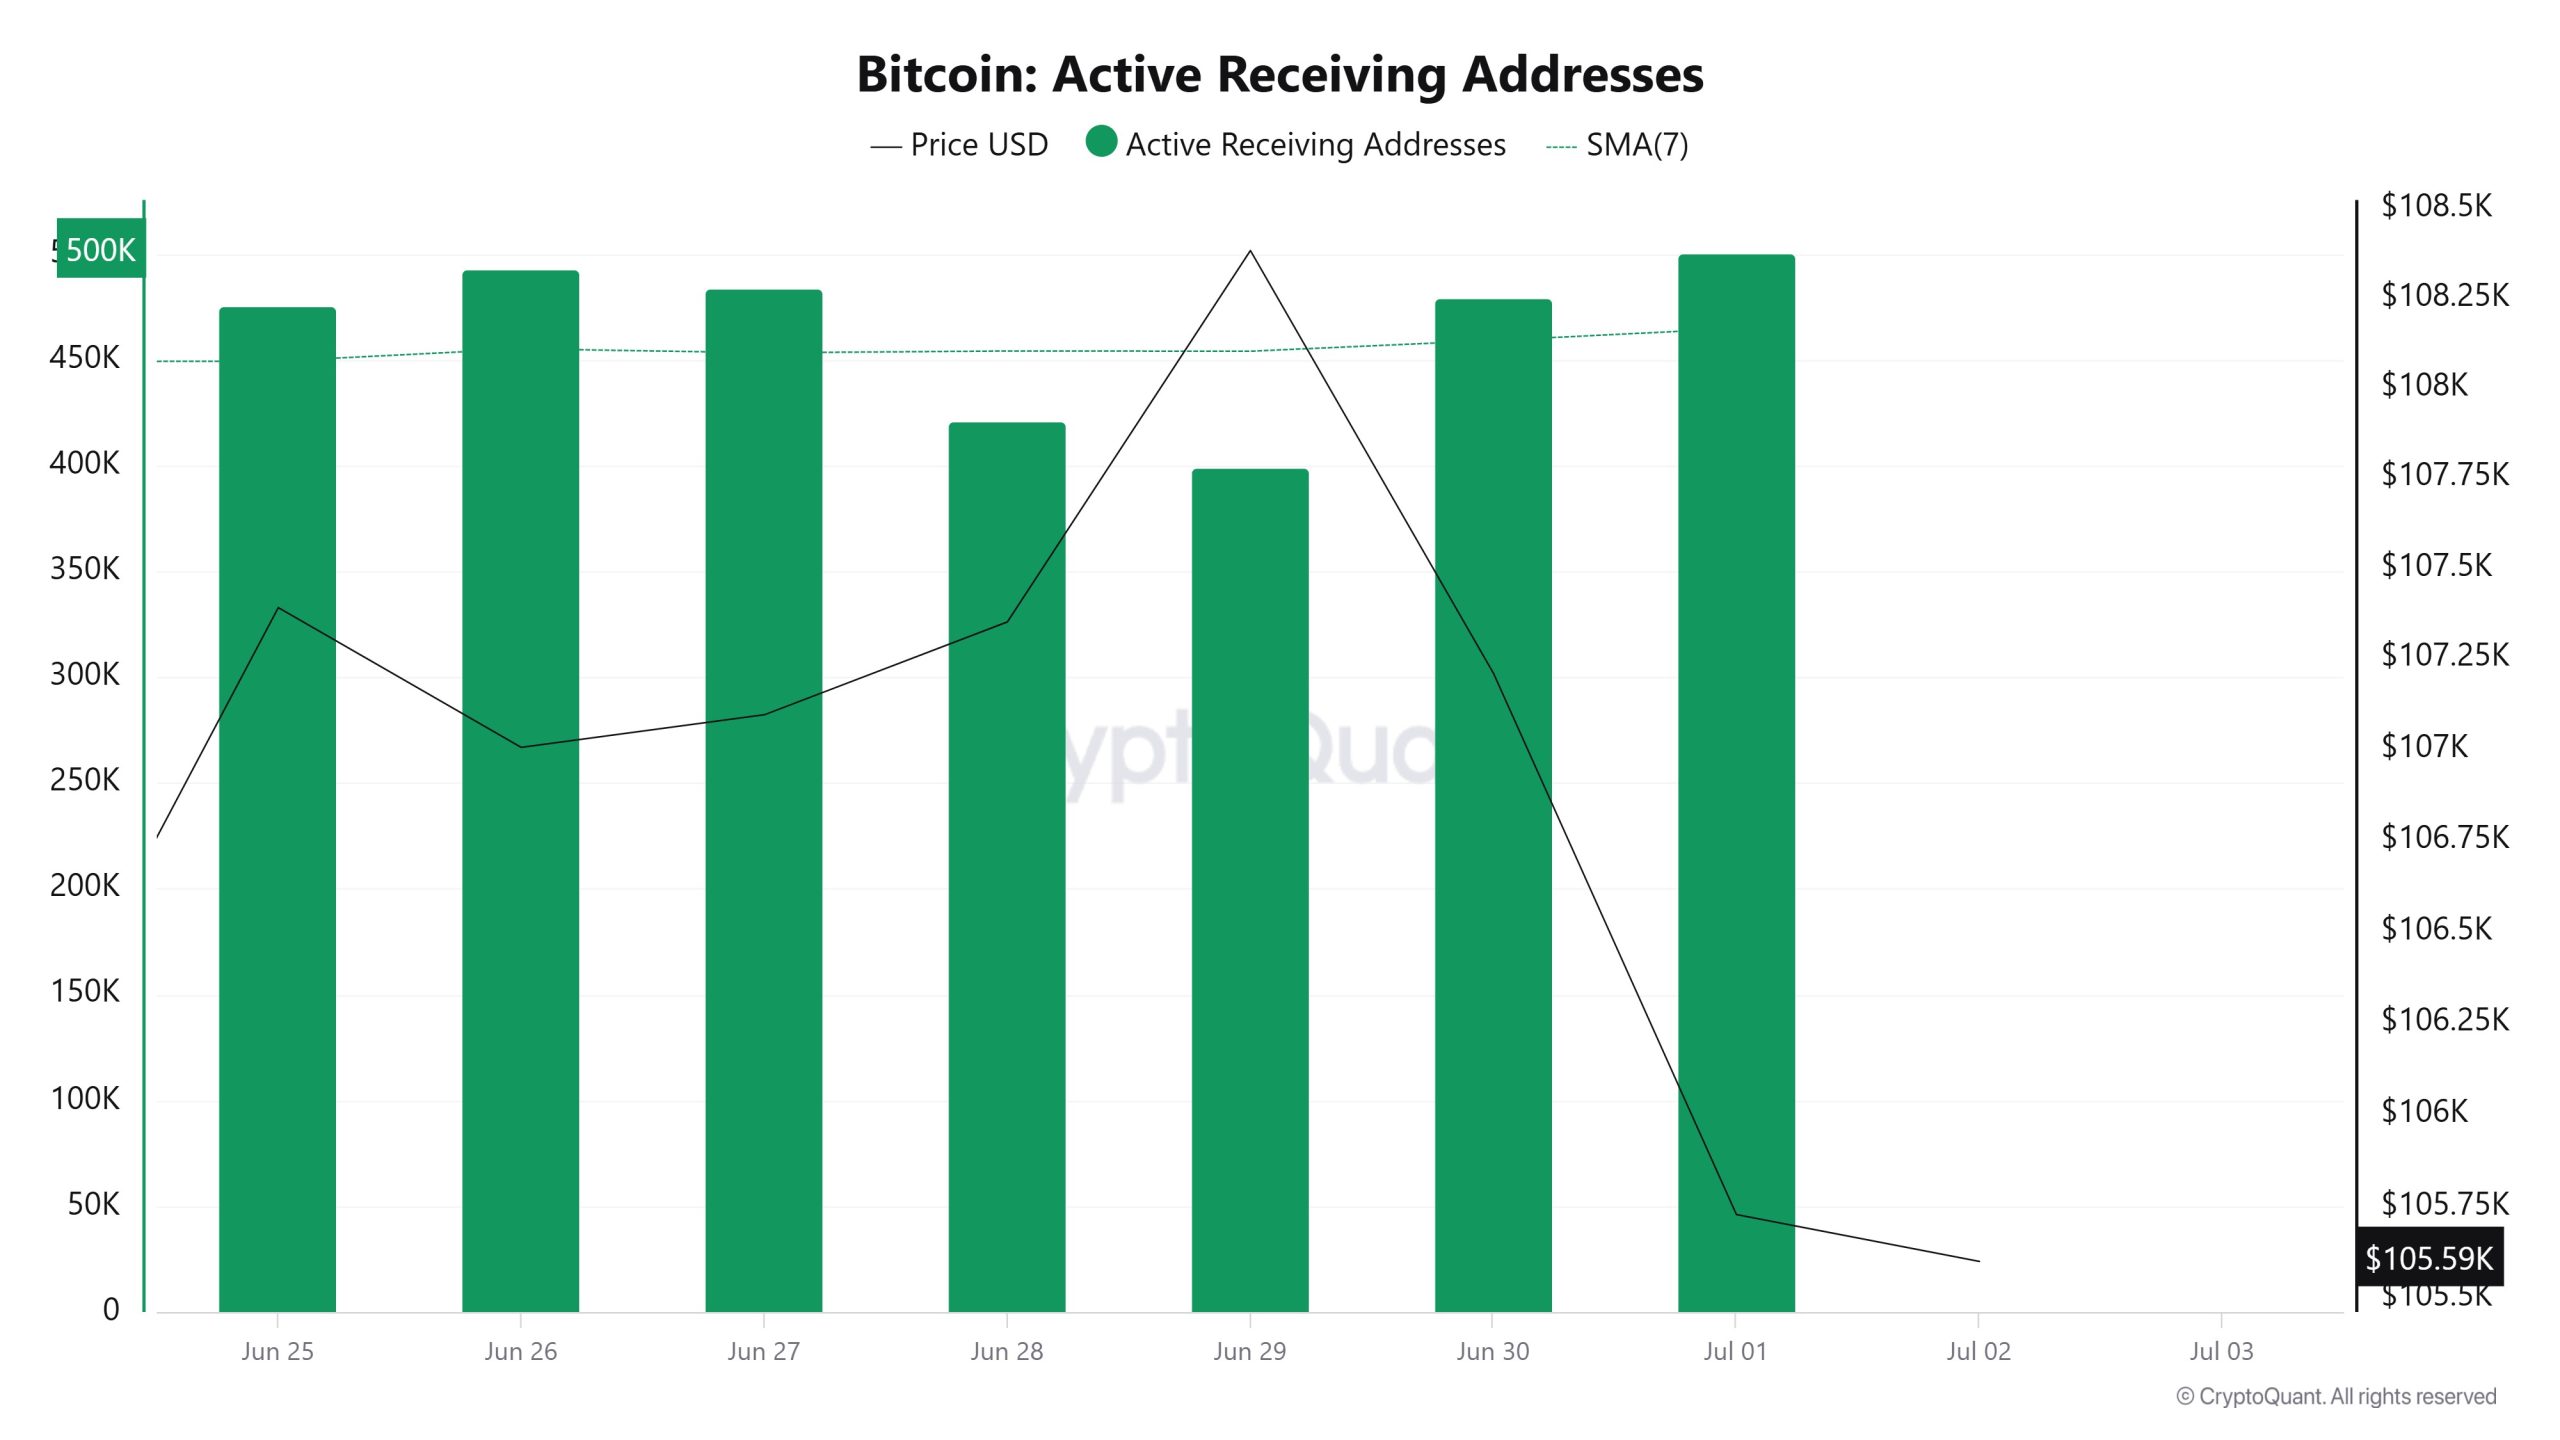
Between Giugno 25th and Luglio 2nd, there was a regular rise in active buying addresses with the Black Line (price line). On the day when the price reached a high level, active receiving addresses rose to 461,021 levels; It shows that buyers bought Bitcoin at $108,000 levels.
Guasti
MRVR
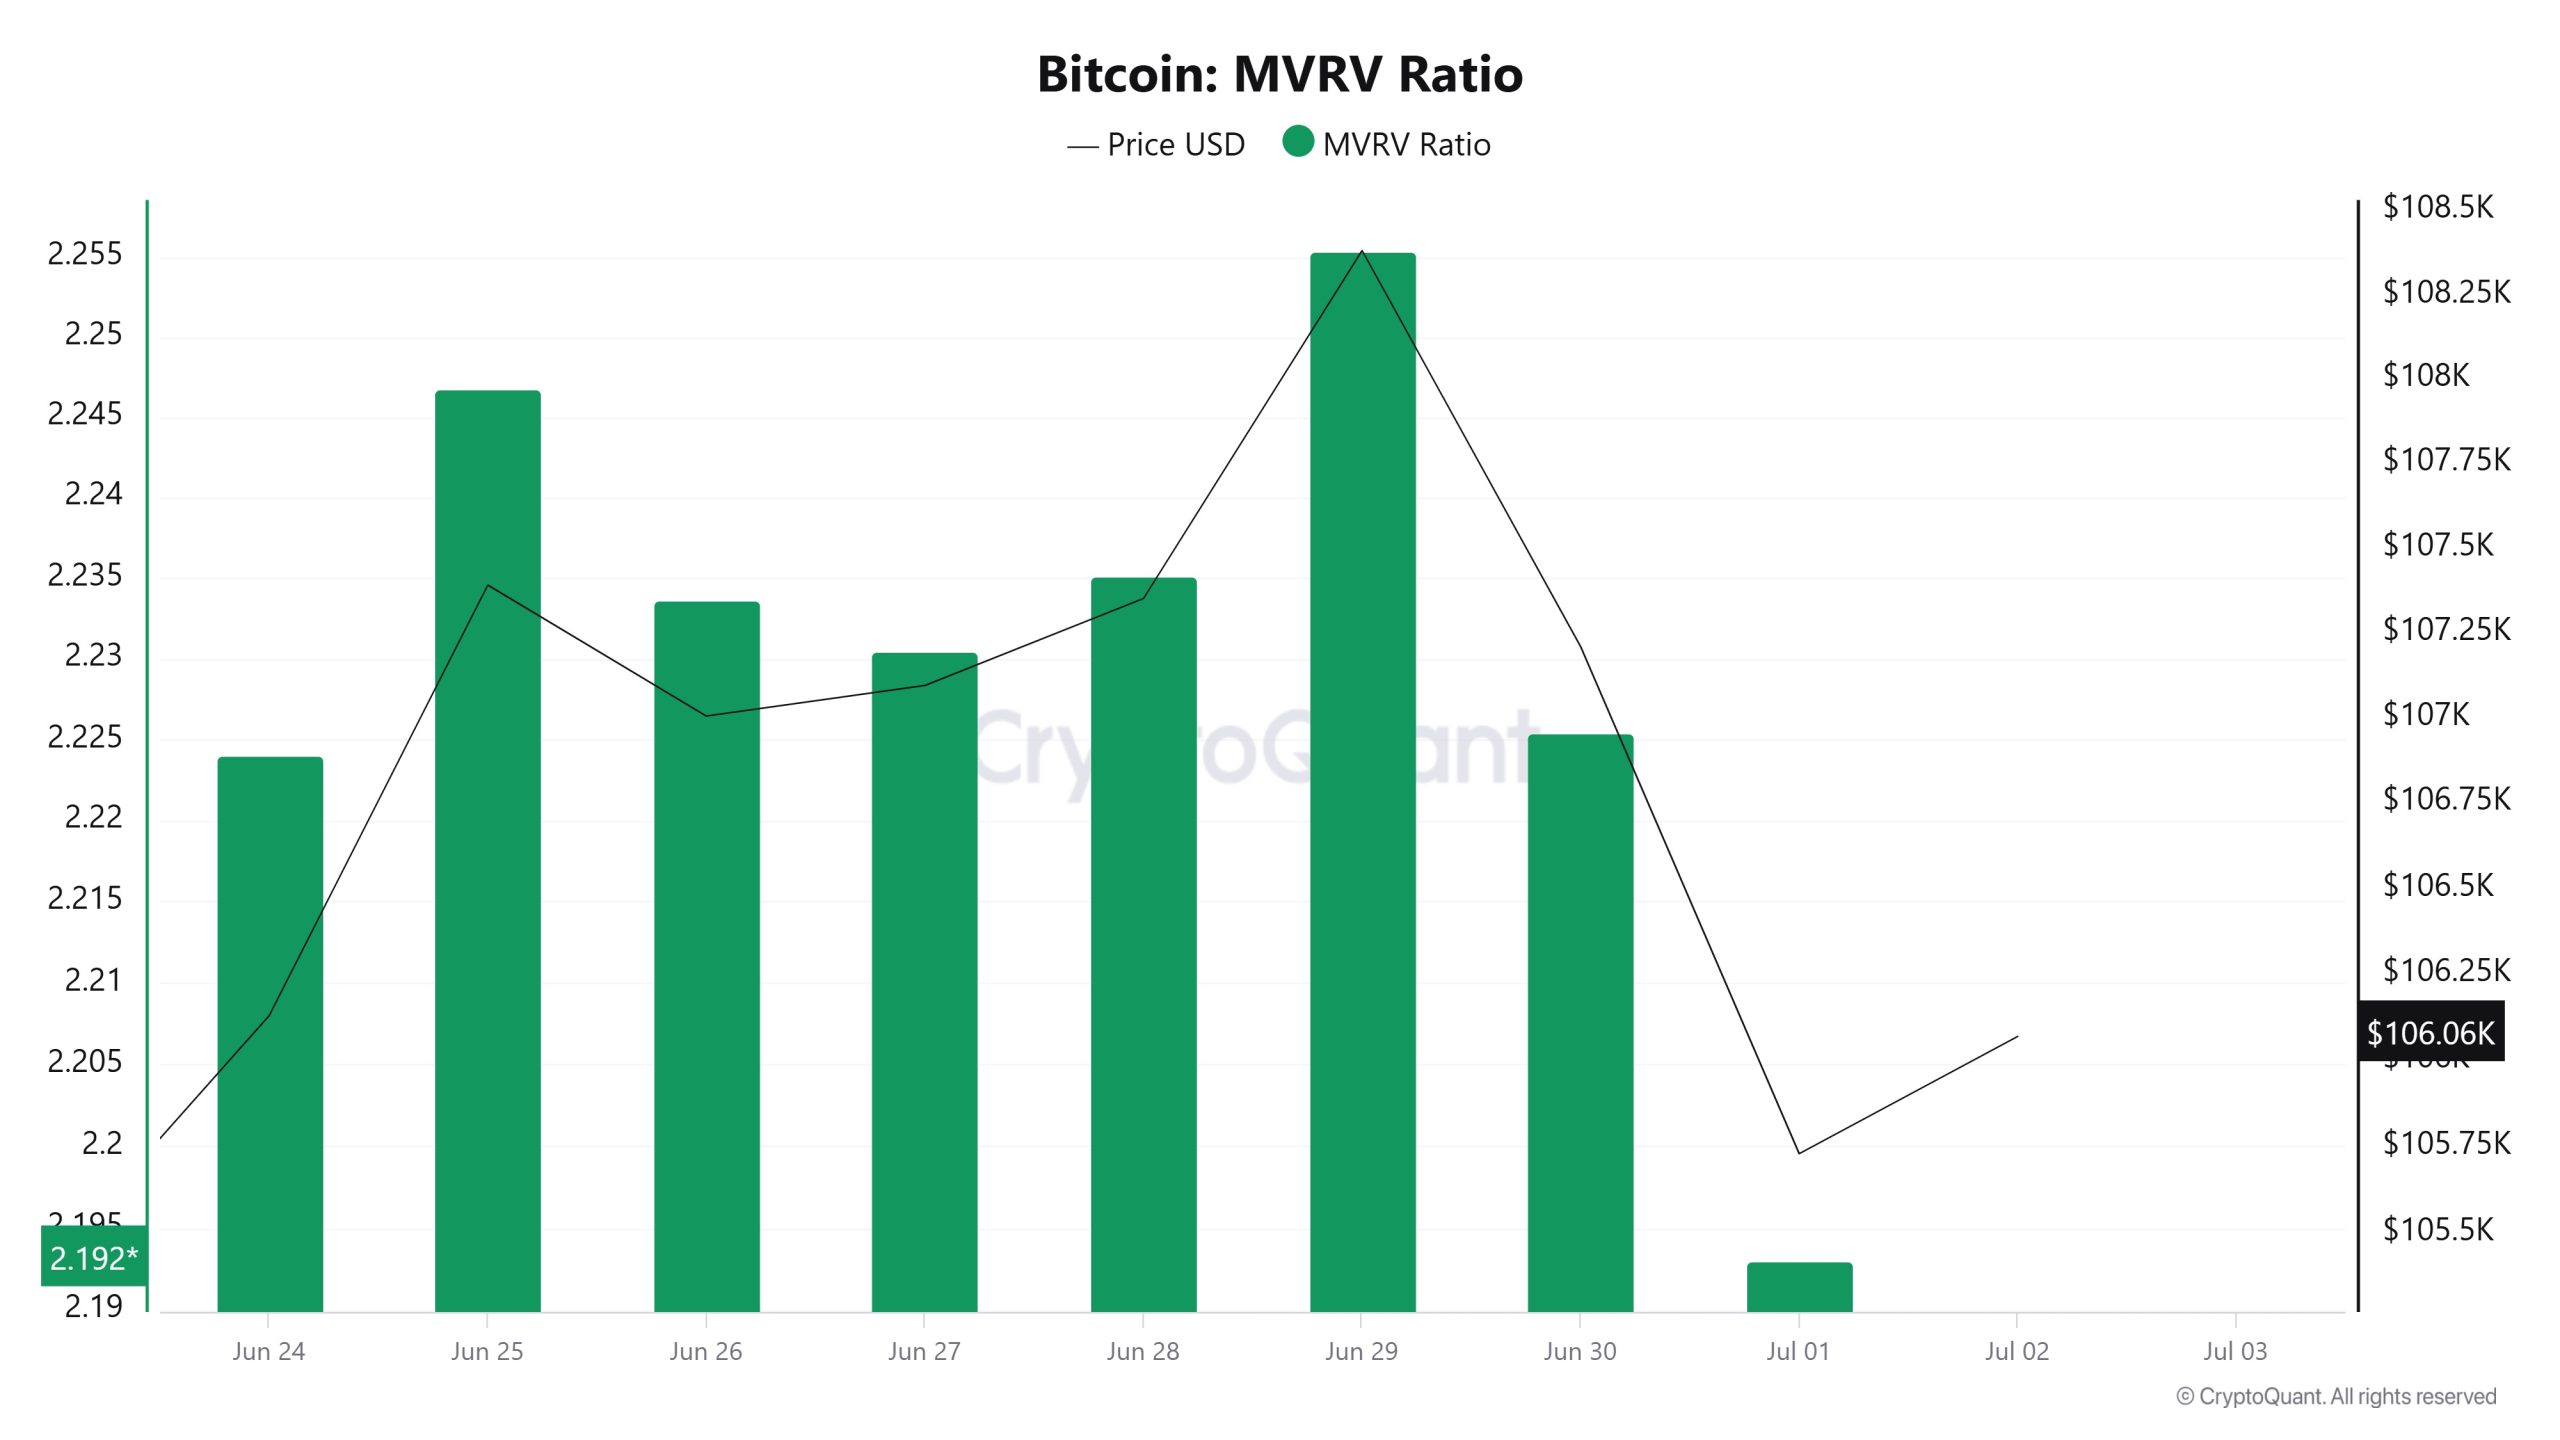
On Giugno 25th, the Bitcoin price was 107,390 while the MVRV Ratio was 2.246. As of Luglio 1, the Bitcoin price fell 1.55% to 105,727, while the MVRV Ratio fell 2.40% to 2,192.
Prezzo realizzato
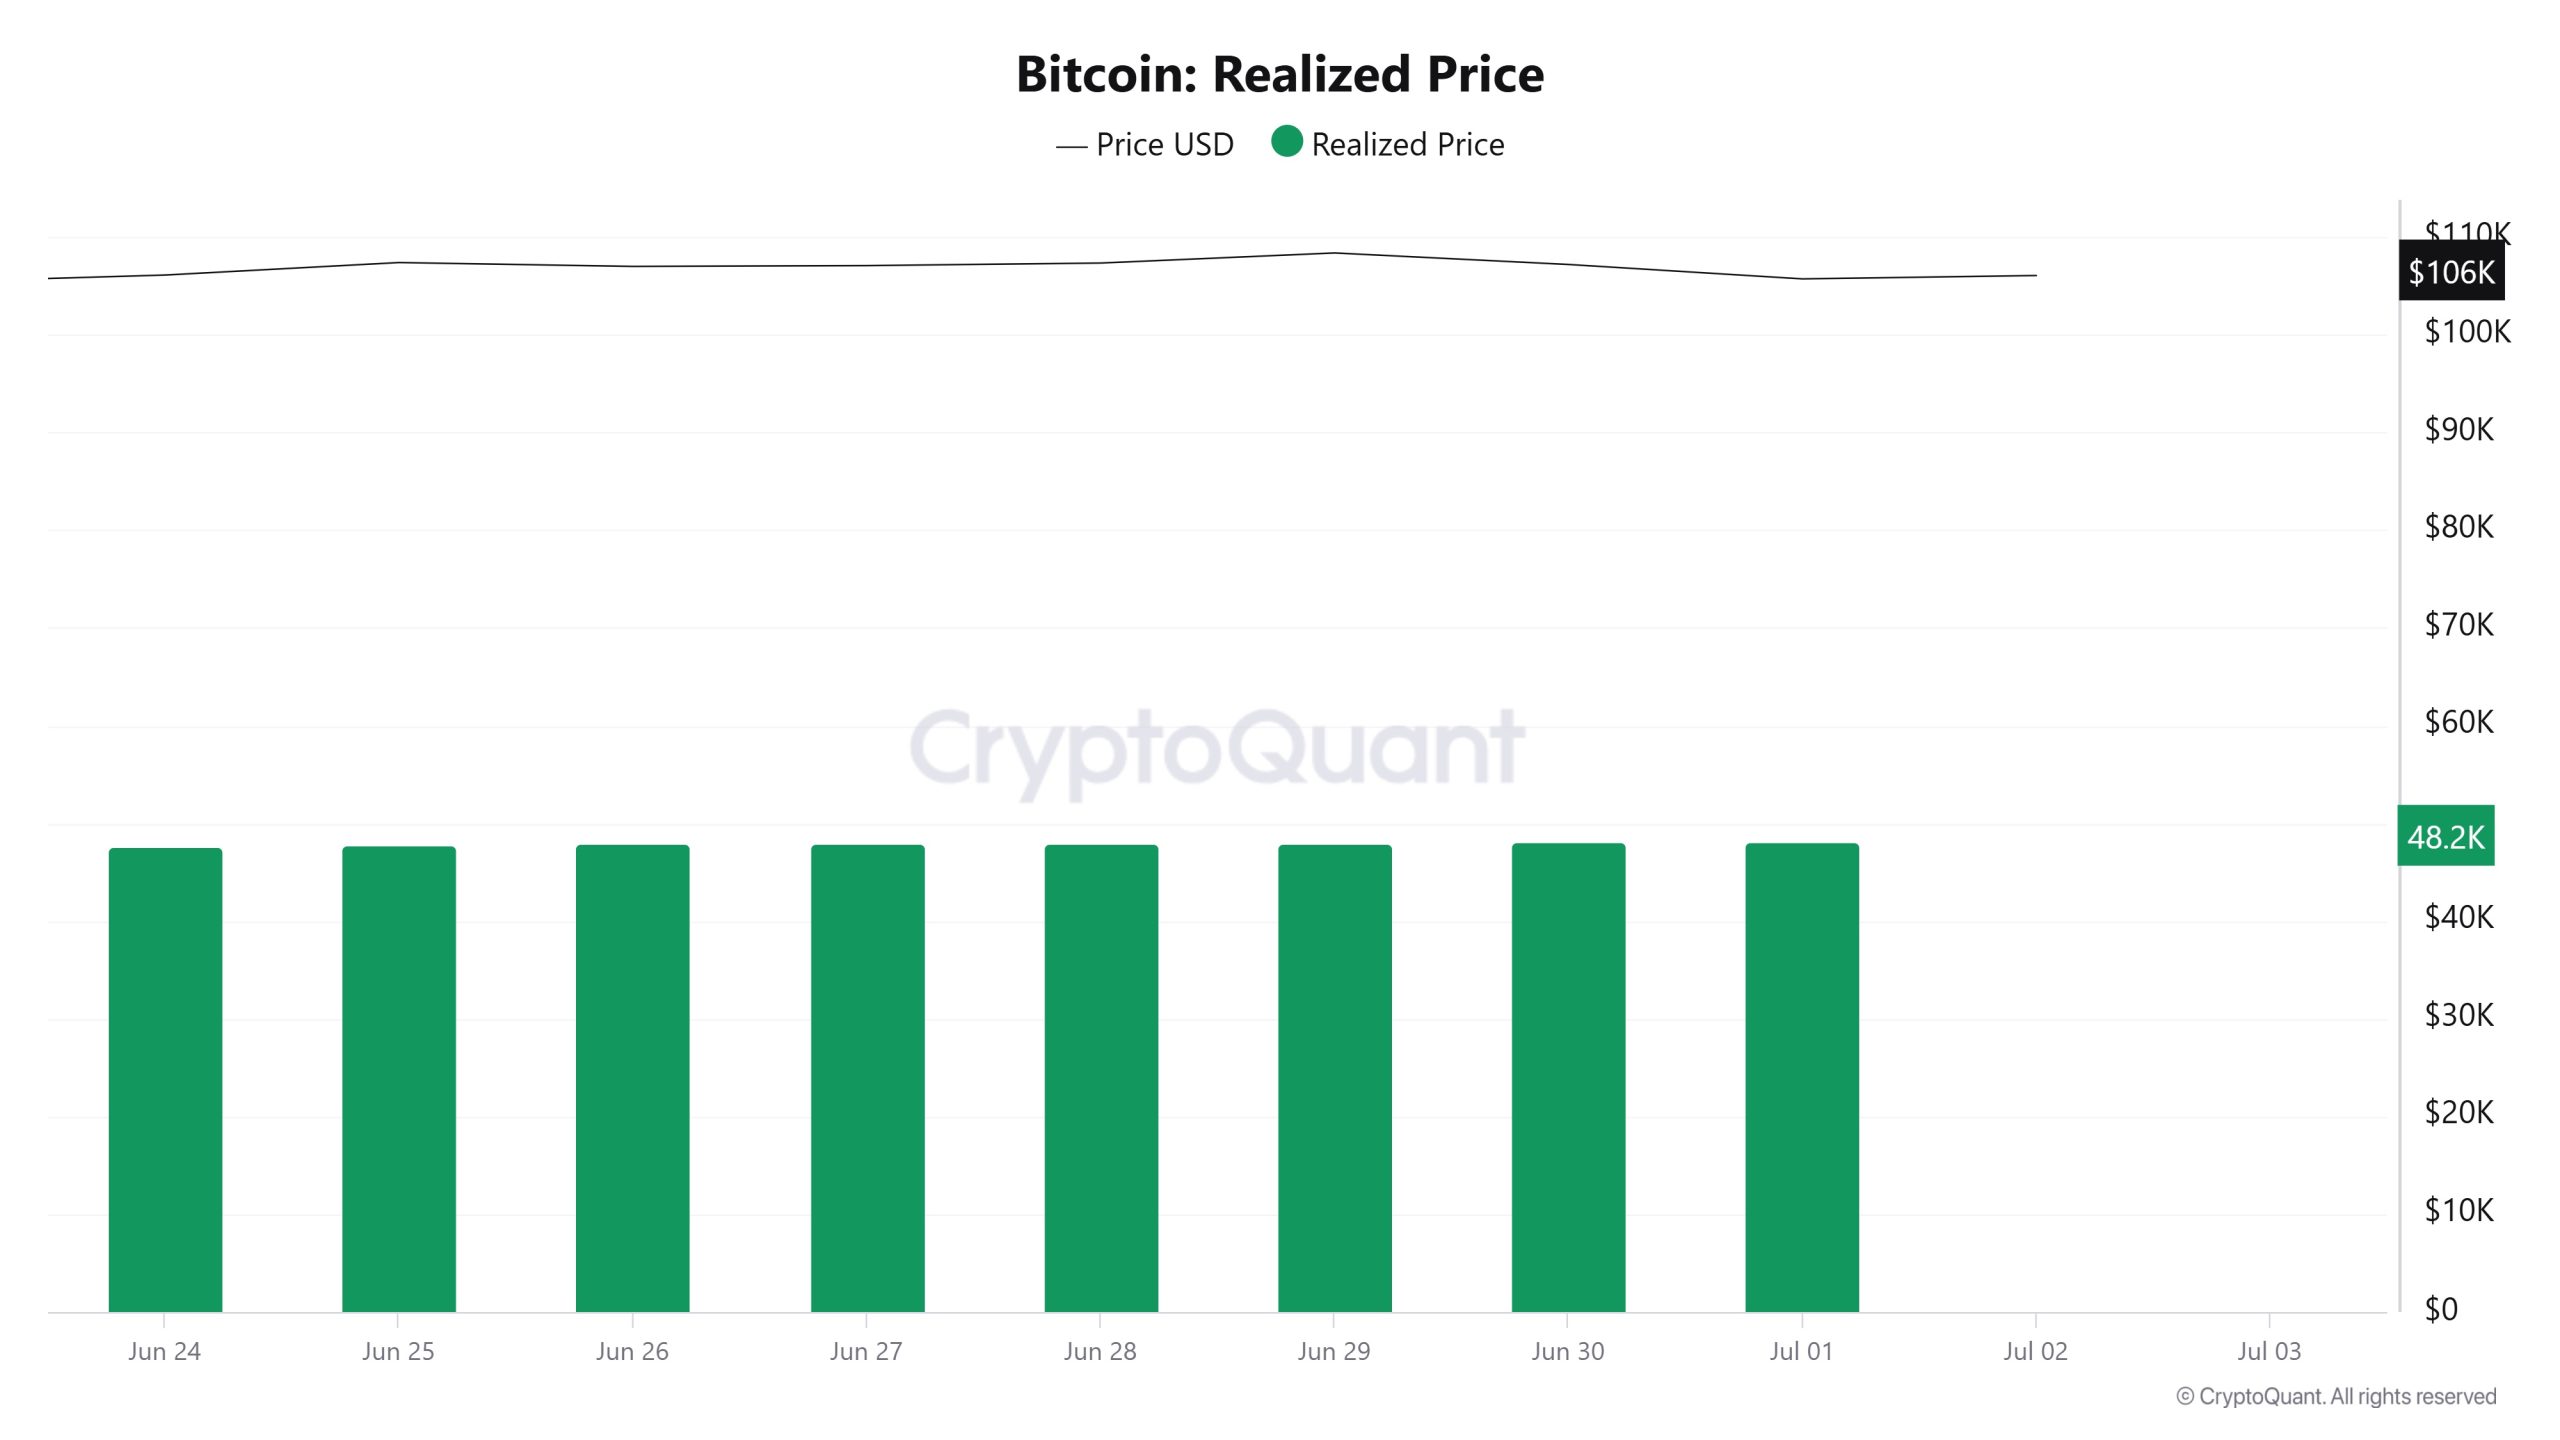
On Giugno 25th, Bitcoin price was 107,390 while Realized Price was 47,797. As of Luglio 1, the Bitcoin price decreased by 1.55% to 105,727, while the Realized Price increased by 0.86% to 48,211.
Rapporto di profitto della produzione speso (SOPR)
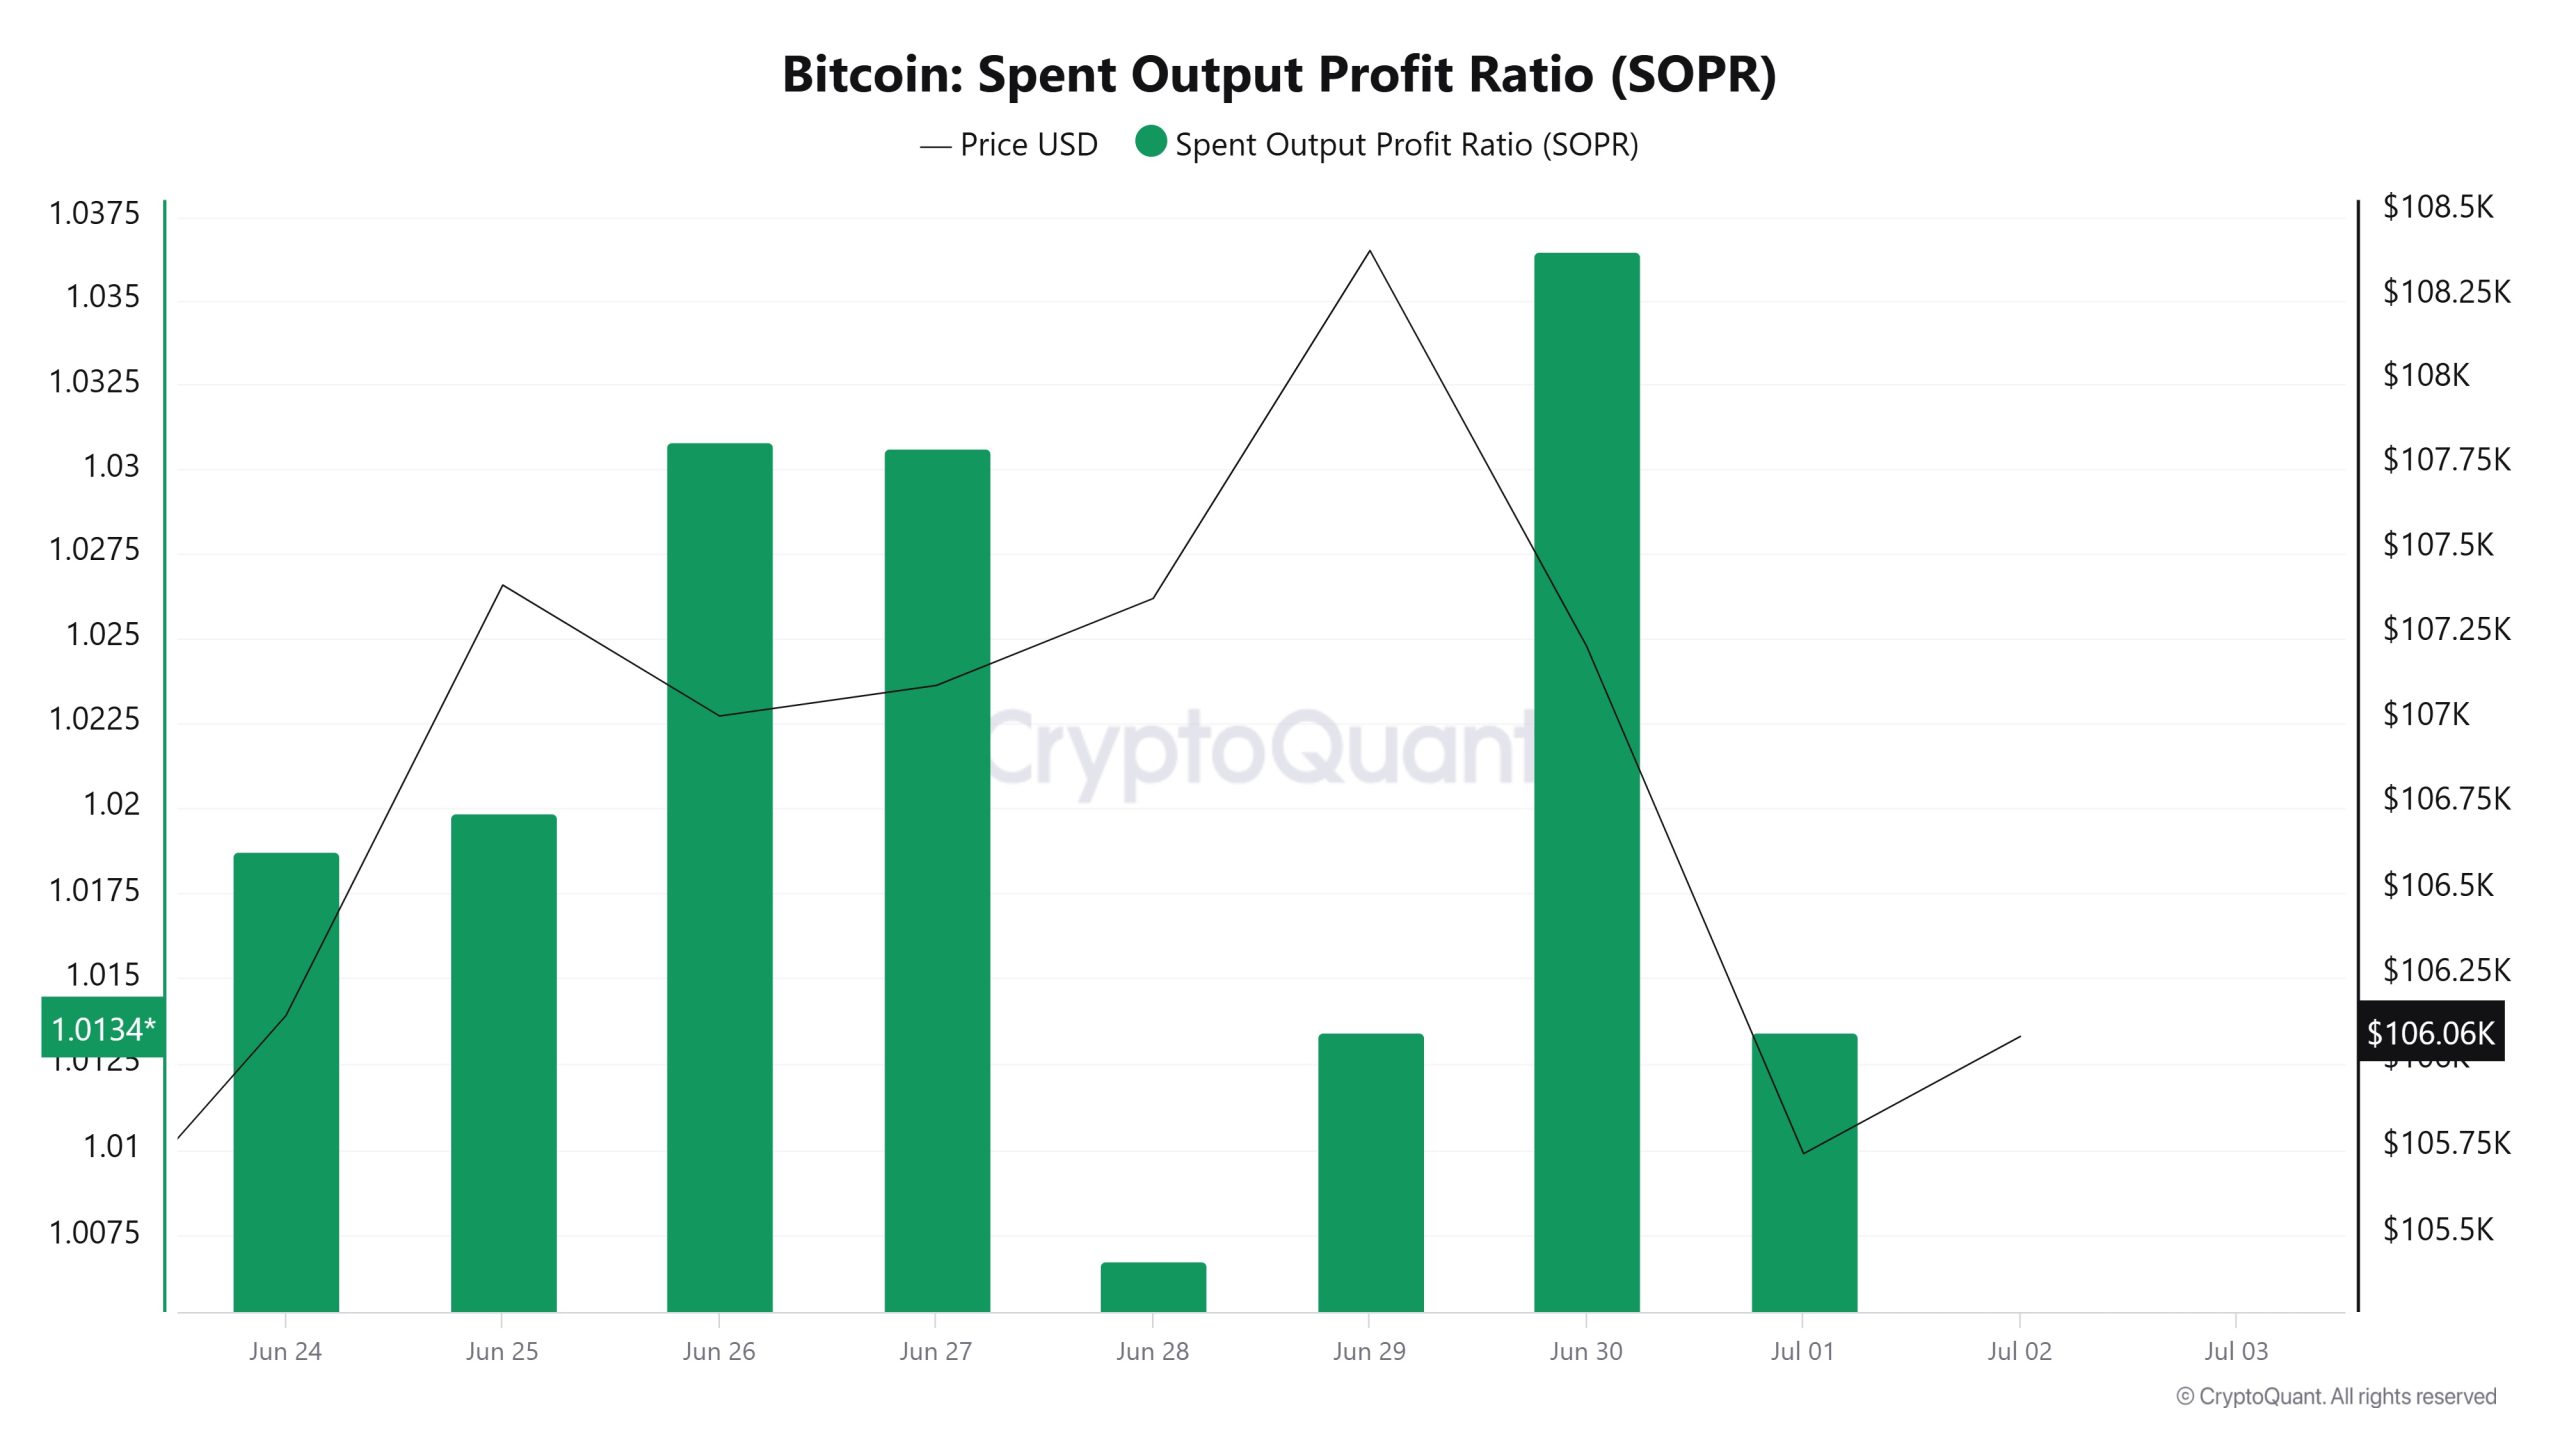
On Giugno 25, the Bitcoin price was at 107,390 while the SOPR metric was at 1,019. As of Luglio 1, the Bitcoin price fell 1.55% to 105,727, while the SOPR metric decreased 0.58% to 1,013.
Derivati
Interesse aperto
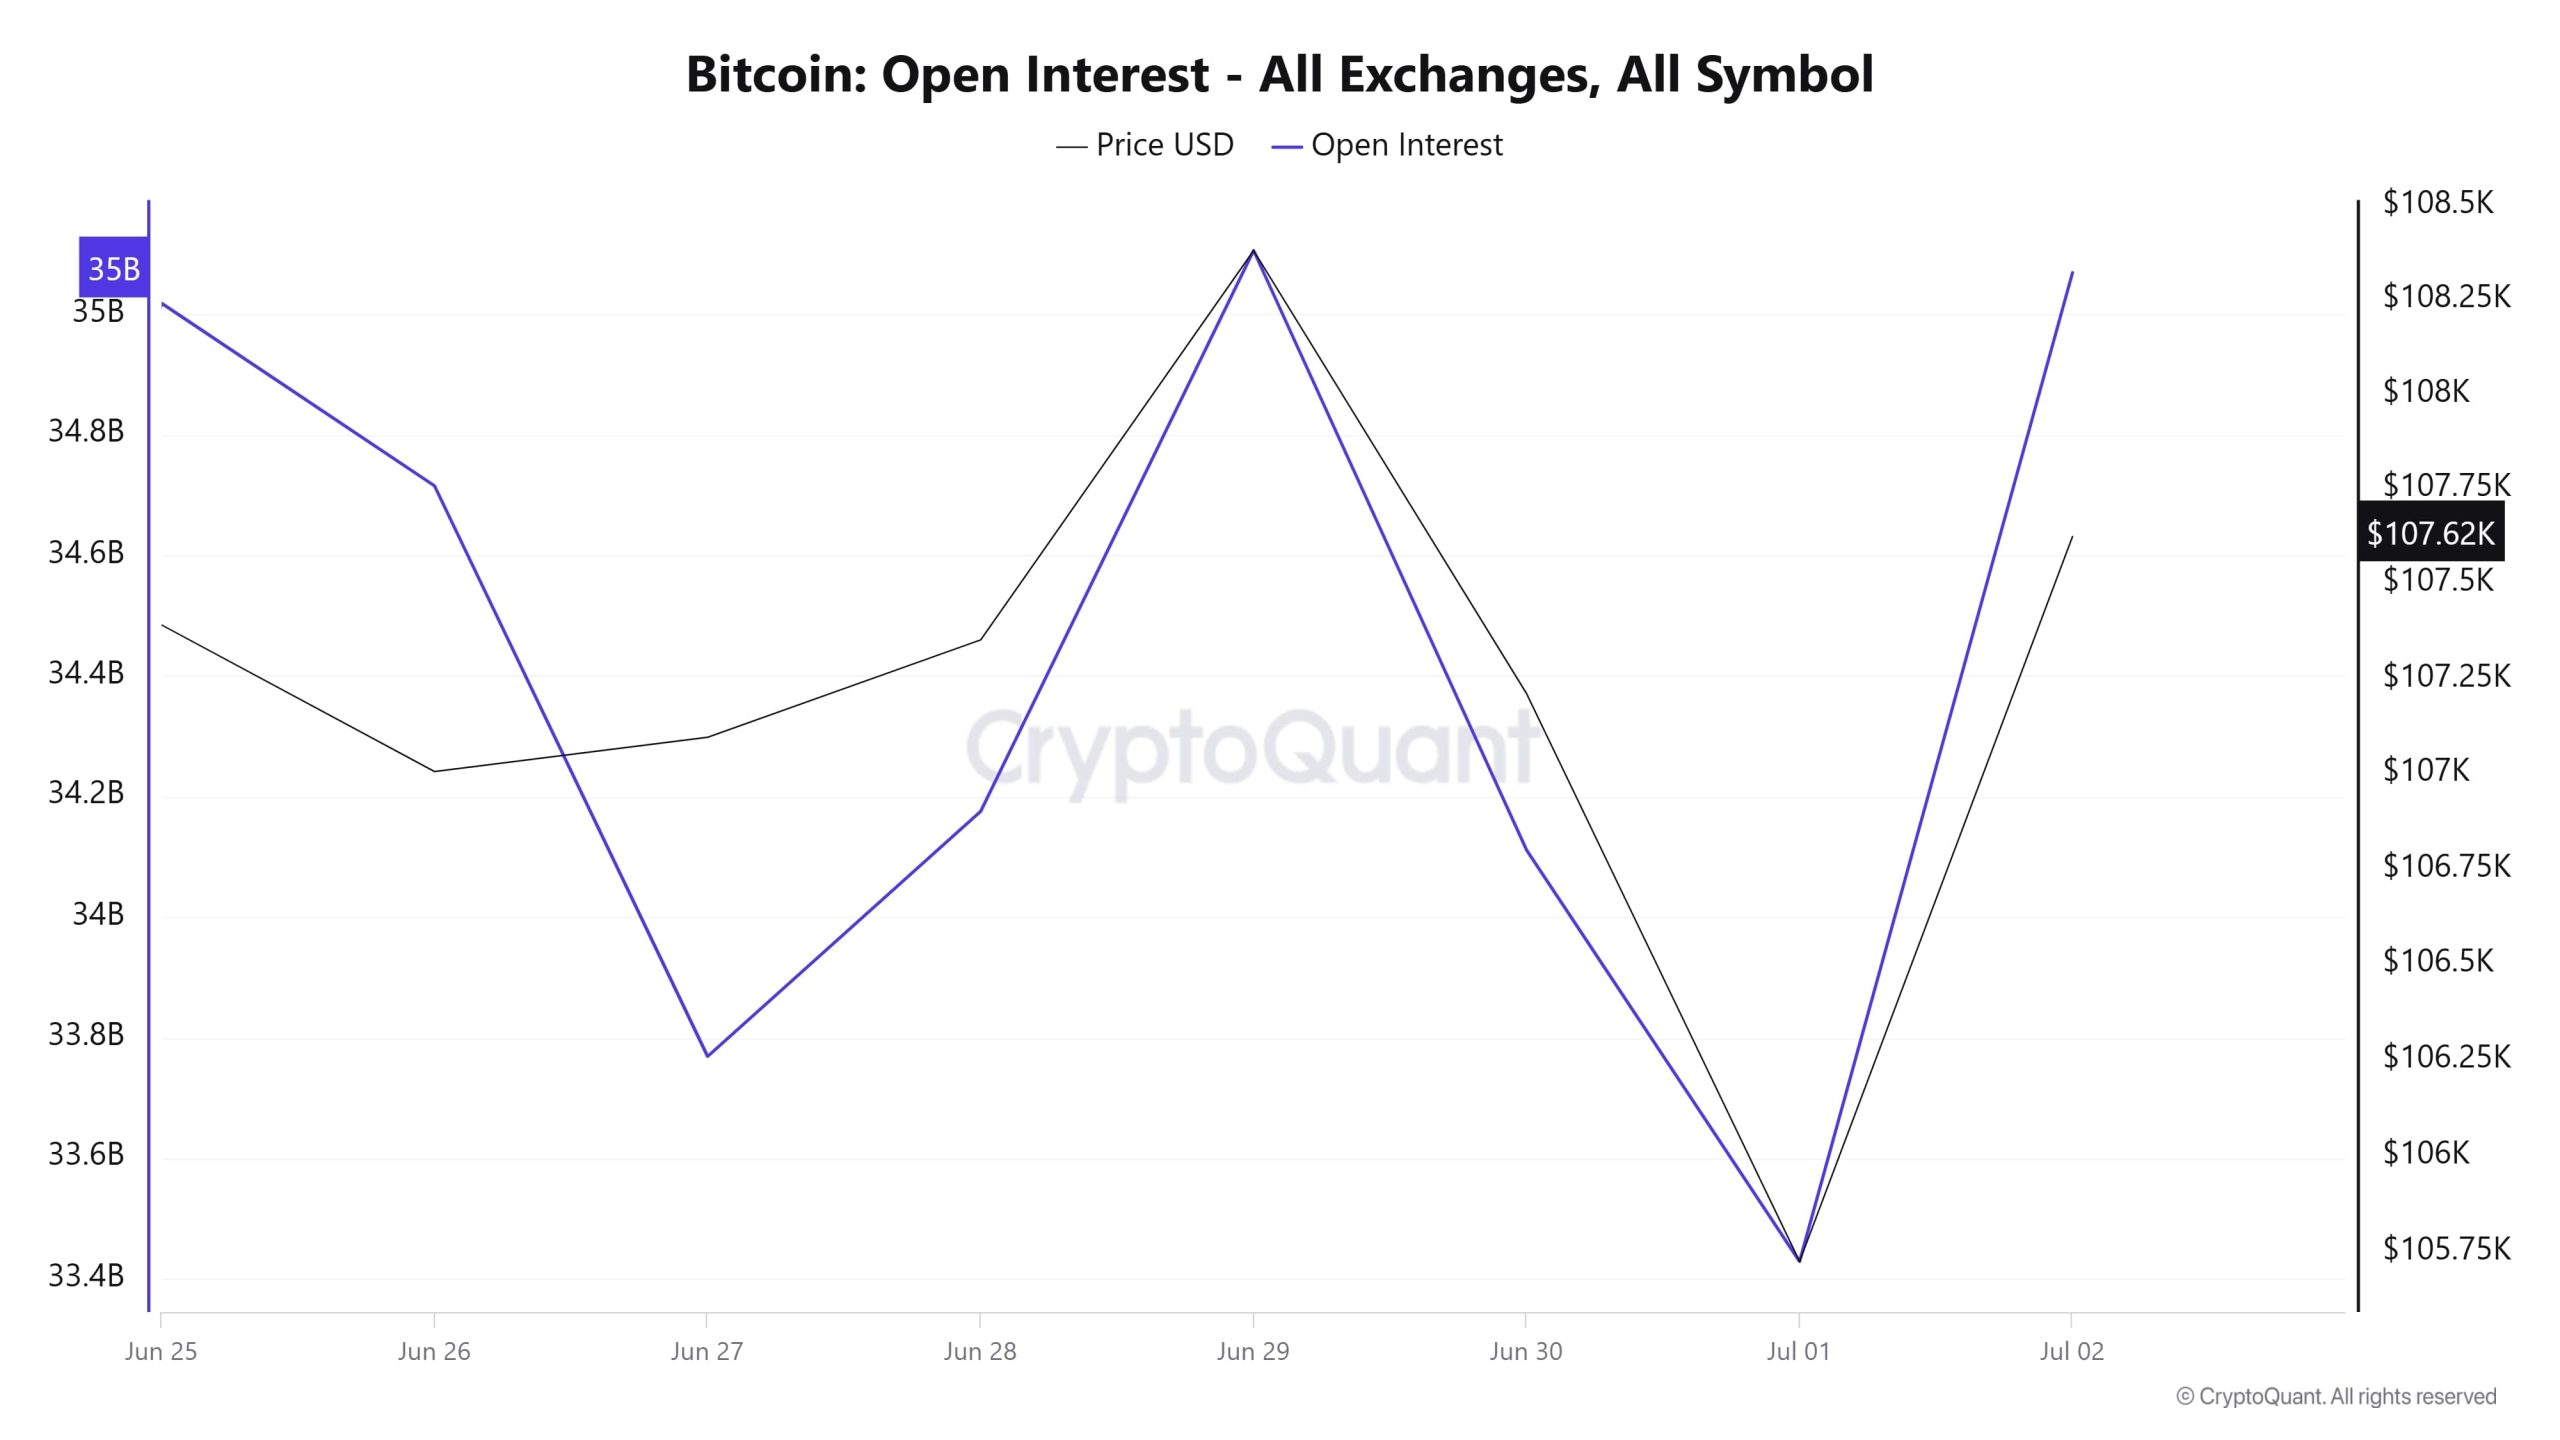
Bitcoin futures have been quite volatile in recent days, both in terms of price and open interest. On Giugno 25, open interest was at $35 billion, but it gradually declined in the following days to $33.8 billion on Giugno 27. In the same period, the price also moved downwards, indicating that positions were closed and risk appetite decreased.
As of Giugno 28, this situation quickly reversed. Both the price and open interest rose sharply. This sudden move suggests that the number of investors entering the market with renewed expectations has increased and that there is a serious demand, especially on the long side. However, this upward momentum did not last long. Between Giugno 30 and Luglio 1, both metrics experienced a sharp pullback. This move may indicate that the liquidations or profit realizations that followed the overheating of the market came into play. On Luglio 2, open interest rebounded, which can be read as a signal to return to the market. The price has also accompanied this. However, the sharp ups and downs seen in the last few days reveal that the market still carries high uncertainty and there is no clear picture about the direction. The fact that price and open position data move in parallel clearly shows that the market was driven by highly speculative and short-term strategies during this period.
Tasso di finanziamento
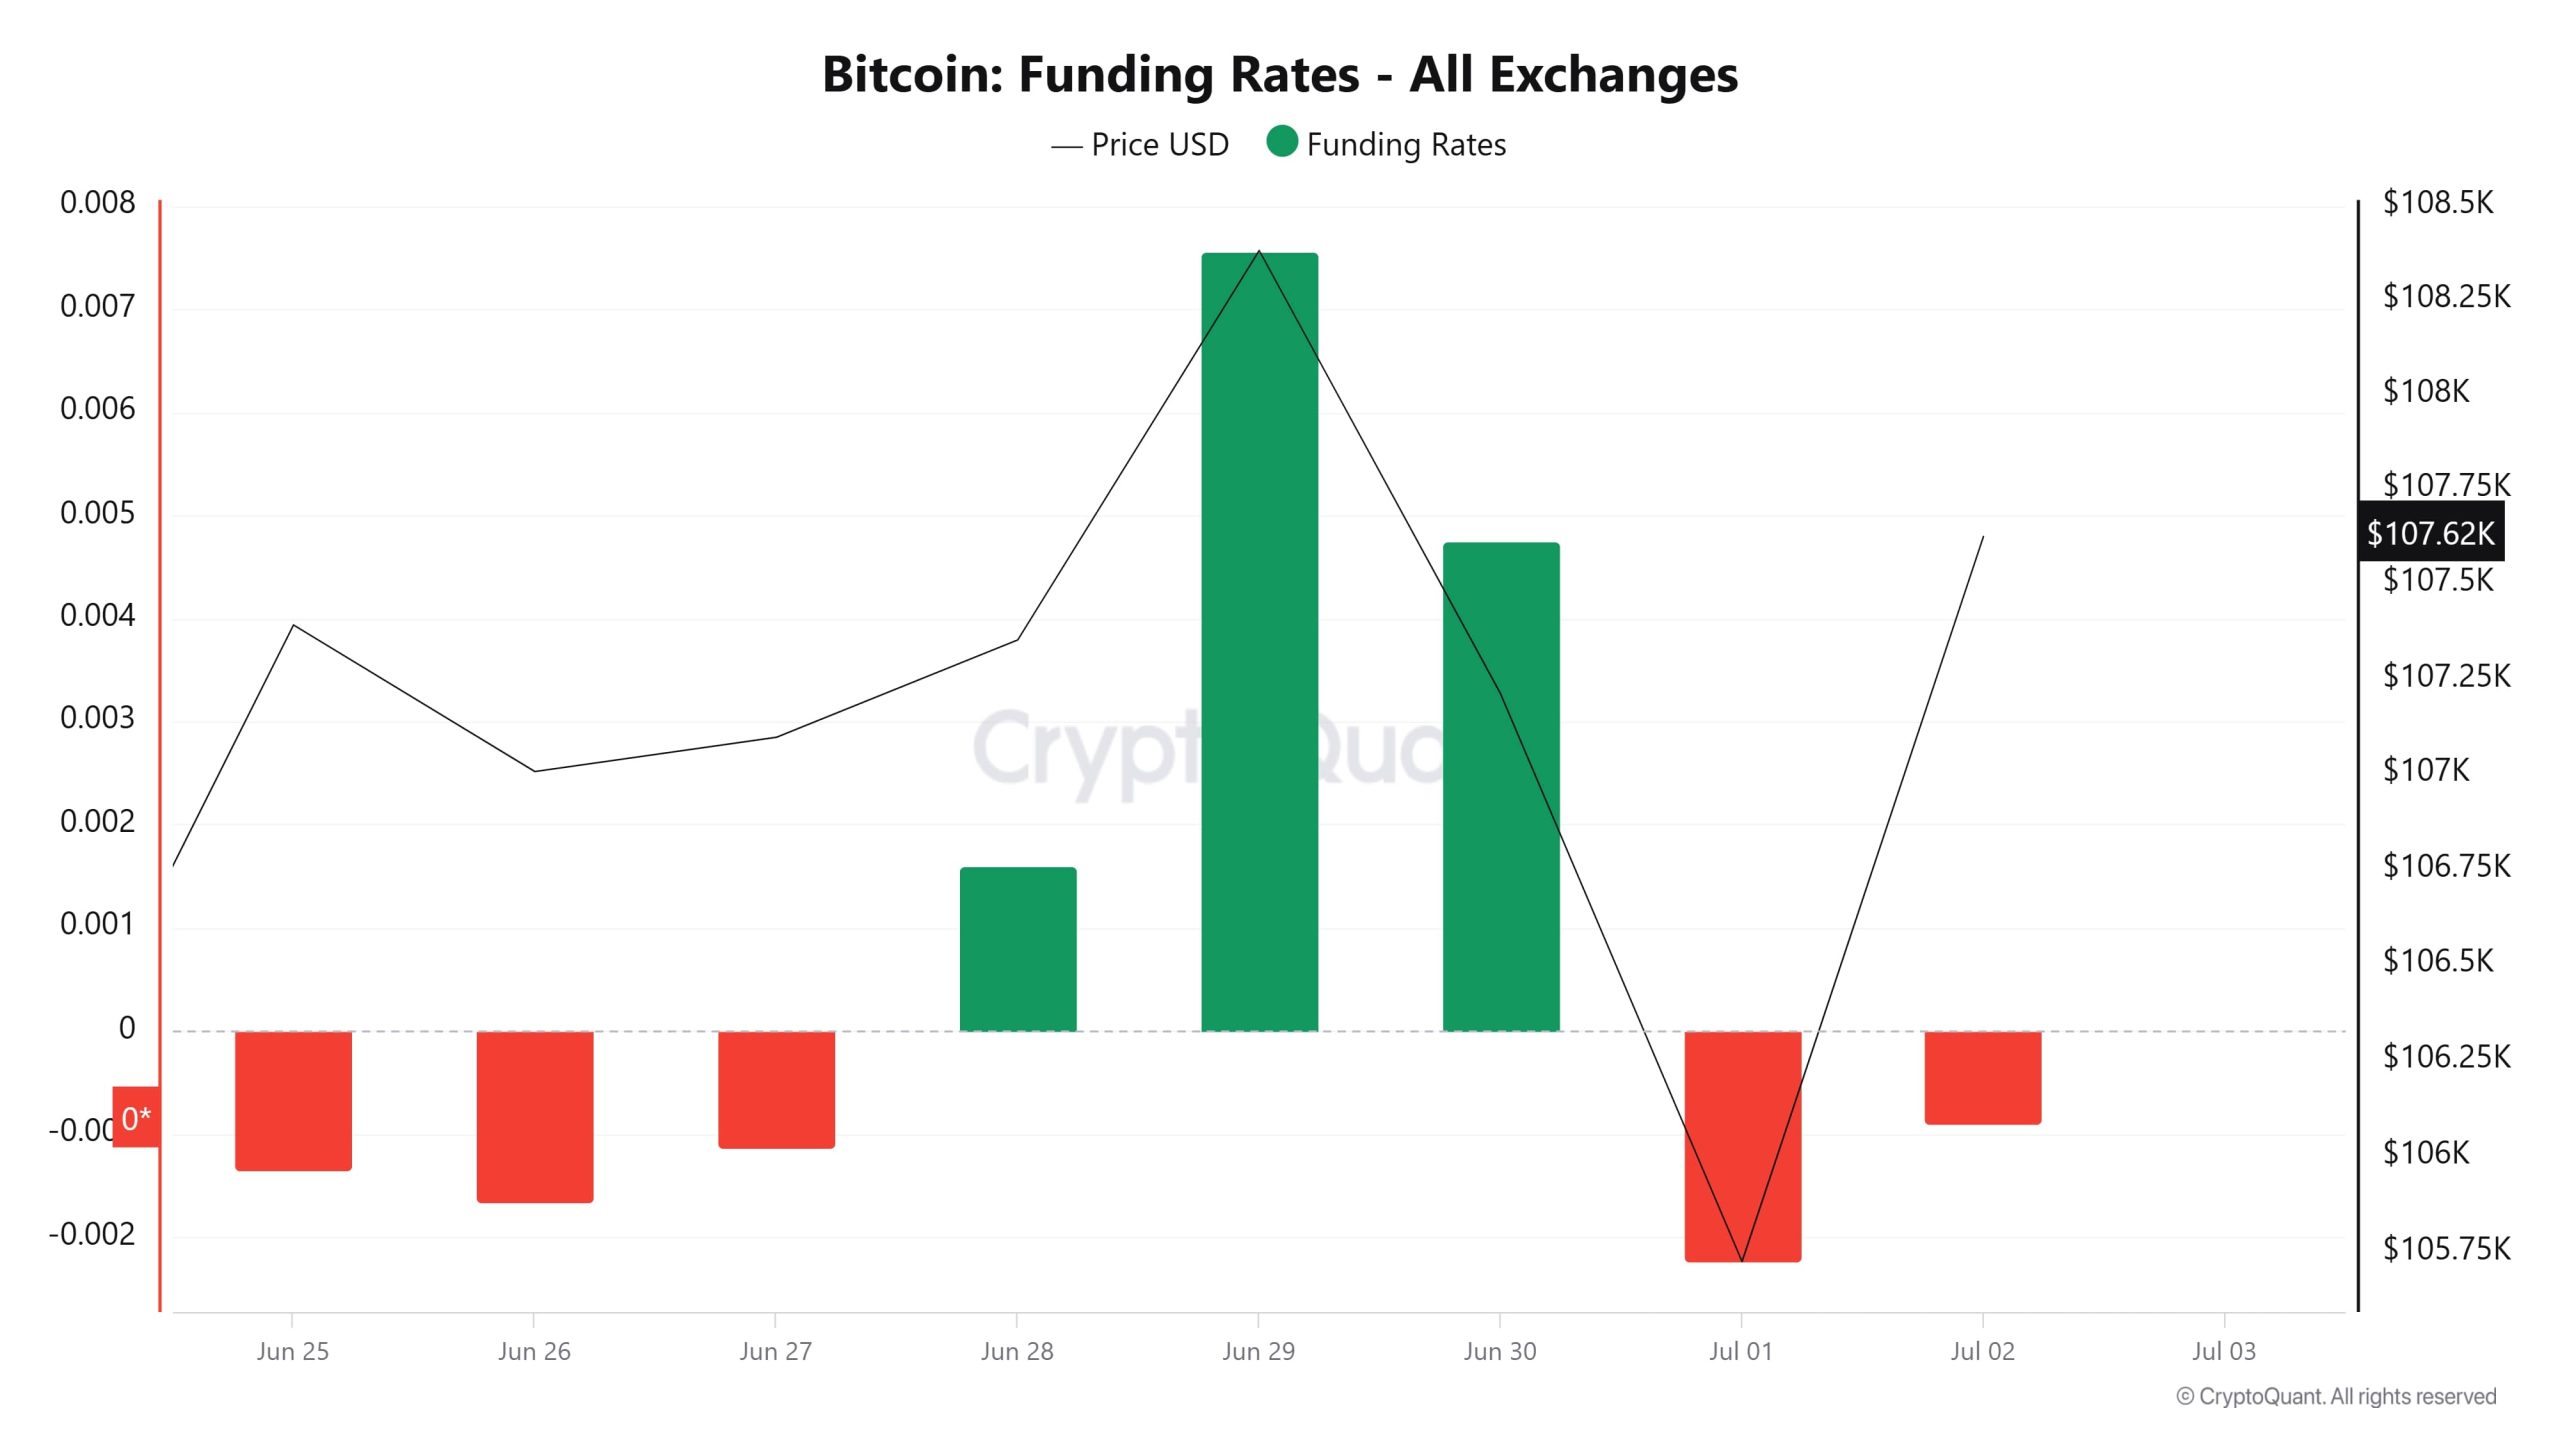
Negative funding ratios between Giugno 25-27 are noteworthy and indicate that short positions are predominant. During this three-day period, while the price followed a sideways-downward trend, it can be said that the market was in a cautious mode. However, starting from Giugno 28th, the mood suddenly changes. Funding ratios not only crossed into positive territory, but also jumped above the 0.007 level on Giugno 29. This shows that the interest in long trades increased significantly and traders were buying the rise.
But this surge didn’t last long. After Giugno 30, both the price and the funding ratio started to decline. On Luglio 1, the funding ratio turned negative again, falling to around -0.002. This sharp reversal may reflect the rapid closing of long positions or liquidations after overbought. On Luglio 2, the funding ratio is still in negative territory, but the price is showing signs of recovery, which could be interpreted as a re-entry signal.
Overall, the fluctuation in funding rates suggests that futures continue to search for direction and that investors are shifting positions according to short-term opportunities. The sharp pullbacks that come after sudden upward moves clearly reveal how fragile the market is.
Liquidazioni lunghe e brevi
With the BTC price moving between 108,700 and 105,100 dollars, 137 million dollars long and 290 million dollars short transactions were liquidated.
| La storia | Importo lungo (milioni di dollari) | Importo breve (milioni di dollari) |
|---|---|---|
| Giugno 25th | 9.78 | 47.15 |
| Giugno 26th | 19.30 | 35.38 |
| Giugno 27th | 17.92 | 133.71 |
| Giugno 28th | 0.17 | 3.09 |
| Giugno 29th | 4.05 | 36.28 |
| Giugno 30th | 21.82 | 27.85 |
| Luglio 01 | 64.58 | 7.16 |
| Totale | 137.62 | 290.62 |
Distribuzione delle forniture
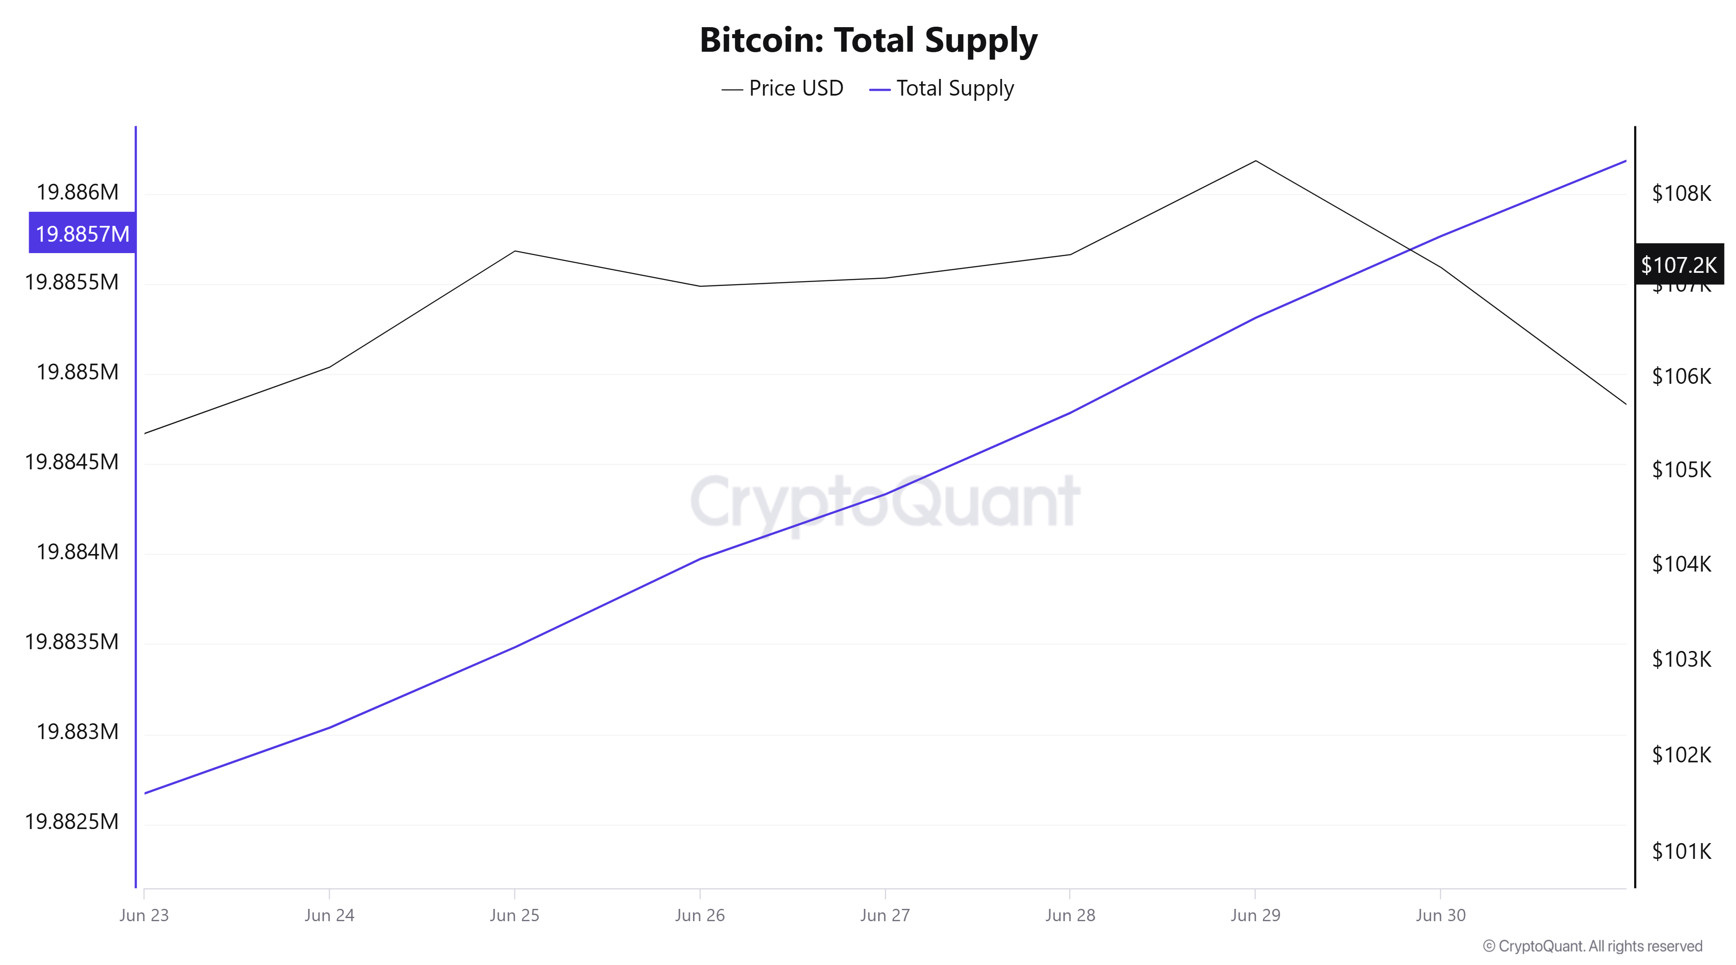
Total Supply: 19,885,767 units, up about 0.015% from last week.
New Supply: The amount of BTC produced this week was 3,096.
Velocity: Velocity, which was 12.85 last week, was 12.79 as of Giugno 30.
| Categoria Portafoglio | 23.06.2025 | 30.06.2025 | Variazione (%) |
|---|---|---|---|
| < 1 BTC | 8.4795% | 8.4707% | -0.10% |
| 1 - 10 BTC | 11.4552% | 11.4290% | -0.22% |
| 10 - 100 BTC | 24.6075% | 24.6580% | 0.20% |
| 100 - 1k BTC | 28.9068% | 28.9932% | 0.29% |
| 1k - 10k BTC | 18.3613% | 18.3194% | -0.22% |
| 10k+ BTC | 8.1891% | 8.1292% | -0.73% |
According to the latest weekly data, there was a limited decrease of -0.10% in <1 BTC wallets, while a decrease of -0.23% was observed in the 1-10 BTC range. There were slight increases of +0.21% in the 10-100 BTC segment and +0.30% in 100-1k BTC. The 1k-10k BTC range saw a limited decline of -0.23%, while the 10k+ BTC category saw a more significant decline of -0.73%.
Riserva di scambio
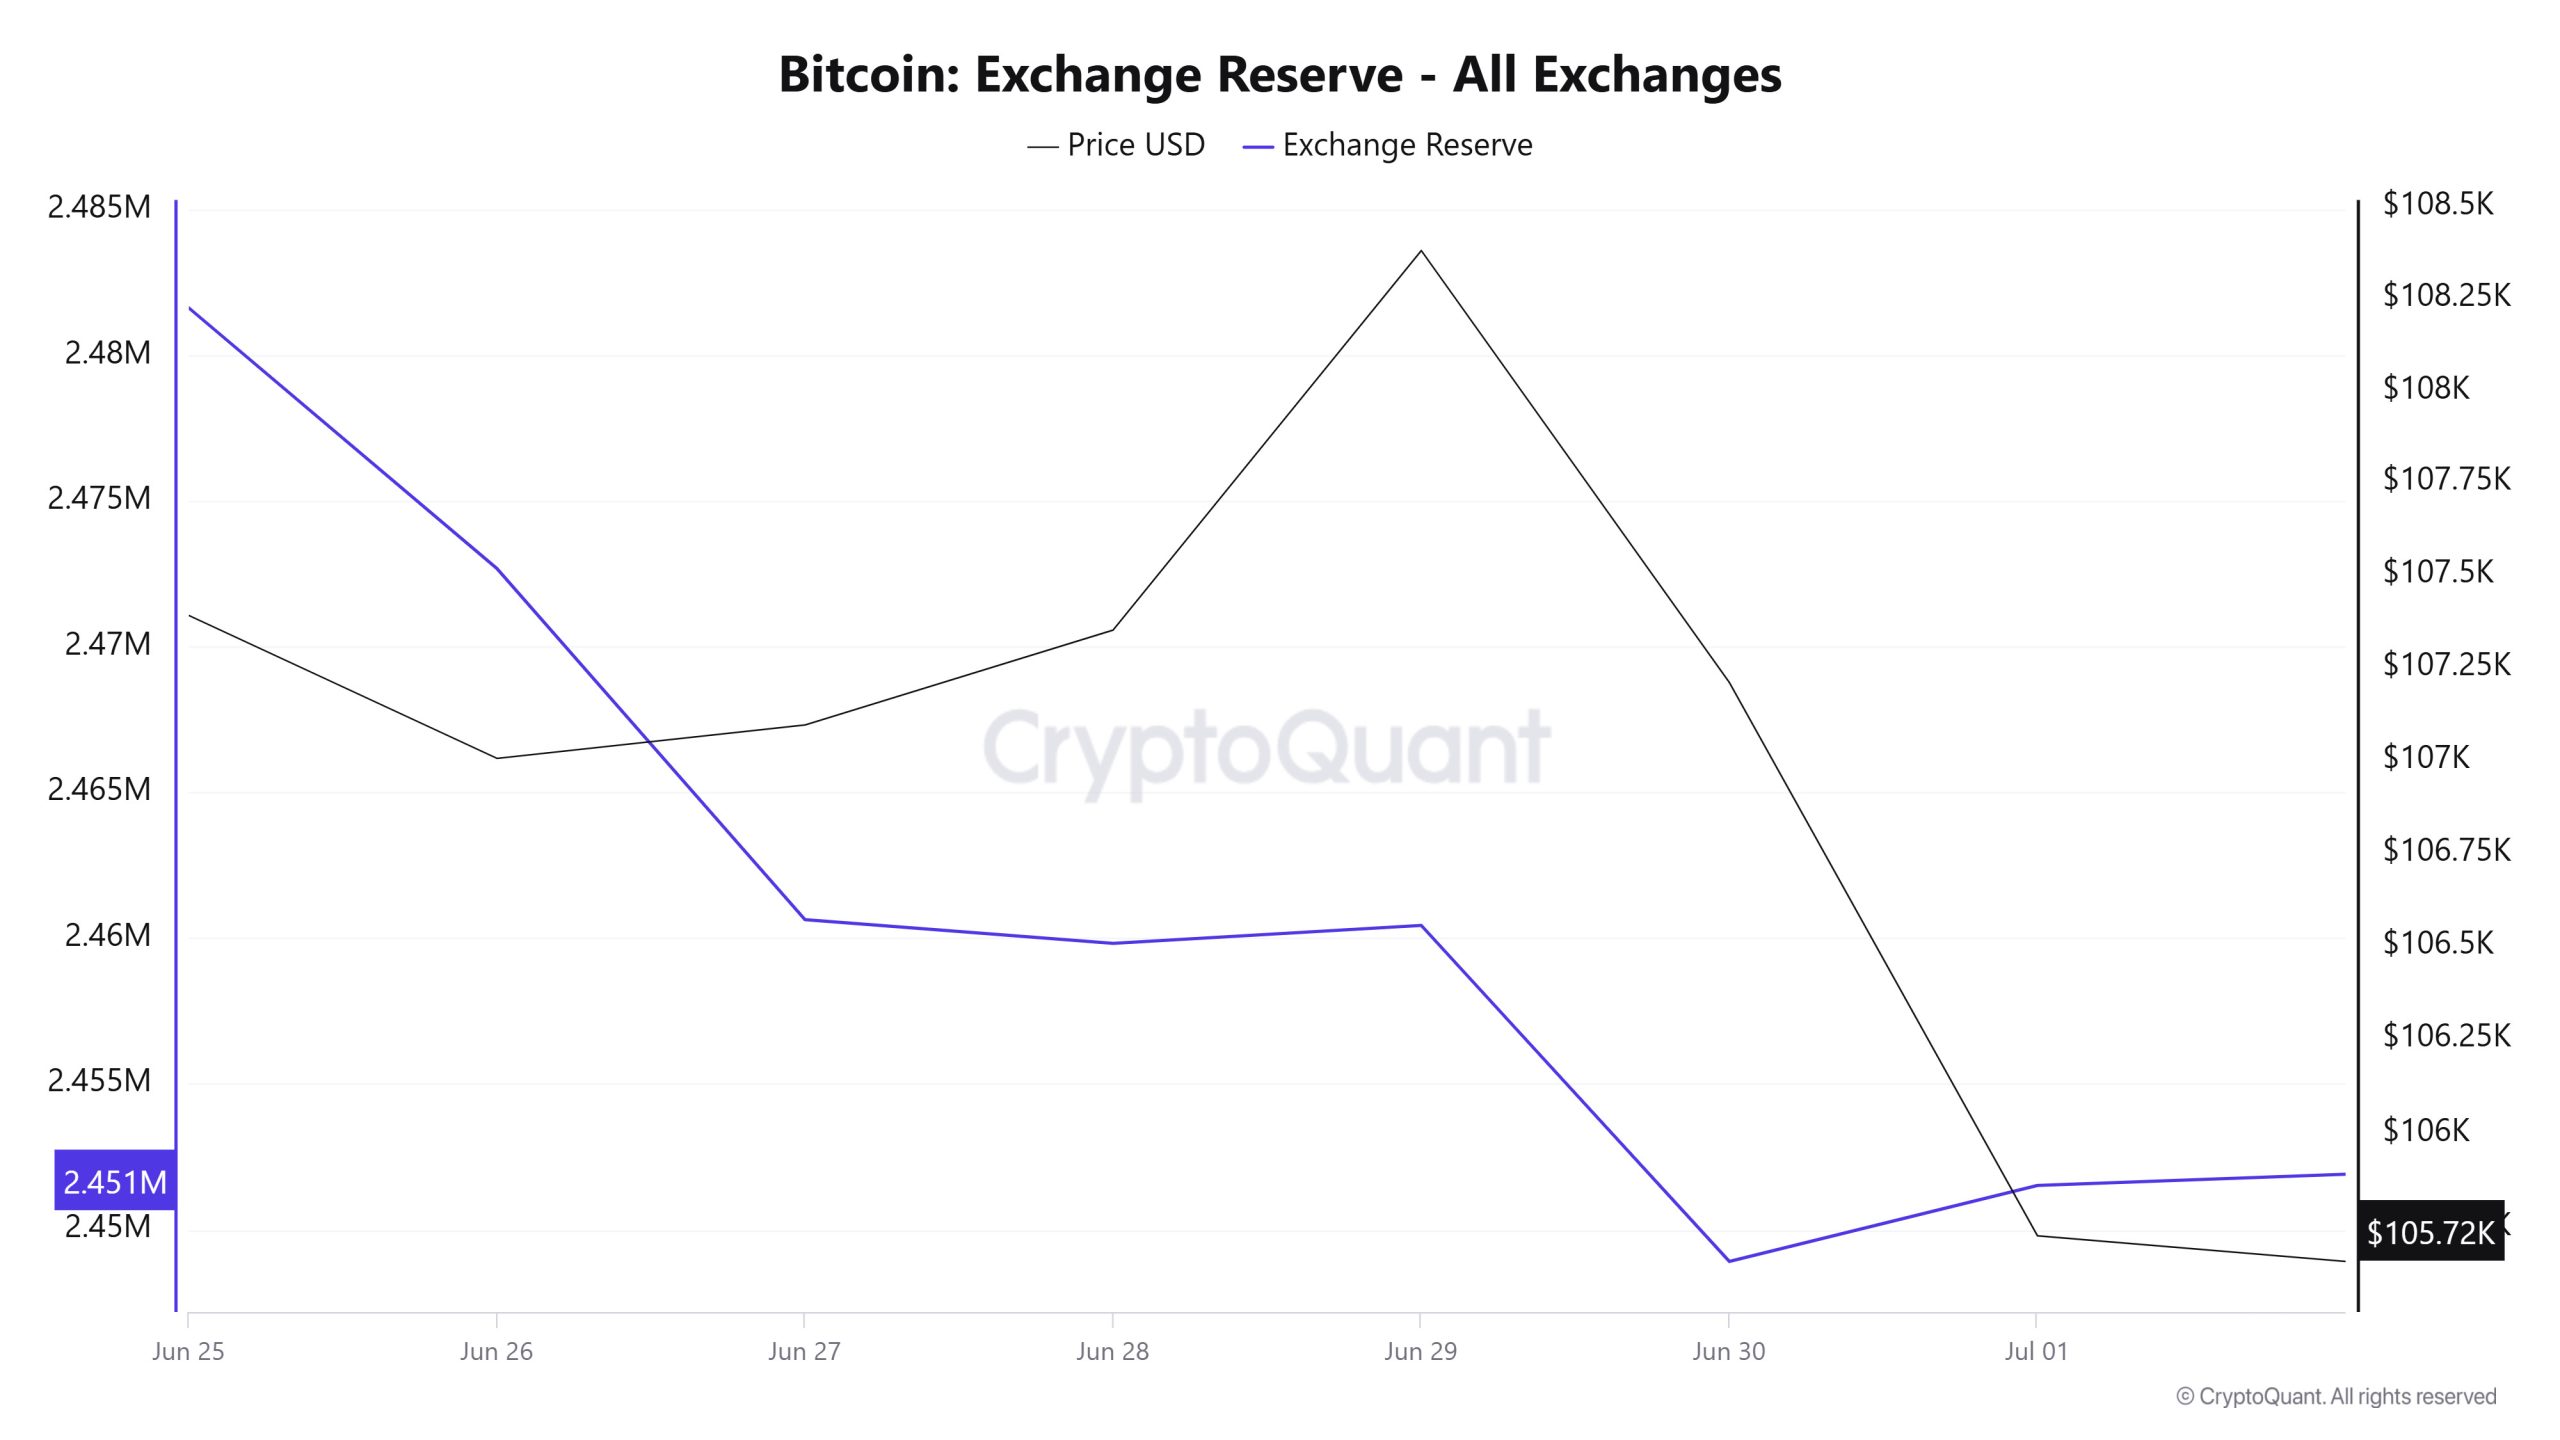
Between Giugno 25 and Luglio 1, 2025, Bitcoin reserves on exchanges decreased from 2,481,638 BTC to 2,451,517 BTC. In total, there was a net outflow of 30,121 BTC during this period, reducing reserves by about 1.21%. During the same period, the Bitcoin price fell by 1.5%, from $107,391 to $105,727. The decline in reserves during this period shows that investors tend to transfer their assets off-exchange and prefer to store their assets for the long term. However, the decline in prices despite the decrease in reserves shows that the pressure on the market continues and the short-term risk appetite remains weak. Investors’ cautious approach indicates that price volatility may remain limited in the coming days.
| Data | Afflusso di scambio | Flusso di scambio | Scambio Netflow | Riserva di scambio | Prezzo BTC |
|---|---|---|---|---|---|
| 25-Jun | 29,877 | 31,847 | -1,970 | 2,481,638 | 107,391 |
| 26-Jun | 25,290 | 34,233 | -8,943 | 2,472,695 | 107,005 |
| 27-Jun | 31,634 | 43,692 | -12,058 | 2,460,637 | 107,095 |
| 28-Jun | 8,501 | 9,311 | -810 | 2,459,828 | 107,351 |
| 29-Jun | 5,626 | 5,011 | 615 | 2,460,443 | 108,382 |
| 30-Jun | 24,264 | 35,800 | -11,536 | 2,448,907 | 107,210 |
| 1-Jul | 20,788 | 18,178 | 2,610 | 2,451,517 | 105,727 |
Tasse e ricavi
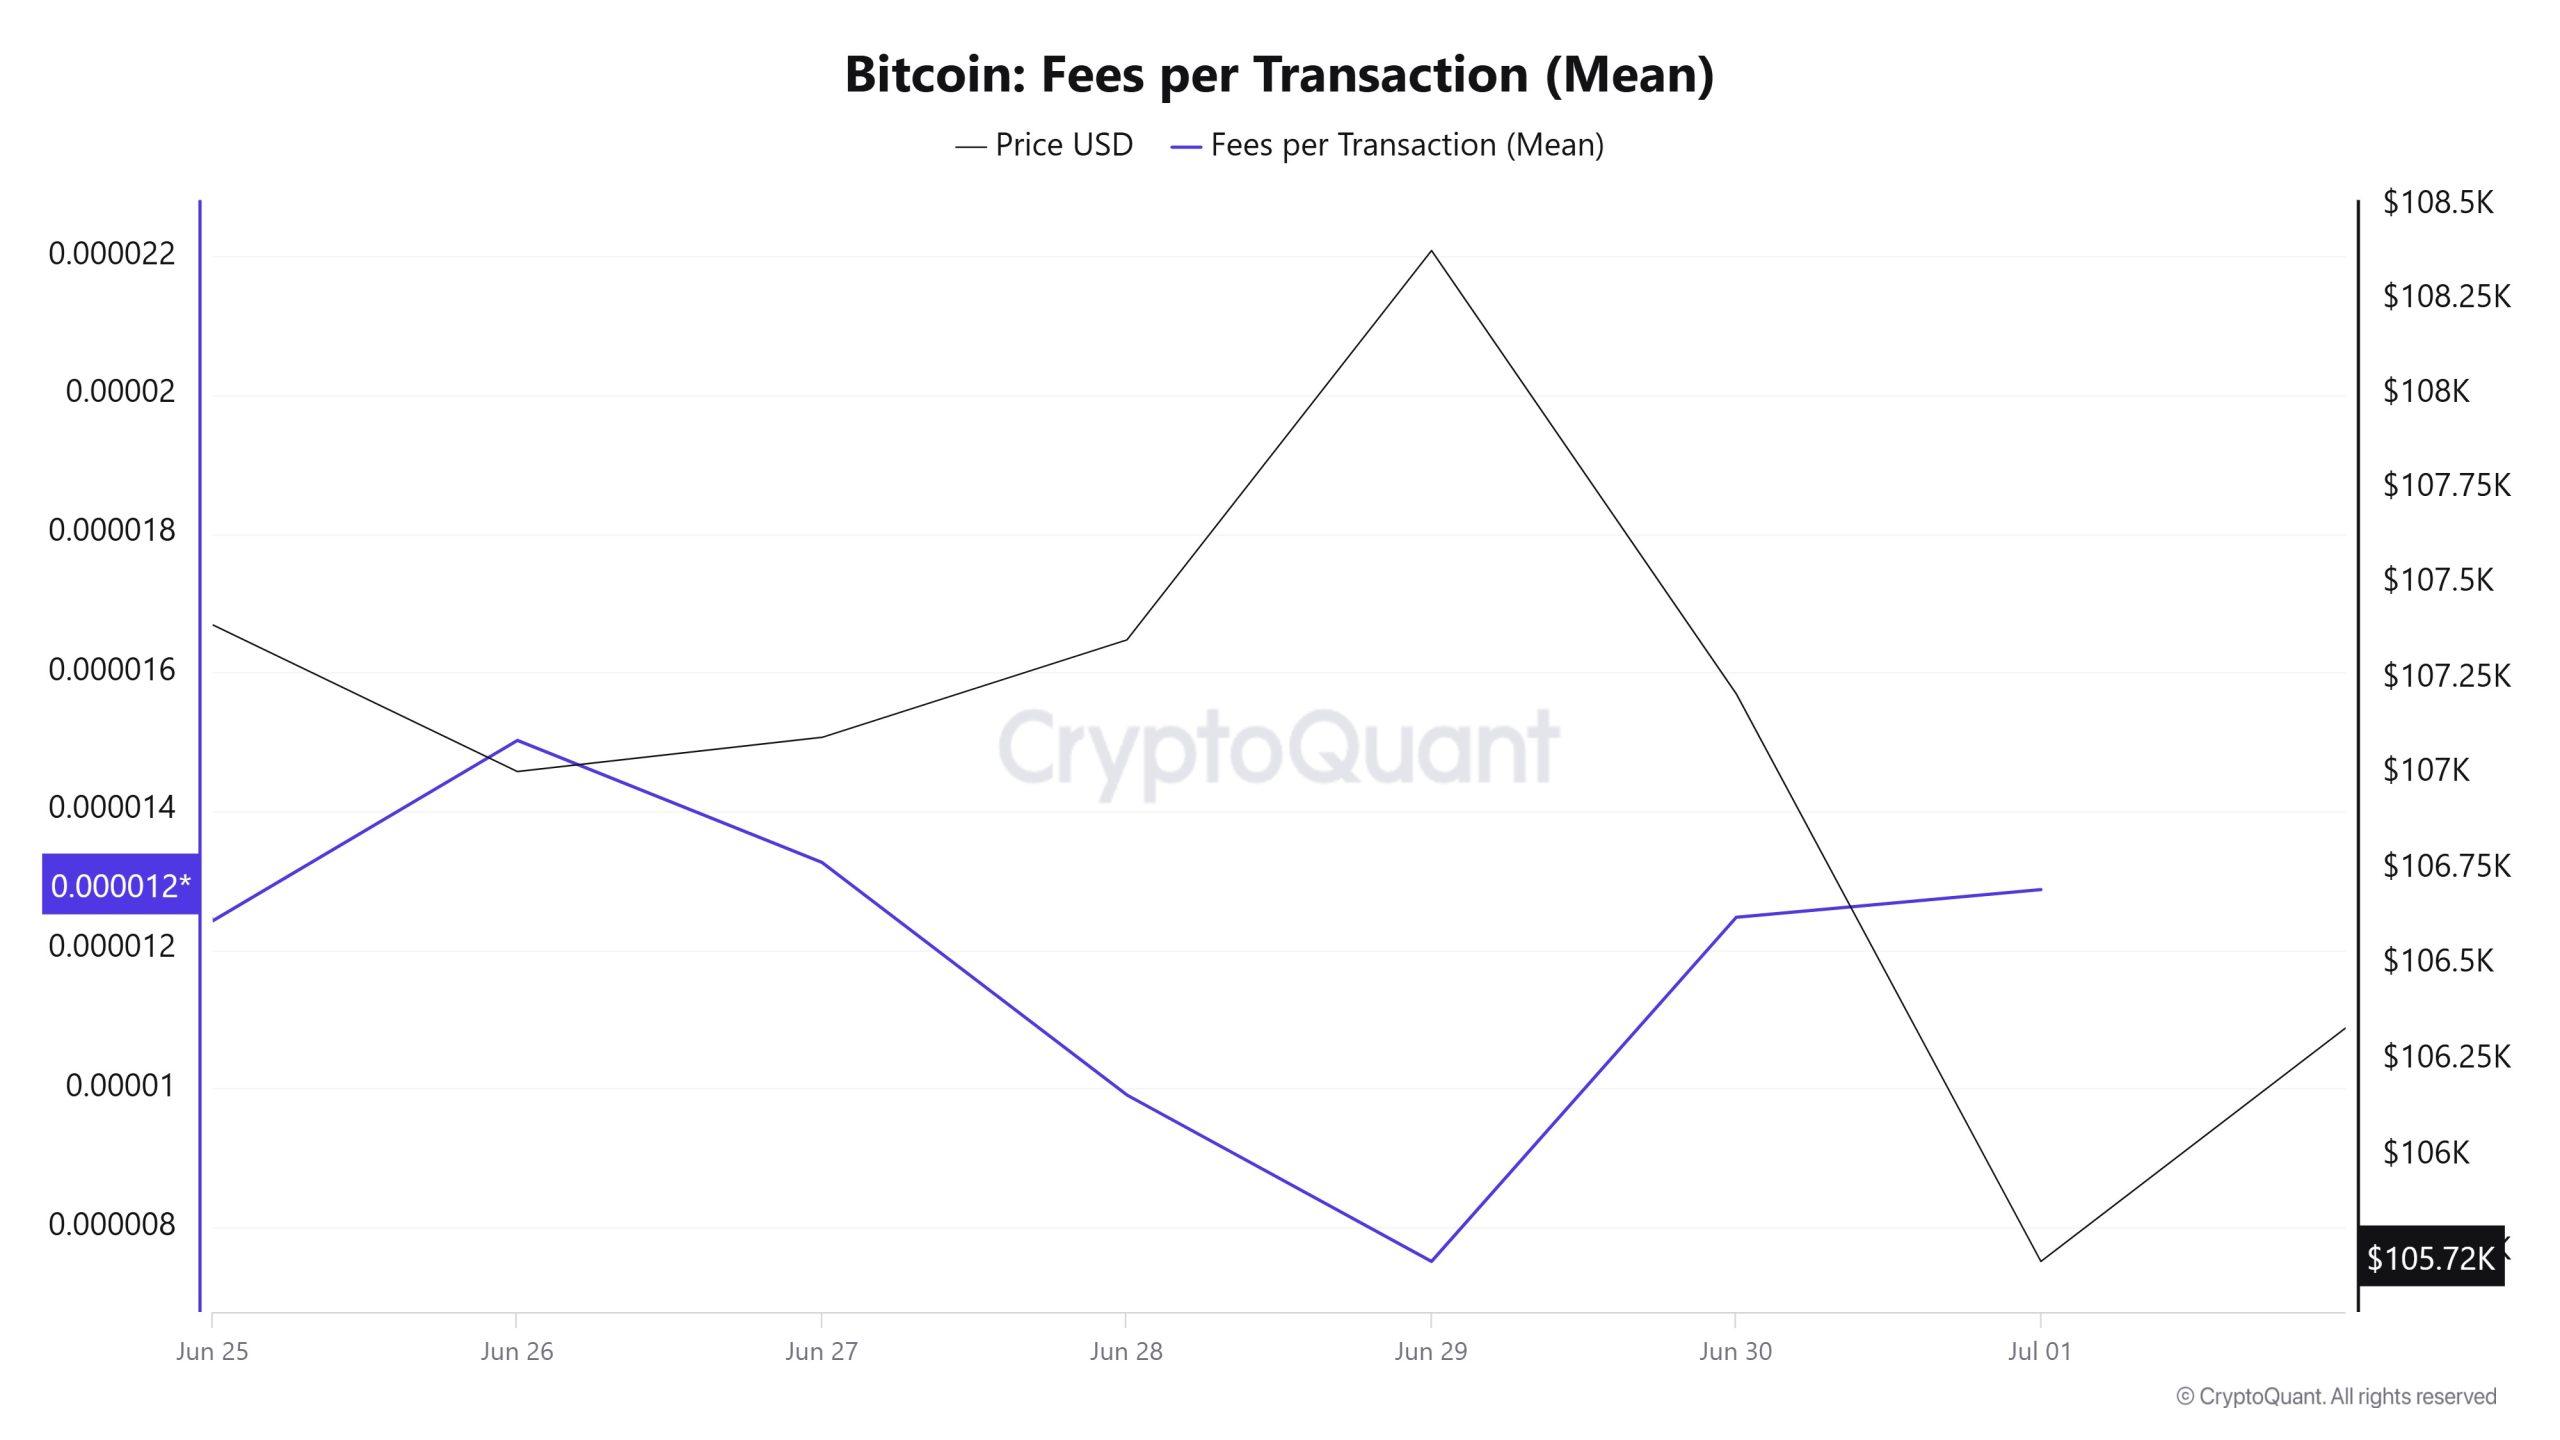
Between Giugno 25 and Luglio 1, Bitcoin Fees per Transaction (Mean) data shows that this indicator was at 0.00001242 on Giugno 25, the first day of the week.
As of Giugno 26, a downward trend was observed due to the volatile movements in the Bitcoin price; As of Giugno 29, it fell to 0.00000751, reaching the lowest level of the week.
In the following days, Bitcoin Fees per Transaction (Mean) started to rise again and closed at 0.00001287 on Luglio 1, the last day of the week.
Bitcoin: commissioni (totale)
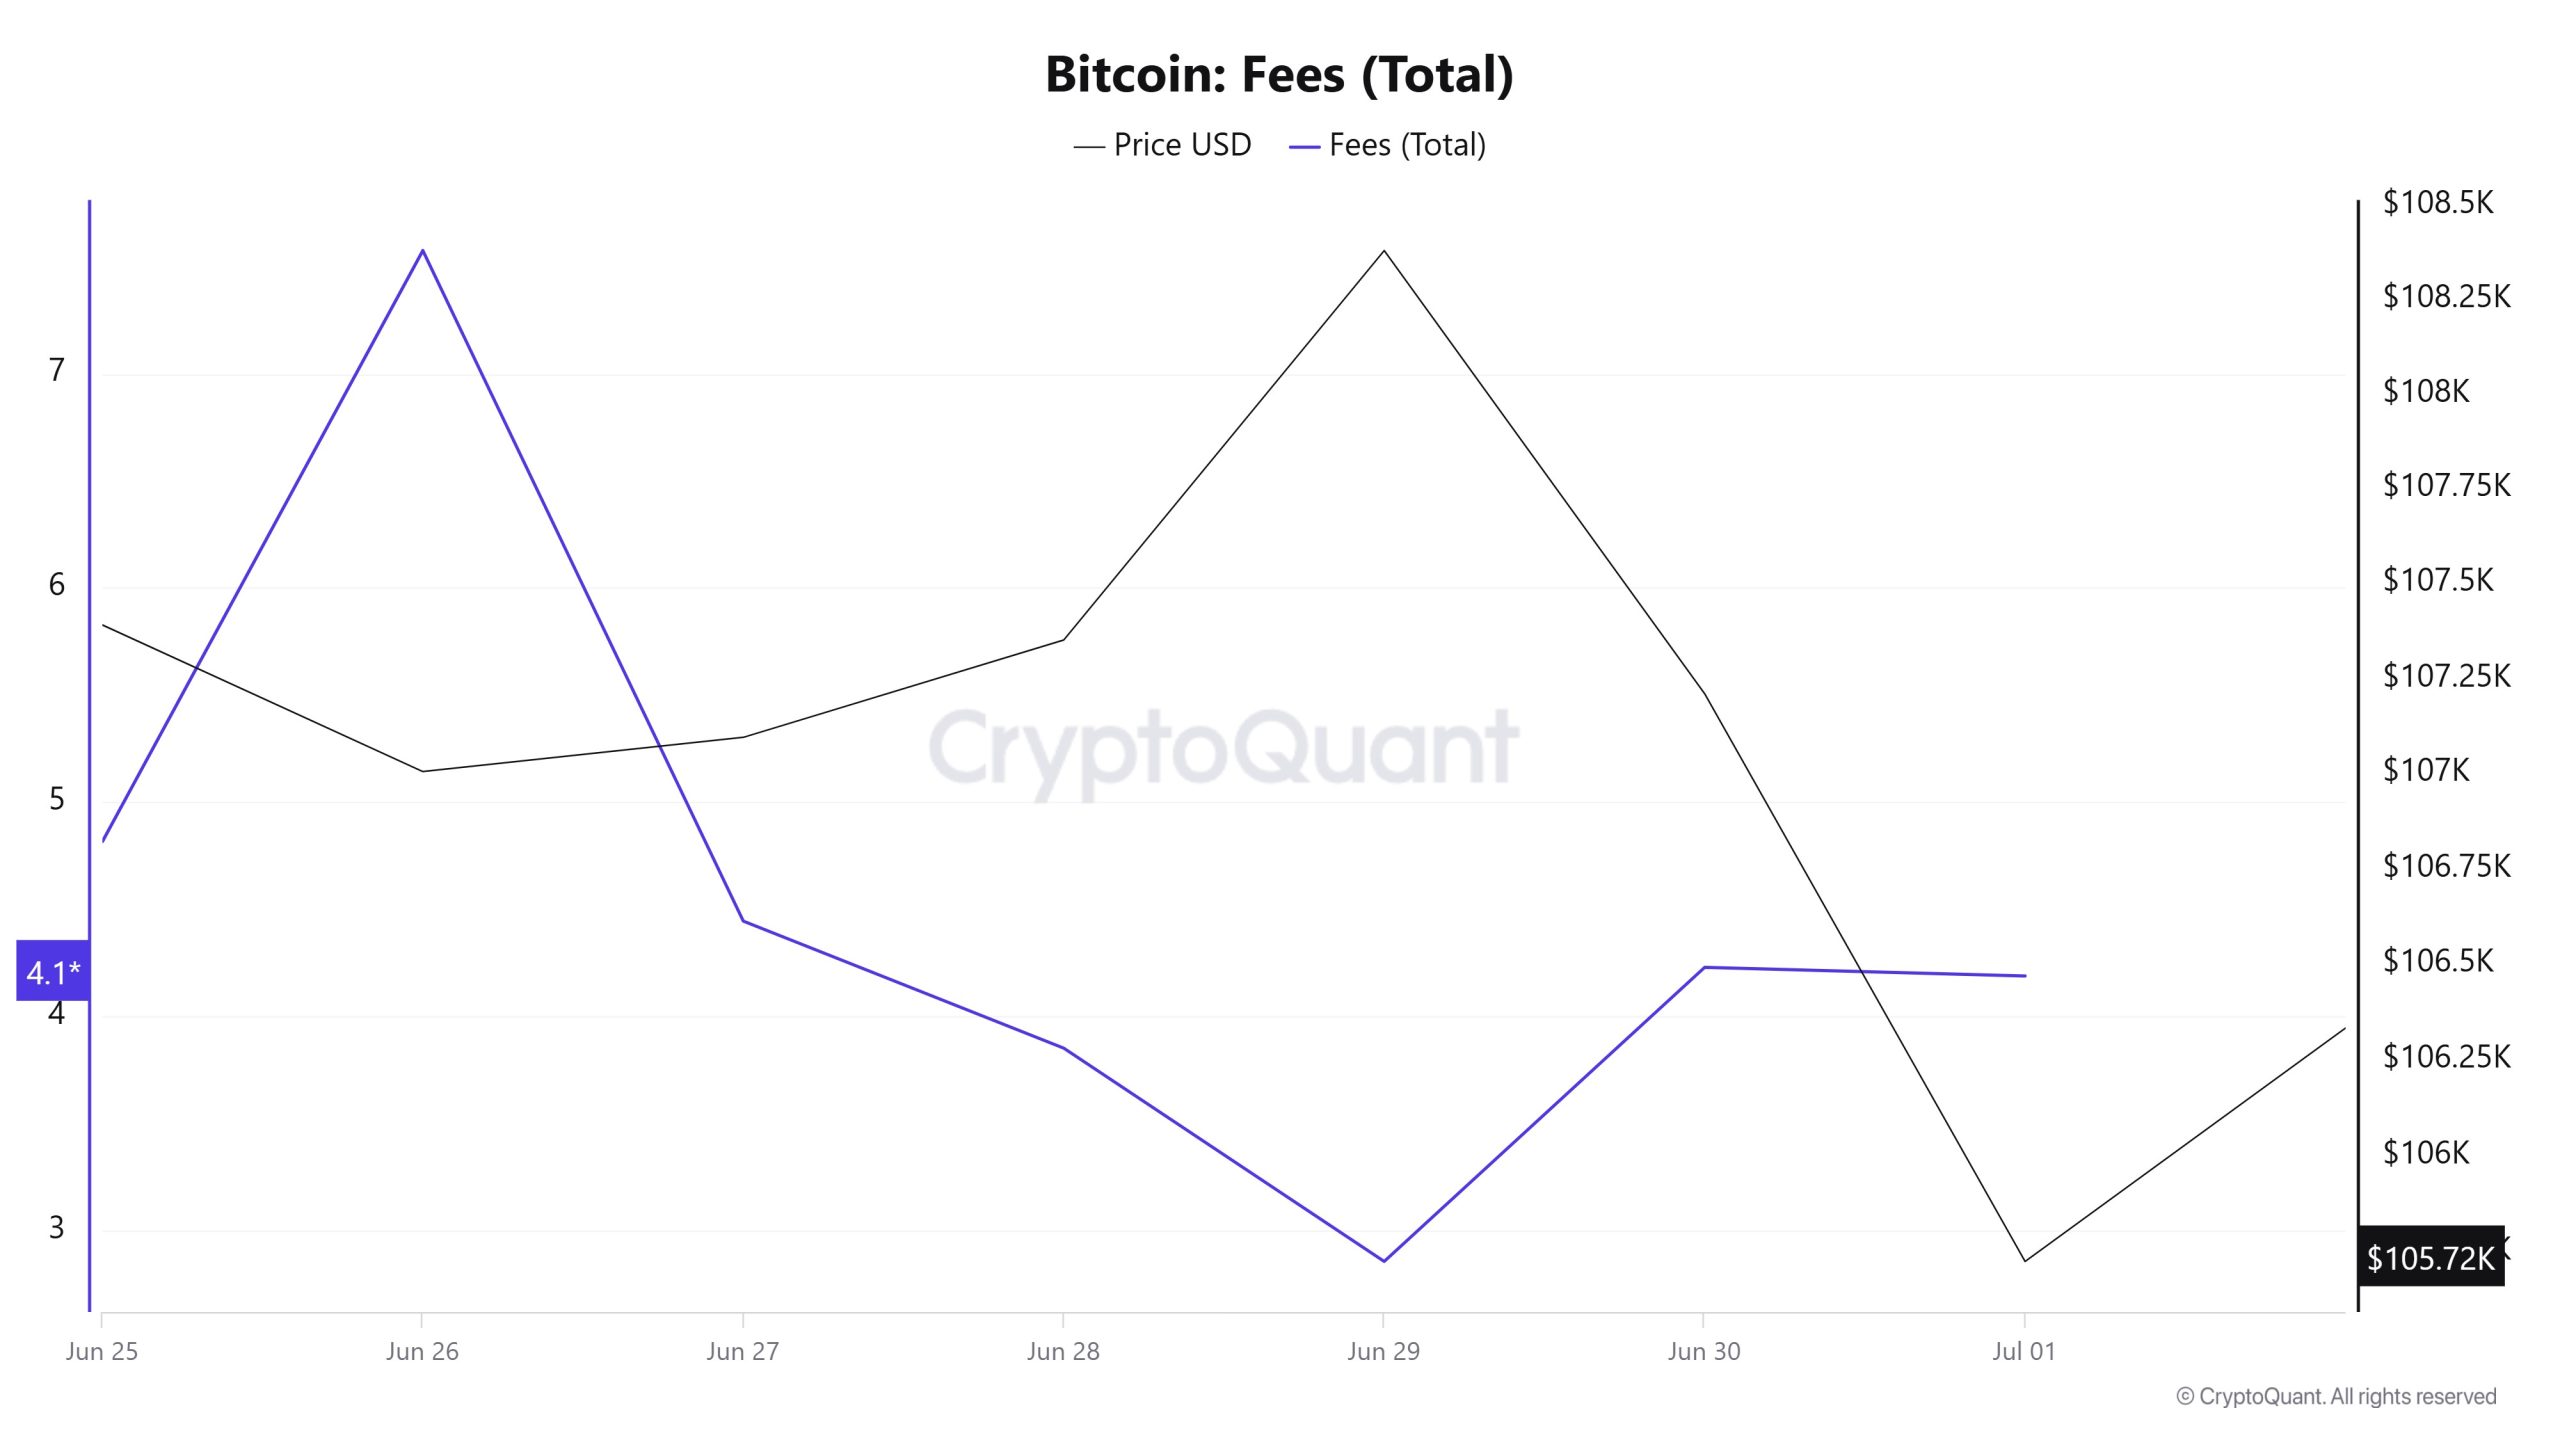
Similarly, when Bitcoin Fees (Total) data between Giugno 25 and Luglio 1 are analyzed, it is seen that this indicator was realized at 4.8161778 on Giugno 25, the first day of the week.
As of Giugno 26, a downward trend was observed due to the volatile movements in the Bitcoin price; as of Giugno 29, it fell to 2.85640286, reaching the lowest level of the week.
In the following days, Bitcoin Fees (Total) started to rise again and closed at 4.18857415 on Luglio 1, the last day of the week.
Flussi di minatori
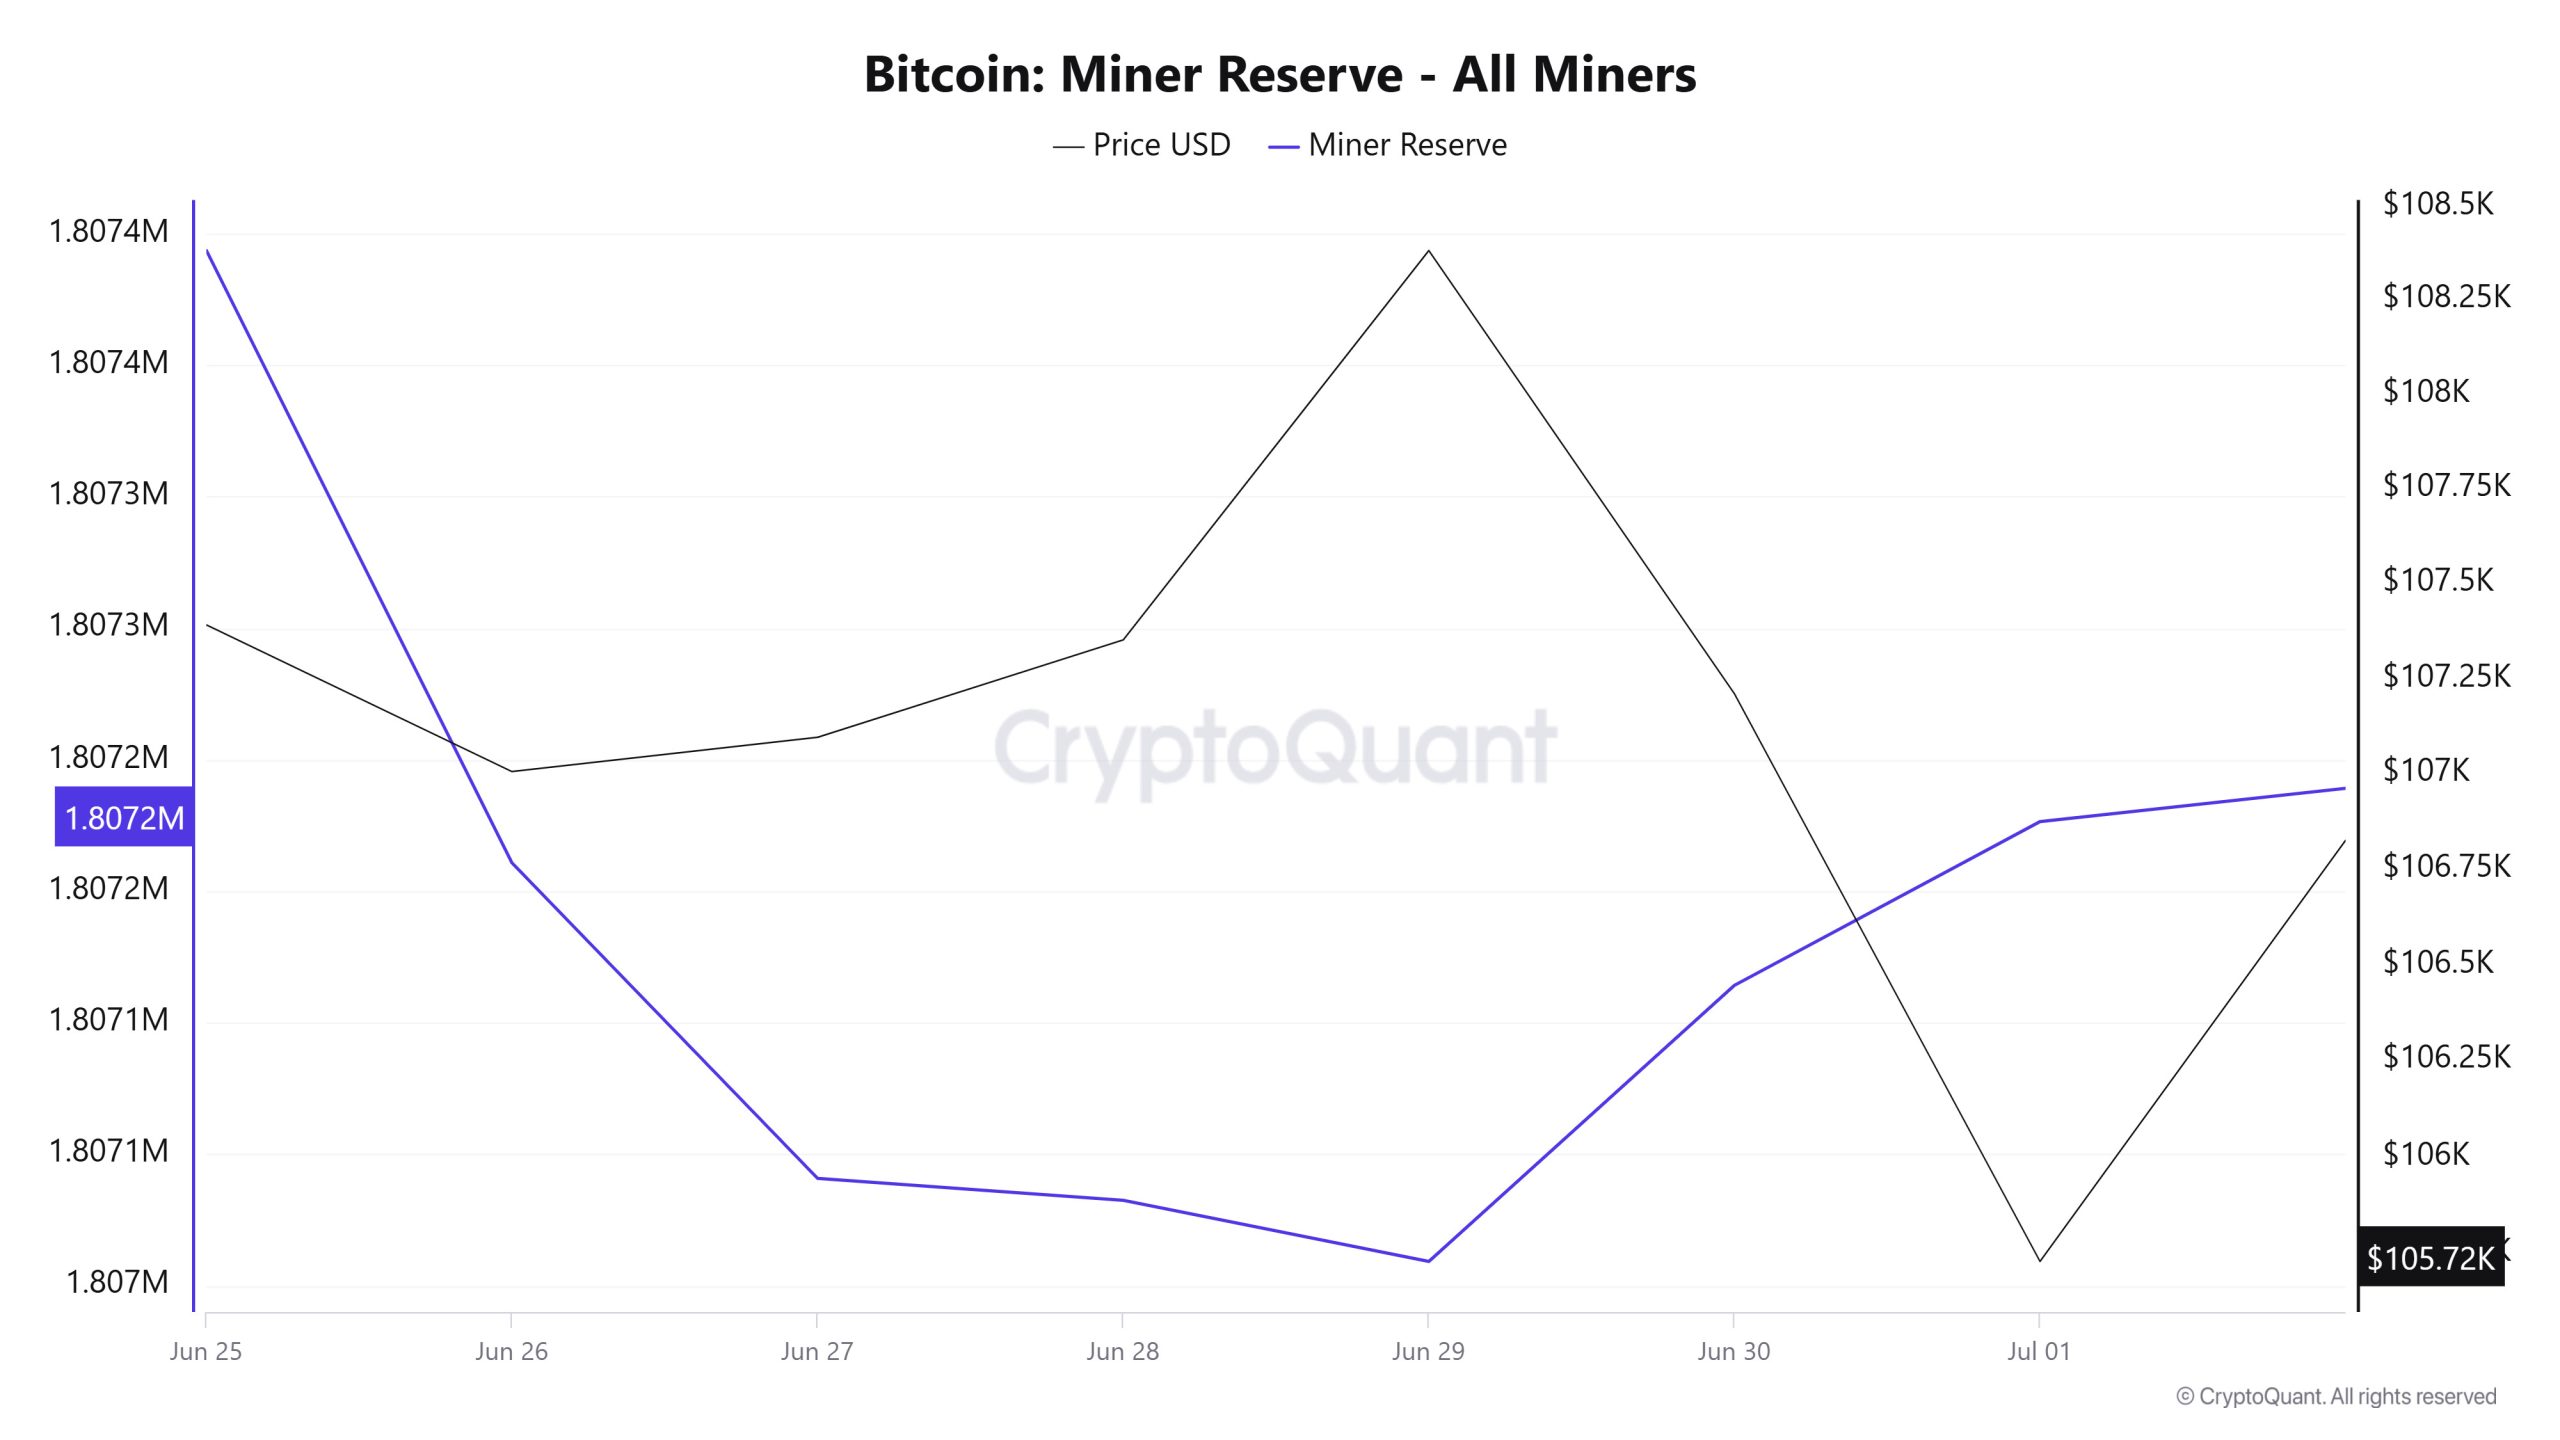
According to the data obtained from the Miner Reserve table, there was an increase in Bitcoin reserves held in miners’ wallets this week. There was a negative correlation between Bitcoin price and Miner Reserve during the week.
Miner Inflow, Outflow e NetFlow
Between Giugno 25 and Luglio 1, 31,357 Bitcoins exited miners’ wallets and 31,367 Bitcoins entered miners’ wallets between the same dates. The Miner Netflow for this week was 10 Bitcoin. Meanwhile, the Bitcoin price was $107,390 on Giugno 25 and $105,727 on Luglio 1.
Per la settimana, il flusso netto (Miner Netflow) è stato positivo in quanto l'afflusso di Bitcoin nei portafogli dei minatori (Miner Inflow) è stato superiore al deflusso di Bitcoin dai portafogli dei minatori (Miner Outflow).
| Data | Afflusso di minatori | Deflusso dei minatori | Miner Flusso netto |
|---|---|---|---|
| 25 Haz | 6483.82 | 6256.75 | 227.07 |
| 26 Haz | 5236.45 | 5469.25 | -232.81 |
| 27 Haz | 6176.98 | 6296.91 | -119.93 |
| 28 Haz | 2288.53 | 2296.86 | -8.33 |
| 29 Haz | 2793.55 | 2816.81 | -23.27 |
| 30 Haz | 4148.13 | 4043.18 | 104.96 |
| 1 Tem | 4239.68 | 4177.41 | 62.27 |
Transazione
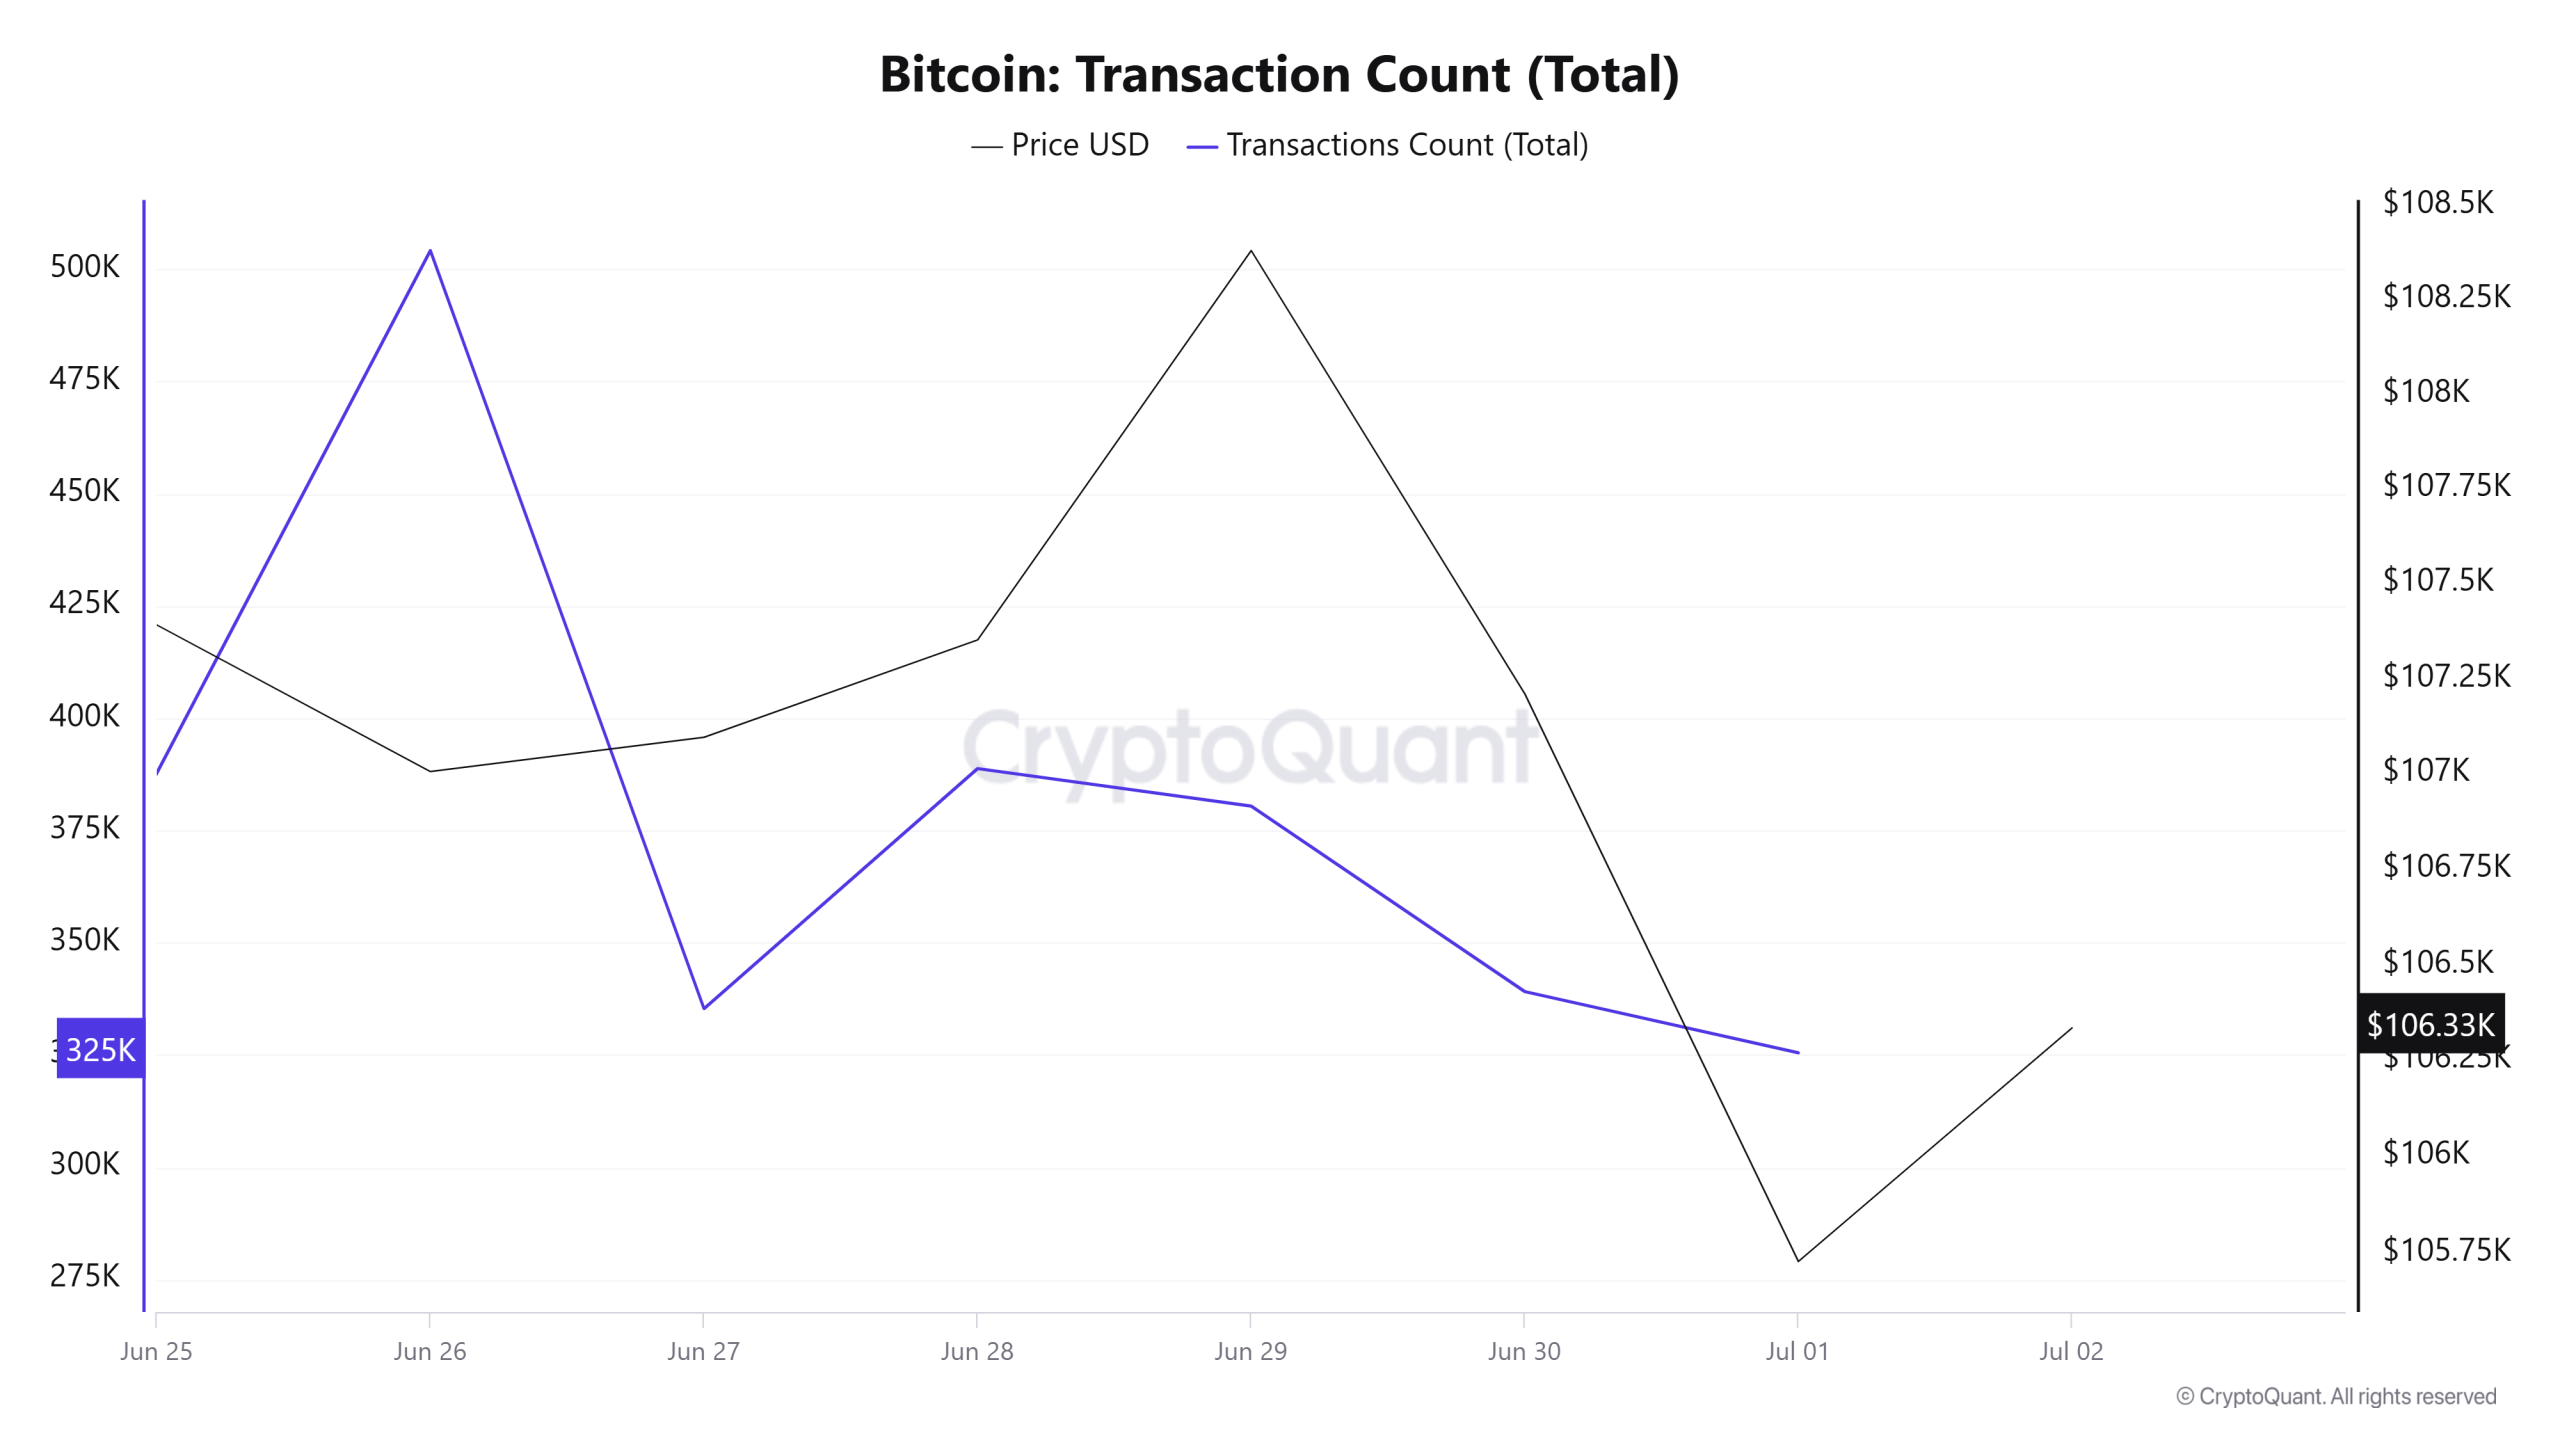
Last week, there were 2,247,054 transactions on the Bitcoin network, while this week it increased by about 18.42% to 2,661,118. The 504,184 transactions recorded on Giugno 26th was the highest transaction volume of the week, while the lowest number of transactions was 325,479 on Luglio 1st.
Correlations between price and number of transactions were negative for the week, but the increase in network activity compared to the previous week breaks the negative picture.
Gettoni trasferiti
While 3,772,565 BTC was transferred last week, this week it increased by approximately 2.65% to 3,872,504 BTC. On Giugno 25, the highest token transfer volume of the week was 720,913 BTC, while the lowest token transfer volume was 333,729 BTC on Giugno 29. The positive and negative correlations between the amount of BTC transferred on the network and the price have been balanced throughout this week.
Attività con le balene

Dati sulle balene
Over the last 7 days, data from the cryptocurrency market showed that whale activity on centralized exchanges was high at the beginning of the process. Towards the middle of the process, these activities declined. When we look at the Exchange Whale Ratio metric, Giugno 25, the first day of the 7-day process, measured the rate of whales using central exchanges as 0.478. The peak of the process occurred on Giugno 28 and the value was 0.731. When this ratio is above 0.35, it usually means that whales use centralized exchanges frequently. This measurement decreased towards the middle of the process, dropping to 0.464 on Giugno 29, marking the low point of the process. It currently stands at 0.621 and centralized exchanges continue to be used frequently. BTC was priced at $105,000 at the beginning of this period and is currently priced at $107,500. This shows that whales are using centralized exchanges in a balanced way. At the same time, total BTC transfers increased by 2% compared to last week, with 3,872,504 BTC moving. The data suggests that BTC is currently under selling pressure from long-term holders and large whales. It also shows that the group of Bitcoin holders with a medium-term maturity of 6 months has recently seen an upward trend in hoarding, while holders with a maturity of 2 years or more have been consistently selling. This has created pressure that will make it difficult for BTC prices to break out despite growing market demand. As a result, when we focus on the movements, the whales’ balanced use of centralized exchanges suggests that Bitcoin may move sideways in a narrow band.
BTC Onchain Nel complesso
| Metrico | Aumento 📈 | Declino 📉 | Neutro ➖ |
|---|---|---|---|
| Indirizzi attivi | ✓ | ||
| Guasti | ✓ | ||
| Derivati | ✓ | ||
| Distribuzione delle forniture | ✓ | ||
| Riserva di scambio | ✓ | ||
| Tasse e ricavi | ✓ | ||
| Flussi di minatori | ✓ | ||
| Transazione | ✓ | ||
| Attività con le balene | ✓ |
*Le metriche e le indicazioni contenute nella tabella non descrivono né implicano di per sé un'aspettativa di future variazioni di prezzo per qualsiasi asset. I prezzi degli asset digitali possono variare in base a molte variabili diverse. L'analisi di onchain e la relativa guida hanno lo scopo di assistere gli investitori nel loro processo decisionale, e l'effettuazione di investimenti finanziari basati esclusivamente sui risultati di questa analisi potrebbe risultare in transazioni dannose. Anche se tutte le metriche producono un risultato rialzista, ribassista o neutrale allo stesso tempo, i risultati attesi potrebbero non essere visibili a seconda delle condizioni di mercato. Gli investitori che esaminano il rapporto farebbero bene a tenere conto di queste avvertenze.
Avviso legale
Le informazioni, i commenti e le raccomandazioni sugli investimenti contenuti nel presente documento non costituiscono servizi di consulenza sugli investimenti. I servizi di consulenza sugli investimenti sono forniti da istituti autorizzati su base personale, tenendo conto delle preferenze di rischio e di rendimento dei singoli. I commenti e le raccomandazioni contenuti nel presente documento sono di tipo generale. Tali raccomandazioni potrebbero non essere adatte alla vostra situazione finanziaria e alle vostre preferenze di rischio e rendimento. Pertanto, prendere una decisione di investimento basandosi esclusivamente sulle informazioni contenute nel presente documento potrebbe non portare a risultati in linea con le vostre aspettative.
NOTA: Tutti i dati utilizzati nell'analisi di Bitcoin onchain si basano su Cryptoqaunt.

