
Introduzione
To better understand market movements, it may not be enough to look only at the price chart. Studying trader behavior and liquidity flows plays a critical role in predicting trend reversals and momentum shifts. Therefore, in our analysis, we focus on indicators that track trader positions and spot market movements. The COT (Commitment of Traders) oscillator helps us understand the positioning of different groups of traders in the market, while the Aggregated Spot Volume (Cumulative Delta) data reveals trader sentiment by assessing the trading balance. Consistent with past price movements, these indicators can provide a clearer perspective on future price trends.
COT Oscillator and Investor Positions
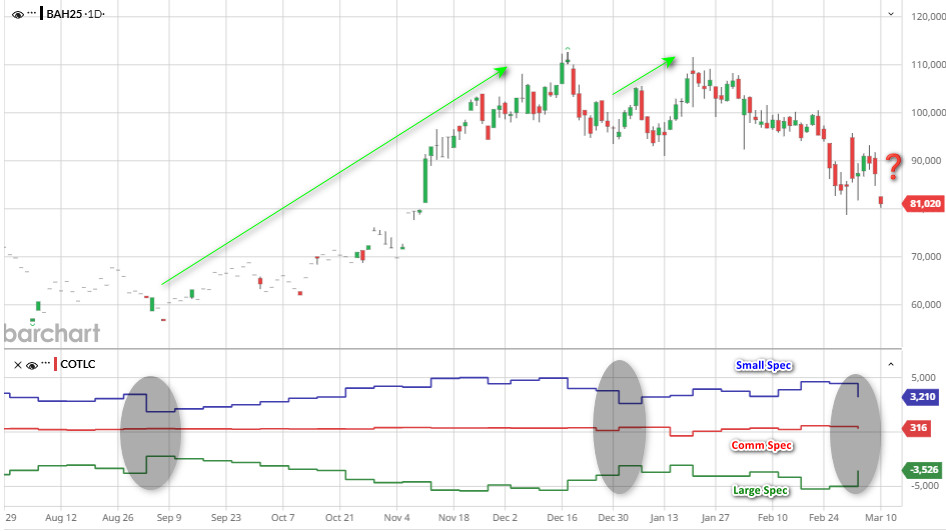
Source: Barchart
When we examine the Bitcoin Micro Futures Marzo 2025 (BAH25) chart traded on the CME, we observe that the COT (Commitment of Traders) oscillator exhibits patterns consistent with past price movements. For example, in Settembre 2024, when BTC price was hovering around $55,000, the Small Spec (Blue Line) was in a sell position and the Large Spec (Green Line) was in a buy position. This shows that the price entered a strong uptrend from $55,000 to $100,000. We observe a similar structure in Dicembre 2024. As the price hovered around $92,000, the selling pressure of small investors met the buying demand of large investors, and then the price regained momentum from $92,000 to $100,000. In the current data, the price is hovering around $80,000, with small investors taking a selling position and large investors buying. Given these dynamics, a trend reversal and momentum shift can be expected from the $80,000 level. On the other hand, if institutional investors (Red Line) move to a selling position, the possibility that the price may move downwards as the current momentum weakens should also be evaluated.
Investor Trends in the Spot Market
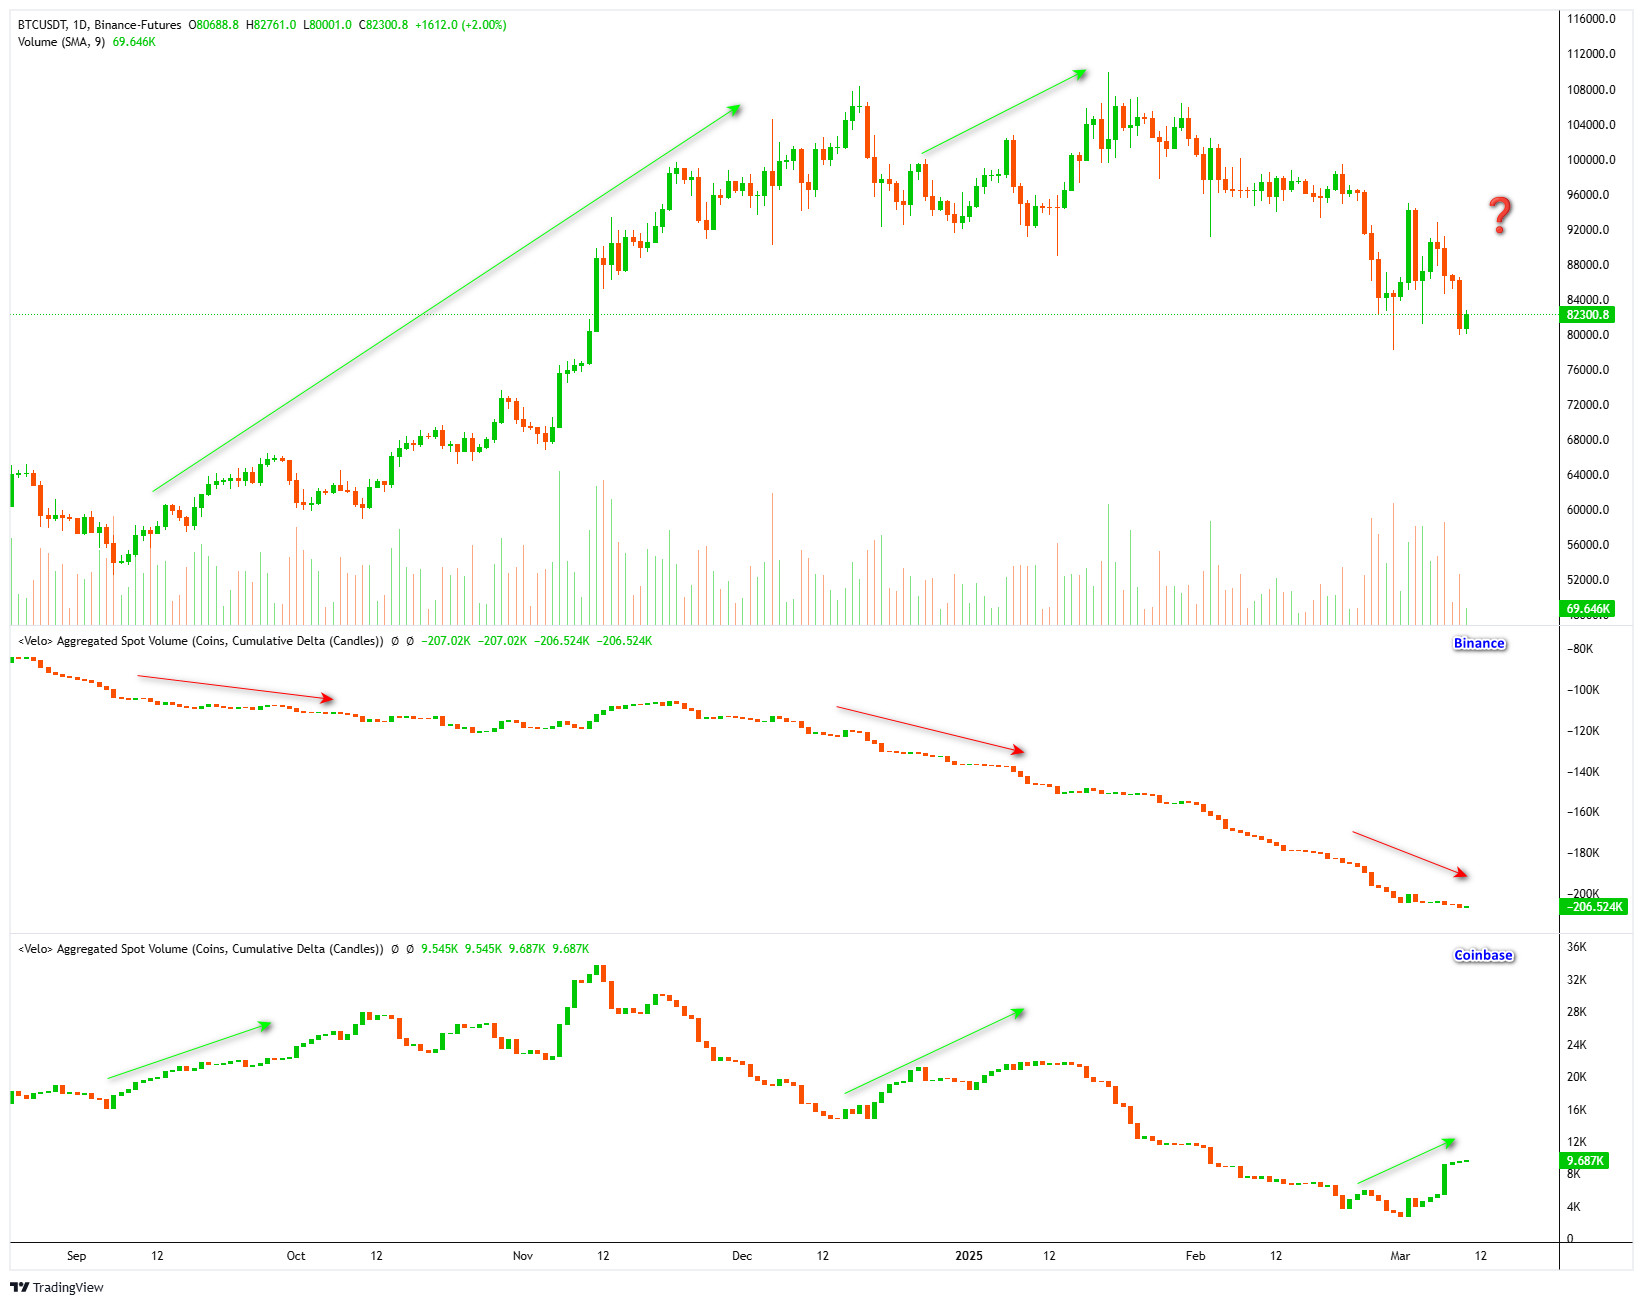
Source: Velo
When we look at the spot trading data on the two major exchanges Binance and Coinbase in the chart above, we see a similar picture to that observed in Settembre and Dicembre 2024. The general acceptance that Binance is mostly preferred by individual investors, while Coinbase hosts more institutional and large-scale investors, points to a similar structure to the dynamics observed in the previous rises.
General Evaluation and Possible Scenarios
As a result, the similarity between COT (Commitment of Traders) data and investor trends in spot markets in the past reveals that upward movements in Bitcoin price have been triggered. In the current situation, the fact that small investors are selling, and large investors are buying points to a structure similar to the bullish scenarios previously observed. However, although market dynamics are consistent with past data, institutional investor behavior and macroeconomic factors continue to determine price movements.