
-
Spot Altcoin ETF Process
2025 started off quite turbulent for financial markets. Decisions made following Donald Trump’s inauguration, the government shutdown in the US, and increasing geopolitical risks on a global scale heightened uncertainty across markets. During this period, the cryptocurrency market was also negatively affected by risk aversion, and prices remained under pressure for a long time.
By the end of the year, what was expected happened in the US stock markets, and Spot Altcoin ETFs began to be listed one by one. This stood out as an important development for the cryptocurrency market. The participation of new altcoins in the institutional ETF process opened the doors to a new era. This process, which began with Solana (SOL), Litecoin (LTC), and Hedera (HBAR), gained momentum with the subsequent trading of Ripple (XRP), Dogecoin (DOGE), and finally Chainlink (LINK) spot ETFs.
In this article, we will examine the post-launch price performance and ETF flows of these altcoin ETFs that have started trading on US exchanges. We will also make a direct comparison with the initial spot ETF periods of Bitcoin (BTC) and Ethereum (ETH), based on the number of trading days completed for each altcoin.
-
Spot Altcoin ETF Winds Blow Through US Stock Exchanges
With the launch of spot altcoin ETFs on US exchanges, it has become clear that institutional demand in the crypto market is expanding toward altcoins. While some altcoin ETFs saw strong net inflows in the post-launch period, the spot price did not perform to the same extent. In this section, we will examine the ETF flows and price movements for each altcoin from launch until December 12, 2025.
- Spot Solana (SOL) ETF Process and Price Change
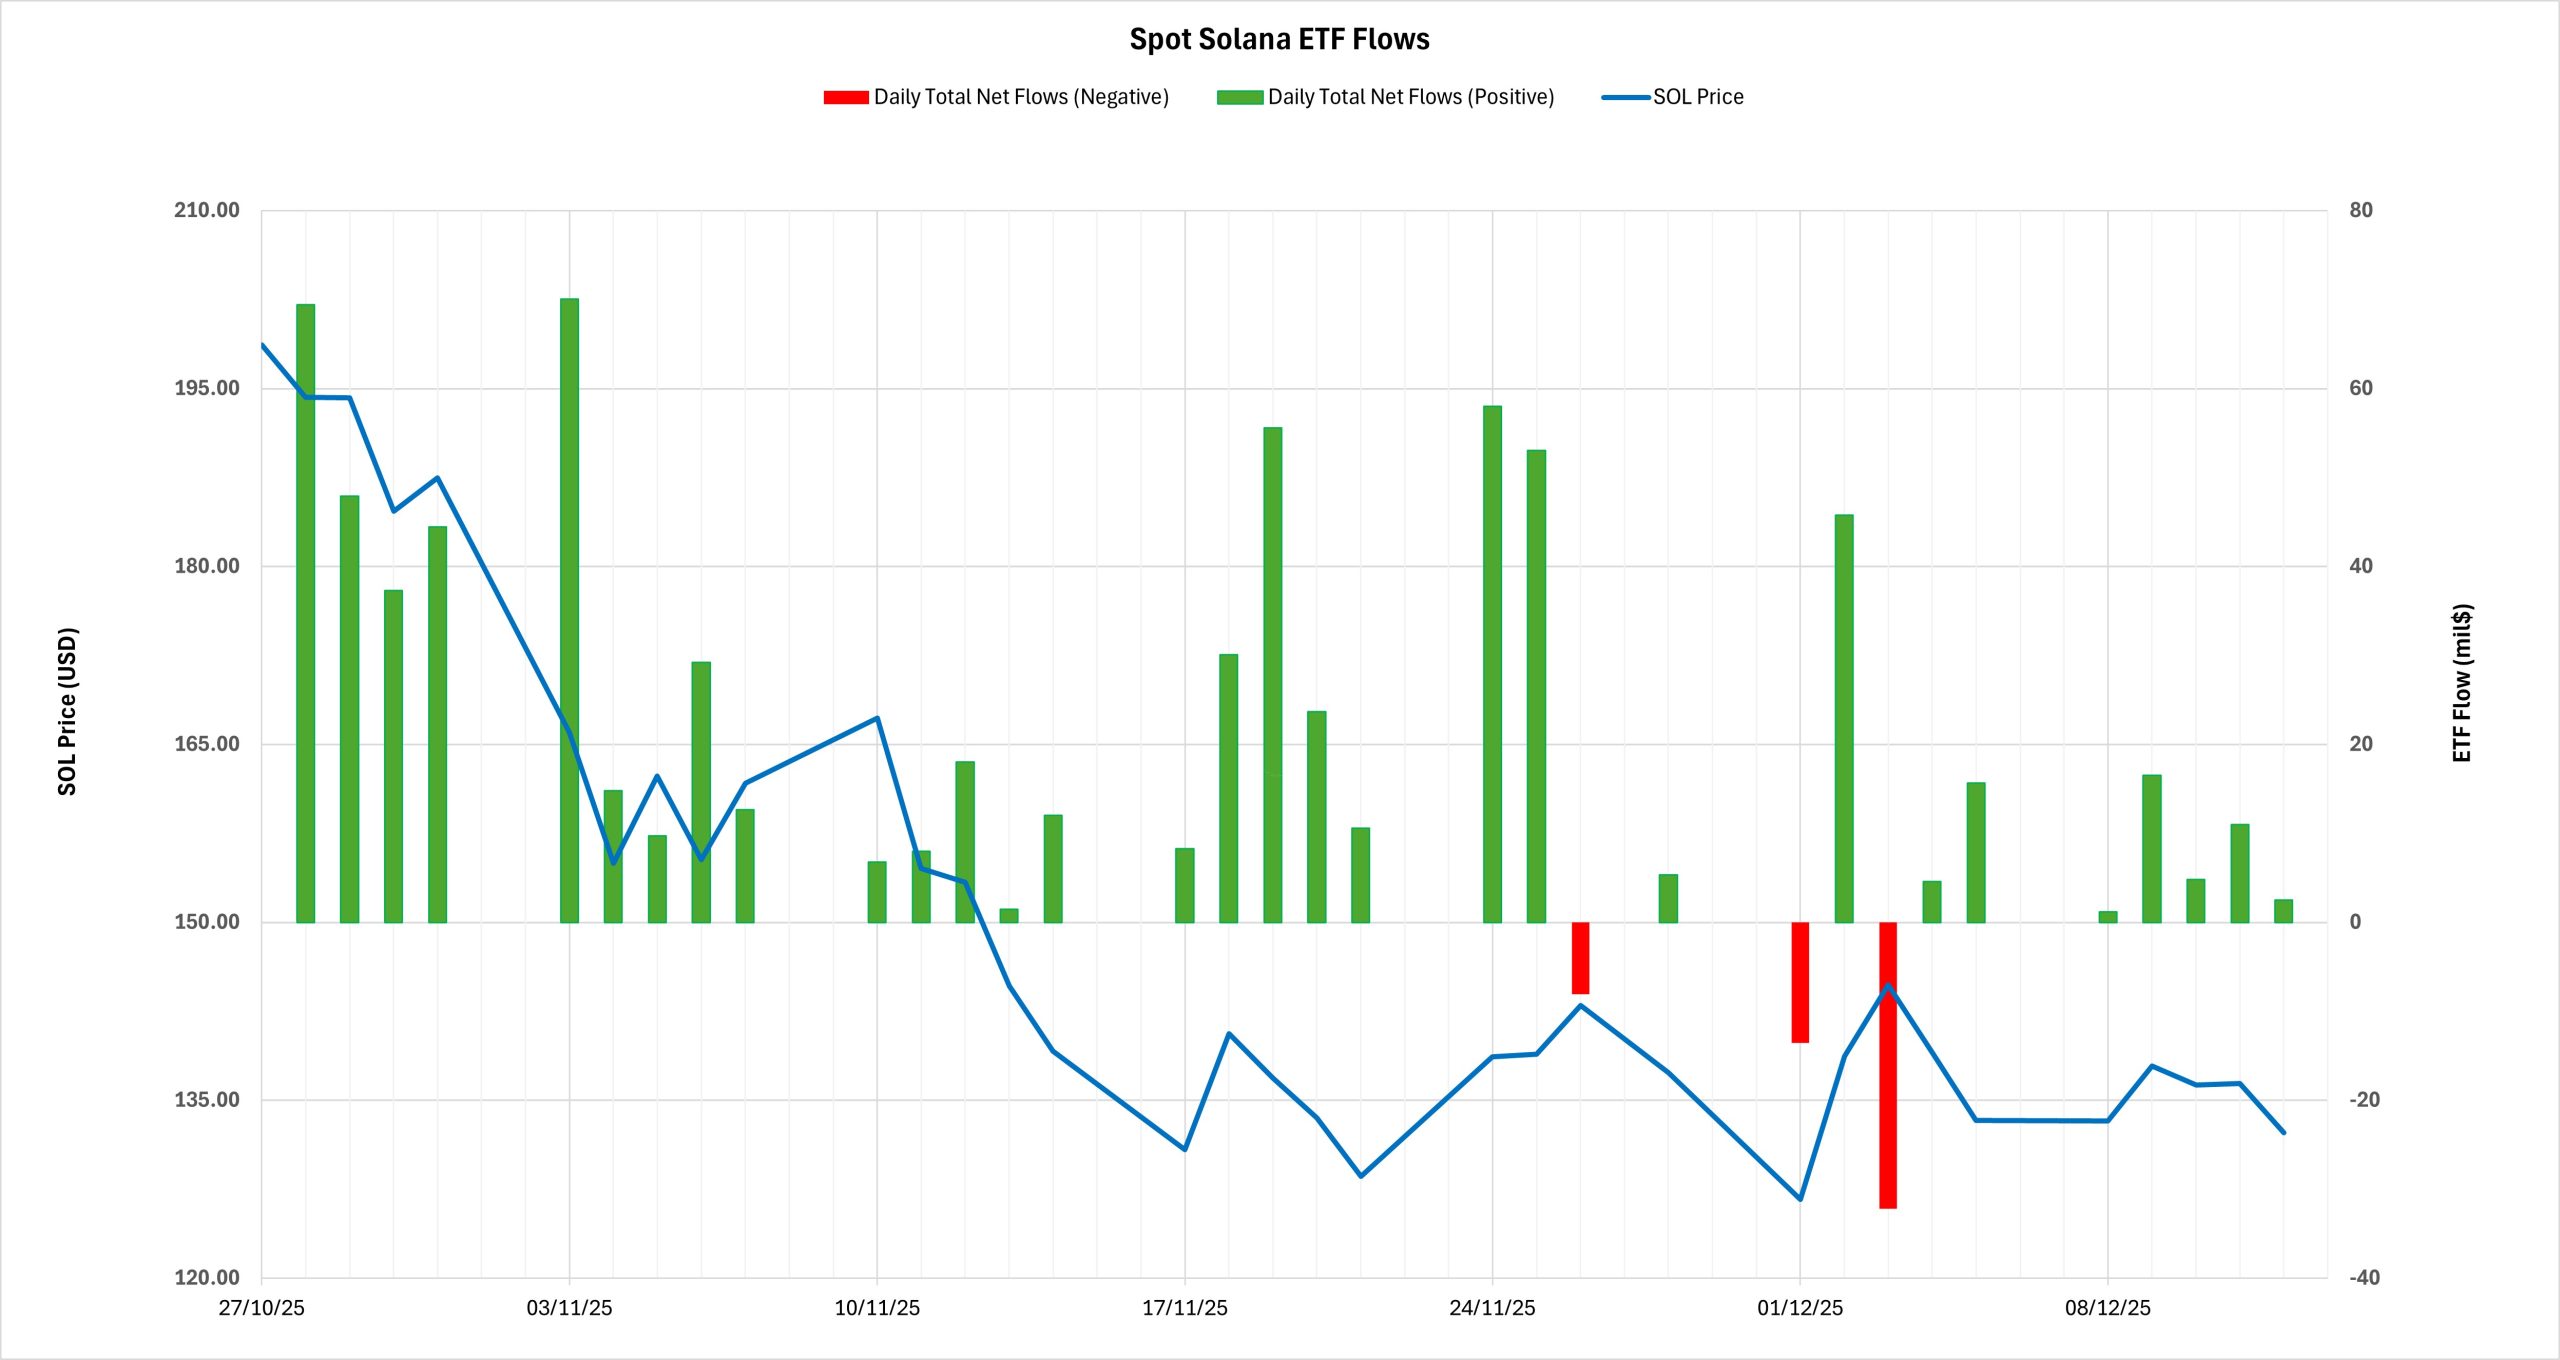
Spot Solana ETFs began trading on US exchanges as of October 28, 2025. By December 12, 2025, 33 trading days had been completed. During this period, despite high-volume and predominantly positive net inflows on the ETF side, SOL price performance diverged significantly in a negative direction.
| DATE | COIN | Opening Price | Closing Price | Change % | ETF Flow (US$m) |
|---|---|---|---|---|---|
| 10/28/2025 – 12/12/2025 | SOL | 198.70 | 132.28 | -33.43% | 674.98 |
- Launch Day Opening Price: 198.70 USD
- Last Trading Day Price: 132.28 USD
- Price Change: -33.43%
- Total ETF Net Flow: +674.98 million USD
- Number of Trading Days: 33
Source: Darkex Research Department
The key point in this process is that despite approximately $675 million in net inflows in the first month after launch, the SOL price lost more than 33% of its value. This situation showed that ETF demand was insufficient to support the spot price in the short term.
- Spot Litecoin (LTC) ETF Process and Price Change
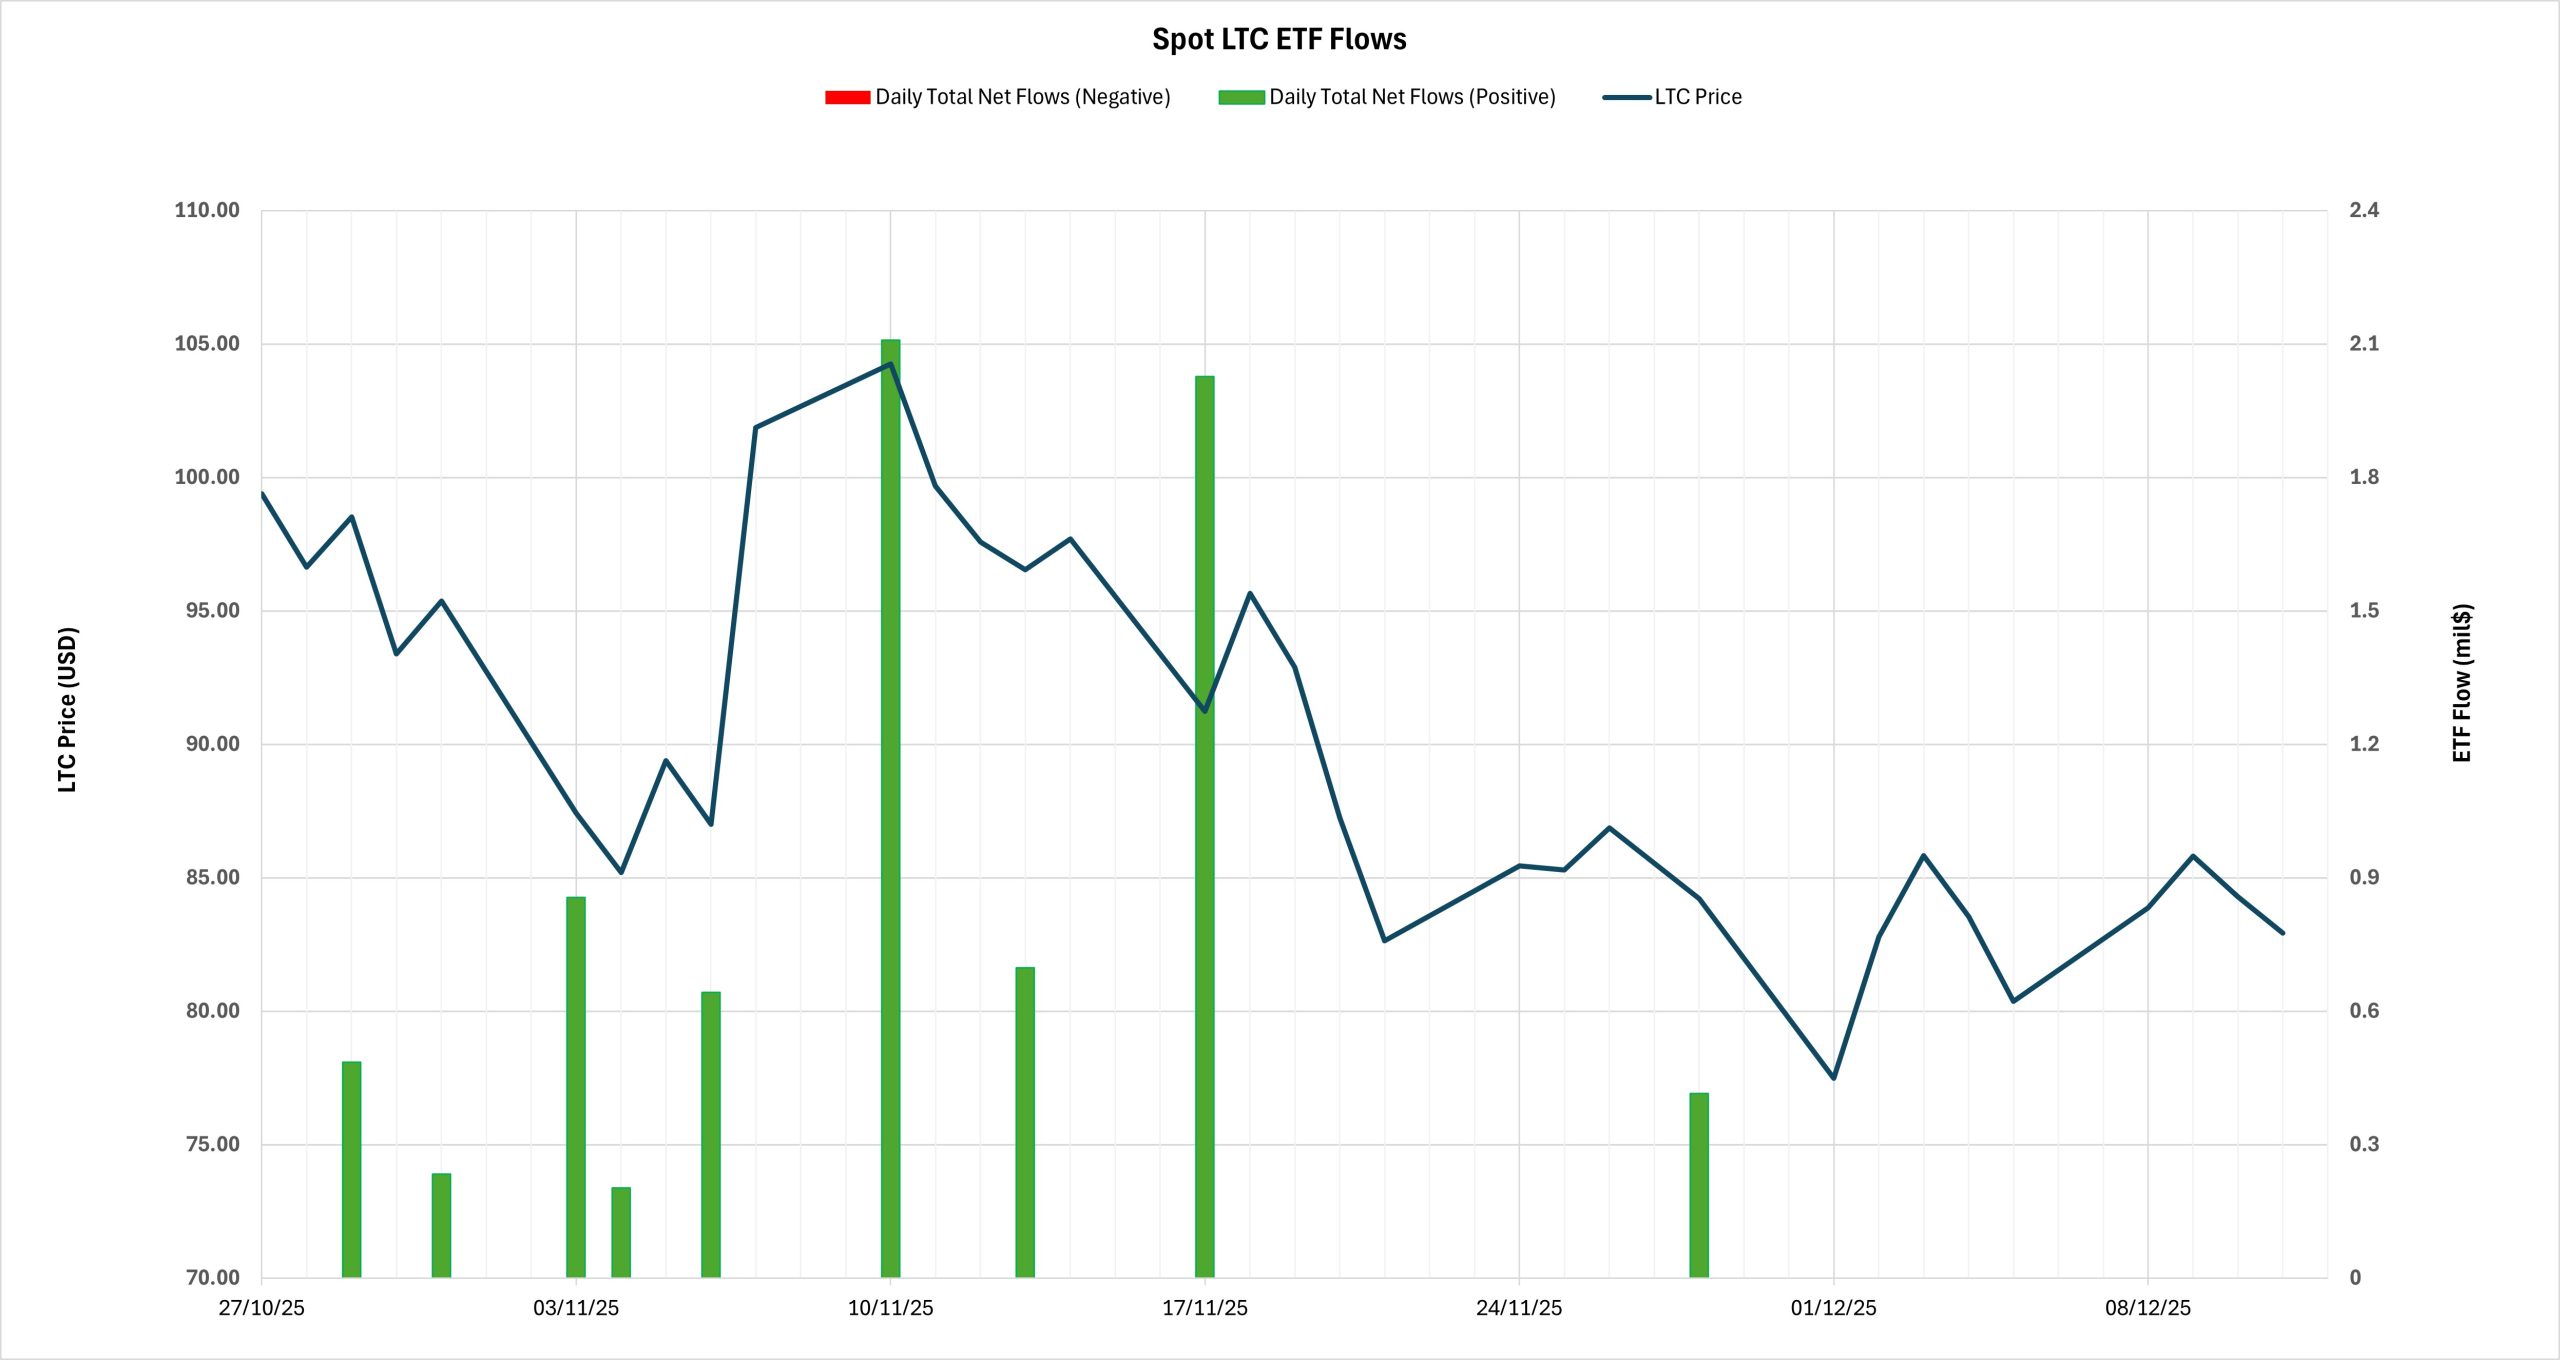
Spot Litecoin ETFs also began trading on October 28, 2025, and, similar to Solana, completed 33 trading days as of December 12, 2025. While ETF flows remained limited on the LTC side, price movements during this period were volatile and followed a downward trend.
| DATE | COIN | Opening Price | Closing Price | Change % | ETF Flow (US$m) |
|---|---|---|---|---|---|
| 10/28/2025 – 12/12/2025 | LTC | 99.40 | 81.95 | -17.56% | 7.67 |
- Launch Day Opening Price: 99.40 USD
- Last Trading Day Price: 81.95 USD
- Price Change: -17.56%
- Total ETF Net Flow: +7.67 million USD
- Number of Trading Days: 33
Source: Darkex Research Department
While ETF inflows remained low on the LTC side, price performance was also weak during this period. The impact of ETFs on pricing appeared to be limited.
- Spot Hedera (HBAR) ETF Process and Price Change
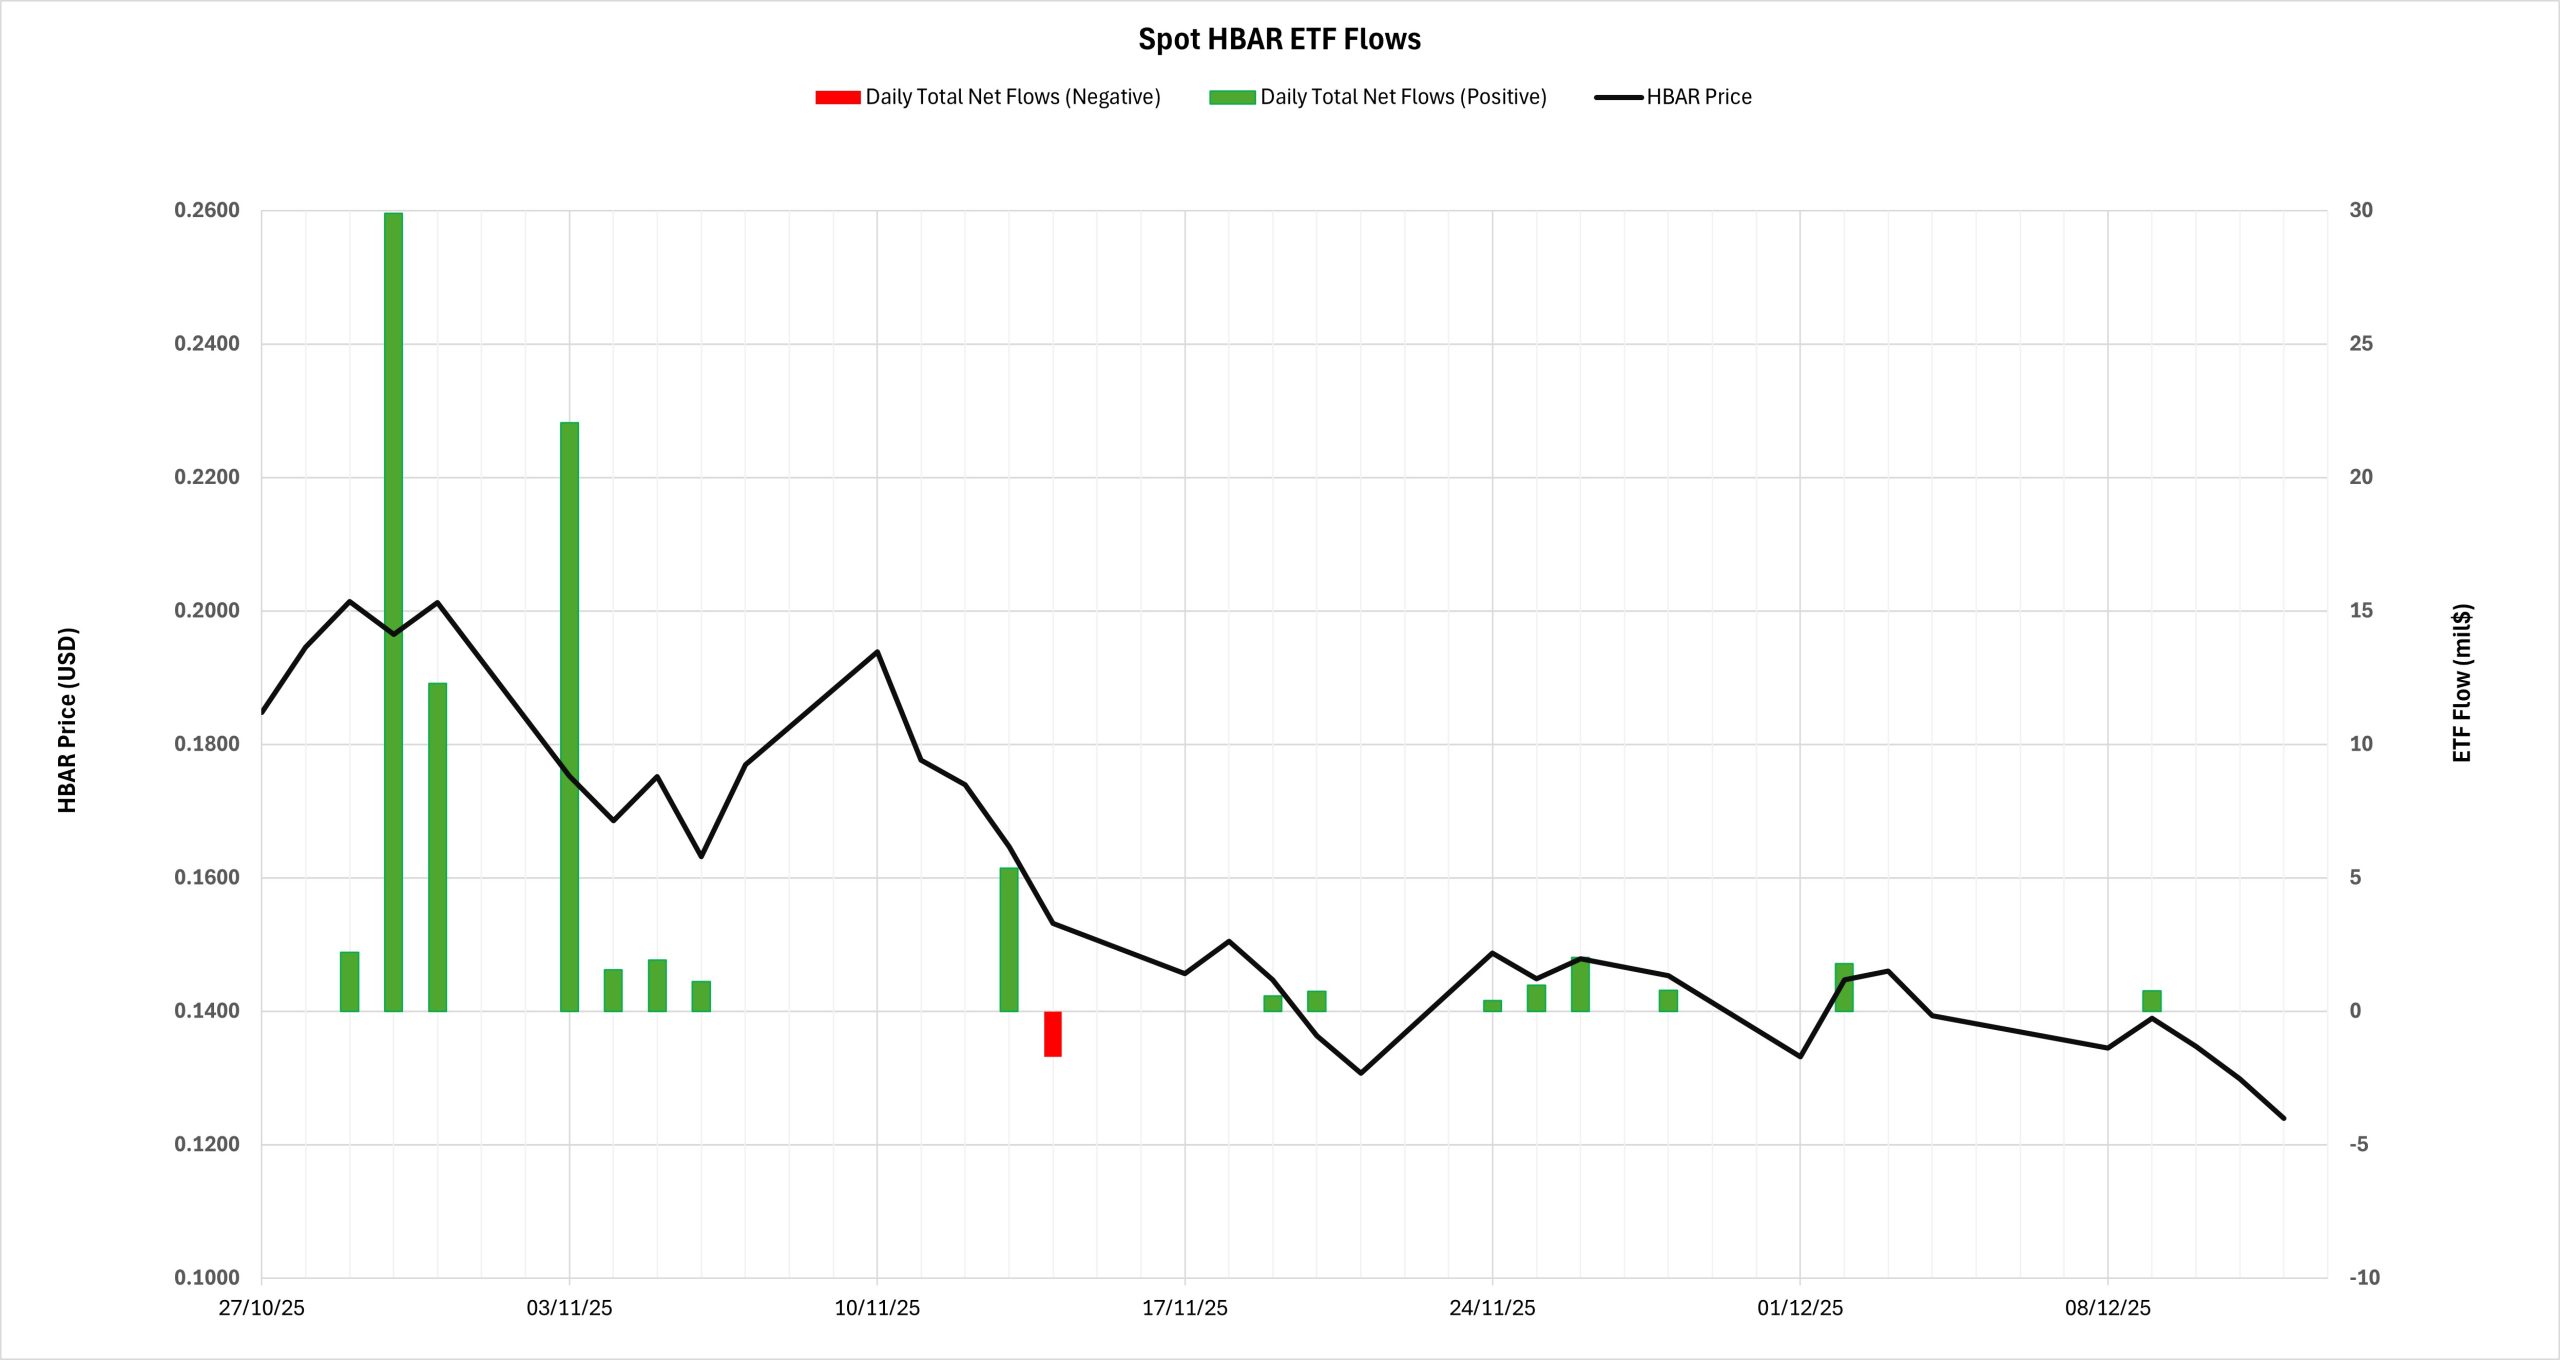
Spot Hedera ETFs also began trading as of October 28, 2025, and completed 33 trading days as of December 12, 2025. Although there were positive ETF inflows from time to time on the HBAR side, the overall price trend was downward.
| DATE | COIN | Opening Price | Closing Price | Change % | ETF Flow (US$m) |
|---|---|---|---|---|---|
| 10/28/2025 – 12/12/2025 | HBAR | 0.18 | 0.12 | -32.92% | 82.80 |
- Launch Day Opening Price: 0.1848 USD
- Last Trading Day Price: 0.1240 USD
- Price Change: -32.92%
- Total ETF Net Flow: +82.80 million USD
- Number of Trading Days: 33
Source: Darkex Research Department
Despite positive flows on the ETF side in the HBAR example, no lasting support has formed on the spot price.
- Spot Ripple (XRP) ETF Process and Price Change
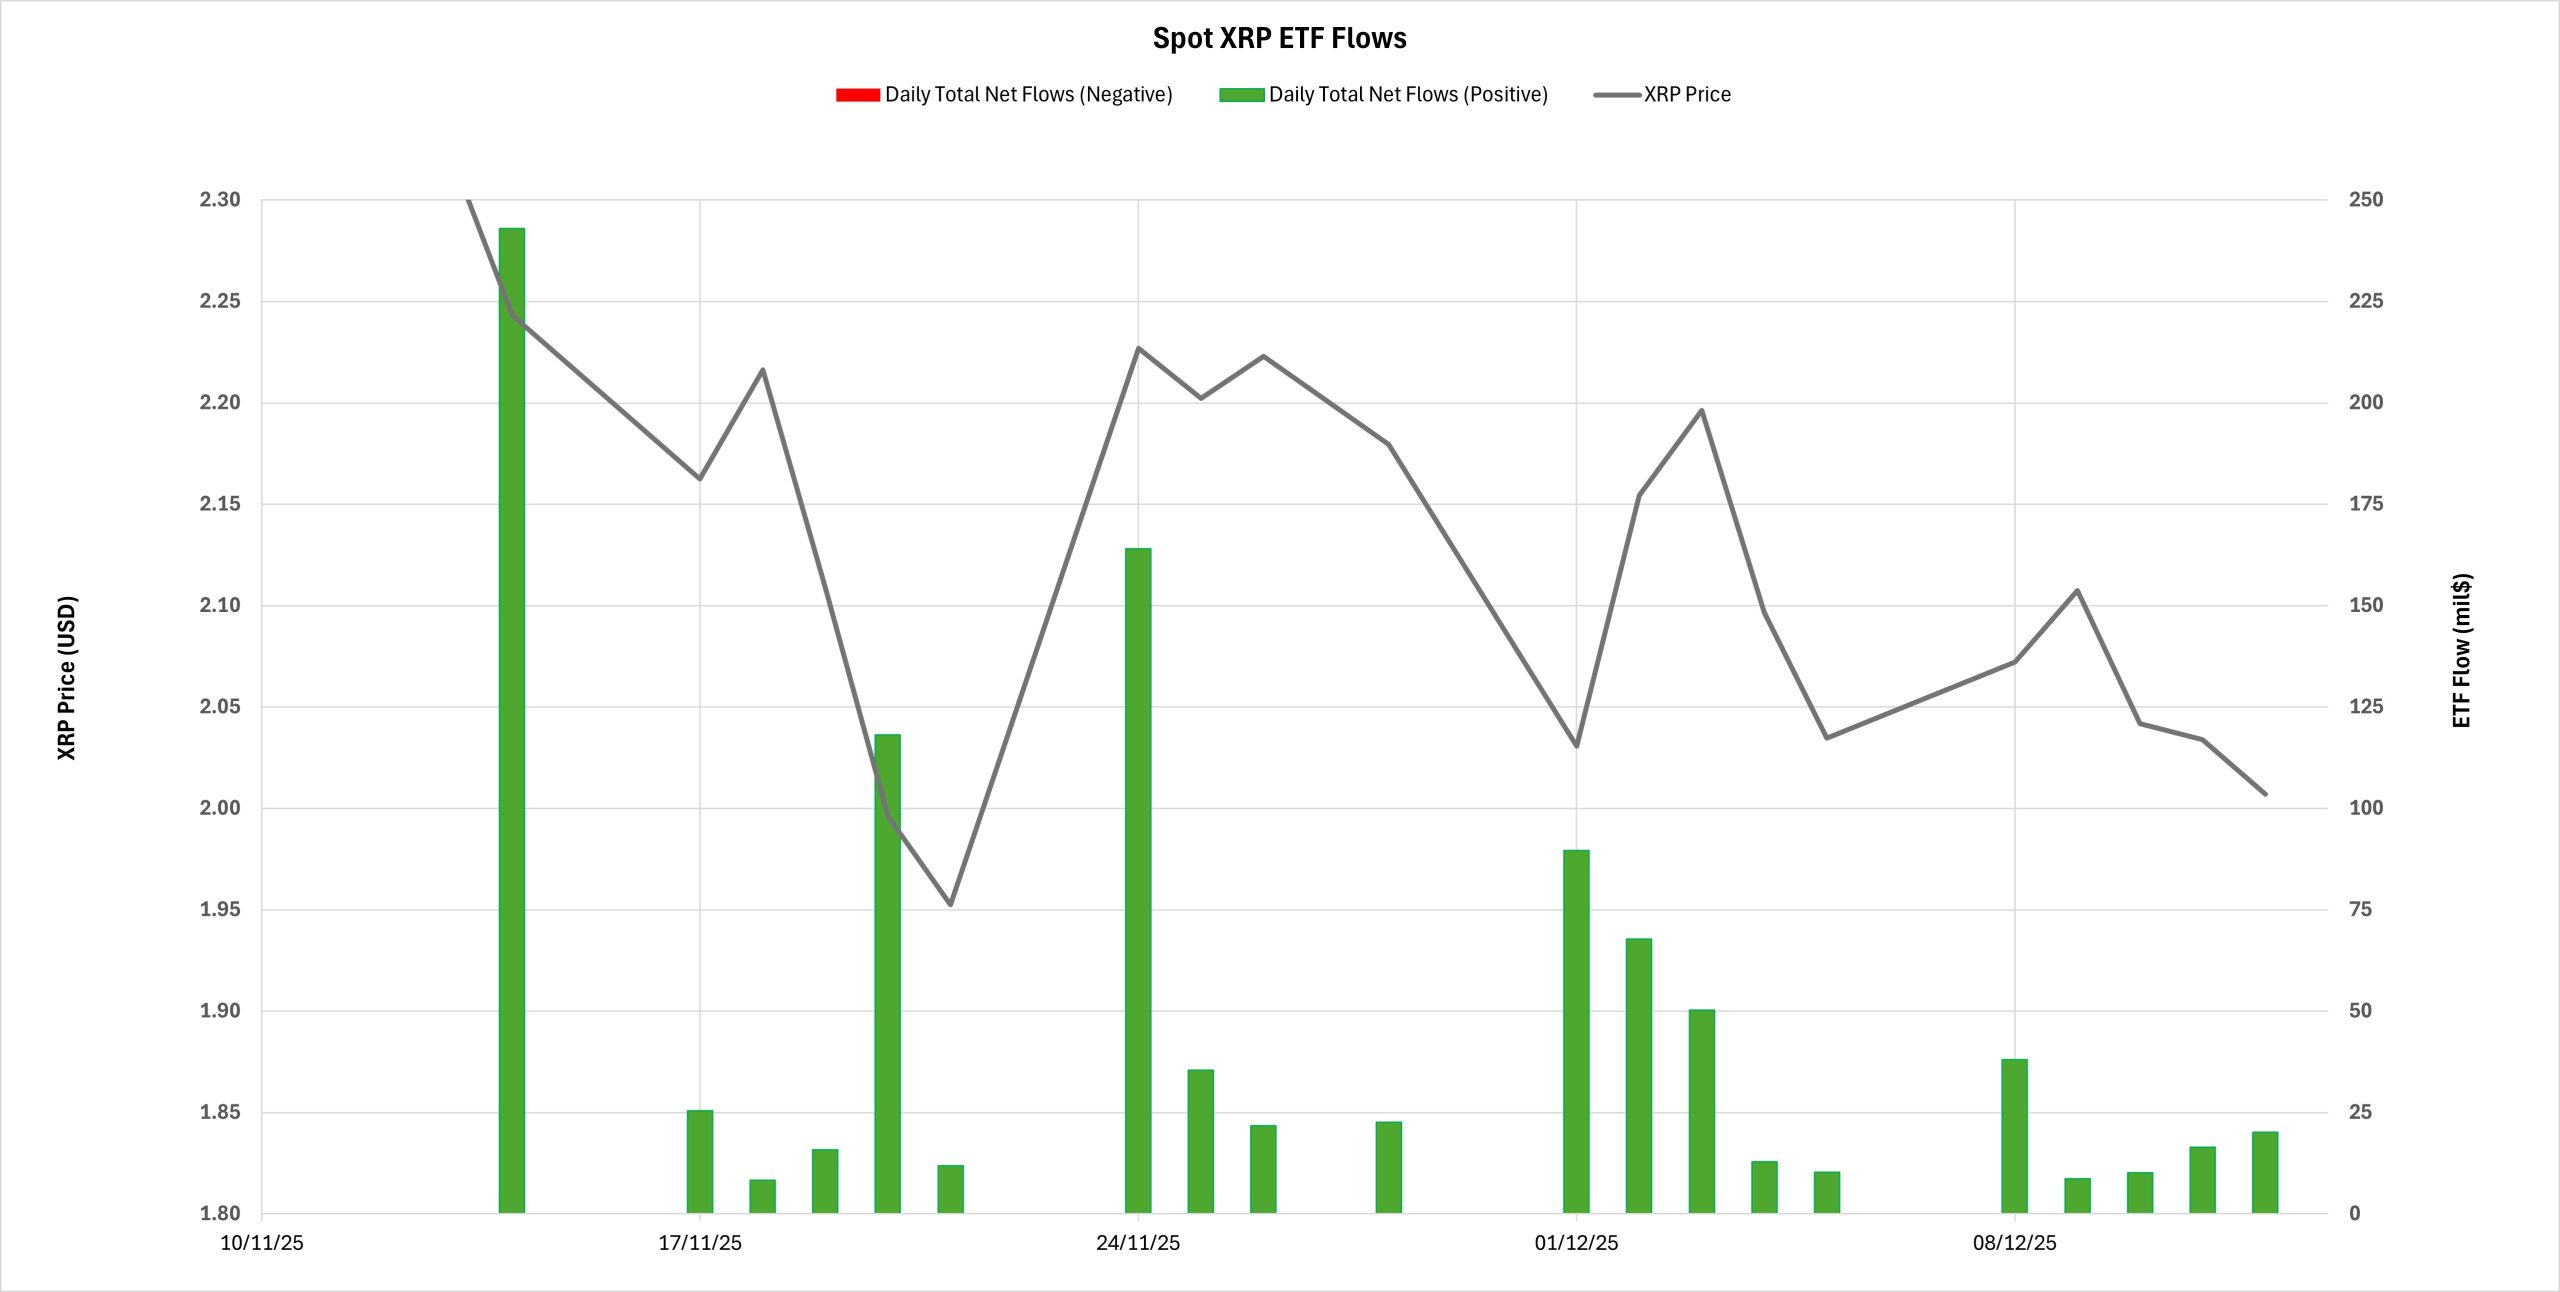
Spot Ripple ETFs began trading on November 13, 2025. As of December 12, 2025, 21 trading days have been completed. While strong inflows were seen in Spot Ripple ETFs, XRP price performance remained negative.
| DATE | COIN | Opening Price | Closing Price | Change % | ETF Flow (US$m) |
|---|---|---|---|---|---|
| 11/13/2025 – 12/12/2025 | XRP | 2.39 | 2.01 | -15.93% | 990.92 |
- Launch Day Opening Price: 2.39 USD
- Last Trading Day Price: 2.01 USD
- Price Change: -15.93%
- Total ETF Net Flow: +990.92 million USD
- Number of Trading Days: 21
Source: Darkex Research Department
Despite strong ETF inflows on the XRP side, the price remaining downward showed that the pressure prevailing in the cryptocurrency market was more effective on the price.
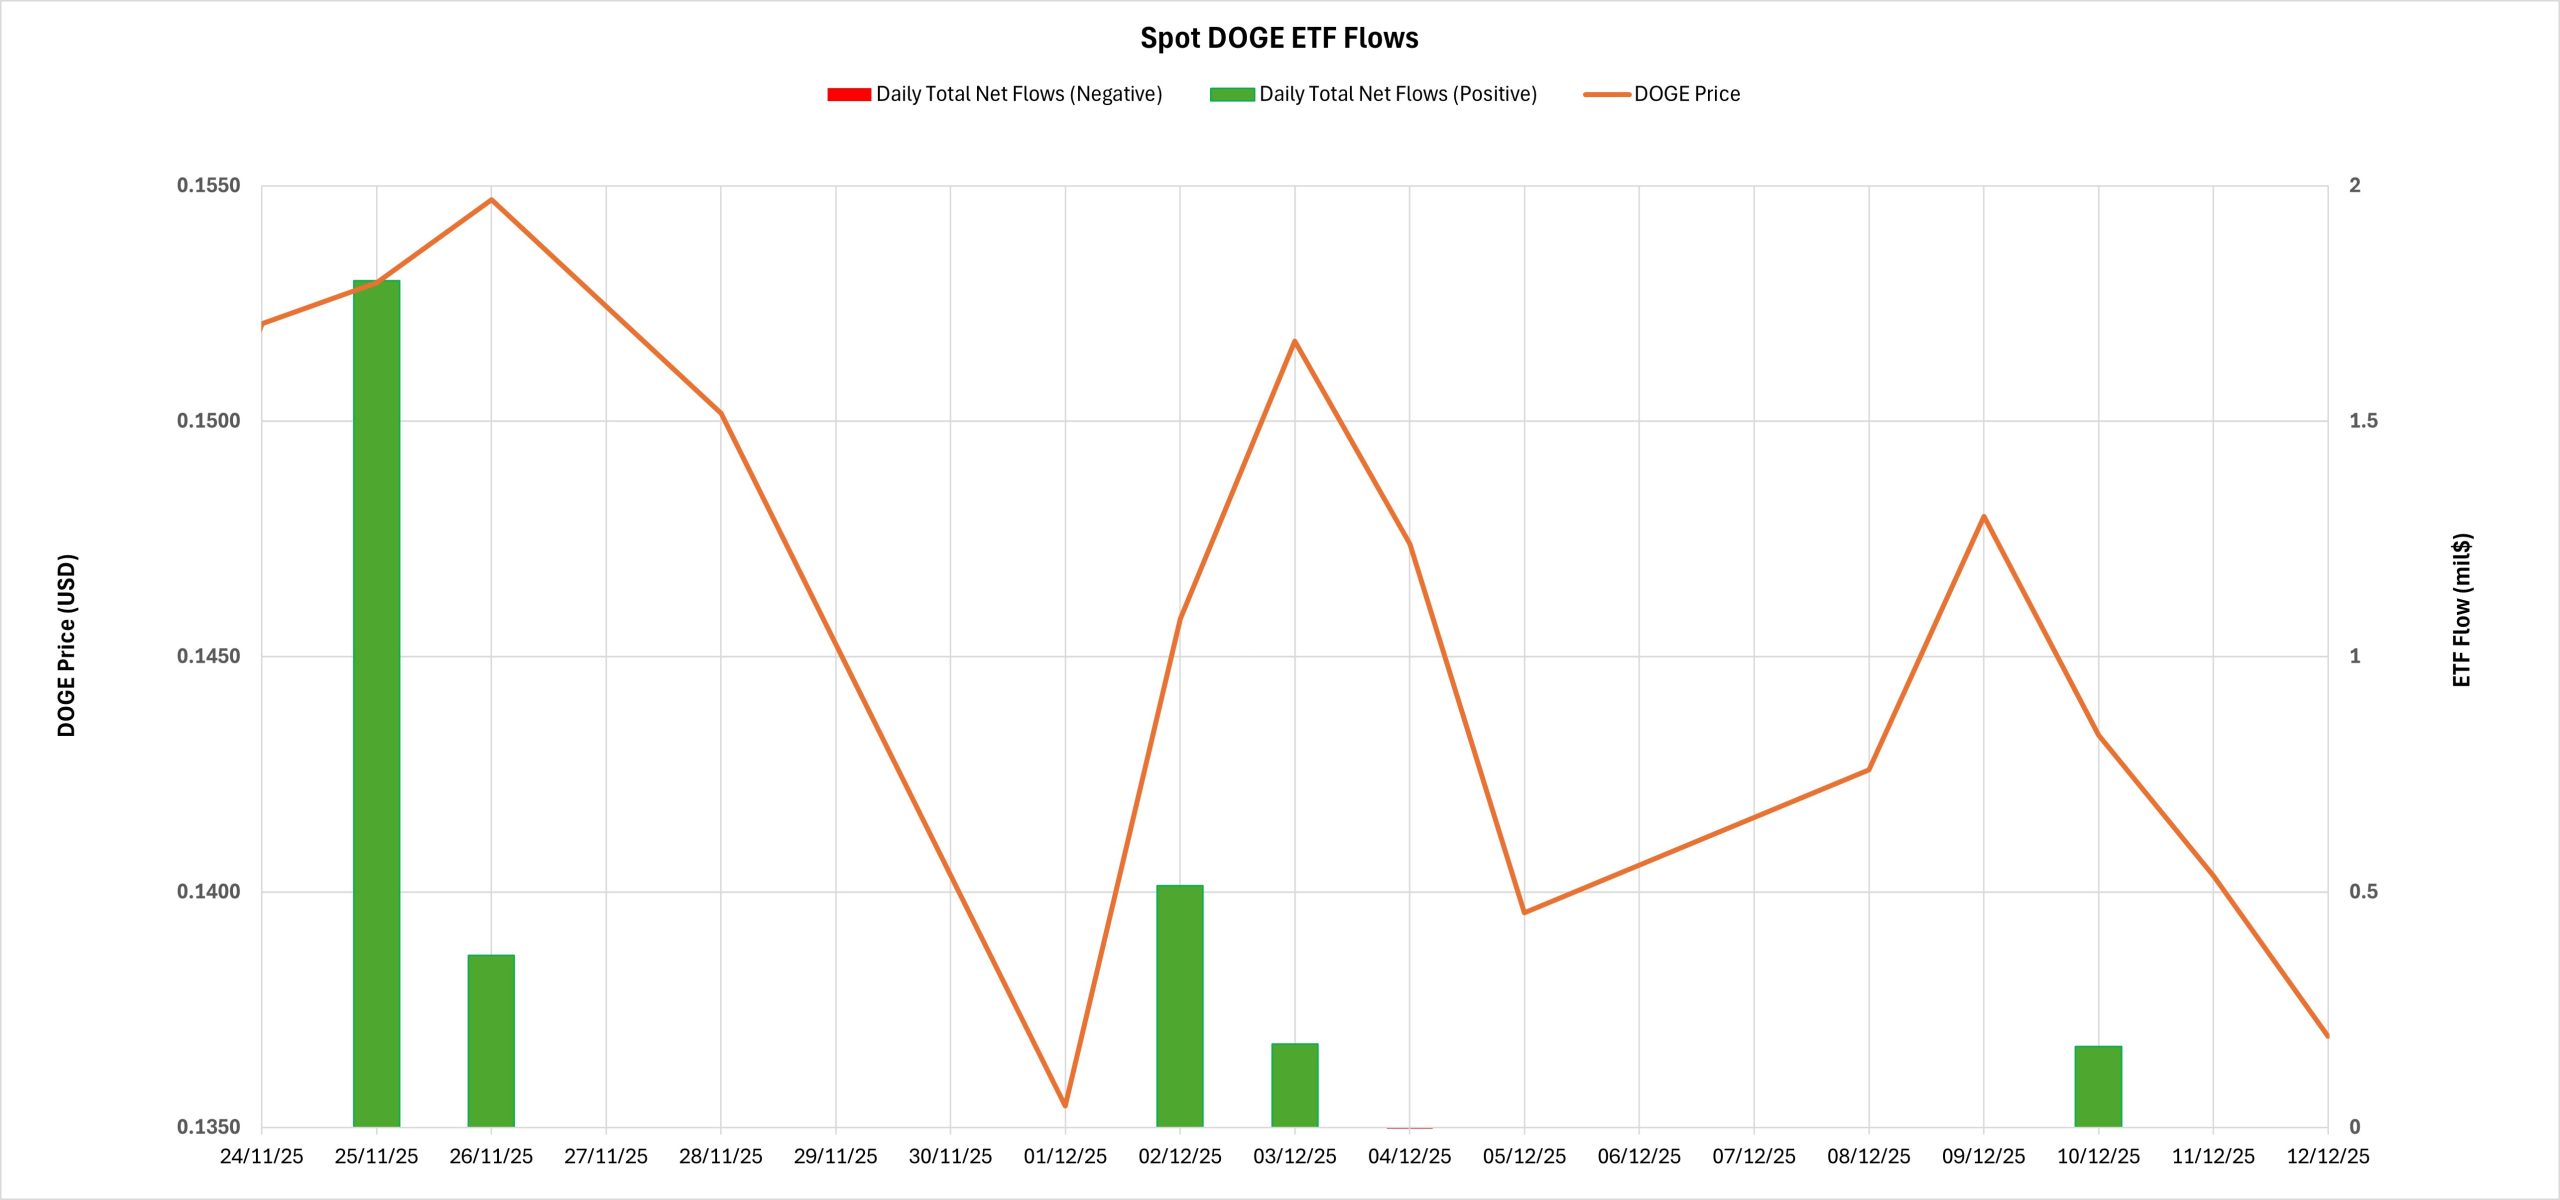
- Spot Dogecoin (DOGE) ETF Process and Price Change
Spot Dogecoin ETFs began trading on November 24, 2025. As of December 12, 2025, 14 trading days have been completed. While ETF flows on the DOGE side remained limited, the DOGE price also declined.
| DATE | COIN | Opening Price | Closing Price | Change % | ETF Flow (US$m) |
|---|---|---|---|---|---|
| 11/24/2025 – 12/12/2025 | DOGE | 0.1449 | 0.1369 | -5.52% | 2.05 |
- Launch Day Opening Price: 0.1449 USD
- Last Trading Day Price: 0.1369 USD
- Price Change: -5.52%
- Total ETF Net Flow: +2.05 million USD
- Number of Trading Days: 14
Source: Darkex Research Department
The ETF effect on DOGE prices remained limited.
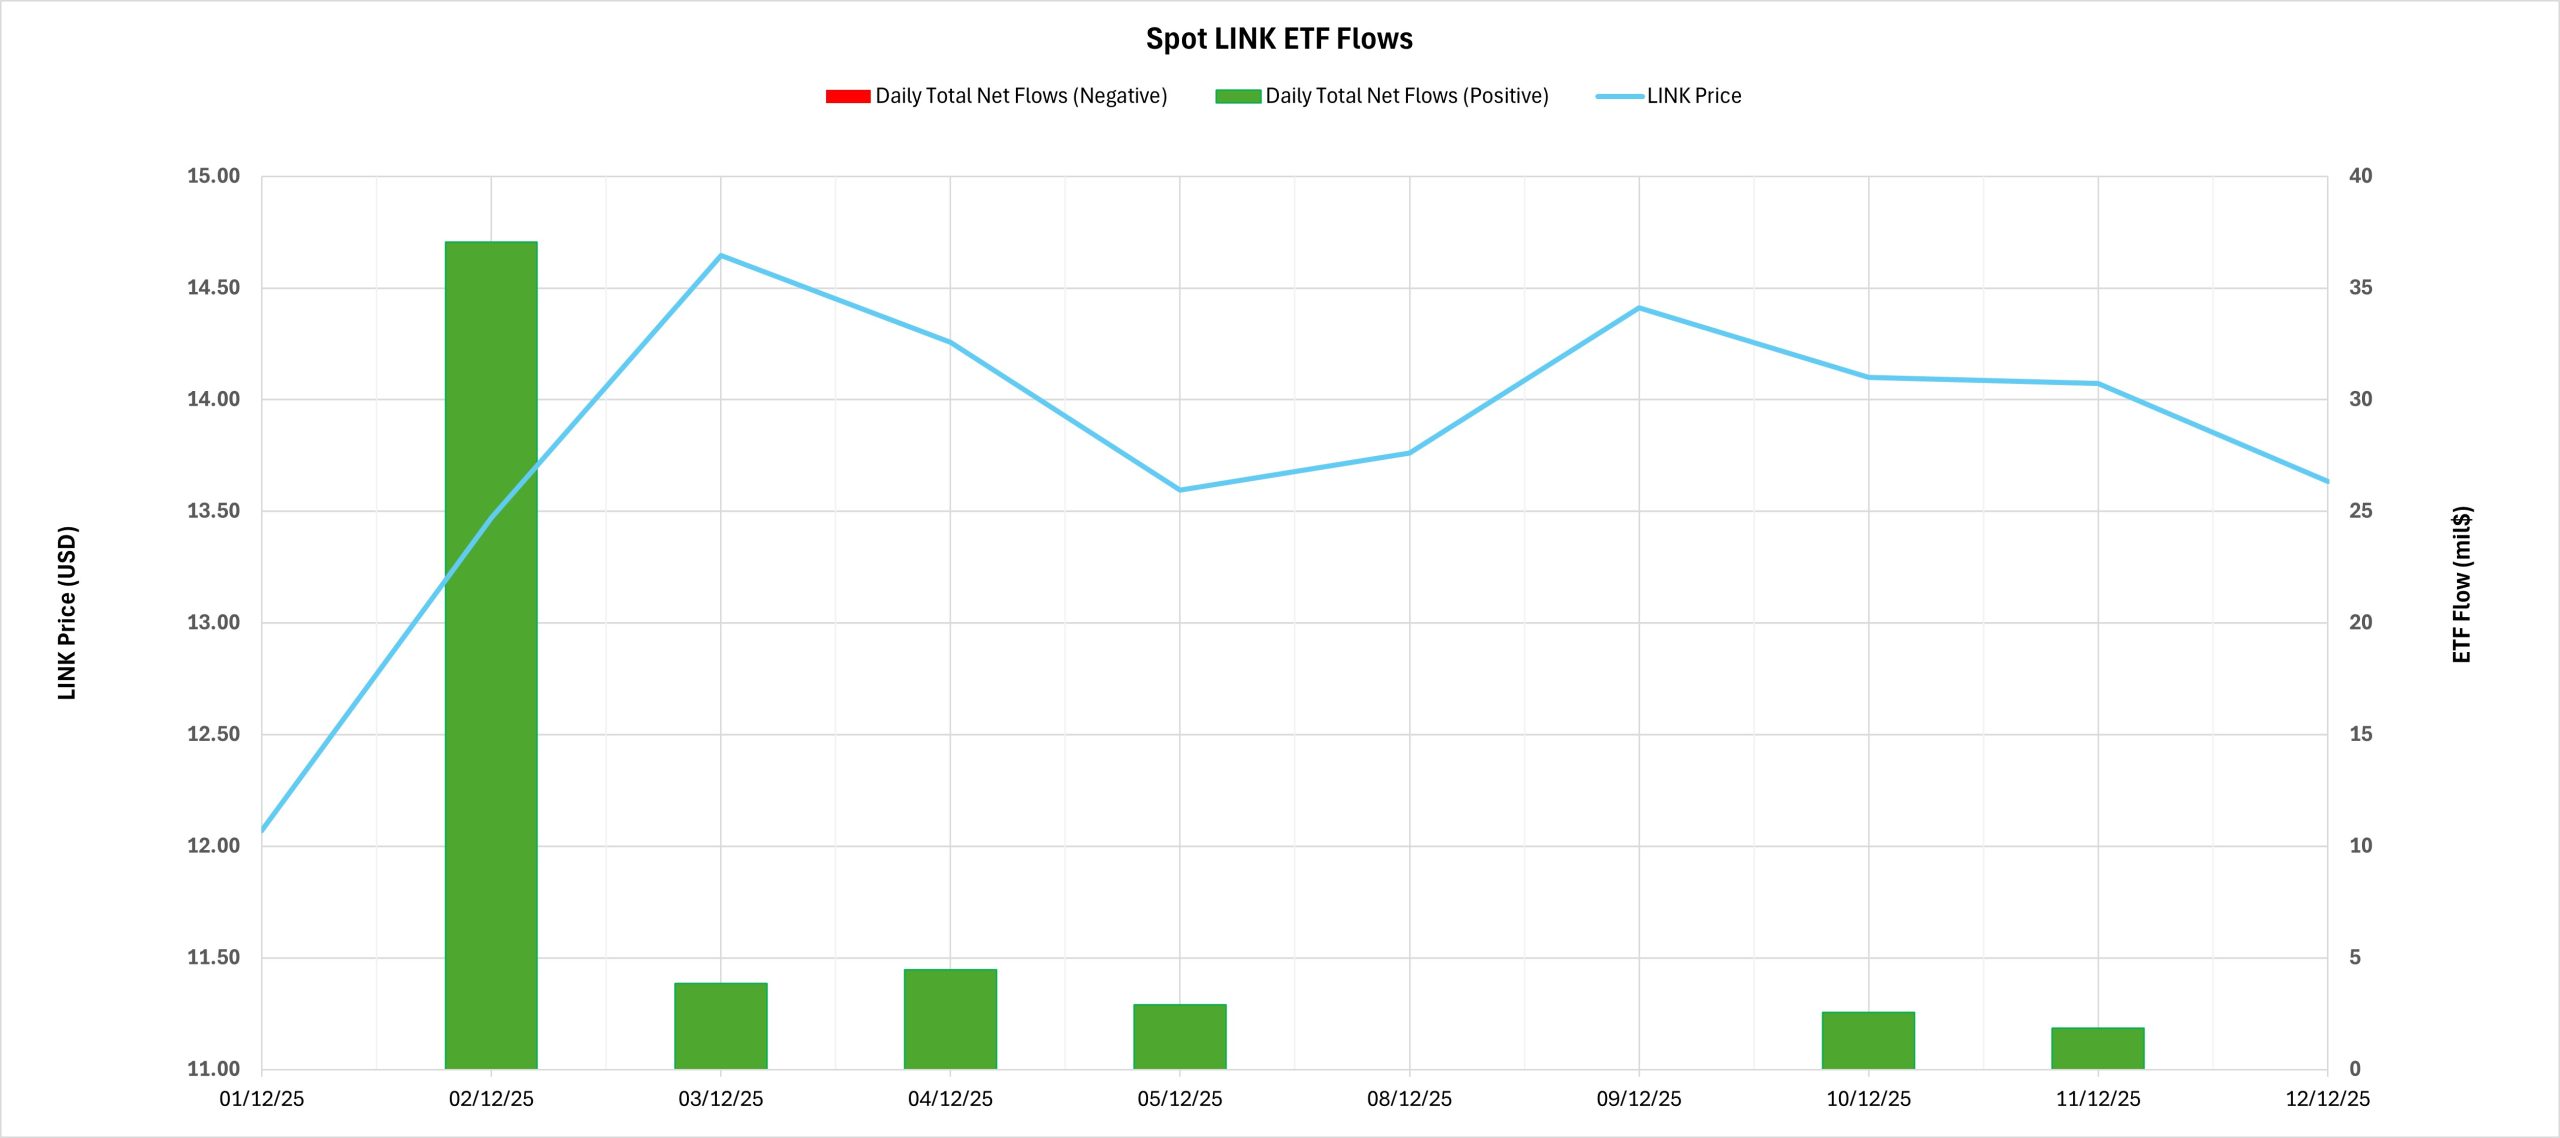
- Spot Chainlink (LINK) ETF Process and Price Change
Spot Chainlink ETFs began trading on December 2, 2025. As of December 12, 2025, 9 trading days have been completed. On the LINK side, both ETF inflows and price performance showed a more positive outlook compared to other altcoins.
| DATE | COIN | Opening Price | Closing Price | Change % | ETF Flow (US$m) |
|---|---|---|---|---|---|
| 12/02/2025 – 12/12/2025 | LINK | 12.07 | 13.63 | 12.96% | 52.67 |
- Launch Day Opening Price: 12.07 USD
- Last Trading Day Price: 13.63 USD
- Price Change: +12.96%
- Total ETF Net Flow: +52.67 million USD
- Number of Trading Days: 9
Source: Darkex Research Department
LINK emerged as the altcoin with the most consistent performance between ETF demand and price movement in the post-launch period.
- Comparison with BTC and ETH on a Trading Day Basis
In this section, we compared the price changes of BTC and ETH Spot ETFs after the initial launch period, based on the number of trading days completed for each Spot Altcoin ETF. Our goal here is to see whether the changes experienced by BTC and ETH during the ETF process are in the same direction as the performance of newly launched altcoins, and to comment on possible future scenarios using this approach.
The table below shows the price performance of BTC and ETH corresponding to the number of trading days completed since launch for each altcoin.
Table – Comparison Based on the Same Number of Trading Days After Launch
| Coin | Spot ETF Trading Days | Launch Day Opening Price (US$) | Latest Trading Day Price (US$) | Price Change Since Launch (%) | BTC Price Change Over the Same Number of Trading Days | ETH Price Change Over the Same Number of Trading Days |
|---|---|---|---|---|---|---|
| SOL | 33 | 198.7 | 132.28 | -33.43% | 33.92% | -35.34% |
| LTC | 33 | 99.4 | 81.95 | -17.56% | 33.92% | -35.34% |
| HBAR | 33 | 0.1848 | 0.124 | -32.92% | 33.92% | -35.34% |
| XRP | 21 | 2.39 | 2.01 | -15.93% | 27.10% | -21.80% |
| DOGE | 14 | 0.1449 | 0.1369 | -5.52% | 18.40% | -12.90% |
| LINK | 9 | 12.07 | 13.63 | 12.96% | 11.20% | -6.40% |
- Trading Day-Based Performance Comparisons and 2026 Outlook
Although some spot altcoin ETFs saw strong inflows after launch, the market was dominated by a downward trend due to the selling pressure and uncertainty created by macroeconomic developments affecting the cryptocurrency market, and institutional investors’ interest in ETFs had a limited impact on coin prices.
When comparing performance with BTC and ETH on a coin-by-coin basis in this section:
- SOL – BTC – ETH
SOL experienced a loss of over 33% in value at the end of the first 33 trading days, despite strong and positive net inflows on the ETF side. BTC experienced a period of strong upward momentum during its first 33 trading days, with ETF inflows clearly aligning with price movements. ETH, on the other hand, diverged negatively from BTC due to heavy outflows in the first month and remained under price pressure. While SOL’s price performance diverged negatively in the same direction as ETH, it saw distinct positive inflows in terms of ETF flows, unlike ETH.
| Coin | Net Flows (Cumulative, US$m) | SOL Price Change % | BTC Price Change % | ETH Price Change % |
|---|---|---|---|---|
| SOL | +674.98 | -33.43% | 33.92% | -35.34% |
SOL’s current outlook indicates that ETF demand is not priced in the short term, but rather carries a medium-to-long-term positioning quality. If macro conditions improve and risk appetite increases in 2026, a similar delayed pricing process to ETH may be possible.
- LTC – BTC – ETH
LTC experienced an approximate 17.5% decline in value during the first 33 trading days following the ETF launch. This performance diverged significantly from BTC, where price-flow alignment was clearly established alongside strong ETF inflows on the same trading day, while presenting a more limited negative outlook compared to ETH, where price pressure was prominent. During this period, ETF flows remained low on the LTC side, preventing the formation of a decisive support mechanism for the price.
| Coin | Net Flows (Cumulative, US$m) | LTC Price Change % | BTC Price Change % | ETH Price Change % |
|---|---|---|---|---|
| LTC | +7.67 | -17.56% | 33.92% | -35.34% |
LTC’s current outlook shows that the ETF effect has been limited in the short term and that price movements have been shaped primarily by general market trends. Looking ahead to 2026, if macro uncertainties decrease and risk appetite recovers, the impact of ETFs on the LTC price could become more apparent.
- HBAR – BTC – ETH
HBAR showed a sharp negative performance similar to SOL, losing approximately 33% of its value in the first 33 trading days after launch. During the same period, BTC entered a strong uptrend supported by ETF inflows, while ETH remained under price pressure due to heavy outflows. While HBAR’s price performance followed a trajectory closer to ETH, ETF inflows, though seen periodically, were insufficient to support the price.
| Coin | Net Flows (Cumulative, US$m) | HBAR Price Change % | BTC Price Change % | ETH Price Change % |
|---|---|---|---|---|
| HBAR | +82.80 | -32.92% | 33.92% | -35.34% |
Specifically for HBAR, this table shows that ETF demand alone is not sufficient to influence pricing and that risk appetite in the altcoin market plays a decisive role. As we enter 2026, a delayed recovery scenario for HBAR could come into play if ETF inflows stabilize and market conditions improve.
- XRP – BTC – ETH
XRP lost approximately 16% of its value in the first 21 trading days following the ETF launch. During this period, BTC showed strong positive performance over the same number of trading days, while ETH diverged negatively. Although XRP’s price performance showed a more limited decline compared to ETH, there was a clear divergence between it and BTC. The positive inflows seen on the ETF side failed to create lasting support for the price in the short term.
| Coin | Net Flows (Cumulative, US$m) | XRP Price Change % | BTC Price Change % | ETH Price Change % |
|---|---|---|---|---|
| XRP | +990.92 | -15.93% | 27.10% | -21.80% |
XRP’s current outlook indicates that ETF demand points to a medium-term accumulation process rather than short-term price movements. If uncertainties decrease and institutional interest gains continuity in 2026, the ETF effect may be reflected more clearly in the XRP price.
- DOGE – BTC – ETH
DOGE showed a more balanced performance compared to other altcoins, with a limited value loss of approximately 5.5% in the first 14 trading days after launch. On the same trading day, BTC experienced a strong rise while ETH remained in negative territory. DOGE’s price behavior presents a more neutral outlook between these two assets, and the impact of ETF flows remained limited.
| Coin | Net Flows (Cumulative, US$m) | DOGE Price Change % | BTC Price Change % | ETH Price Change % |
|---|---|---|---|---|
| DOGE | +2.05 | -5.52% | 18.40% | -12.90% |
It was observed that the impact of the ETF process on DOGE’s price is largely dependent on overall market sentiment. If risk appetite increases and speculative demand strengthens in 2026, ETFs are likely to play a supportive role in DOGE’s price.
- LINK – BTC – ETH
LINK gained approximately 13% in value during the first 9 trading days following the ETF launch, making it the only altcoin among those examined to show positive performance. On the same trading day, BTC followed a positive trend, while ETH showed negative performance. LINK’s price behavior in this early period showed that ETF demand had a faster impact on the price.
| Coin | Net Flows (Cumulative, US$m) | LINK Price Change % | BTC Price Change % | ETH Price Change % |
|---|---|---|---|---|
| LINK | +52.67 | +12.96% | 11.20% | -6.40% |
The current table for LINK indicates that the potential for the ETF effect to be reflected in pricing in the short term may be higher than for other altcoins. If ETF flows continue in 2026, LINK may maintain this positive divergence.
- Overall Assessment and Forward-Looking Perspective
Looking at the Spot Altcoin ETF process in general, we observed that the post-launch price performance of 5 out of 6 altcoins (SOL, LTC, HBAR, XRP, and DOGE) diverged negatively in a manner similar to the Spot ETH ETF process. Although there were strong and positive net inflows on the ETF side for these altcoins from time to time, this demand did not sufficiently reflect on spot prices in the short term. This situation showed that ETF demand alone was not sufficient to push pricing up. We saw that macroeconomic conditions, market risk appetite, and general crypto market sentiment continued to be decisive on pricing.
When examining the Spot ETH ETF process for SOL, LTC, HBAR, XRP, and DOGE, it is clearly evident from Spot ETH ETF and ETH price data that a meaningful and lasting positive effect on price emerged not immediately after launch, but approximately one year later. The consecutive high net inflows observed in Spot ETH ETFs after approximately 250 trading days contributed to ETH gaining upward momentum and reaching new peak levels. Technical updates and network developments within the ETH ecosystem during this period also played a supportive role in pricing. Similarly, in the Spot BTC ETF process, while the first months after the launch were characterized by volatility, the main strong institutional inflows and their significant impact on the price emerged after approximately 200 trading days.
Considering these historical examples, a similar timing pattern is likely to emerge for SOL, XRP, HBAR, LTC, and DOGE. The year 2026 may be more of a transition year for these altcoins, characterized by institutional positioning and accumulation, rather than a period when the ETF process fully reflects on prices. A reduction in macroeconomic uncertainty, a renewed appetite for risk, and technical and fundamental developments in the relevant ecosystems could accelerate the visibility of the ETF effect. In this context, new peak levels could emerge for some altcoins before 2027.
Spot LINK ETFs, on the other hand, showed a divergent pattern from other altcoins in the post-launch period. The early alignment between ETF demand and price movement for LINK revealed a structure reminiscent of the early days of the Spot BTC ETF process. In Spot BTC ETFs, the acceleration of institutional inflows approximately 10 months after launch paved the way for the impact on price to become clear. From this perspective, the effect of ETF demand on pricing could emerge earlier and more strongly in the case of LINK.
In conclusion, while Spot Altcoin ETFs are still in an early stage, they hold significant potential for increasing institutional interest in the long term. Considering that the impact of ETF processes on prices is spread over time, the fourth quarter of 2026 in particular could be a more dynamic and decisive period for Spot Altcoin ETFs. However, developments within the ecosystems of the altcoins themselves could also pave the way for this process to occur earlier or more strongly.