
Global Gold Map: The Beginning of October 2025
The record purchases of nearly a thousand tons by central banks rapidly increasing the share of gold in their reserves pushed gold prices to new highs in 2025. The ounce price reached $4,381, marking a historic record. Expectations of interest rate cuts from major central banks—led by the Fed—rising inflation concerns, and global geopolitical uncertainty played a decisive role in this price surge.
In 2024, total gold demand reached an all-time high of 4,974 tons, while global supply rose by only 1%, failing to meet demand. Purchases by central banks such as Poland, China, and Turkey, along with strong inflows into gold ETFs and physical investments, supported this trend.
The global map of gold continues to be shaped by monetary authorities’ decisions, especially those of the Fed, the European Central Bank, and the People’s Bank of China—while regulatory steps such as India’s jewellery import tax cuts and China’s licensing reforms continue to influence pricing.
Technical Analysis and Price Trends
Starting from April 2025, when gold fell under selling pressure at the $3,500 level, the ounce price remained horizontal until the end of August. However, supported strongly from the $3,300 level, it entered a recovery trend and broke upward from its descending trend as of August 28. Following this breakout, the precious metal showed a strong positive momentum, reaching $4,381 on October 20, marking a new all-time high (ATH).
However, on October 21, gold faced a sharp correction, declining by 6.3%, the largest single-day drop since 2013. As of October 22, the downward trend continued, with the price retreating toward the $4,000 psychological support level. Yet, gold managed to stay above the EMA 20 level, showing a limited recovery to around $4,100.
Currently trading around $4,100, technical indicators for gold show mixed signals. The Relative Strength Index (RSI) has remained above 70 since September, indicating an overbought zone and maintaining the risk of ongoing selling pressure. Following recent pullbacks, RSI’s drop below 60 signals growing short-term selling pressure.
Within the current technical setup, if selling continues, the price could retreat back to the $3,940 support level. A downward break of this level could bring $3,720 and $3,500 into focus as critical supports.
Conversely, if buying appetite remains and market sentiment strengthens, gold is expected to first test the $4,180 resistance level. Surpassing this could lead to a move toward $4,381 (ATH) and then $4,600.
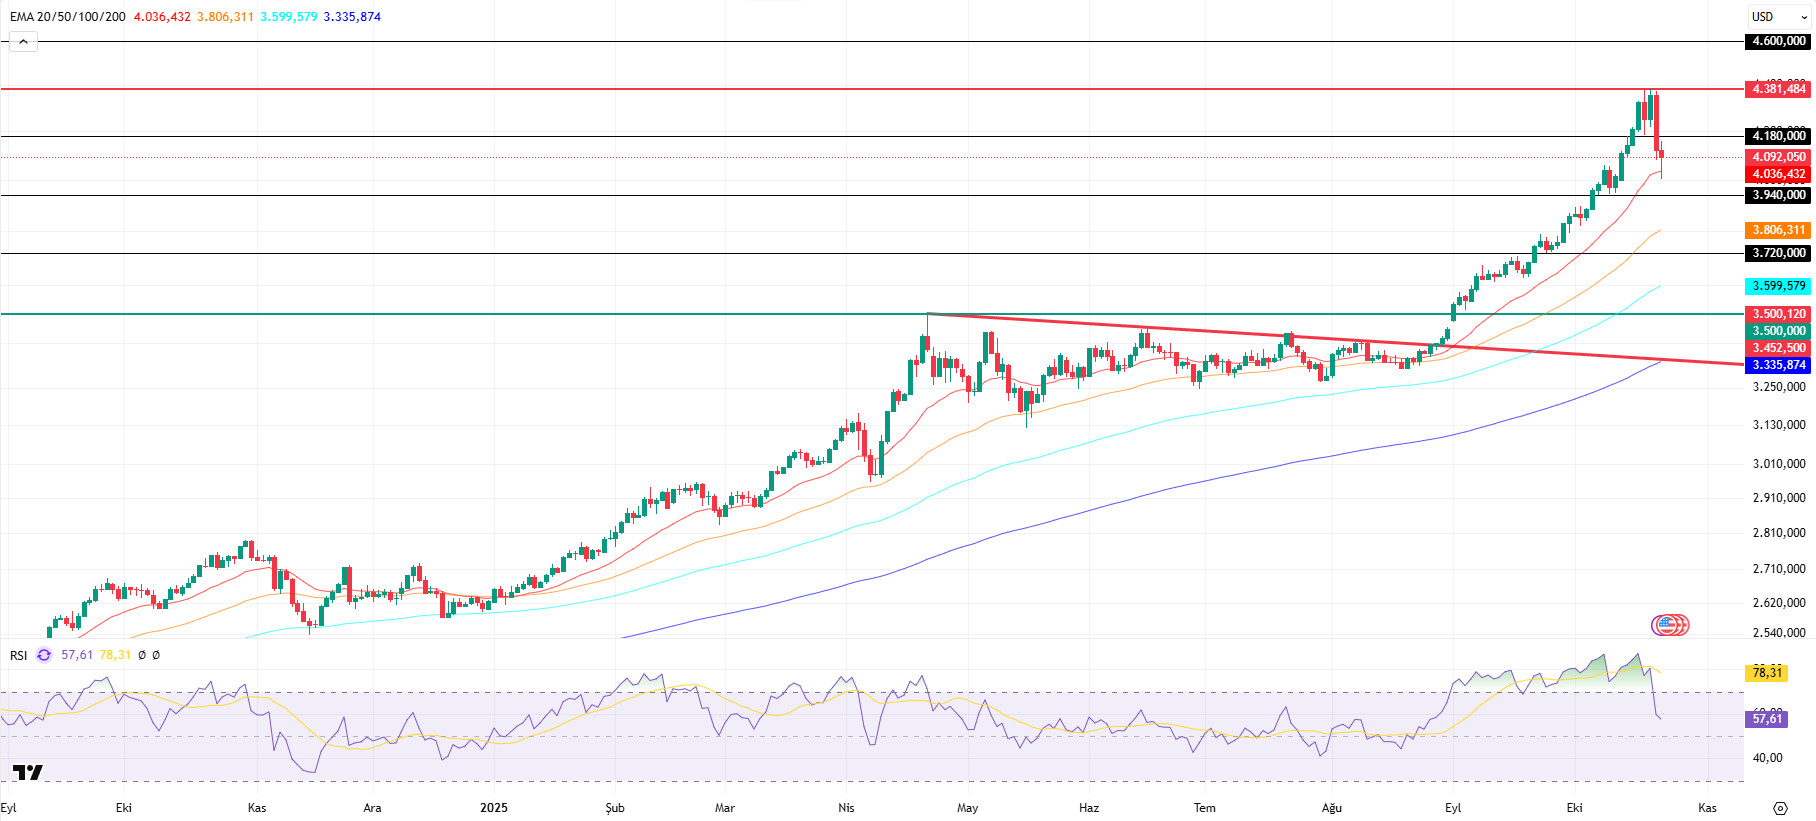
EMA 20 (Red line), EMA 50 (Yellow line), EMA 100 (Blue line), EMA 200 (Purple line)
Supports: 3,940 – 3,720 – 3,500
Resistances: 4,180 – 4,381 – 4,600
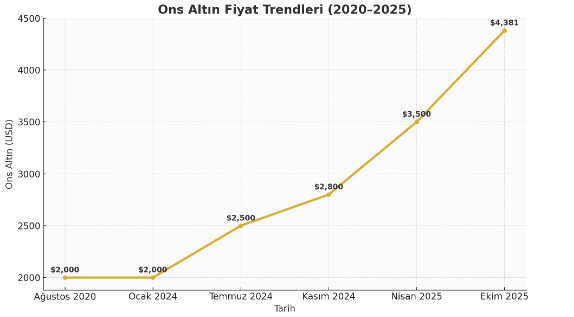
Between August 2020 and January 2024, gold prices hovered around $2,000, with strong dollar performance and unchanged global interest rates limiting upside potential.
By July 2024, prices gained upward momentum, reaching $2,500 per ounce. This rise was driven by the Fed’s rate-cut signals, rising geopolitical risks, and sustained central bank demand.
In November 2024, gold rose to $2,800 per ounce, accelerating as investors sought safe havens.
By April 2025, the price climbed to $3,500, breaking previous records—driven largely by Asian central bank purchases and rising inflation fears.
Finally, as of October 2025, gold hit $4,381, its highest level in history. This rise coincided with an era of intensified global uncertainty, the beginning of interest rate cut cycles, and renewed investor focus on capital preservation.
Overall, during 2020–2025, gold moved sideways for a long time but entered a strong bull market from the second half of 2024, gaining over 120% in value.
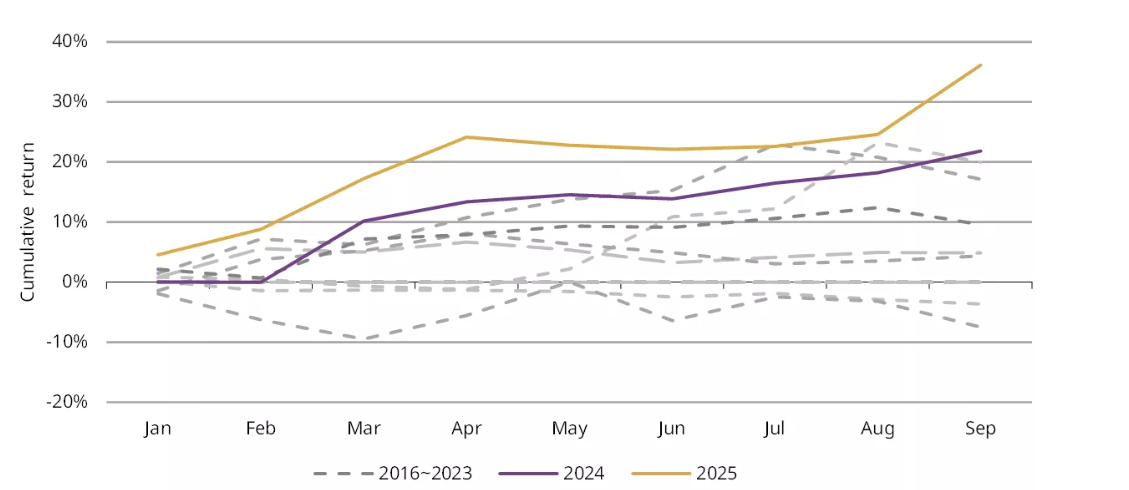
Source: Shanghai Gold Exchange, World Gold Council
An analysis of the SHAUPM chart between 2016 and 2025 indicates that we are currently in the year when gold demand within China has been most rewarded, suggesting that this ongoing FOMO-driven movement does not yet appear to show negative signs.
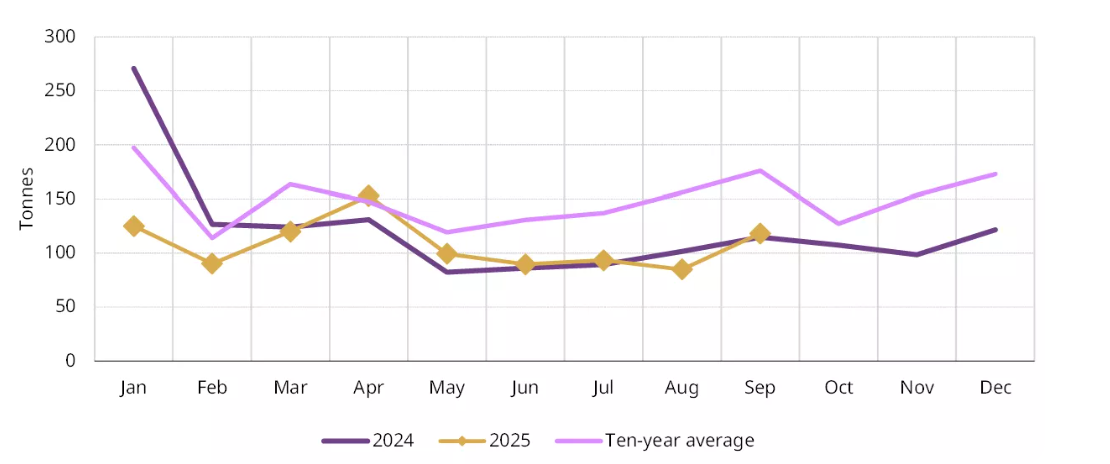
Source: Shanghai Gold Exchange, World Gold Council
Ongoing political tensions, the weakening of the U.S. dollar, and volatility in the options market drove gold to reach a new all-time high for the 39th time in 2025, with daily average trading volumes hitting $388 billion. The strong gold price rally became the main driver of regional demand for gold ETFs.
Despite rising inflation, the European Central Bank (ECB) and the Bank of England (BoE) kept interest rates unchanged, which lowered real yields and increased policy uncertainty. Investors’ efforts to protect their purchasing power indicate that capital flows were both defensive and momentum-driven.
According to data from the Shanghai Gold Exchange, investors exited short-term positions in October. Meanwhile, ongoing trade, policy, and geopolitical risks show no signs of easing. Stock markets reached new highs, and despite resilience against recent macroeconomic surprises, investors appear to be positioning for a potential pullback.
The desire of investors to add safe-haven assets to their portfolios may have supported gold demand. As a proven asset with competitive returns, gold has delivered performance comparable to equities and has consistently outperformed bonds since 1971.
Opportunities in ETFs
Gold-backed ETFs and similar products make up a significant portion of the gold market, serving as tools for both institutional and retail investors to implement a wide range of investment strategies. Flows into ETFs often reflect both short- and long-term outlooks as well as investors’ willingness to hold gold.
Physically backed gold ETFs recorded their highest monthly inflows on September 1, achieving a record quarterly total of $26 billion. During this period, the U.S. dollar remained weak and is now facing additional pressure from the government shutdown. However, the dollar currently appears technically and positionally oversold, posing a short-term squeeze risk.
With the Fed’s 25-basis-point rate cut earlier in the month and growing expectations of declining yields in the near future, market sentiment has further supported gold. Investors continue to price in at least one -and very likely two- additional rate cuts by year-end, maintaining bullish momentum for gold.
Disclaimer
This report is provided for informational and educational purposes only and does not constitute financial, investment, or trading advice. The data, analyses, and opinions presented herein reflect general market observations as of the publication date and may change without notice. Past performance is not indicative of future results.
Trading and investing in commodities such as gold involve significant risk, including the potential loss of principal. Readers should conduct their own research or consult with a licensed financial advisor before making any investment decisions.
Darkex and its affiliates make no warranties regarding the accuracy, completeness, or reliability of the information contained in this report and shall not be liable for any losses or damages arising from its use.