
Weekly Bitcoin Onchain Report – November 26
Active Addresses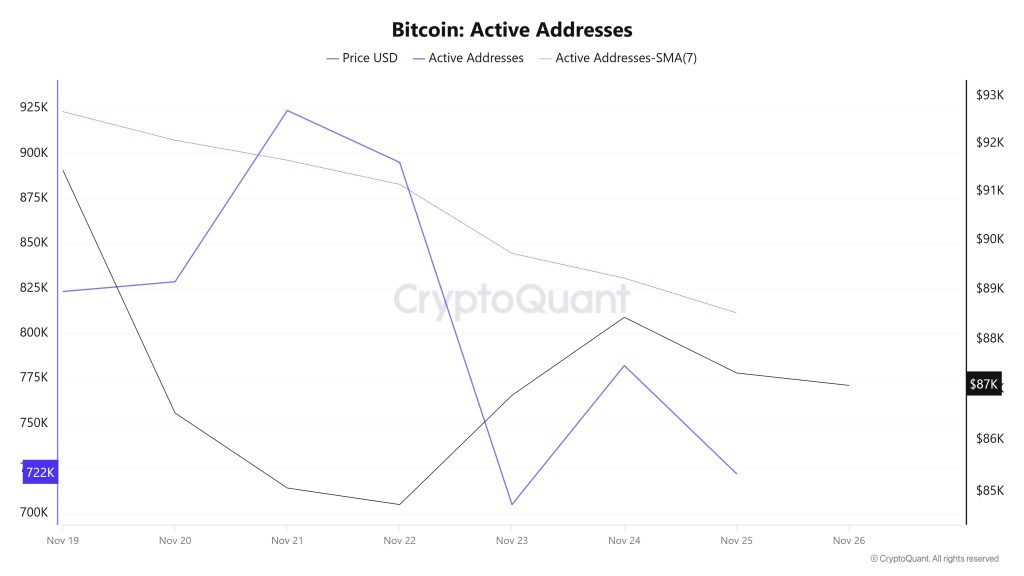
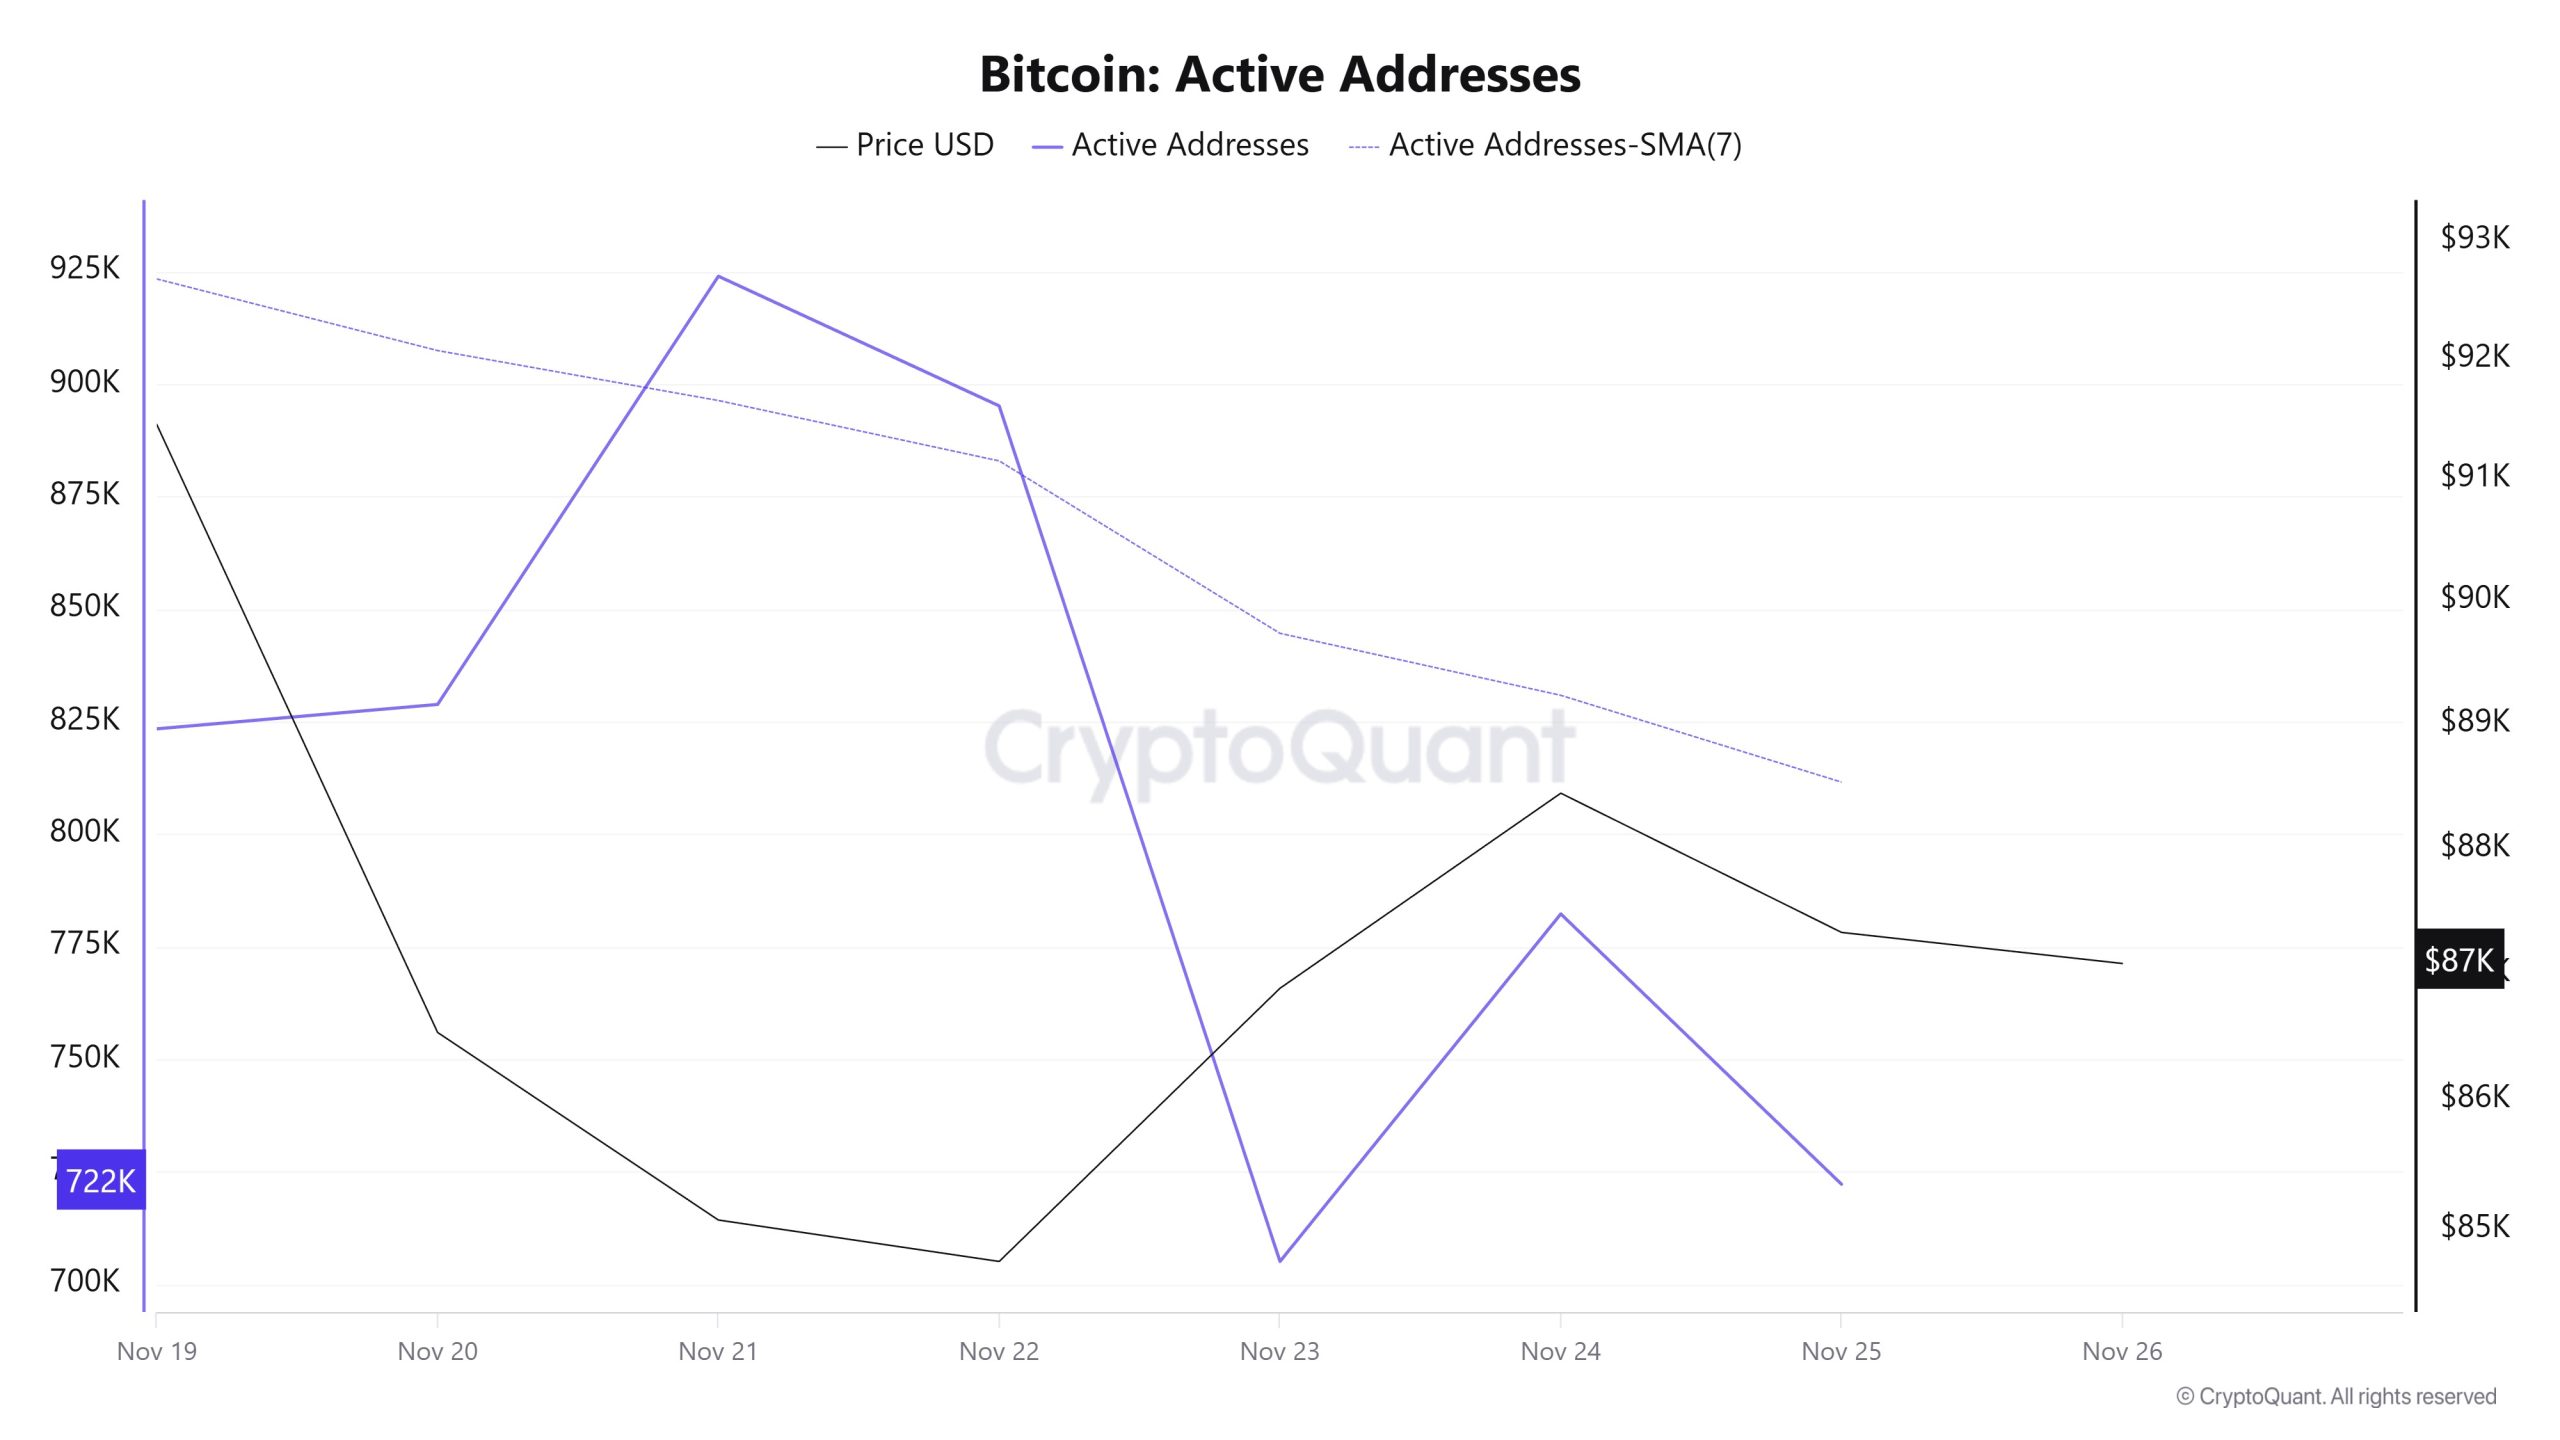
Between 19 November and 26 November, 923,936 active addresses were added to the Bitcoin network. During this period, the Bitcoin price fell to $84.00. From a technical perspective, it is noteworthy that the 7-day simple moving average (SMA) is experiencing downward movements.
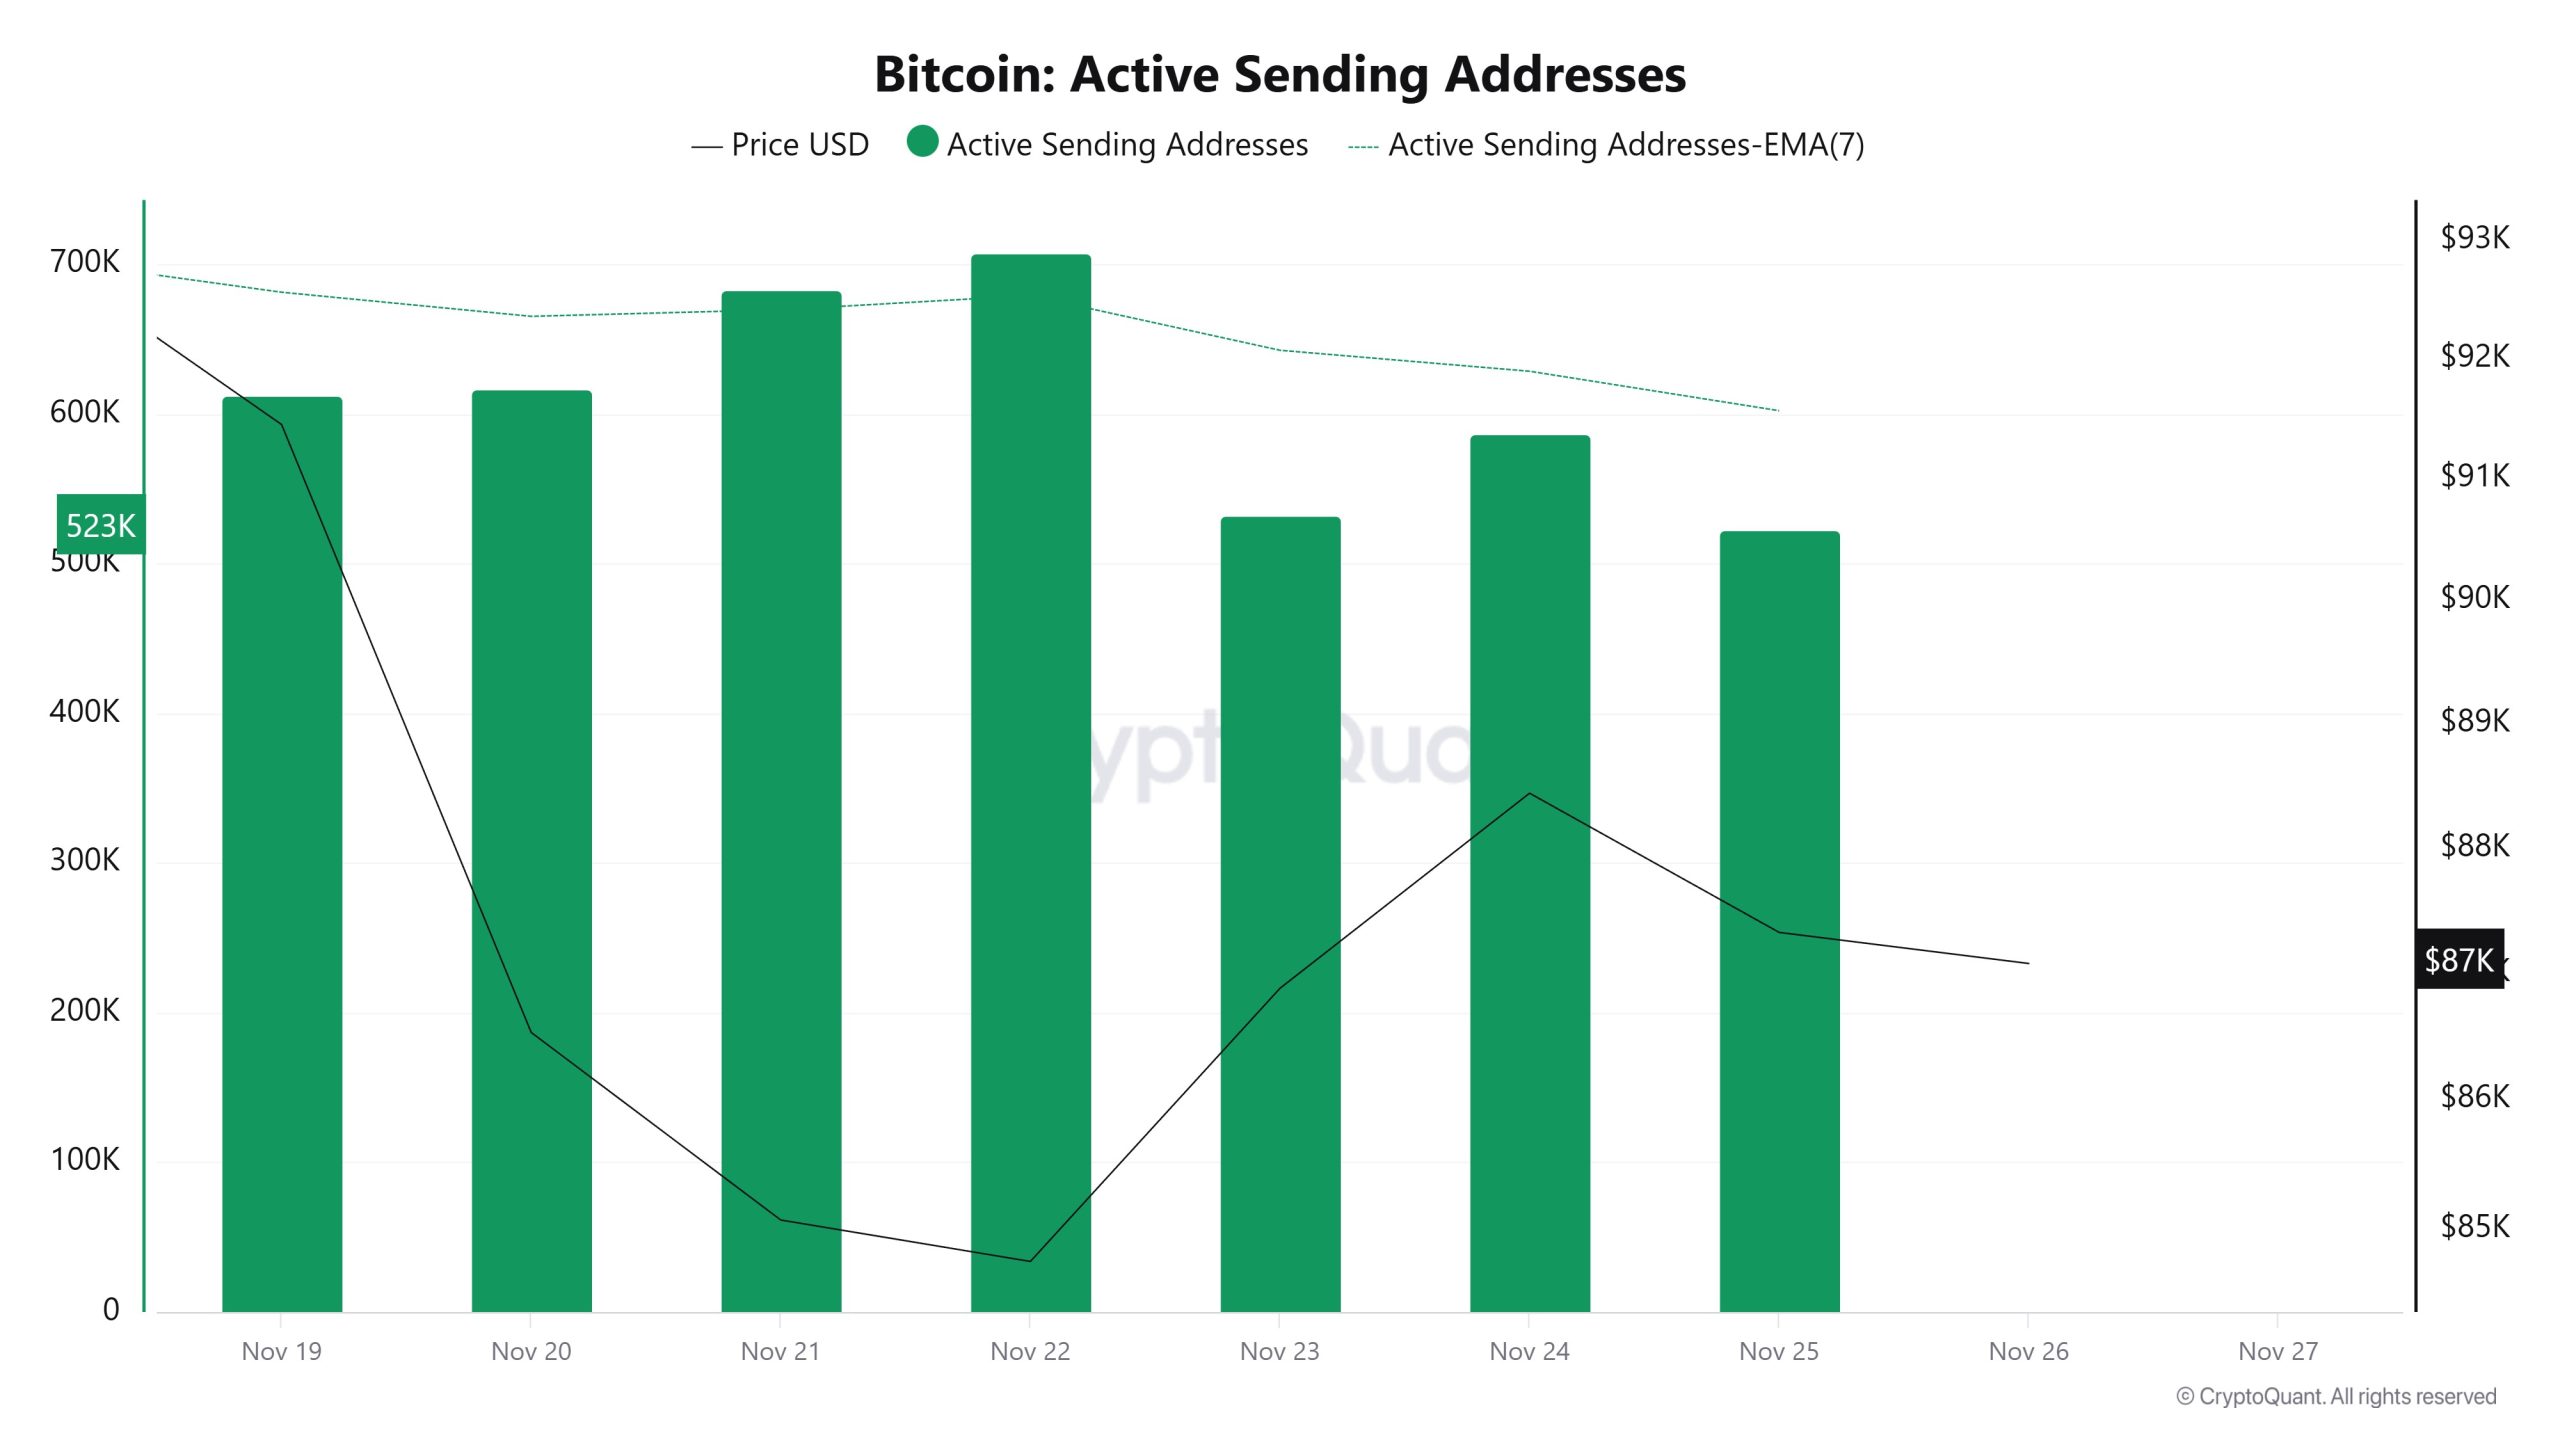
Active Sending Addresses
Between 19 November and 26 November, an upward trend was observed in the “active sending addresses” metric. On the day the price reached its highest level, this metric stood at 707,778, indicating that user activity on the Bitcoin network was moving in parallel with the price. This data indicates that the $84,000 level was supported not only by price-based factors but also by on-chain address activity. Overall, the Active Sending Addresses metric followed a high trajectory during this period.
Active Receiving Addresses
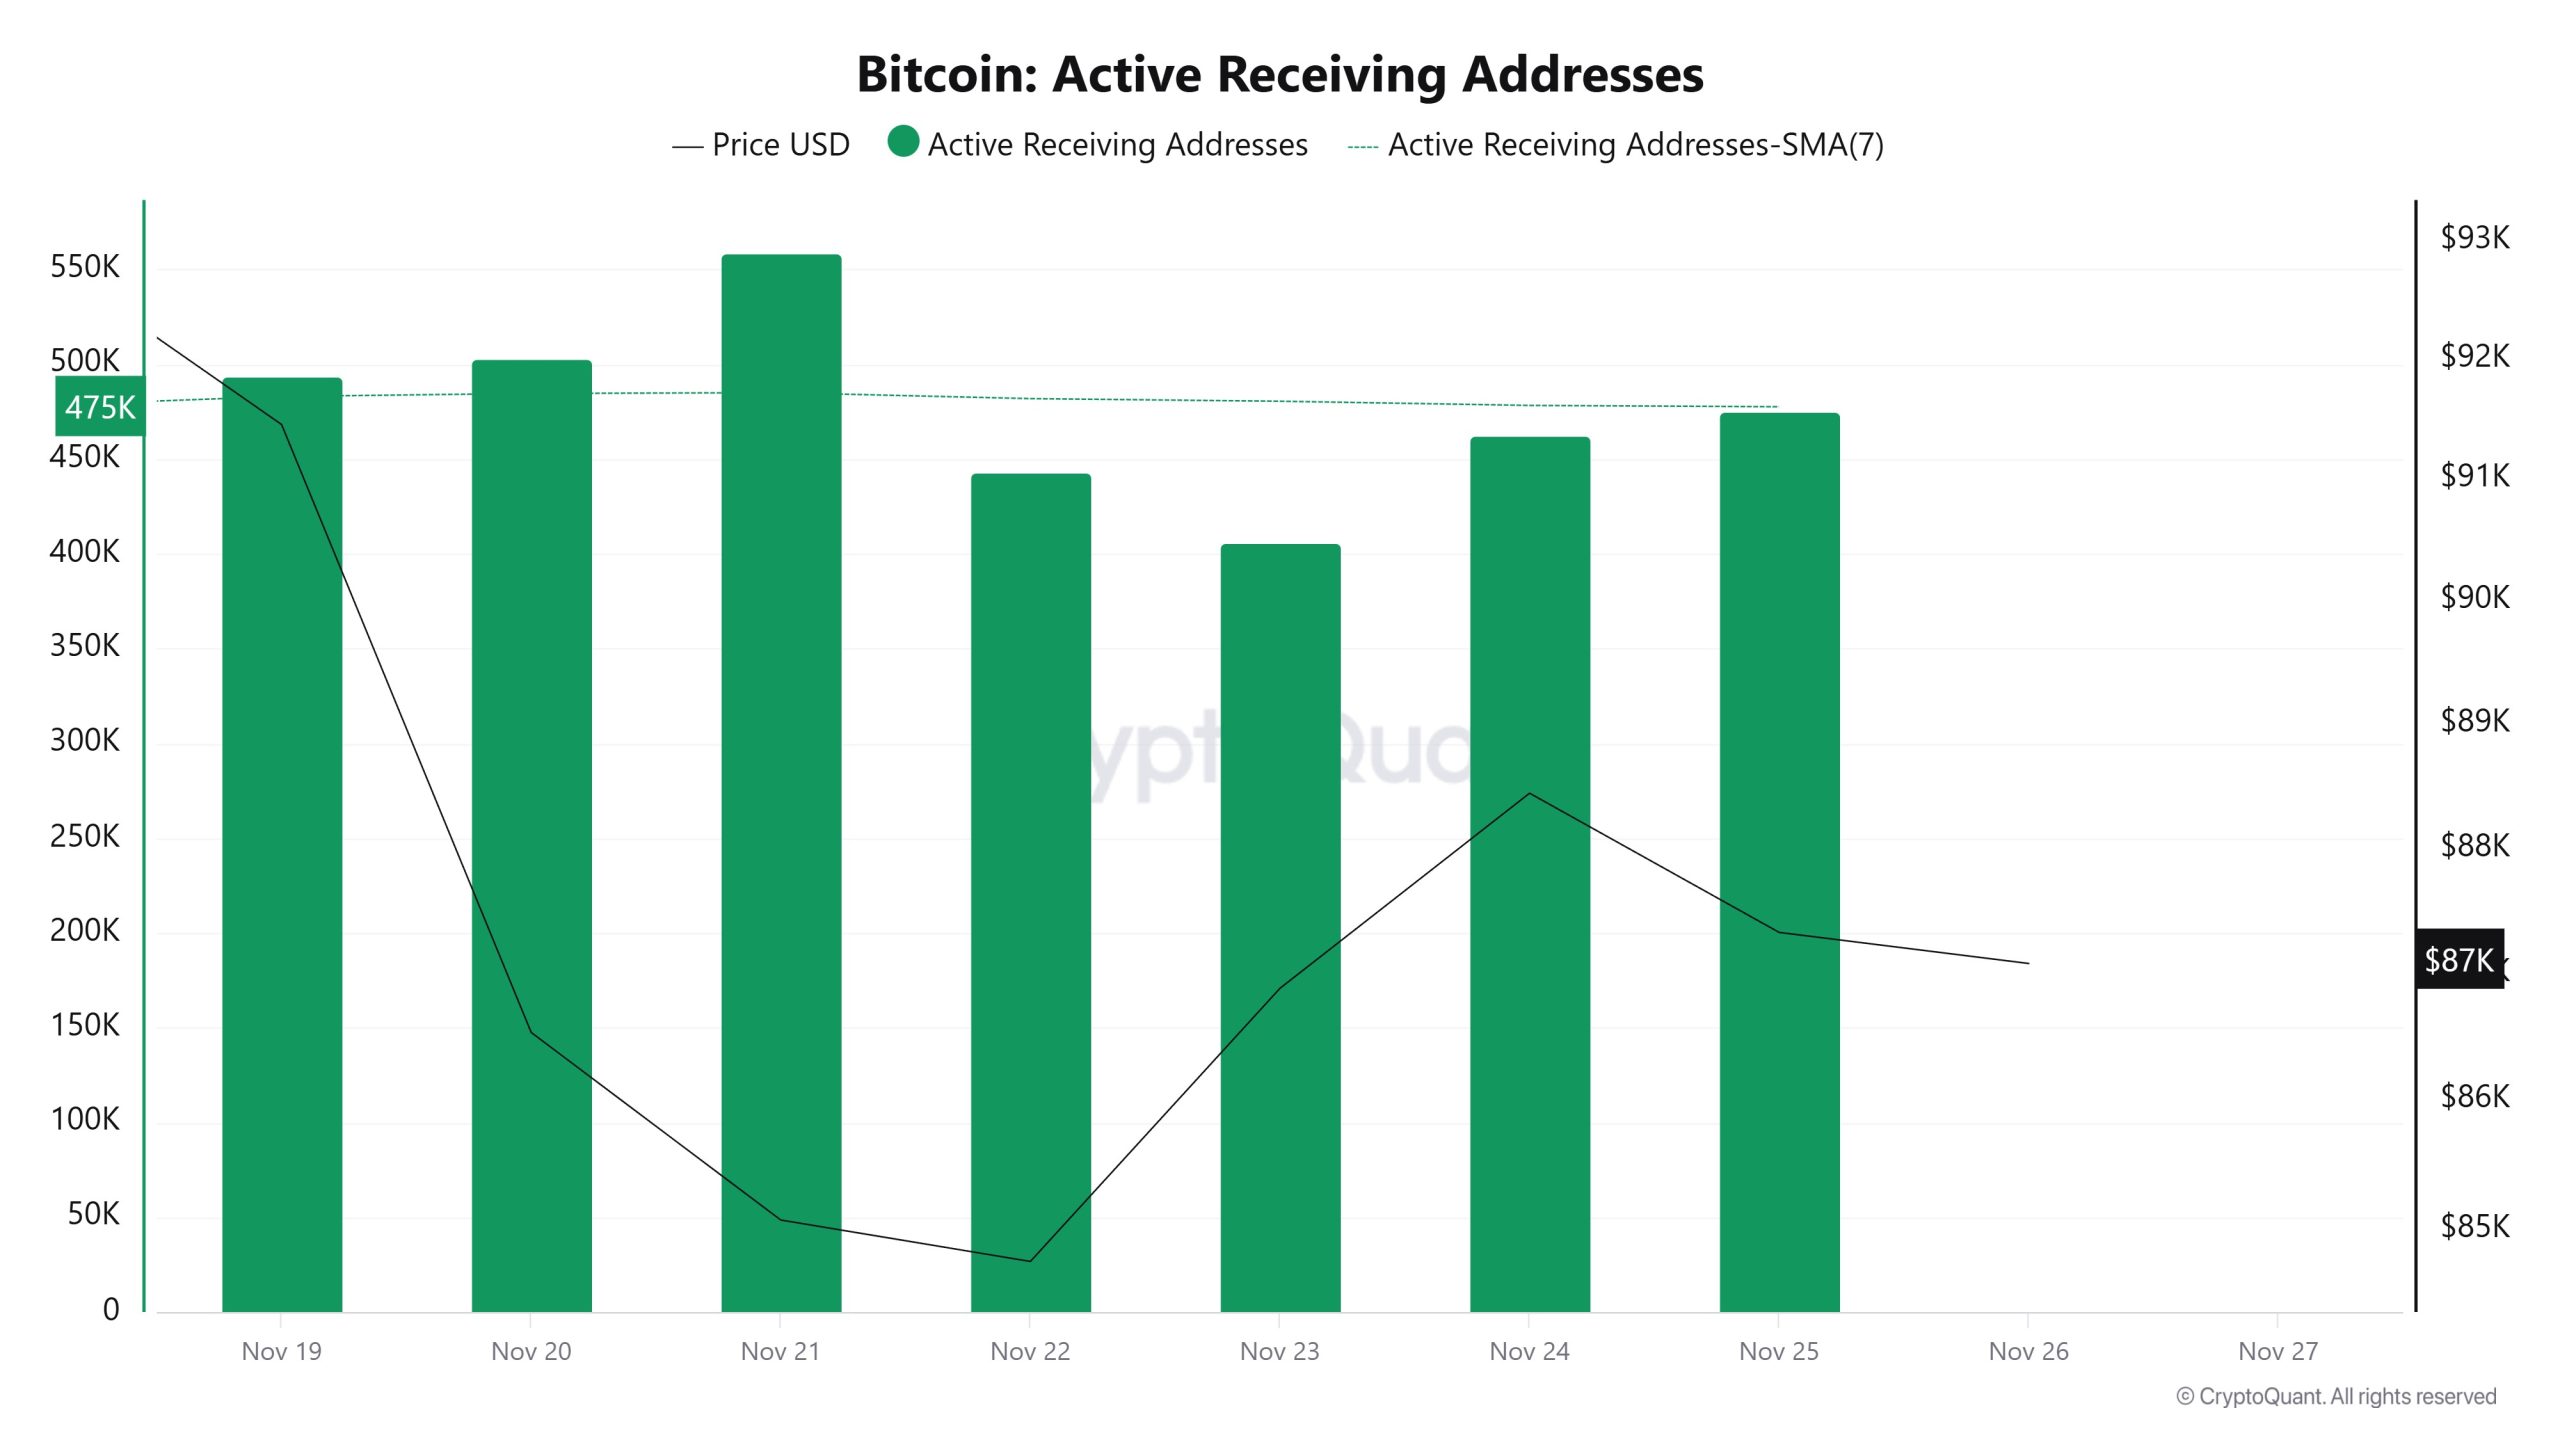
Between November 19 and November 26, active receiving addresses experienced a normal increase along with the Black Line (price line). On the day the price reached its peak, active receiving addresses rose to 558,738 levels, indicating that buyers purchased Bitcoin at around $84,000 levels.
Breakdowns
MVRV

On November 19, while the Bitcoin price was trading at $91,454, the MVRV Ratio stood at 1.630.
As of November 25, the Bitcoin price fell to $87,325, recording a 4.51% decline, while the MVRV Ratio fell to 1.548, recording a 5.03% decline.
Realized Price

On November 19, while the Bitcoin price was trading at $91,454, the Realized Price was at $56,094.
As of November 25, while the Bitcoin price fell to $87,325, the Realized Price rose to $56,397, recording a 0.54% increase.
Spent Output Profit Ratio (SOPR)
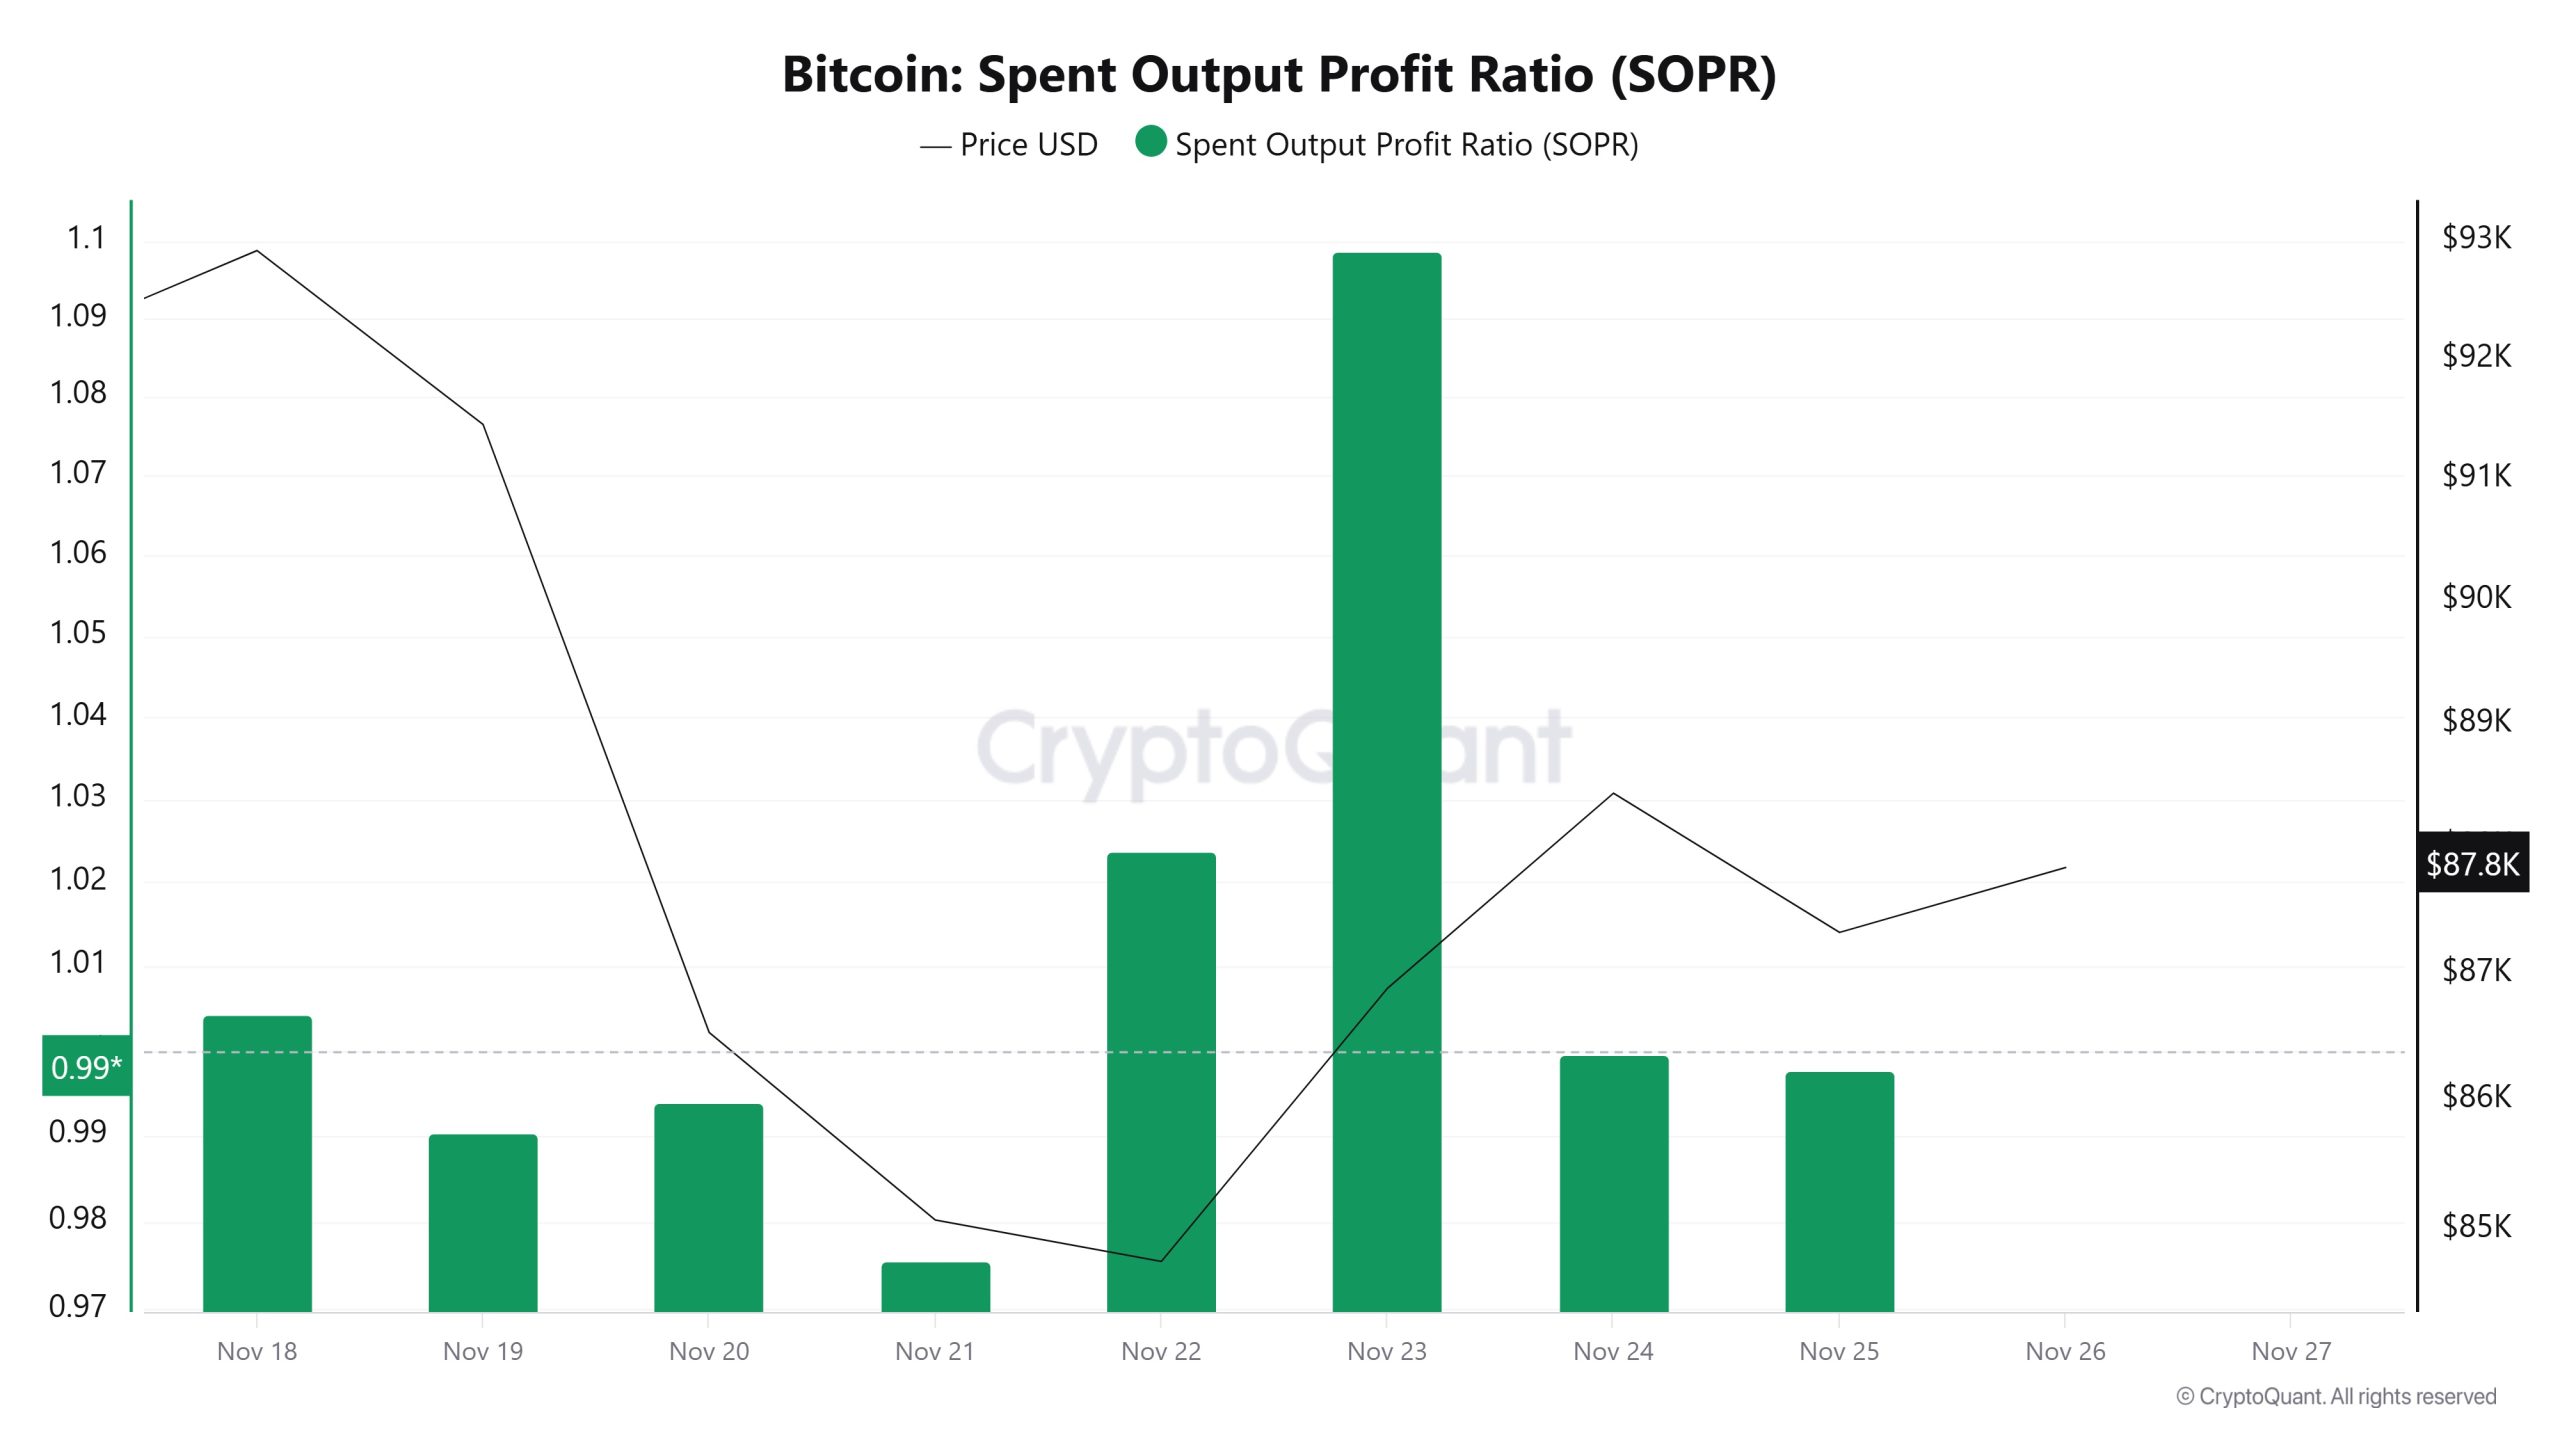
On November 19, while the Bitcoin price was trading at $91,454, the SOPR metric was at 0.990. As of November 25, while the Bitcoin price fell to $87,325, the SOPR metric rose to 0.997, recording a 0.71% increase.
Derivatives
Open Interest
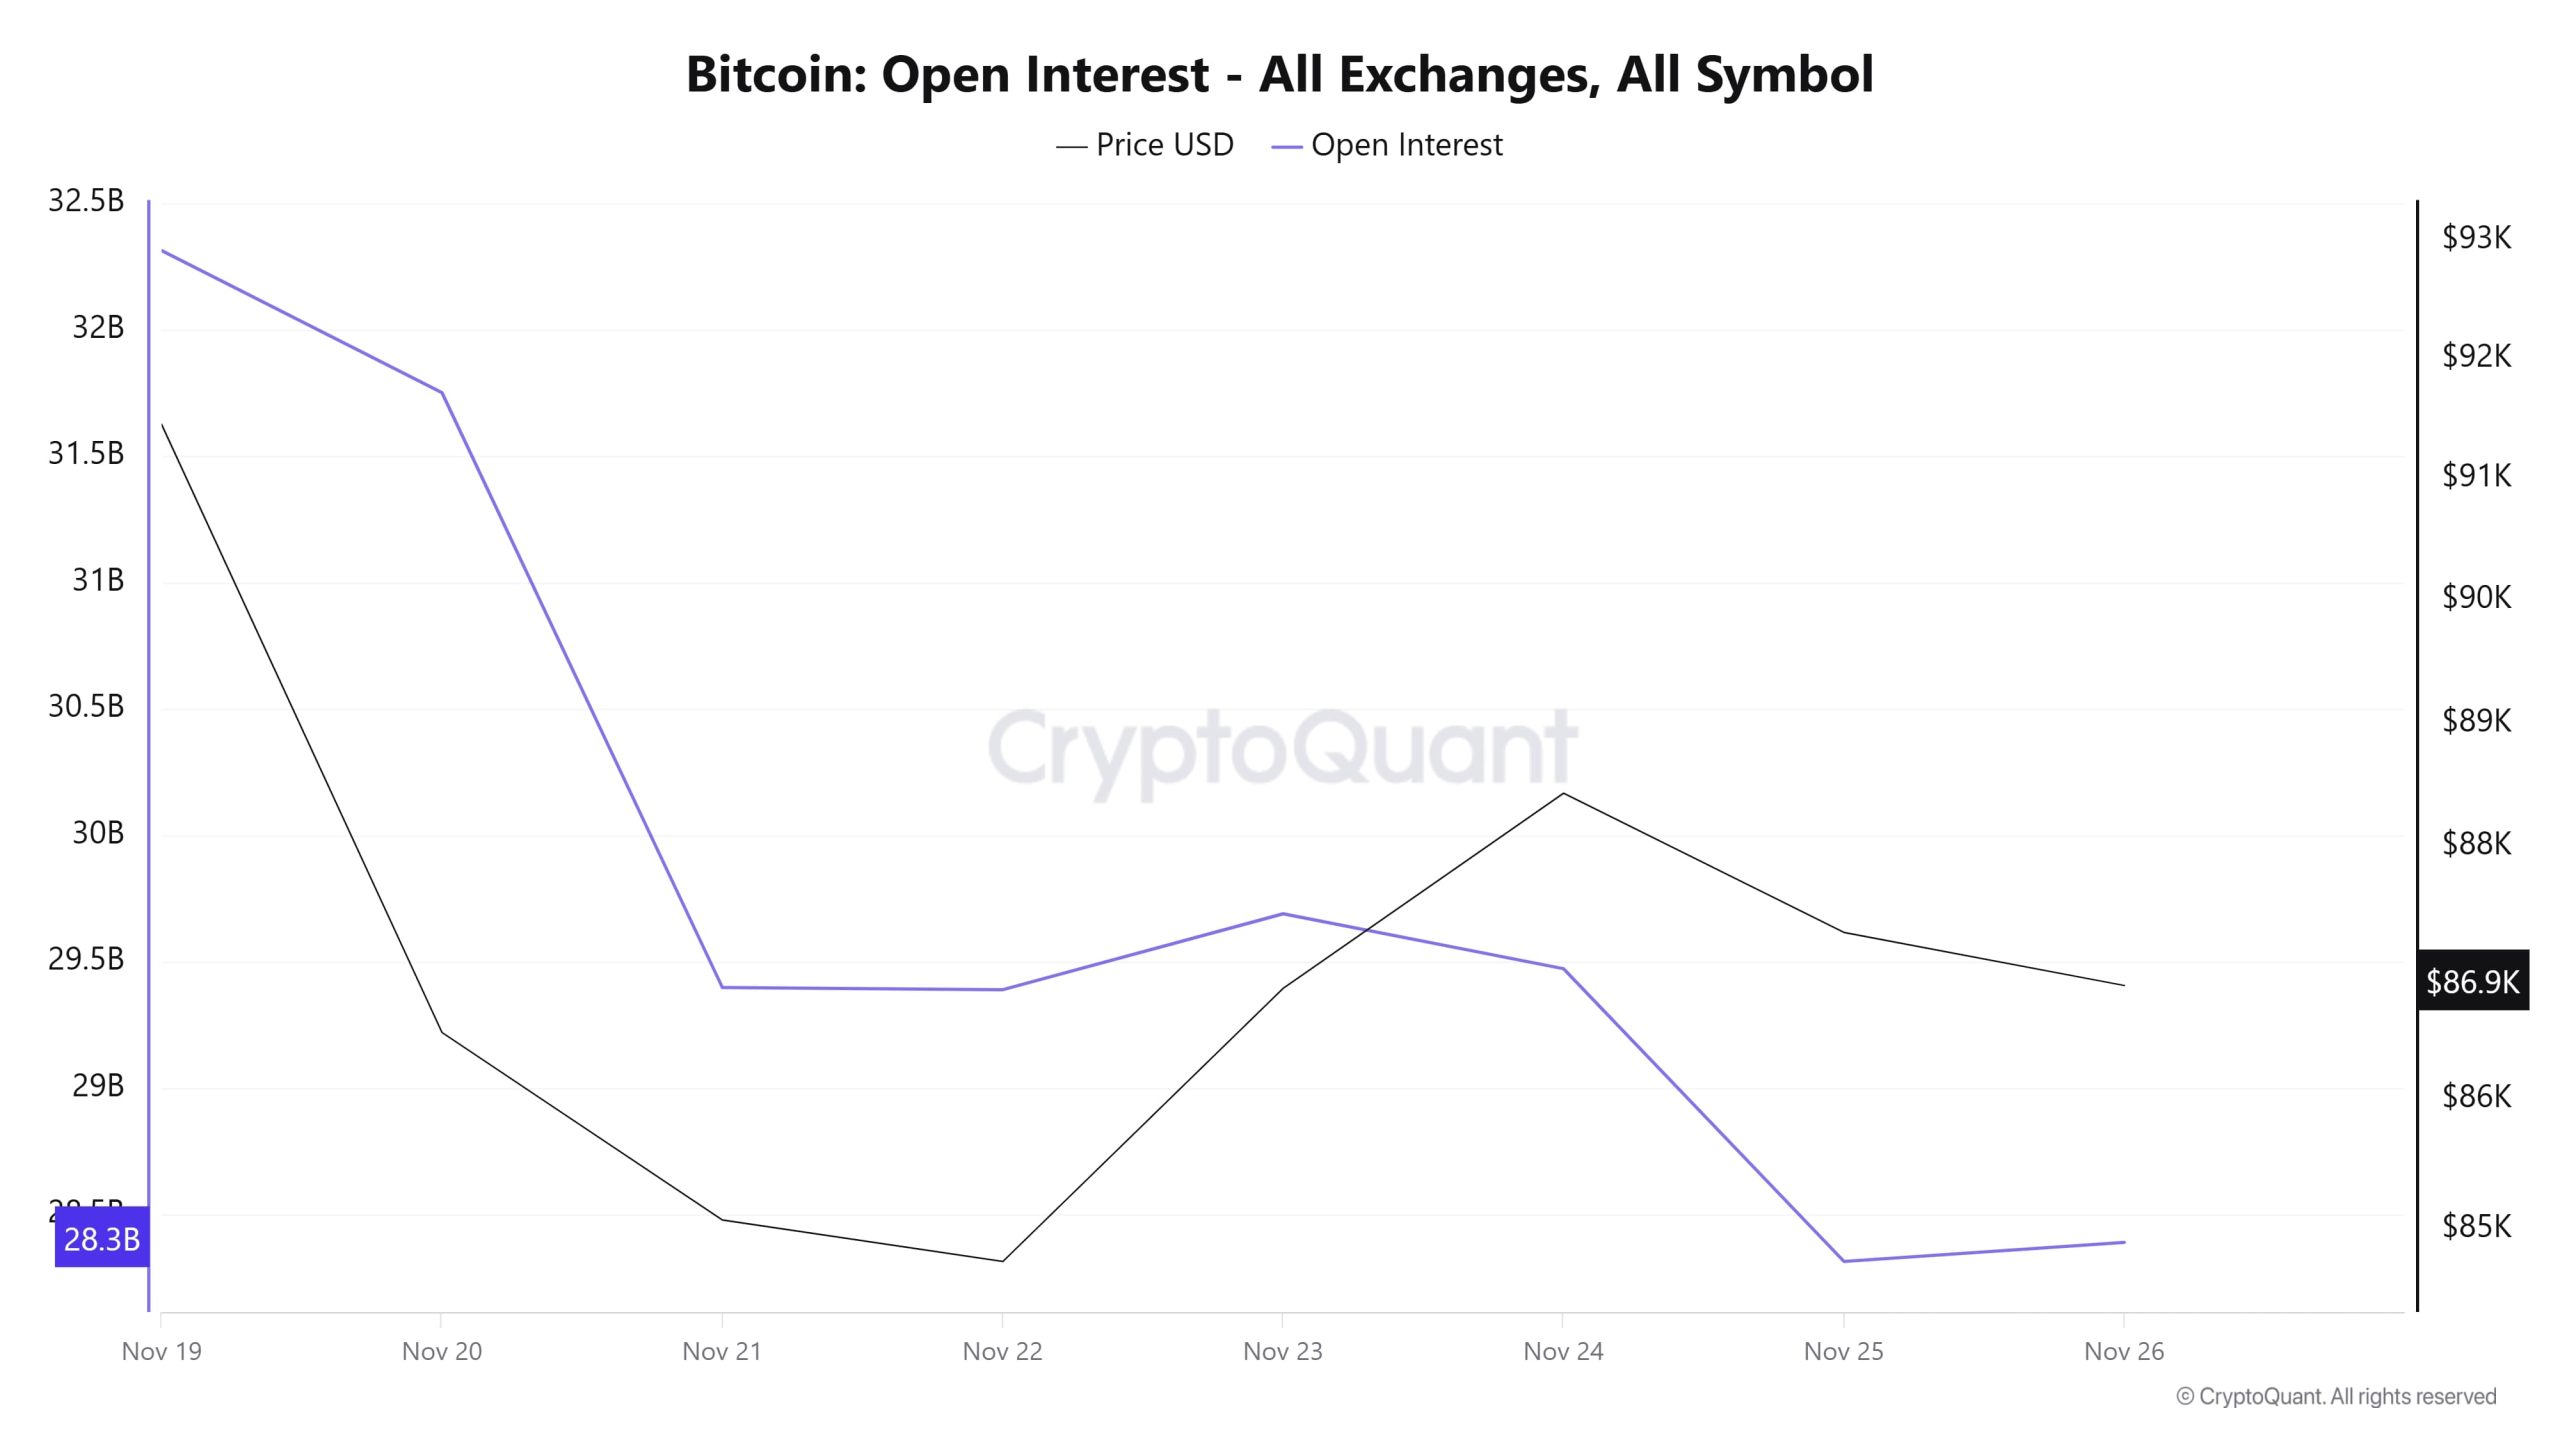
On November 19, both price and open interest were quite high, but within a few days, both fell sharply. This movement indicates that leveraged positions in the market were rapidly closed and risk appetite weakened. Although there was a recovery in price between November 21 and 23, it is noteworthy that open interest did not rise to the same extent. This divergence suggests that the rise may have been a short-term reaction rather than a trend reversal. The renewed decline seen after November 24 reveals that investors are still cautious. In summary, the decline in open interest indicates that Bitcoin is still searching for direction and that volatile movements may continue in the market for some time before a strong trend emerges.
Funding Rate
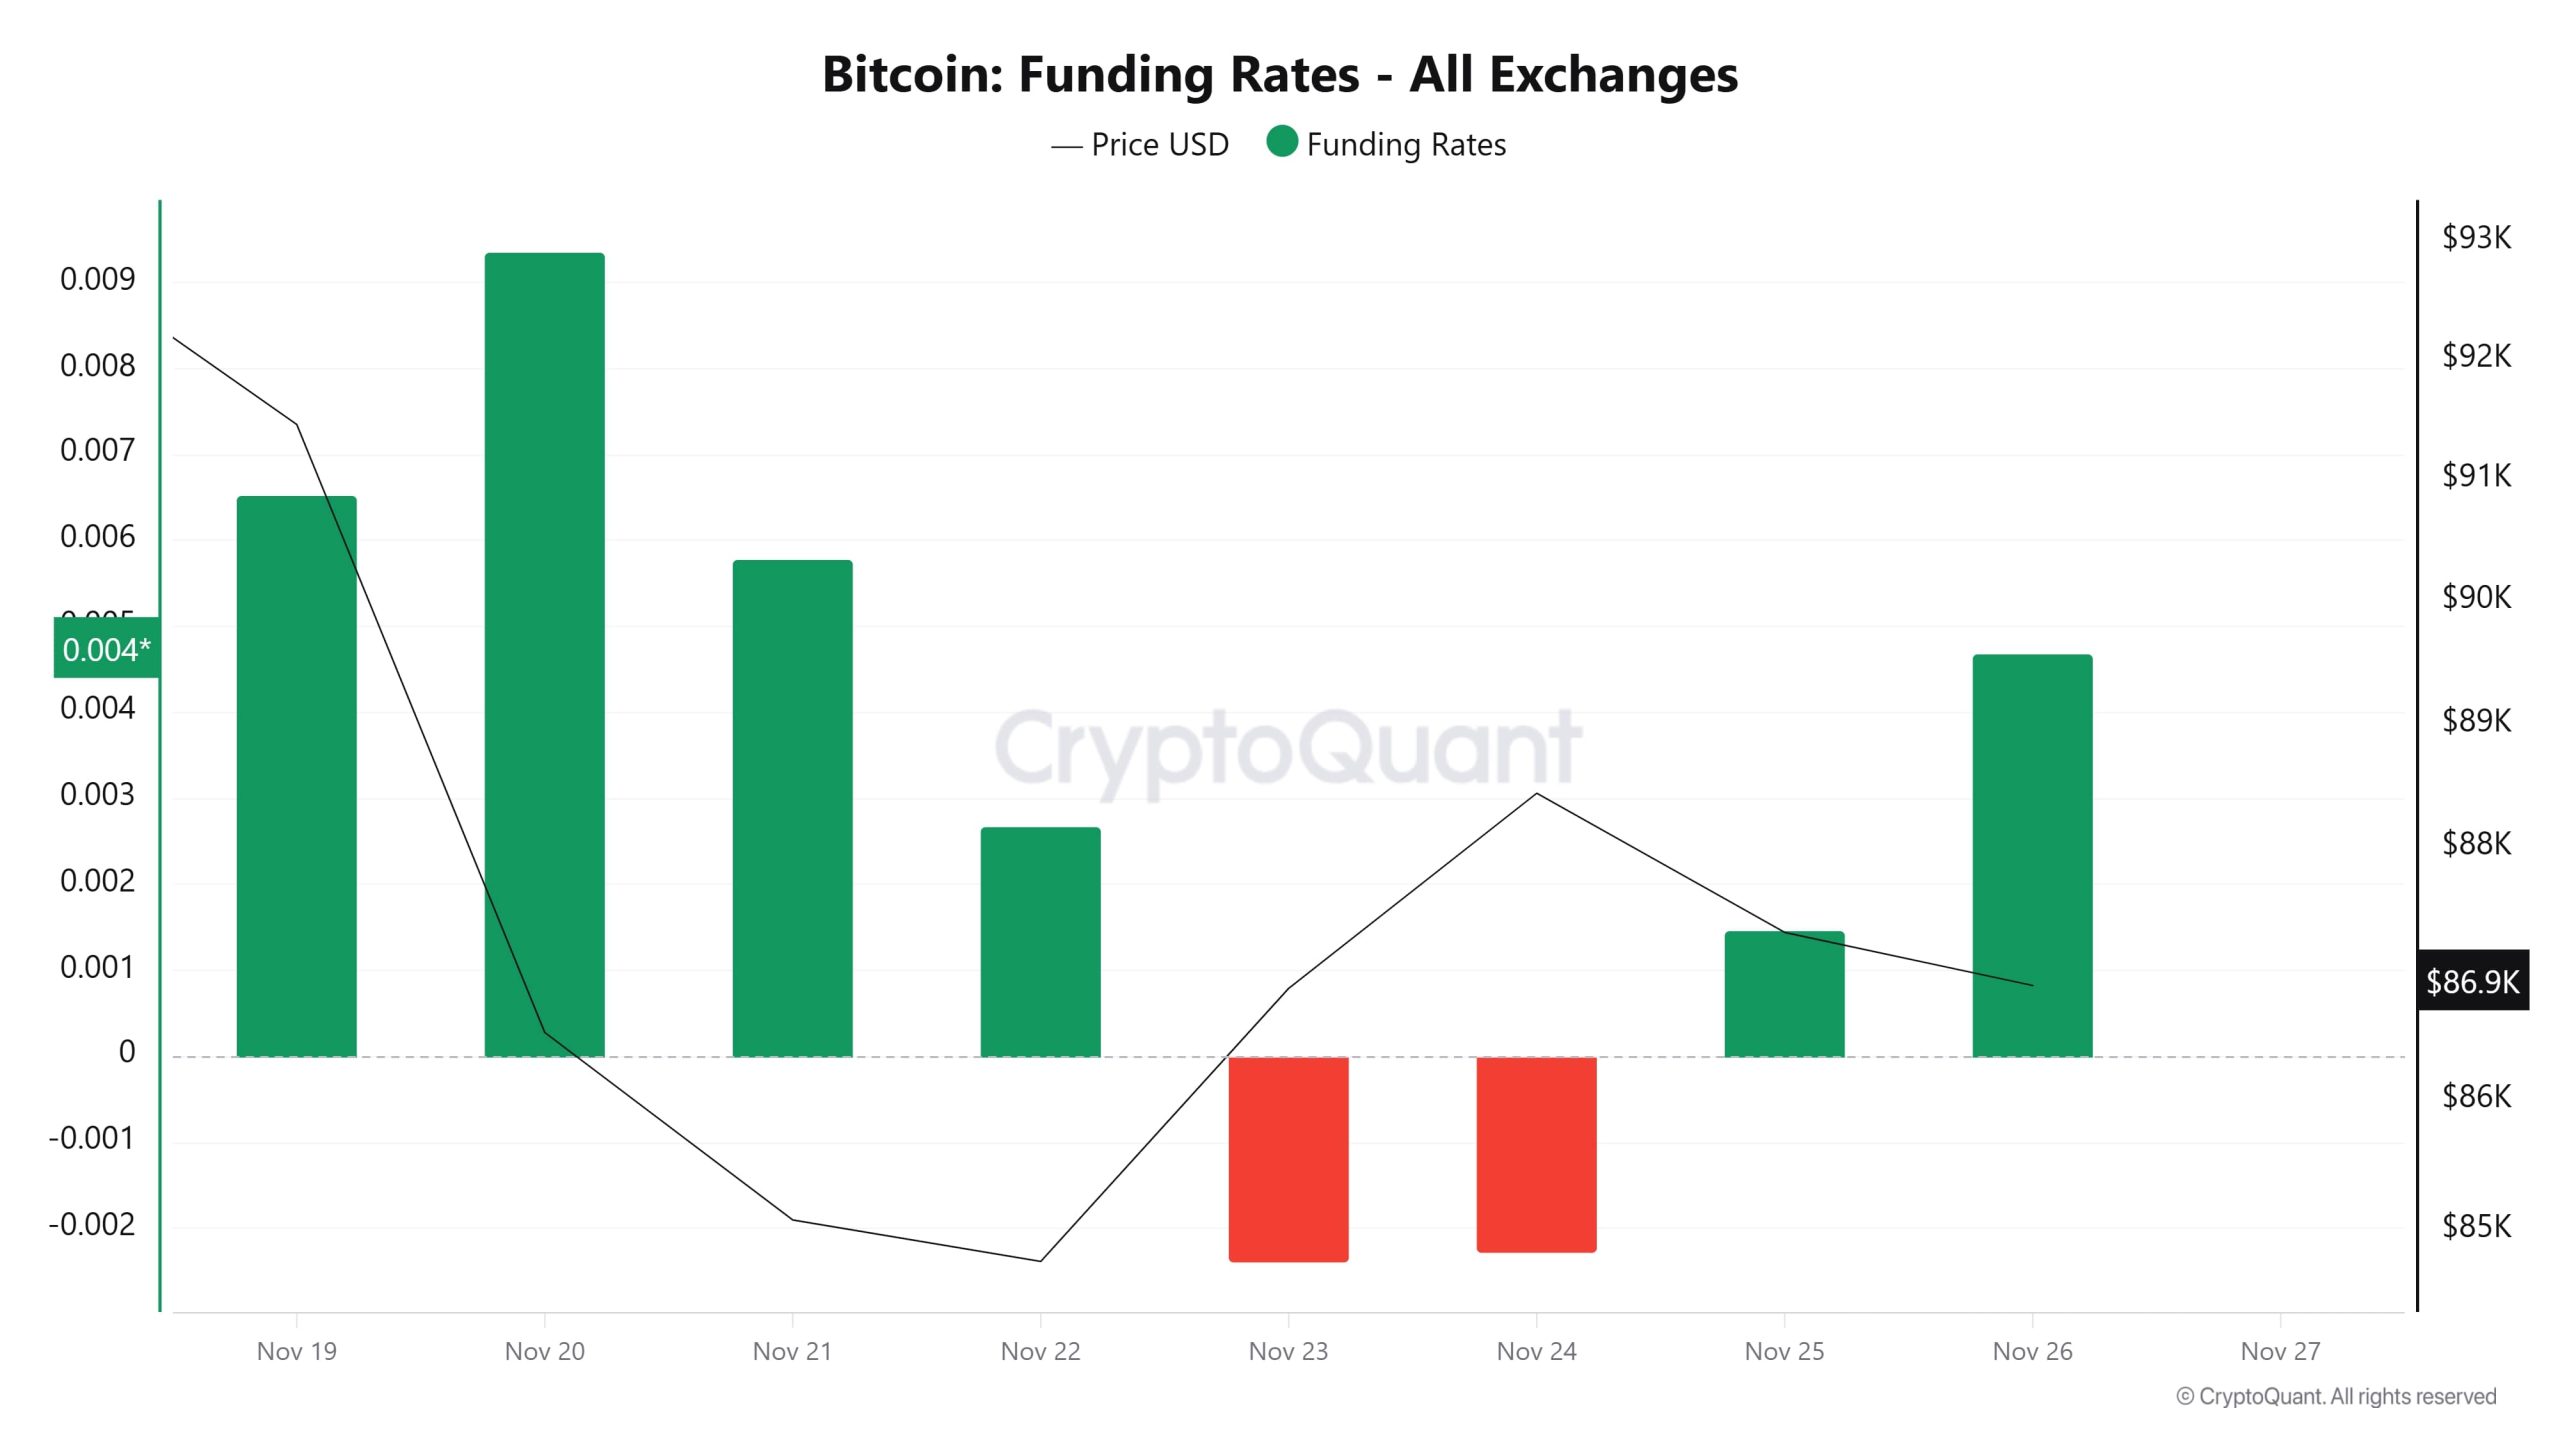
The rates being distinctly positive during the November 19–21 period indicated that long positions were gaining ground in the market and that investors’ expectations of an upturn remained strong. However, with the price pullback, funding rates quickly turned negative. Rates falling to negative levels on November 23–24 indicate that short-term sell positions gained ground, while also signaling that excessive optimism in the market dissipated. The subsequent recovery suggests that investors are seeking to rebalance. Overall, the chart shows that leveraged positions remained under pressure for a while, but the search for direction in the market is still ongoing. The return of funding rates to positive territory signals that sentiment is beginning to shift back in favor of an uptrend.
“BTC Funding Rate Visual to be Added”
Long & Short Liquidations
Last week, as the BTC price fell from $92,980 to $80,600, the market saw $1.783 billion in long and $336 million in short liquidations.
| Date | Long Volume (Million $) | Short Volume (Million $) |
|---|---|---|
| November 19 | 249.54 | 53.95 |
| November 20 | 386.68 | 27.30 |
| November 21 | 868.51 | 105.89 |
| November 22 | 14.23 | 14.92 |
| November 23 | 178.59 | 65.20 |
| November 24 | 49.20 | 51.49 |
| November 25 | 36.88 | 16.24 |
| Total | 1783.63 | 335.99 |
Supply Distribution
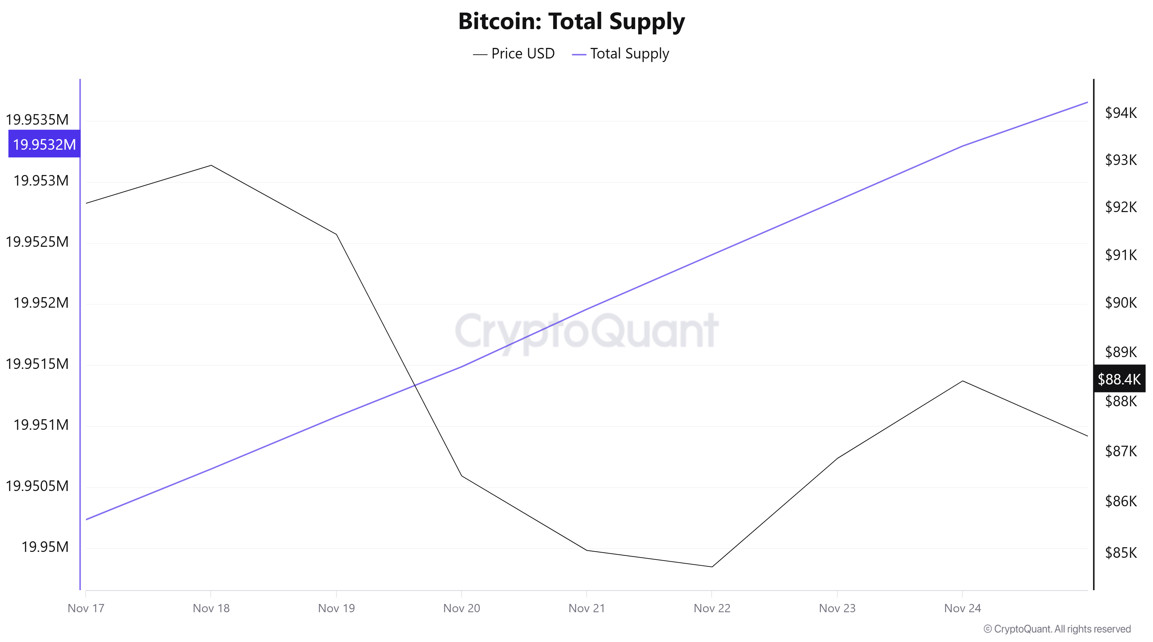
Total Supply: Reached 19,950,233 units, an increase of approximately 0.0153% compared to last week.
New Supply: The amount of BTC produced this week was 3,063.
Velocity: Last week’s velocity of 12.25 reached 12.34 as of November 24.
| Wallet Category | Nov 17, 2025 | Nov 24, 2025 | Change (%) |
|---|---|---|---|
| < 1 BTC | 8.4489% | 8.4331% | -0.1870% |
| 1 – 10 BTC | 11.3603% | 11.3362% | -0.2121% |
| 10 – 100 BTC | 24.6548% | 23.2364% | -5.7377% |
| 100 – 1k BTC | 30.2449% | 27.8468% | -7.9180% |
| 1k – 10k BTC | 17.2580% | 21.0998% | +22.2567% |
| 10k+ BTC | 8.0257% | 8.0471% | +0.2667% |
According to the latest weekly data, the Bitcoin wallet distribution showed a mixed picture. The share of wallets with a balance of less than 1 BTC rose to 8.4489%, showing a very limited increase. The share of wallets in the 1–10 BTC range fell to 11.3362%, recording a slight decline. The share of wallets in the 10–100 BTC range fell to 23.2364%, continuing its downward trend. The proportion of wallets in the 100–1,000 BTC range declined to 27.8468%, showing a significant decrease on a weekly basis. In contrast, the share of wallets in the 1,000–10,000 BTC range rose to 21.0998%, showing a strong increase. The proportion of wallets holding 10,000 BTC or more recorded a slight increase to 8.0471%. While fluctuations were observed in small and medium-sized wallet groups overall, accumulation trends were particularly prominent in the 1,000–10,000 BTC band this week.
Exchange Supply Ratio

According to data obtained from the Bitcoin Exchange Supply Ratio table, which shows how much of the total supply of Bitcoins is held on exchanges, low rates have been observed this week. The general trend shows that as of November 23, there is a negative correlation between the Bitcoin price and the supply rate entering exchanges. This indicates that most Bitcoins are beginning to be withdrawn from wallets and that the market is not ready to buy.
Between November 19 and November 26, the Bitcoin Exchange Supply Ratio decreased from 0.11880628 to 0.09207985. During this period, the Bitcoin price fell from $91,000 to $87,000. Notably, the divergence in the direction of these two variables this week indicates a decrease in the amount of Bitcoin supplied to exchanges despite the price decline, suggesting that long-term investors may have begun reducing their holdings. A general downward trend in the Bitcoin price appears likely.
Exchange Reserve
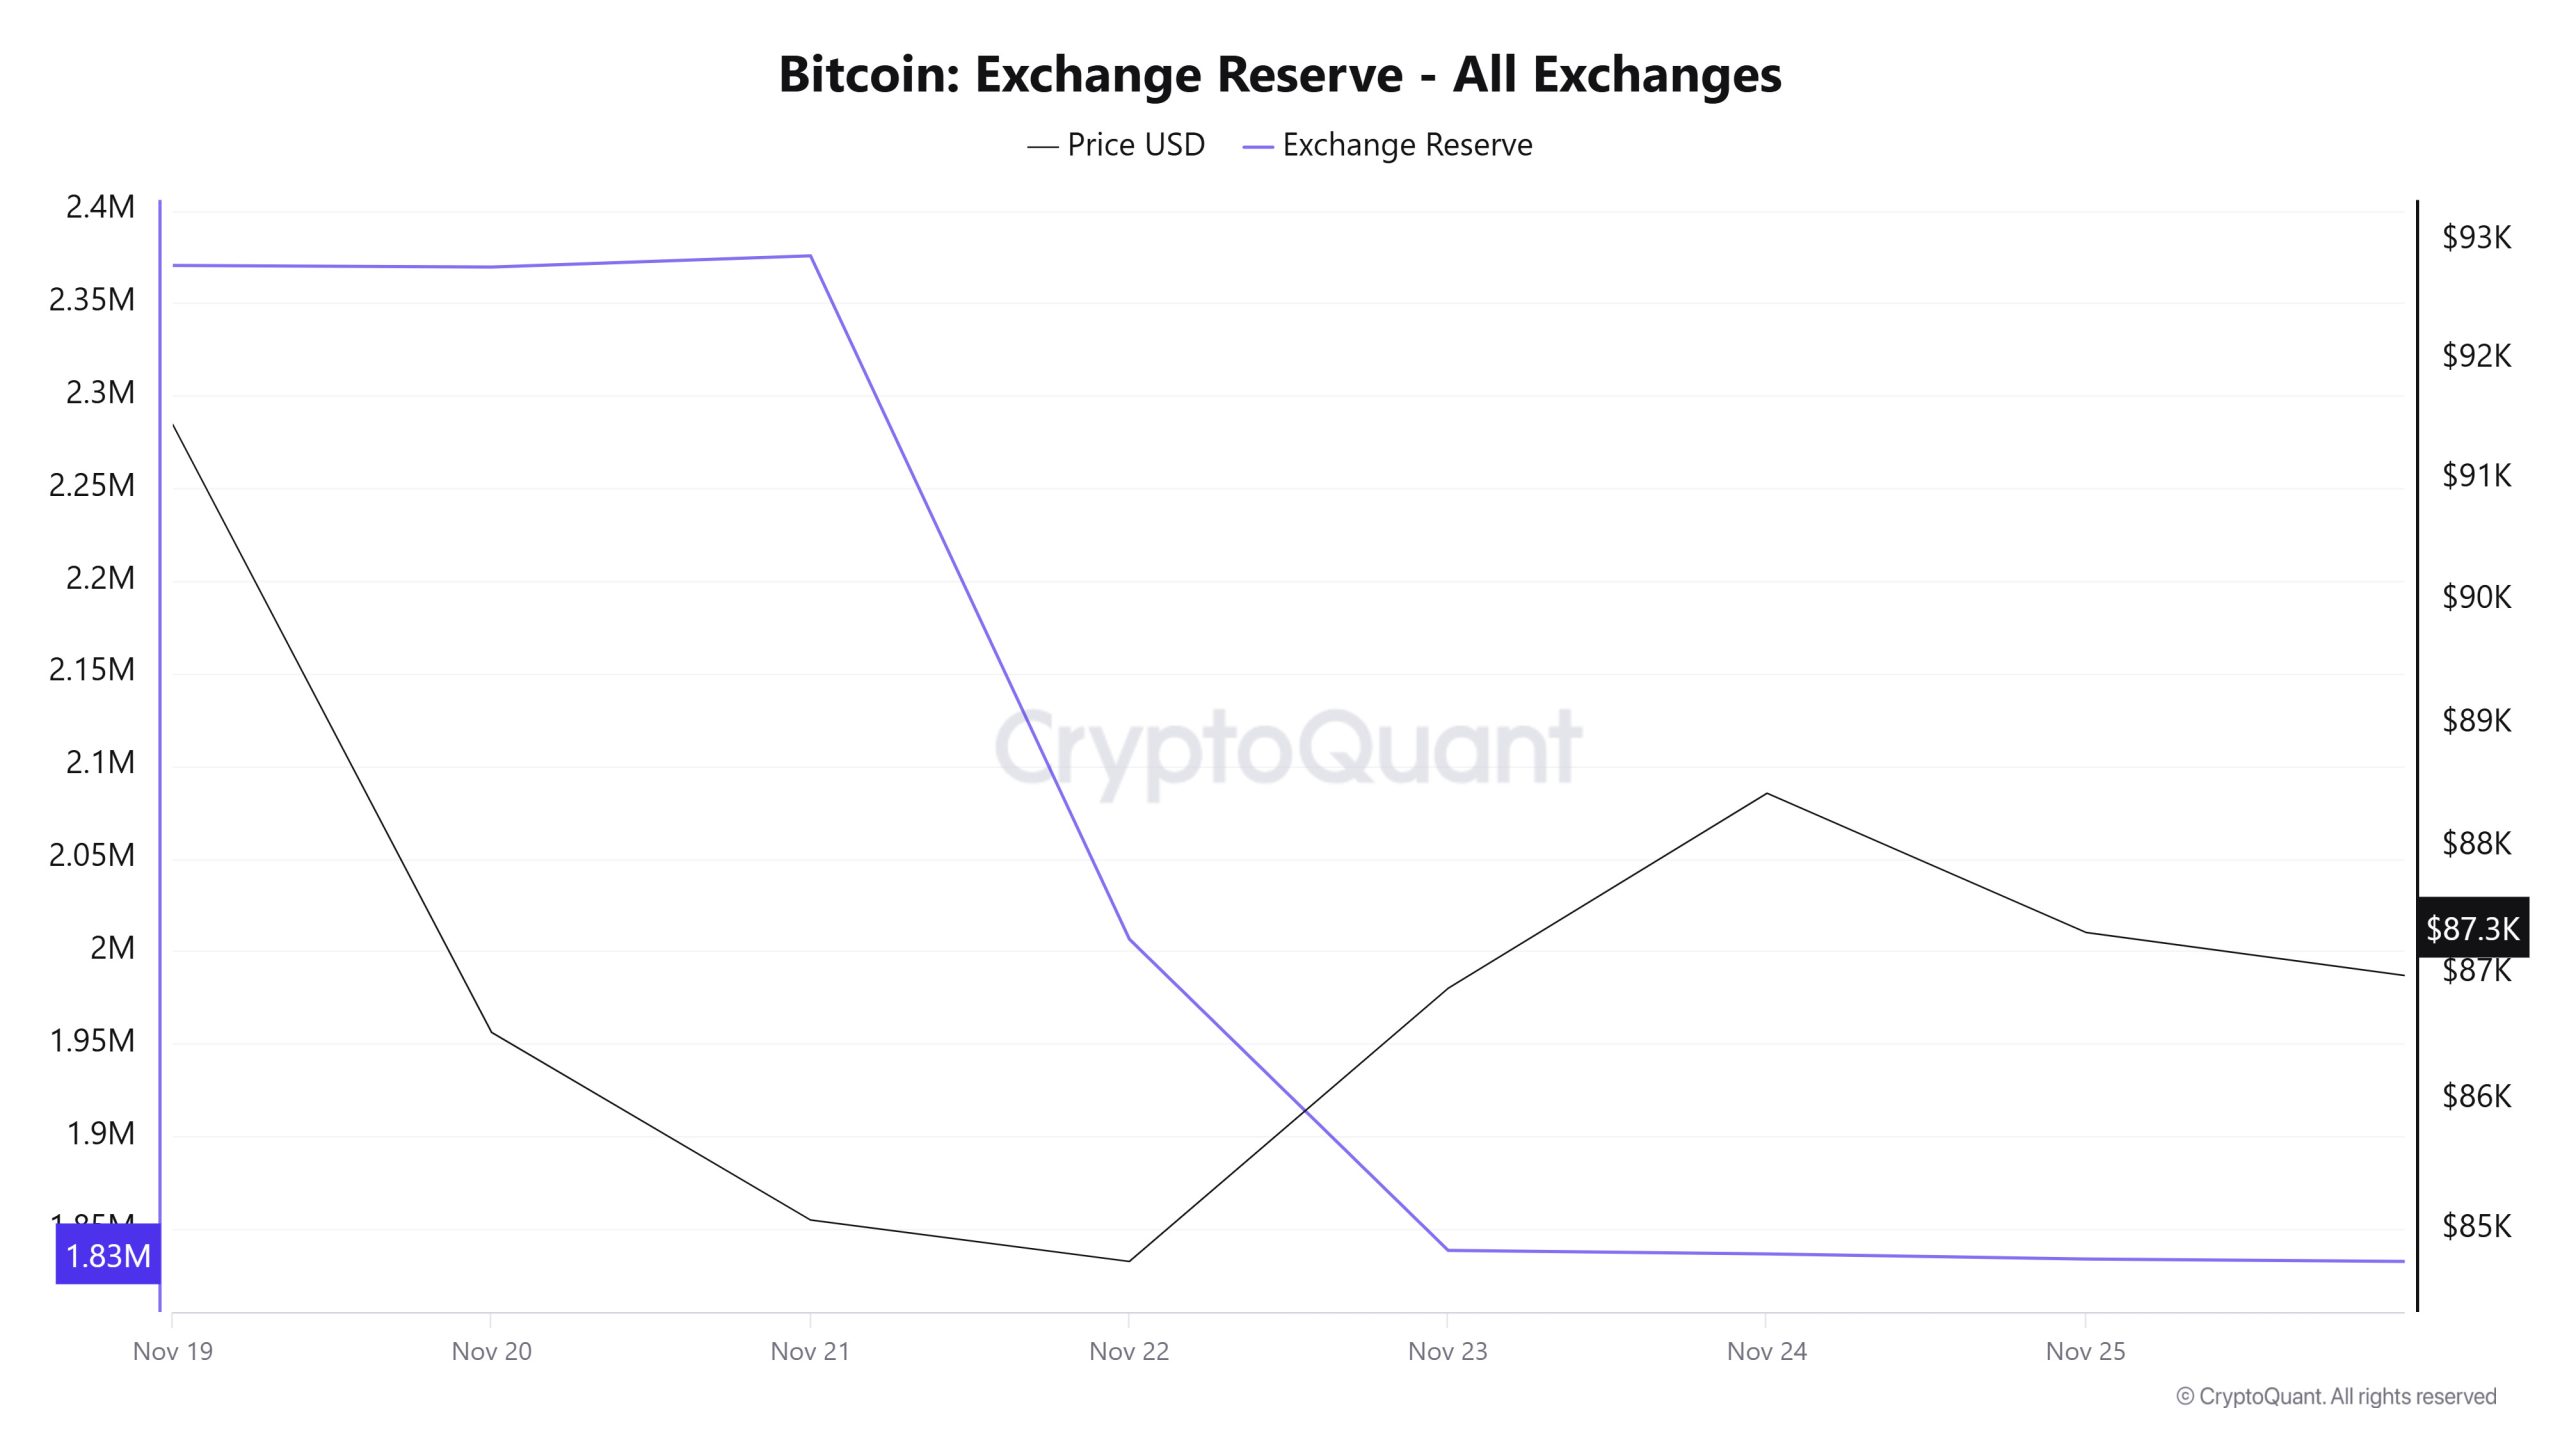
Between November 19-25, 2025, Bitcoin reserves on exchanges fell from 2,370,370 BTC to 1,833,670 BTC, resulting in a sharp decline of 544,749 BTC. During this period, reserves experienced a high decline of approximately 22.90%, while the BTC price fell from $93,116 to $87,325, losing 6.22% of its value. The rapid decline in reserves at this level while the BTC price was falling indicated that instead of accumulating within the exchange, large amounts of BTC were being withdrawn from exchanges. The occurrence of such large outflows amid price pressure indicated that investors were leaning toward a long-term stance and avoiding risk in the short term. Although the rise in the BTC price remained limited after the sharp decline during this process, the continued outflows in the short term could create a positive effect on the BTC price due to the contraction in supply.
| Date | Exchange Inflow | Exchange Outflow | Exchange Netflow | Exchange Reserve | BTC Price ($) |
|---|---|---|---|---|---|
| November 19 | 50,761 | 58,810 | -8,050 | 2,370,370 | 93,116 |
| November 20 | 46,014 | 46,867 | -854 | 2,369,516 | 86,534 |
| November 21 | 81,265 | 75,232 | 6,033 | 2,375,549 | 85,070 |
| November 22 | 18,368 | 387,489 | -369,121 | 2,006,428 | 84,750 |
| November 23 | 16,356 | 184,444 | -168,089 | 1,838,340 | 86,883 |
| November 24 | 50,942 | 52,831 | -1,889 | 1,836,451 | 88,438 |
| November 25 | 37,464 | 40,245 | -2,780 | 1,833,670 | 87,325 |
Fees and Revenues
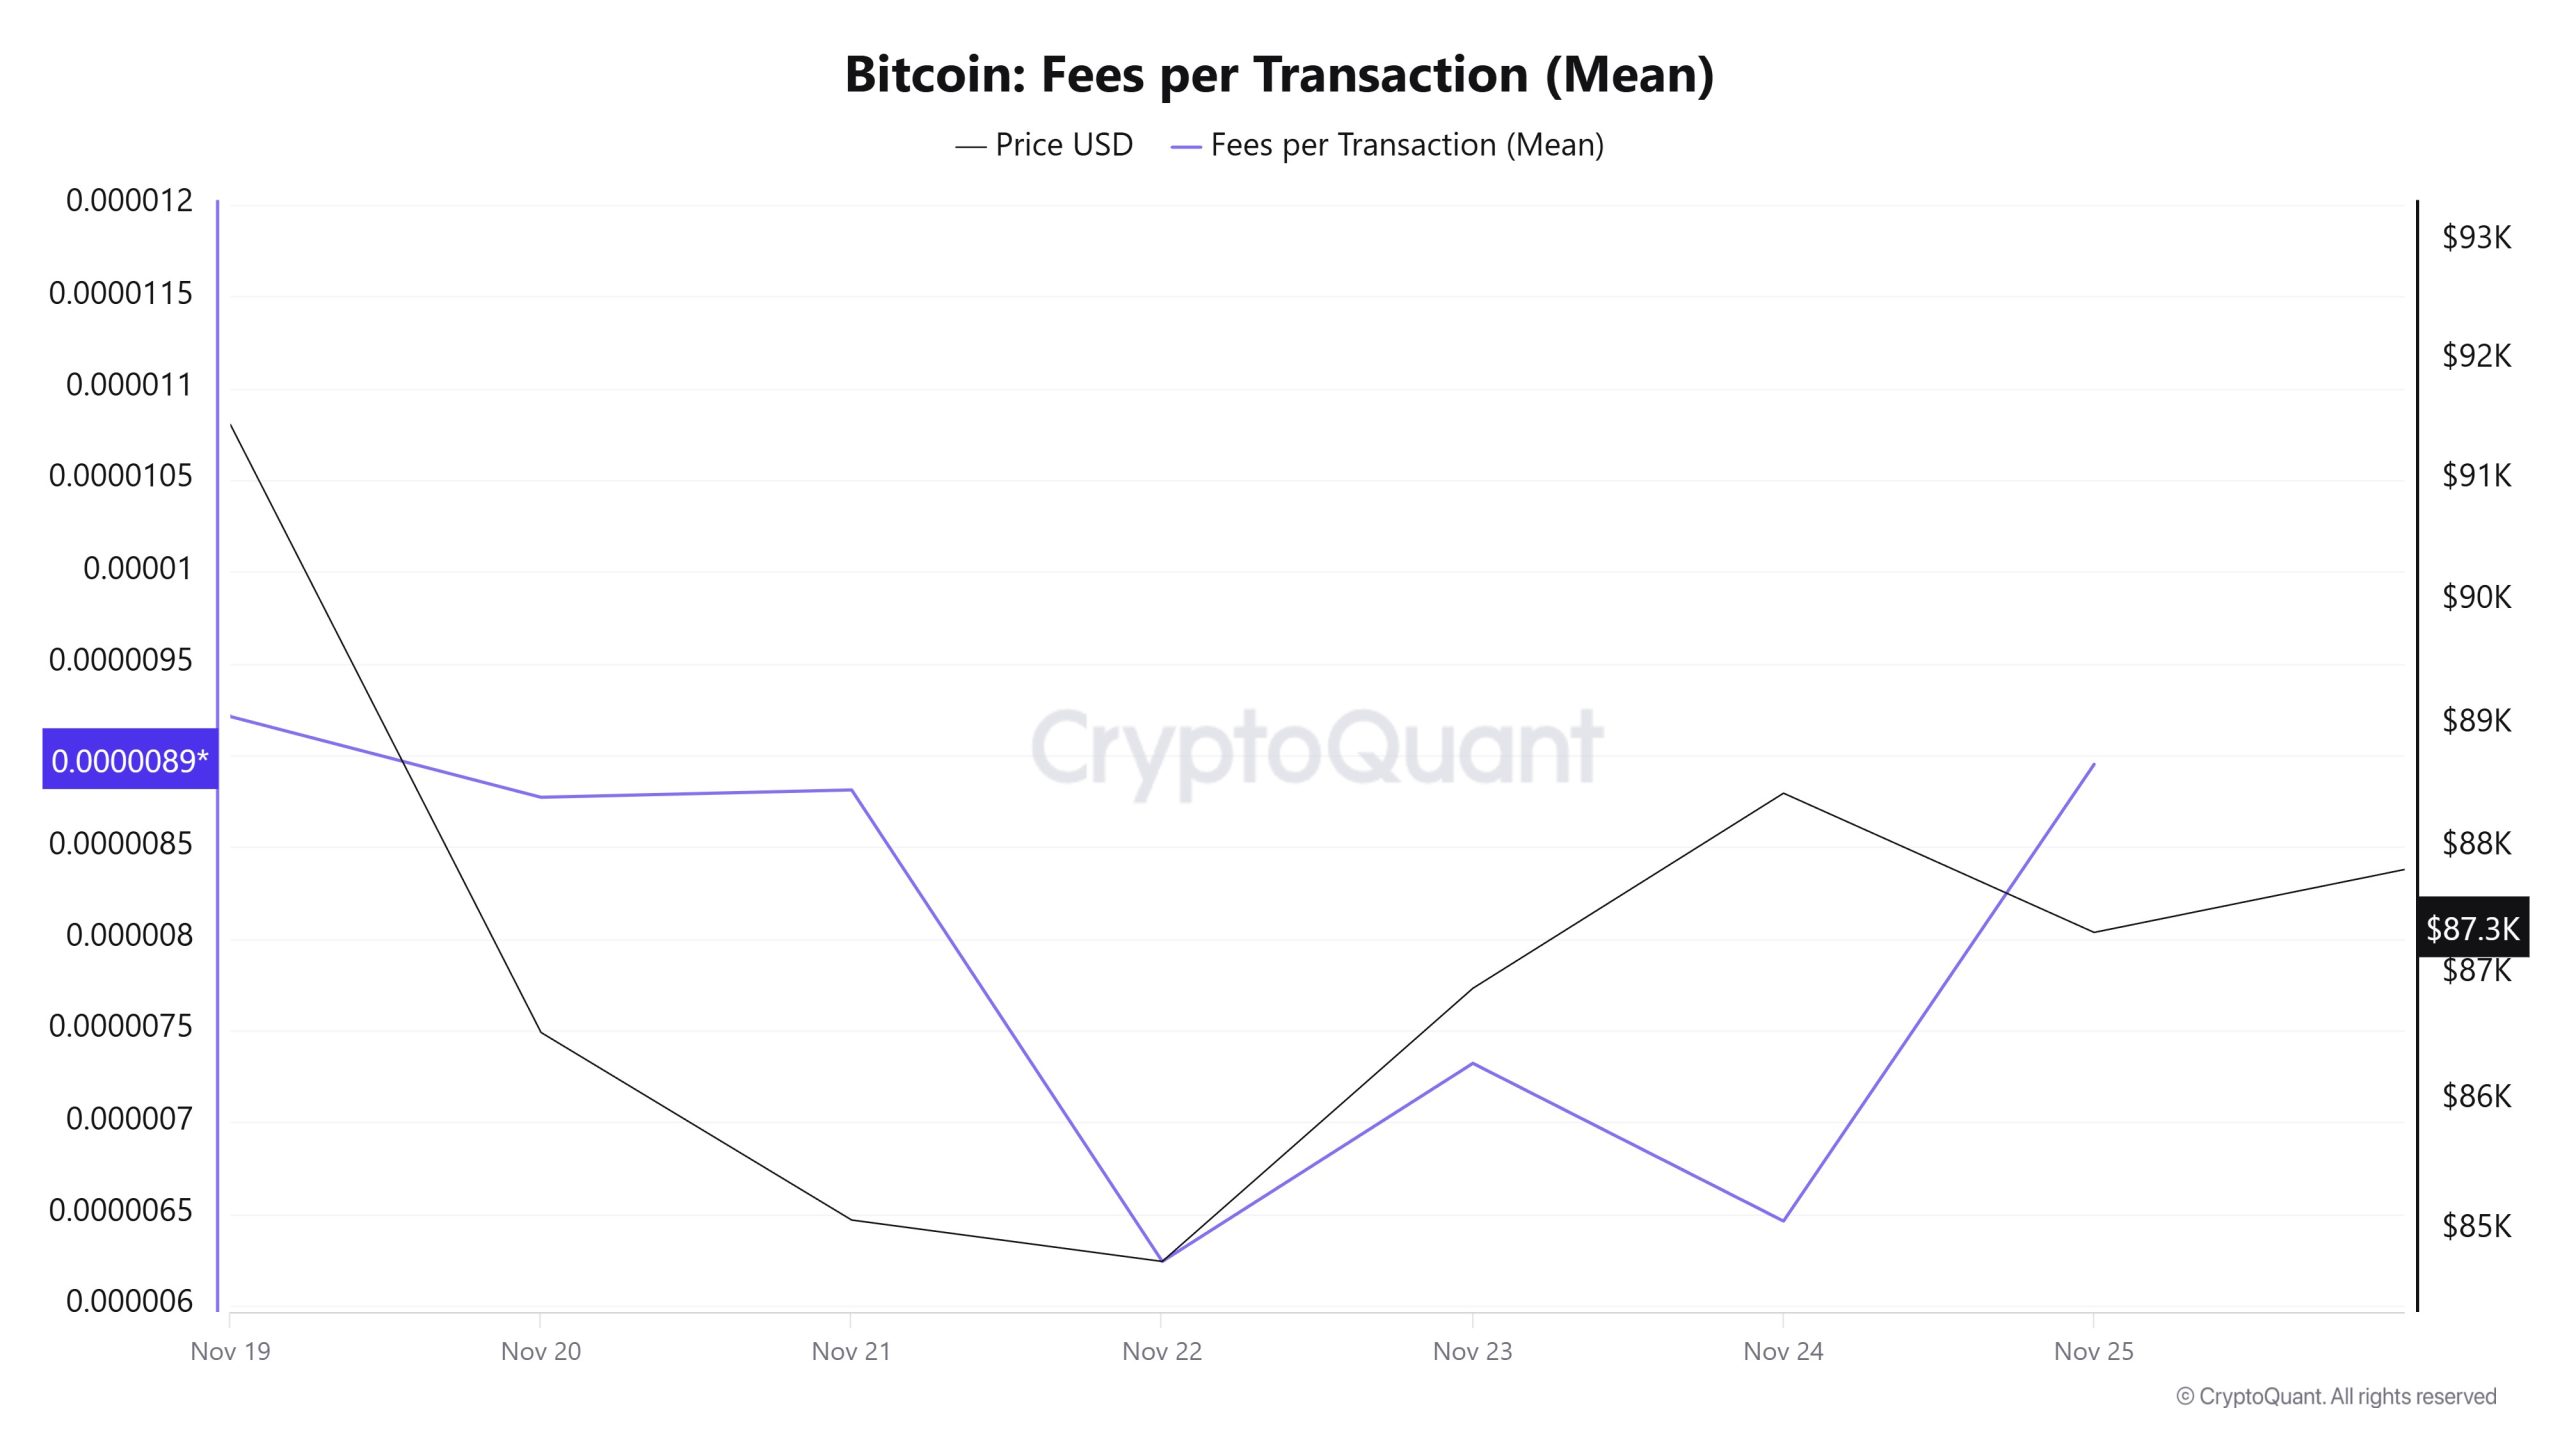
When examining the Bitcoin Fees per Transaction (Mean) data for the period between November 19-25, it is observed that the indicator reached 0.00000921 on November 19, the first day of the week.
A fluctuating trend was observed until November 22, and on that date, the indicator recorded its lowest value of the week at 0.00000624.
In this context, as a result of the increase in Bitcoin price volatility as of November 22, the indicator regained momentum and followed a positive trend due to the impact of price volatility.
On November 25, the last day of the weekly period, the indicator closed the week at 0.00000895.
Bitcoin: Fees (Total)
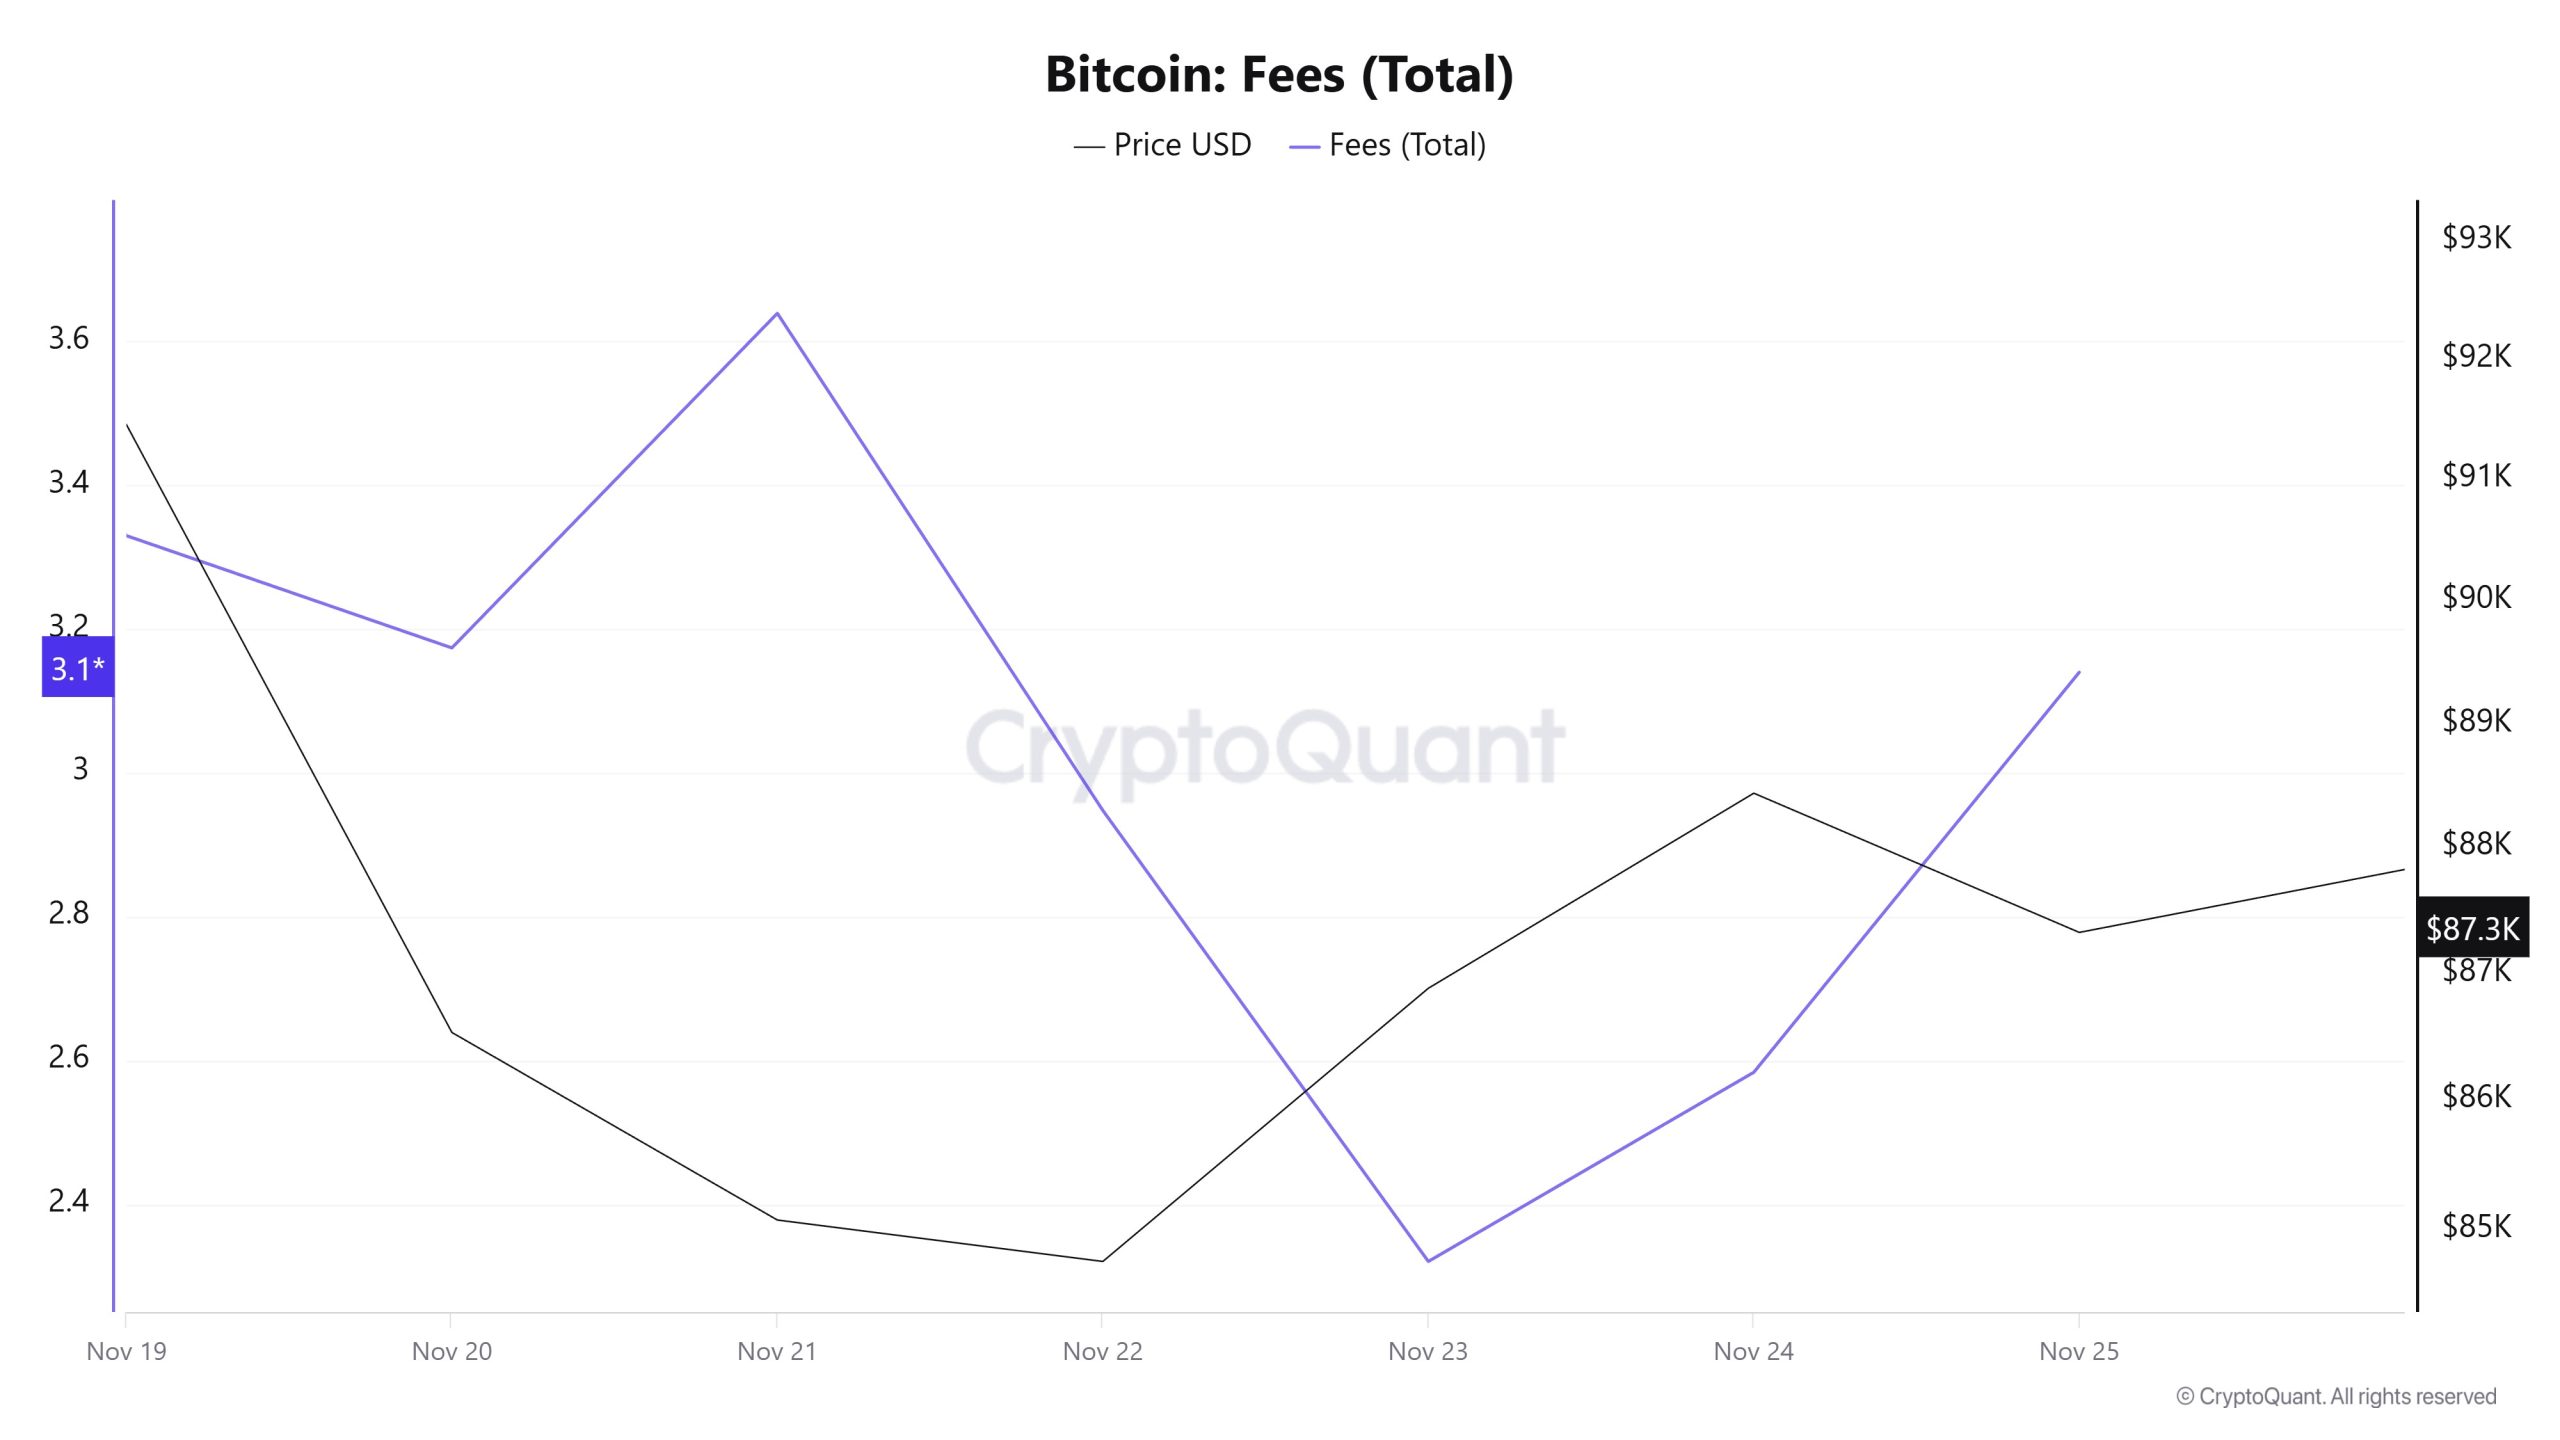
Similarly, when examining the Bitcoin Fees (Total) data for November 19-25 at , it can be seen that on November 19, the first day of the week, the indicator stood at 3.32947906.
A fluctuating trend was observed until November 23, and on this date, the indicator recorded the week’s lowest value at 2.32061272.
In this context, as a result of the increase in Bitcoin price volatility as of November 23, the indicator regained momentum and followed a positive trend due to the impact of price volatility.
On November 25, the last day of the weekly period, the indicator closed the week at 3.13968156.
Miner Flows

According to data obtained from the Miner Reserve table, a decrease in Bitcoin reserves held in miners’ wallets was observed this week. A time-dependent correlation structure between the Bitcoin price and miner reserve was observed during the period under review. However, the general trend shows that a positive correlation between these two variables is dominant.
Miner Inflow, Outflow, and Netflow
Between November 19 and 25, 72,032 Bitcoin were withdrawn from miners’ wallets, while 69,000 Bitcoin were deposited into miners’ wallets during the same period. This week’s Miner Netflow was -3,032 Bitcoin. Meanwhile, the Bitcoin price was $91,454 on November 19 and $87,325 on November 25.
Throughout the week, Bitcoin inflows into miner wallets (Miner Inflow) were less than Bitcoin outflows from miner wallets (Miner Outflow), resulting in a negative net flow (Miner Netflow).
| Date | Miner Inflow | Miner Outflow | Miner Netflow |
|---|---|---|---|
| November 19 | 9,727.67 | 10,075.93 | -348.26 |
| November 20 | 12,605.55 | 12,315.10 | 290.45 |
| November 21 | 18,210.65 | 18,124.27 | 86.38 |
| November 22 | 8,019.43 | 10,954.00 | -2,934.57 |
| November 23 | 4,493.41 | 4,646.64 | -153.22 |
| November 24 | 9,385.05 | 9,137.60 | 247.45 |
| November 25 | 6,558.53 | 6,779.33 | -220.80 |
Transaction
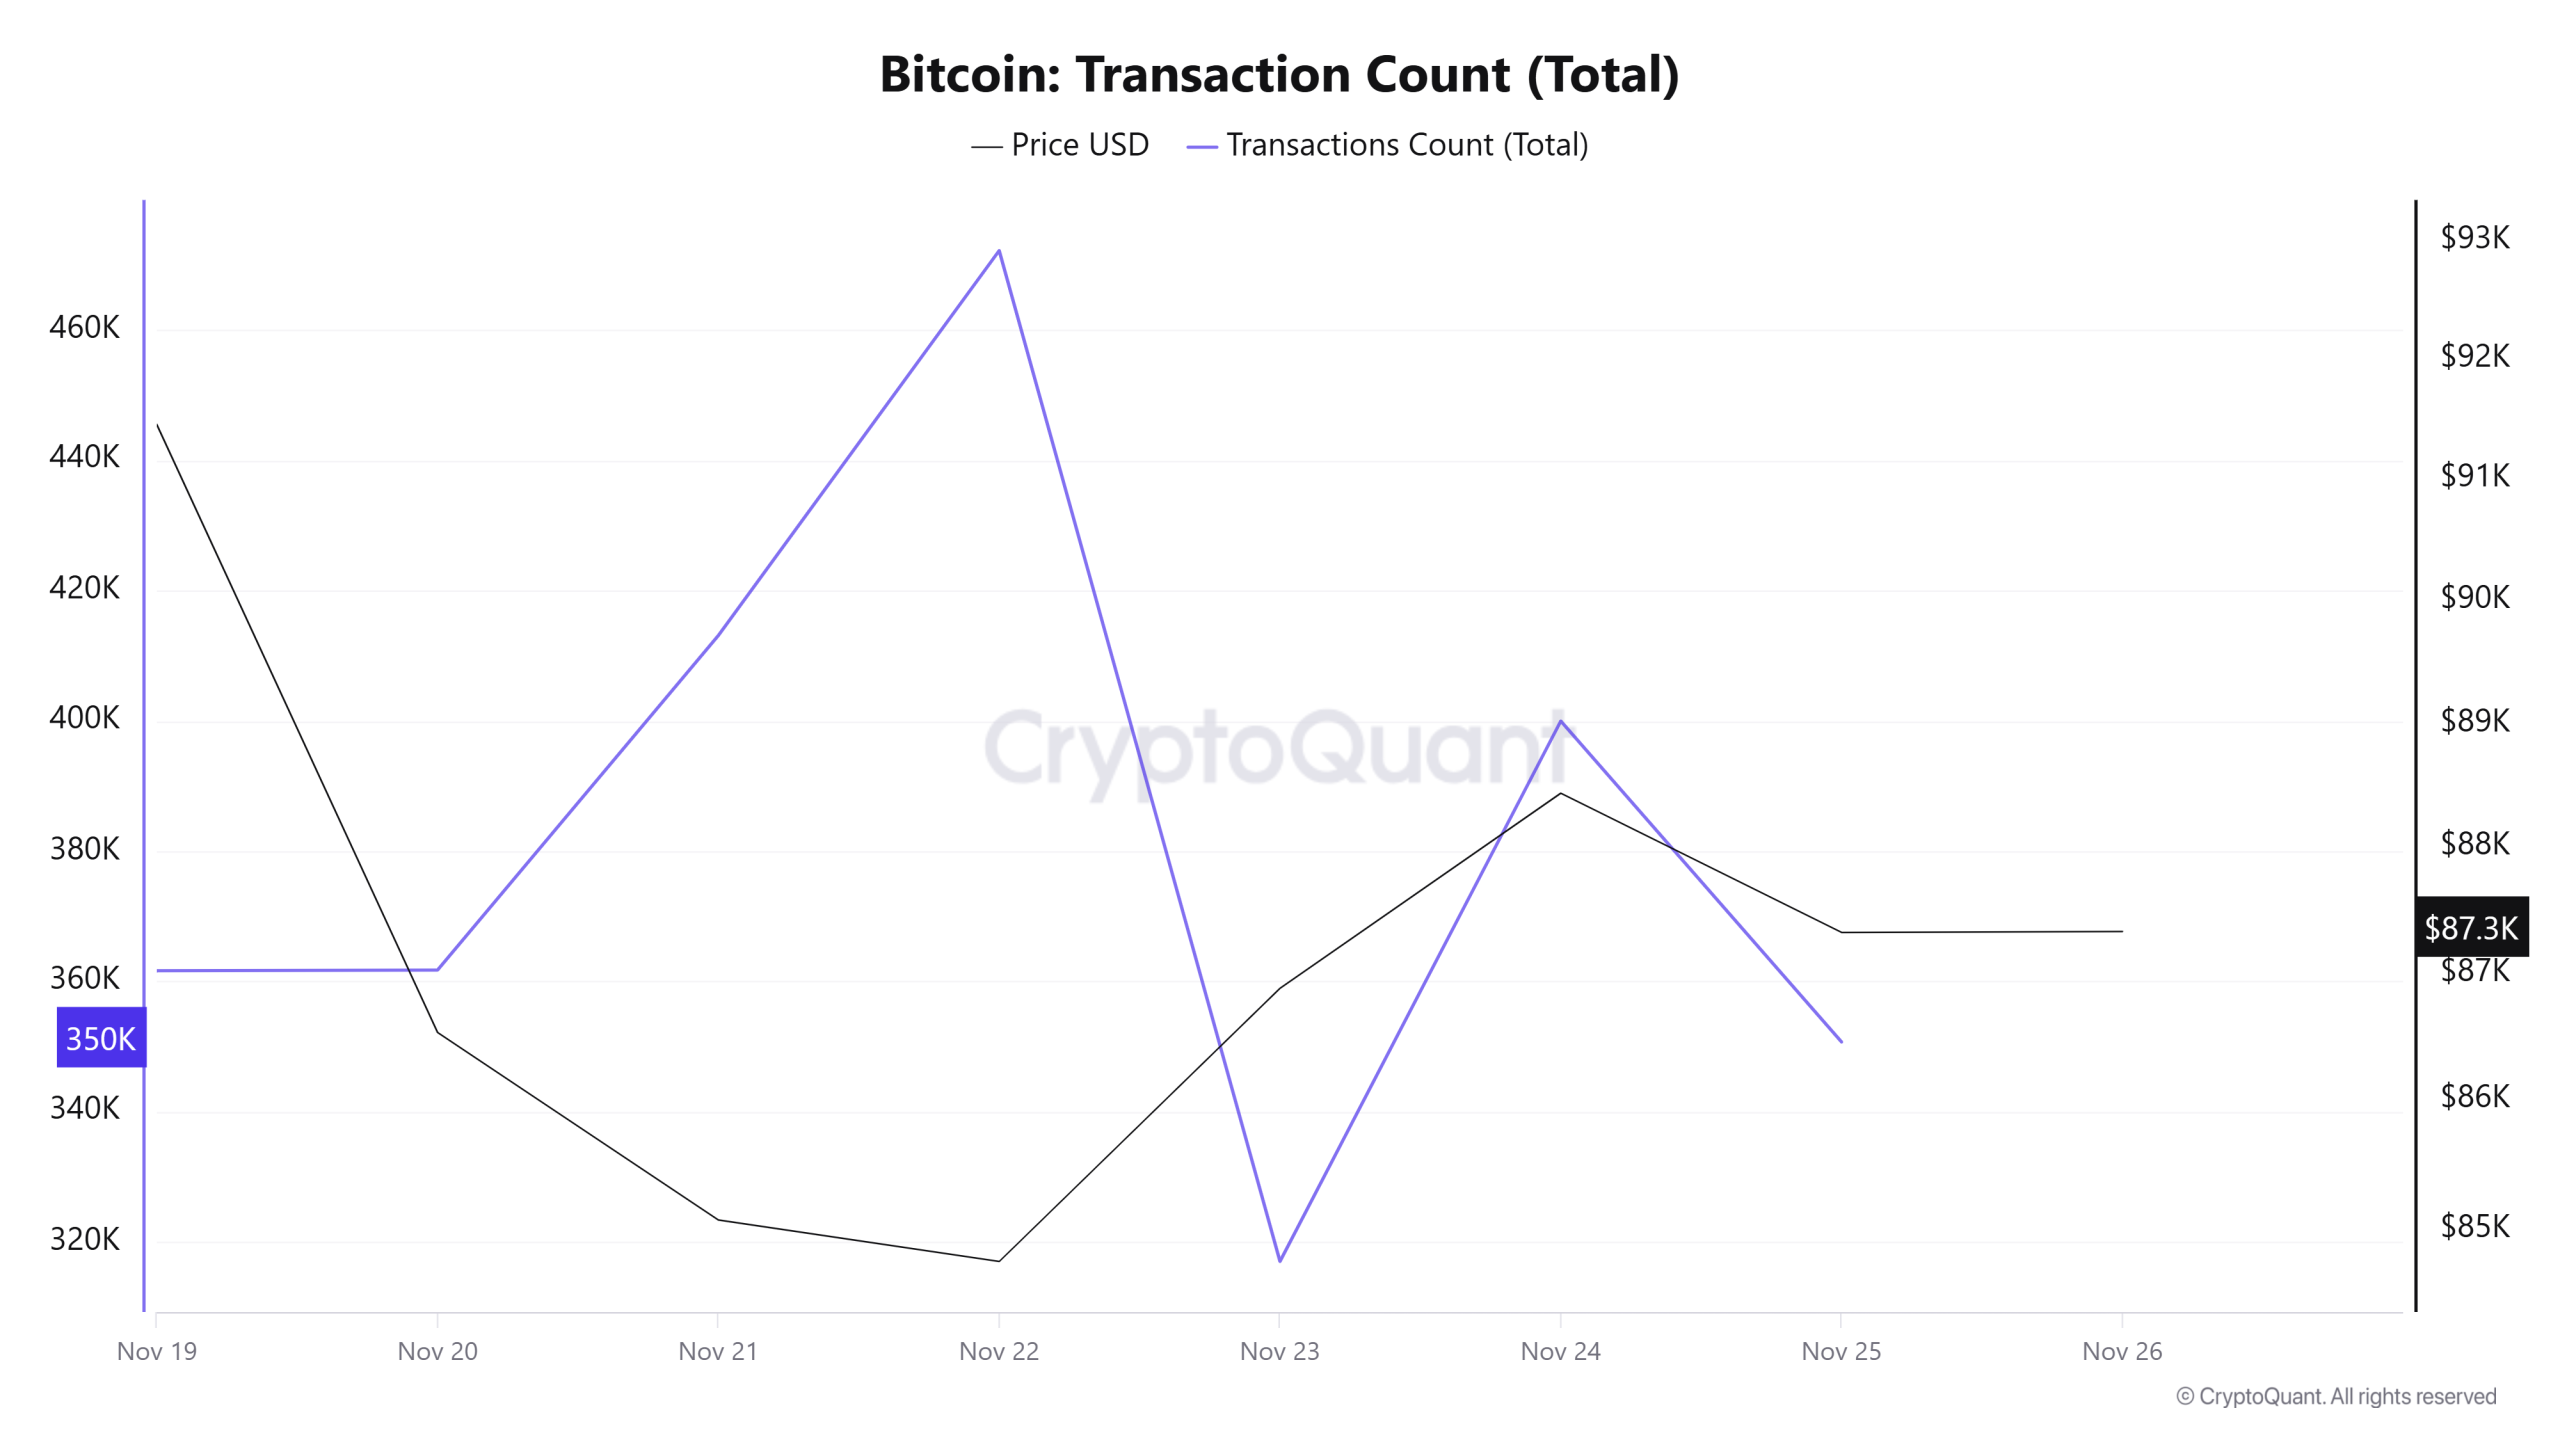
Last week, 3,217,864 transactions were executed on the Bitcoin network, while this week the number of transactions fell to 2,676,366, showing a decrease of approximately 16.8%. The highest transaction volume of the week was recorded on November 22 at 472,199, while the lowest number of transactions was recorded on November 23 at 317,031.
When examining the relationship between transaction count and price, a negative correlation is noticeable throughout the period (consistently between 19 and 23). On the other hand, the weekend network activity intensity observed over the past few weeks appears to have continued this week as well. A noteworthy detail is that on-chain activity intensifies on weekends during weeks when the price experiences sharp declines, while activity is higher during the week when the price is flat or rising.
Tokens Transferred
During the previous period, a total of 6,760,478 BTC was transferred, while this week it increased by 15% to reach 7,772,454 BTC. The highest daily transfer of the week was recorded on November 21 at 1,495,118 BTC, while the lowest transfer volume was recorded on November 25 at 784,058 BTC. The correlation between the amount of tokens transferred and the price remained stable on a weekly basis.
While the amount of Bitcoin transferred decreased, the increase in the number of transactions indicates that higher-value and higher-volume transactions were concentrated during this period. This pattern suggests that the impact of fewer but larger user transactions on the price became more pronounced during this period.
Whale Activities

Whale Data:
Looking at whale activity on centralized exchanges over the past 7 days based on crypto market data, we see that activity remained within a narrow band until the middle of the period, when momentum increased and volume rose. It then fell back into the narrow band. Looking at the Exchange Whale Ratio metric, on November 19, the first day of the 7-day period, the ratio of whales using centralized exchanges was 0.375. It reached its lowest point on November 21, falling to 0.328. It reached its peak on November 22, reaching 0.604. When this ratio is above the 0.35–0.45 band, it generally means that whales frequently use centralized exchanges. Currently at 0.422, the metric shows that whales are using centralized exchanges less. During this period, the price fluctuated between $93,100 and $80,600. This signaled that centralized exchanges were being used by whales to sell. At the same time, total BTC transfers increased by 15% compared to last week, with 7,772,454 BTC moving. The data showed that whales accumulated 26,430 BTC during the price decline to $85,000. This stands in sharp contrast to the 87% drop in whale trading volume observed in mid-November, which may indicate a shift towards cold storage rather than direct selling. Since November 11, the number of wallets controlling 100 BTC or more has been increasing, suggesting that large investors are starting to accumulate again. Santiment reports that 91 more large wallets have emerged since November 11. In contrast, the group of small investors, especially those holding up to 0.1 BTC, is steadily shrinking, which is often associated with retail investors giving up. As a result, this contrast between retail panic and institutional confidence has become the defining feature of the current market environment.
BTC Onchain Overall
| Metric | Positive 📈 | Negative 📉 | Neutral ➖ |
|---|---|---|---|
| Active Addresses | ✓ | ||
| Breakdowns | ✓ | ||
| Derivatives | ✓ | ||
| Supply Distribution | ✓ | ||
| Exchange Supply Ratio | ✓ | ||
| Exchange Reserve | ✓ | ||
| Fees and Revenues | ✓ | ||
| Miner Flows | ✓ | ||
| Transaction | ✓ | ||
| Whale Activity | ✓ |
*The metrics and guidance provided in the table do not alone explain or imply any expectation regarding future price changes in any asset. The prices of digital assets can fluctuate based on numerous different variables. The on-chain analysis and related guidance are intended to assist investors in their decision-making process, and basing financial investments solely on the results of this analysis may lead to unfavorable outcomes. Even if all metrics produce positive, negative, or neutral results simultaneously, the expected outcomes may not materialize depending on market conditions. It would be beneficial for investors reviewing the report to take these warnings into consideration.
Legal Notice
The investment information, comments, and recommendations contained in this document do not constitute investment advisory services. Investment advisory services are provided by authorized institutions on a personal basis, taking into account the risk and return preferences of individuals. The comments and recommendations contained in this document are of a general nature. These recommendations may not be suitable for your financial situation and risk and return preferences. Therefore, making an investment decision based solely on the information contained in this document may not result in outcomes that align with your expectations.
NOTE: All data used in Bitcoin on-chain analysis is based on CryptoQuant.