
Introduction
In recent years, cryptocurrency-based exchange-traded funds have become increasingly visible in the traditional financial world. The interest generated by the market entry of Bitcoin and Ethereum Spot ETFs showed that institutional investors now view digital assets not only as an alternative but as a strategic element in their portfolios. Solana (SOL) took center stage in the third phase of this process.
In late October 2025, two Spot Solana ETFs began trading on U.S. exchanges:
- Bitwise Solana Staking ETF (BSOL)
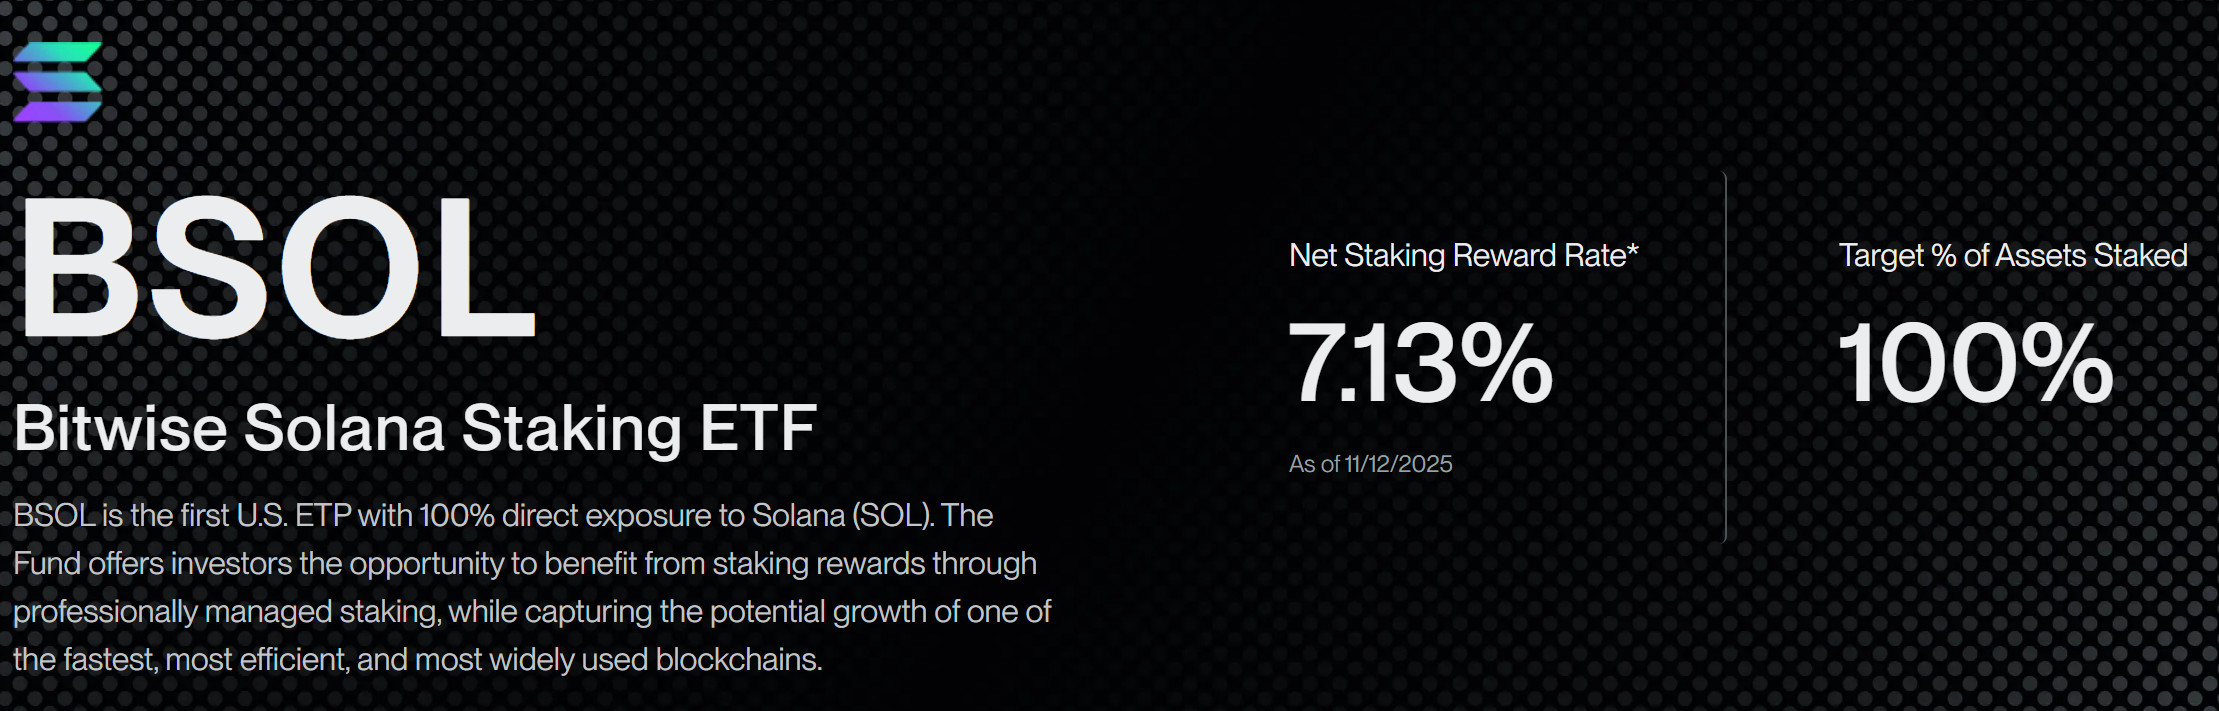
Source: https://bsoletf.com/
- Grayscale Solana ETF (GSOL)
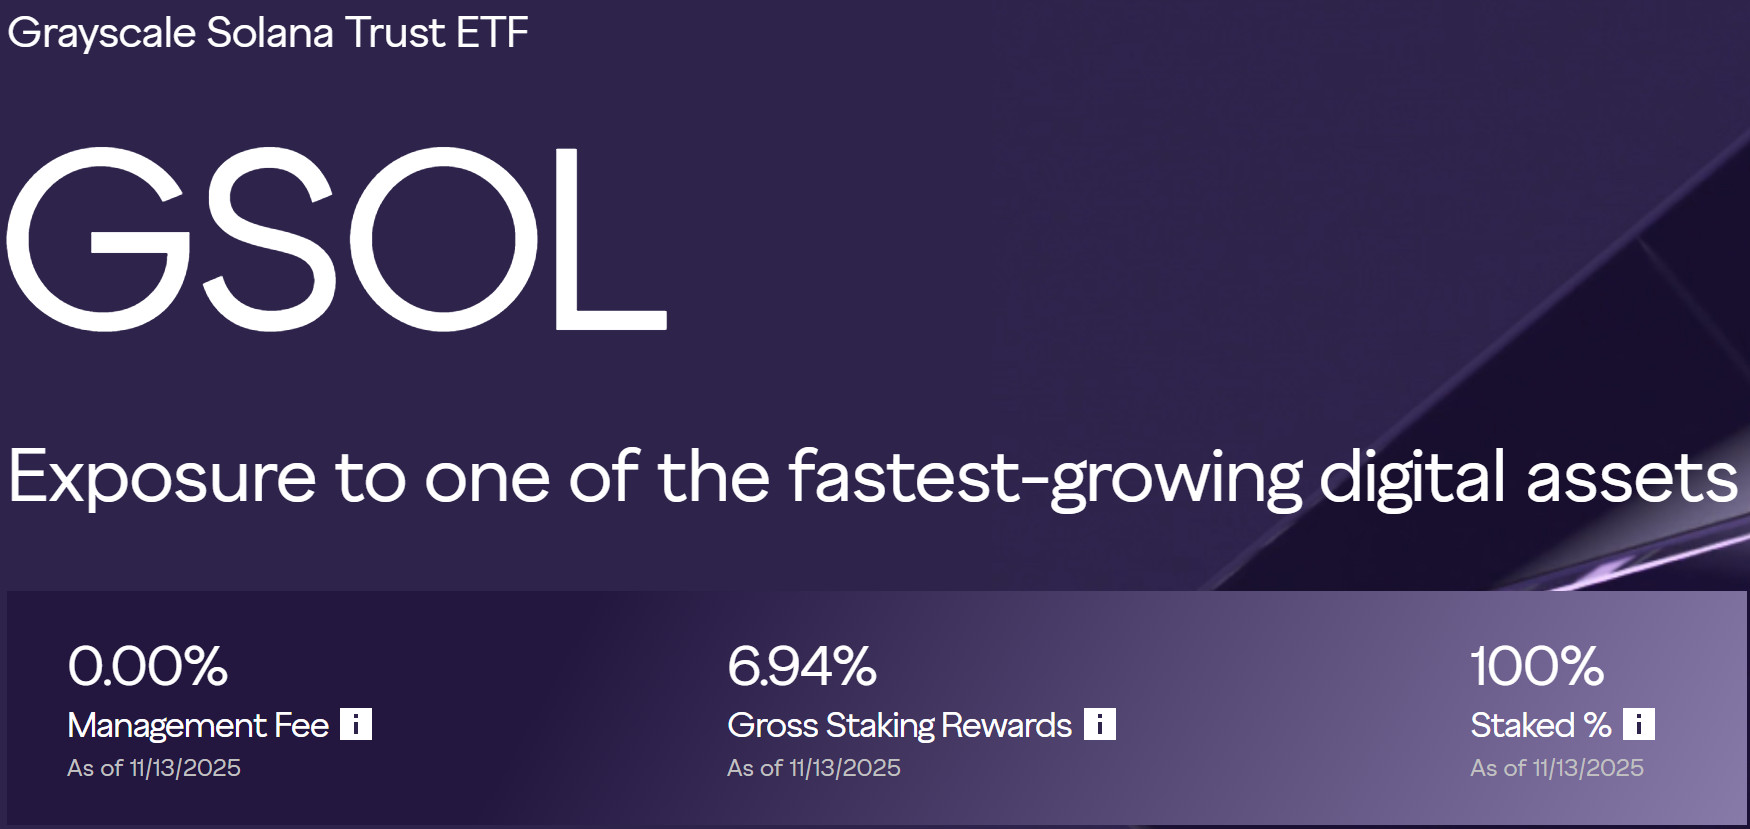
Source: https://etfs.grayscale.com/gsol
Thanks to these two products, investors can now buy and sell SOL positions through traditional brokerage accounts without having to open a wallet directly on Solana or enter crypto exchanges. Thus, following its rapid rise in the crypto world, Solana began to be represented by an organized investment product on Wall Street for the first time.
So why was Solana chosen as the third crypto ETF? The answer is quite clear. The Solana network is one of the most talked-about Layer-1 chains of recent times, thanks to its high transaction speed, low costs, and growing application ecosystem. Developer activity, commercialized projects, and increasing user numbers have made Solana the strongest candidate to enter the radar of institutional investors after Ethereum. With the approval of spot ETFs, SOL has now risen to become an asset actively evaluated not only by crypto investors but also by broader portfolio managers on Wall Street.
In this report, we will examine in detail the performance of Solana ETFs launched in the US since their launch, fund flow data, and the impact of this process on the SOL spot price.
Solana ETF Launch – ETF Performance, Fund Flows, and Post-Launch Data
Pre-launch “seed” investments highlighted institutional appetite for Solana ETFs from the very beginning. Bitwise’s BSOL fund entered the market with $222.9 million in initial capital, while Grayscale’s GSOL fund launched with $102.7 million. Thus, over $325 million in seed capital ensured that Solana ETFs began trading with significant liquidity support from day one.
Looking at the fee structure, Bitwise took an aggressive position with a 0.20% management fee, while Grayscale offered a 5.6% annual reward by keeping all SOL assets staked in exchange for a 0.35% fee. The fact that both funds are staking-supported stood out as an important feature that distinguishes Solana ETFs from Bitcoin and Ethereum ETFs.
Source: Darkex Research Department
Solana ETFs began trading in the US on October 28, 2025. Bitwise BSOL had one of the strongest ETF launches of 2025 on its launch day, with $69.5 million in net inflows and $57.9 million in trading volume. BSOL’s staking feature and low fee structure quickly attracted the attention of institutional investors.
Grayscale’s GSOL ETF also began trading that same week. Although GSOL opened with more modest volume, it attracted long-term investors by offering a 5.66% annual reward by holding 641,000 SOL in staking.
Table 1 – Spot Solana ETF Flows
| Date | Bitwise (BSOL) | Grayscale (GSOL) | Total ($M) |
|---|---|---|---|
| October 28, 2025 | 69.5 | – | 69.5 |
| October 29, 2025 | 46.5 | 1.4 | 47.9 |
| October 30, 2025 | 36.5 | 0.8 | 37.3 |
| October 31, 2025 | 44.5 | 0 | 44.5 |
| November 3, 2025 | 65.2 | 4.9 | 70.1 |
| November 4, 2025 | 13.2 | 1.7 | 14.9 |
| November 5, 2025 | 7.5 | 2.2 | 9.7 |
| November 6, 2025 | 29.2 | 0 | 29.2 |
| November 7, 2025 | 11.7 | 1 | 12.7 |
| November 10, 2025 | 5.9 | 0.9 | 6.8 |
| November 11, 2025 | 2.1 | 5.9 | 8 |
| November 12, 2025 | 12.5 | 5.6 | 18.1 |
| November 13, 2025 | 1.5 | 0 | 1.5 |
| Total | 345.8 | 24.4 | 370.2 |
Source: Farside Investors
Looking at Table 1, we see that BSOL alone accounts for 93% of flows, while GSOL continues with lower volume but steady daily inflows.
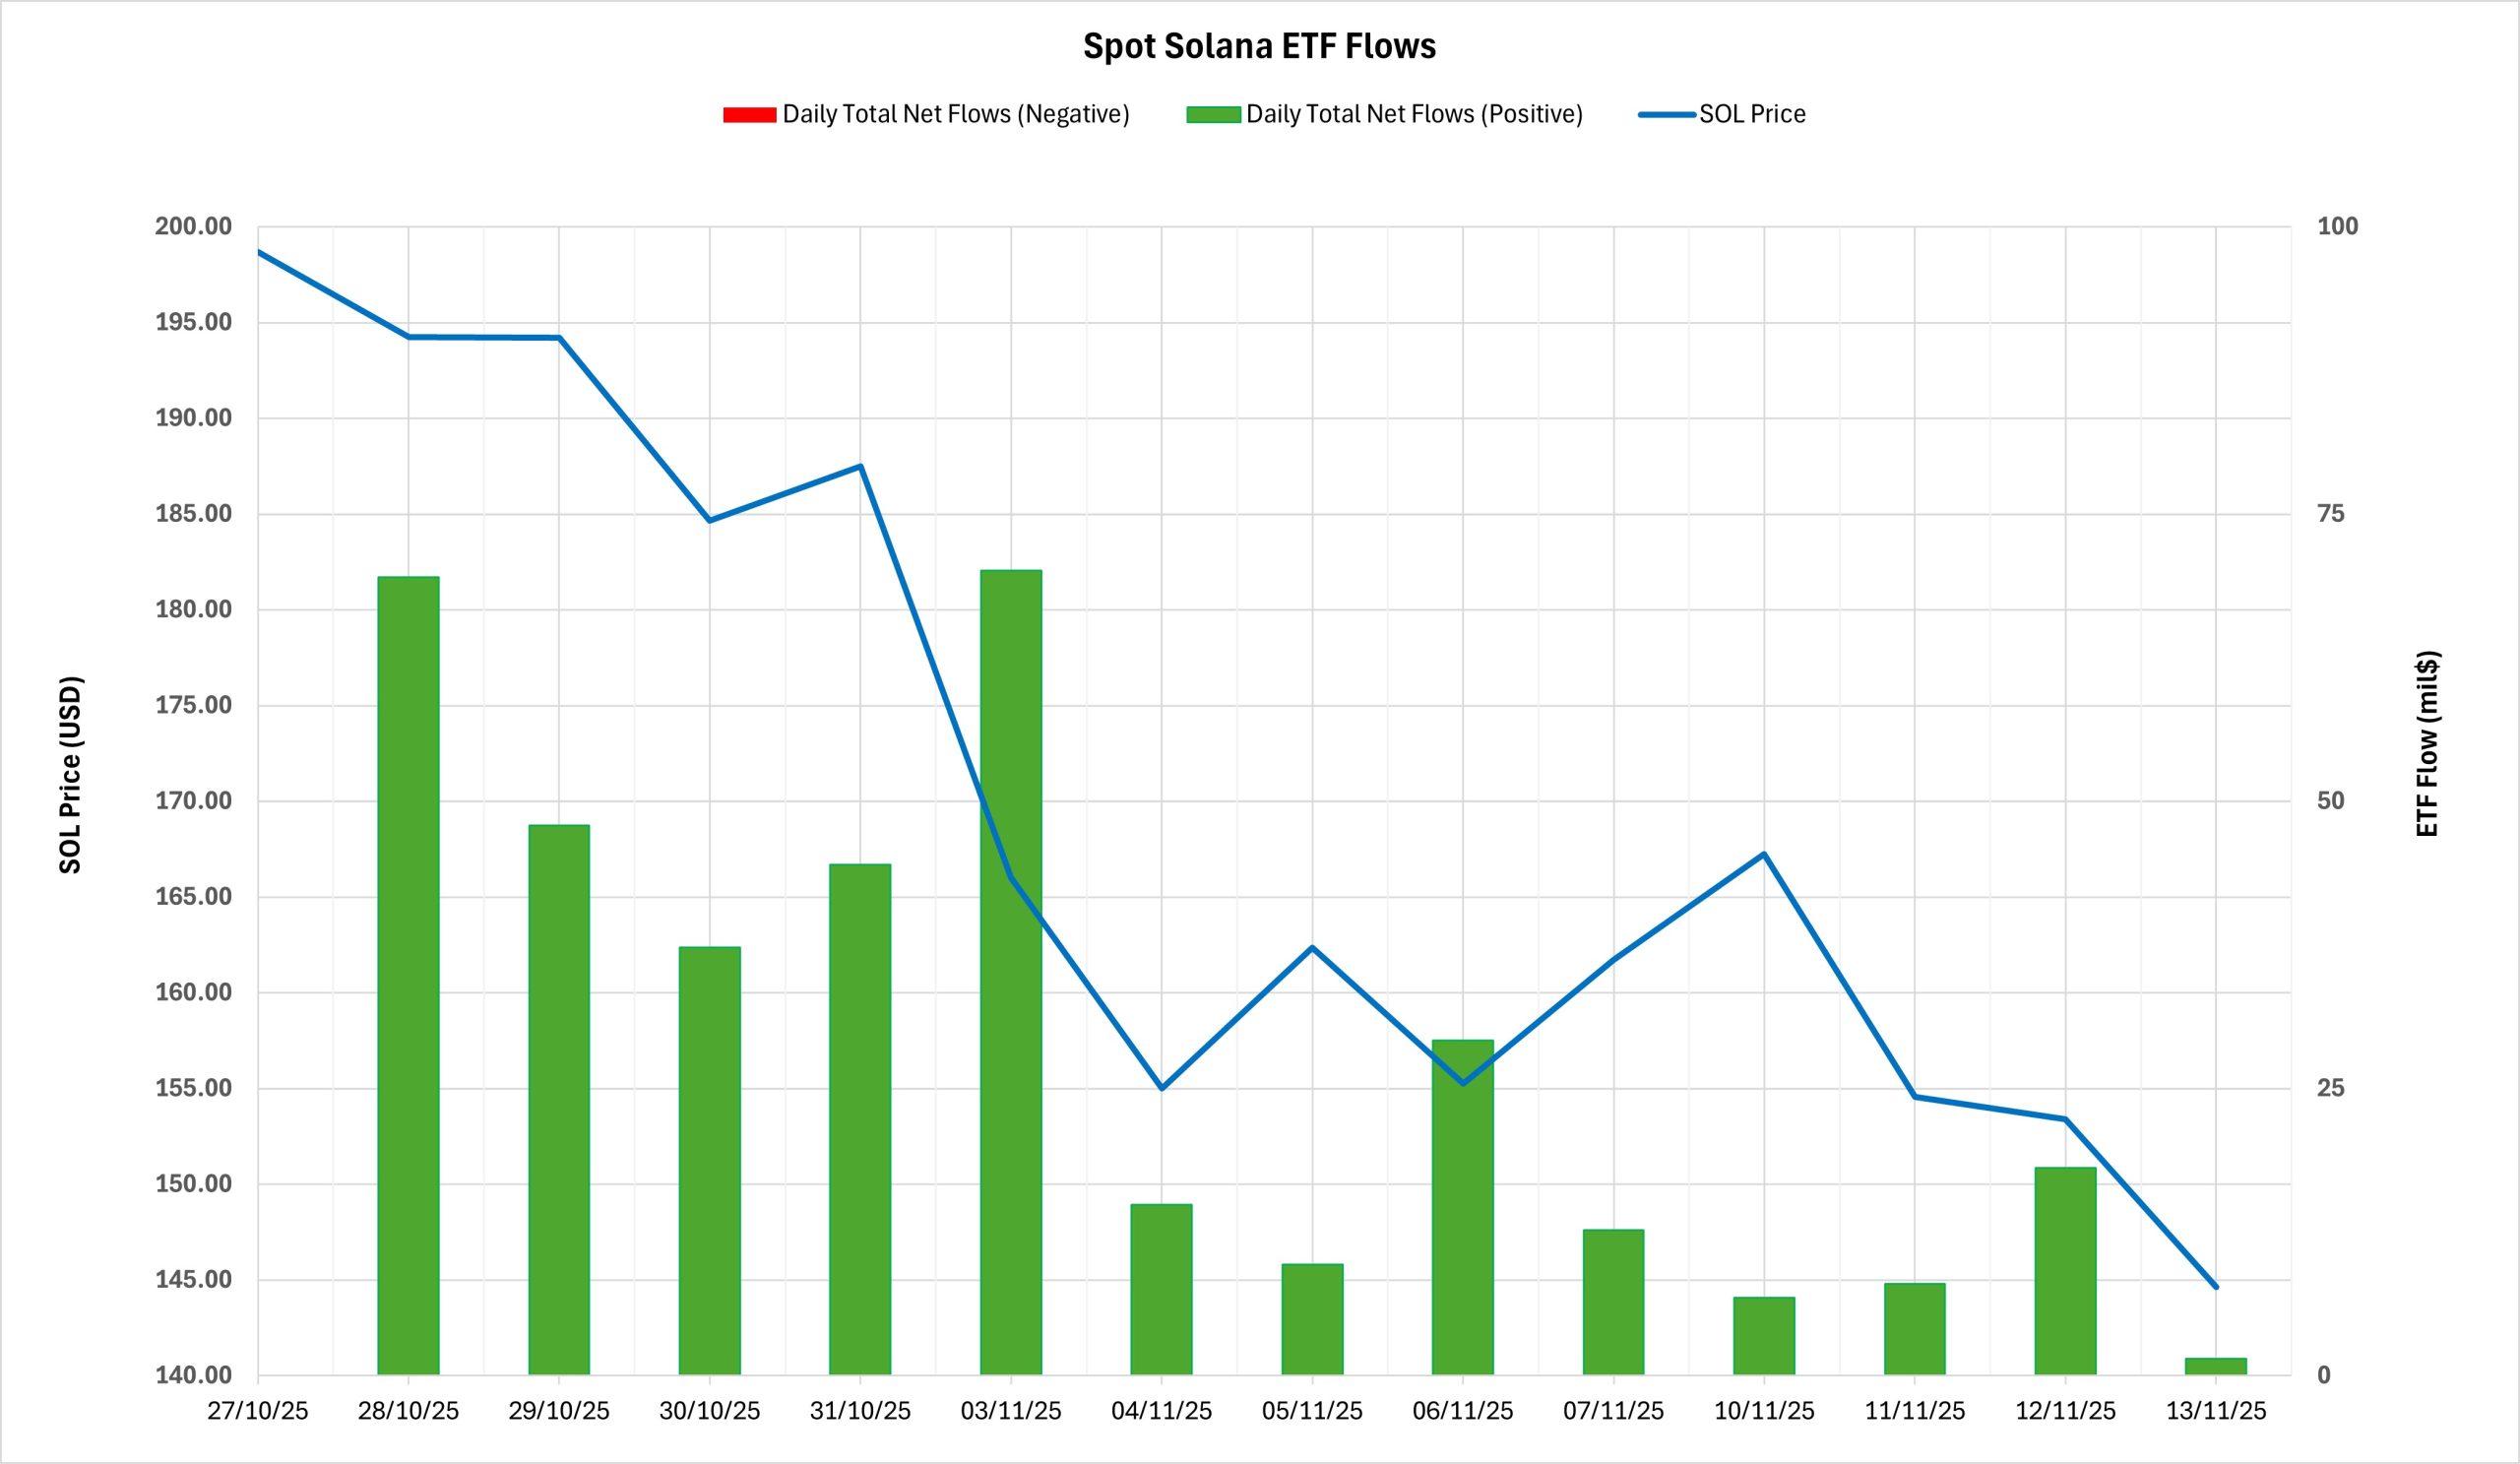
Table 2 – Spot Solana ETF Flows & Daily SOL Price (Oct 28 – Nov 13, 2025)
| Date | Open ($) | Close ($) | Change % | ETF Flow ($M) |
|---|---|---|---|---|
| October 28, 2025 | 198.70 | 194.26 | -2.23% | 69.5 |
| October 29, 2025 | 194.26 | 194.21 | -0.03% | 47.9 |
| October 30, 2025 | 194.21 | 184.66 | -4.92% | 37.3 |
| October 31, 2025 | 184.66 | 187.49 | +1.53% | 44.5 |
| November 1, 2025 | 187.49 | 186.27 | -0.65% | 0 |
| November 2, 2025 | 186.27 | 187.68 | +0.76% | 0 |
| November 3, 2025 | 187.68 | 166.01 | -11.55% | 70.1 |
| November 4, 2025 | 166.01 | 155.00 | -6.63% | 14.9 |
| November 5, 2025 | 155.00 | 162.35 | +4.74% | 9.7 |
| November 6, 2025 | 162.35 | 155.27 | -4.36% | 29.2 |
| November 7, 2025 | 155.27 | 161.72 | +4.15% | 12.7 |
| November 8, 2025 | 161.72 | 157.96 | -2.33% | 0 |
| November 9, 2025 | 157.96 | 164.48 | +4.13% | 0 |
| November 10, 2025 | 164.48 | 167.23 | +1.67% | 6.8 |
| November 11, 2025 | 167.23 | 154.55 | -7.58% | 8 |
| November 12, 2025 | 154.55 | 153.39 | -0.75% | 18.1 |
| November 13, 2025 | 153.39 | 144.62 | -5.72% | 1.5 |
| Total Change (Oct 28–Nov 13) | -27.22% | 370.2 | ||
Source: Farside Investors & CryptoQuant SOL Price Data
Table-2 shows that Solana ETFs recorded positive net inflows on every trading day since launch. Farside Investors data indicates that a total of $370.2 million in net inflows occurred between October 28 and November 13, 2025. Despite this strong demand, a significant selling pressure prevailed across the crypto market during the same period. Increased macroeconomic uncertainties dampened risk appetite, dragging down the crypto market. Consequently, while ETF flows remained positive, the SOL spot price lost approximately 27% of its value during the same period. This situation highlights the dominant impact of macro conditions on prices, despite strong investor interest.
Overall Assessment and Conclusion
The launch of Solana ETFs marked a significant turning point for both the Solana ecosystem and the institutional investment side.
Key findings:
- $325 million in seed capital prior to launch,
- Post-launch net inflows of $370 million,
- Total inflows reaching $420 million in the first week,
- Positive ETF inflows on every trading day,
- Strong institutional demand despite macro pressures,
- The structural advantage created by the staking-enabled ETF model,
Solana now has a permanent and organized place in the traditional financial world as an investment product.
ETFs could change Solana’s pricing structure in the long term. With more institutional capital inflows, SOL could enter a strong repricing cycle in the 2026-2027 period. The Solana Era is just beginning on Wall Street. Regular and stable institutional demand through ETF structures could strengthen Solana’s long-term pricing structure by increasing both its media visibility and market depth.
Disclaimer
This report is prepared for informational and educational purposes only and does not constitute investment advice, financial guidance, or a recommendation to buy or sell any asset. Cryptocurrency markets are highly volatile, and ETF-related data, fund flows, and price movements may change rapidly. Readers should conduct their own research and consult licensed financial professionals before making investment decisions. Neither the authors nor Darkex assume any responsibility for financial losses arising from the use of the information provided.