MARKET SUMMARY
Latest Situation in Crypto Assets
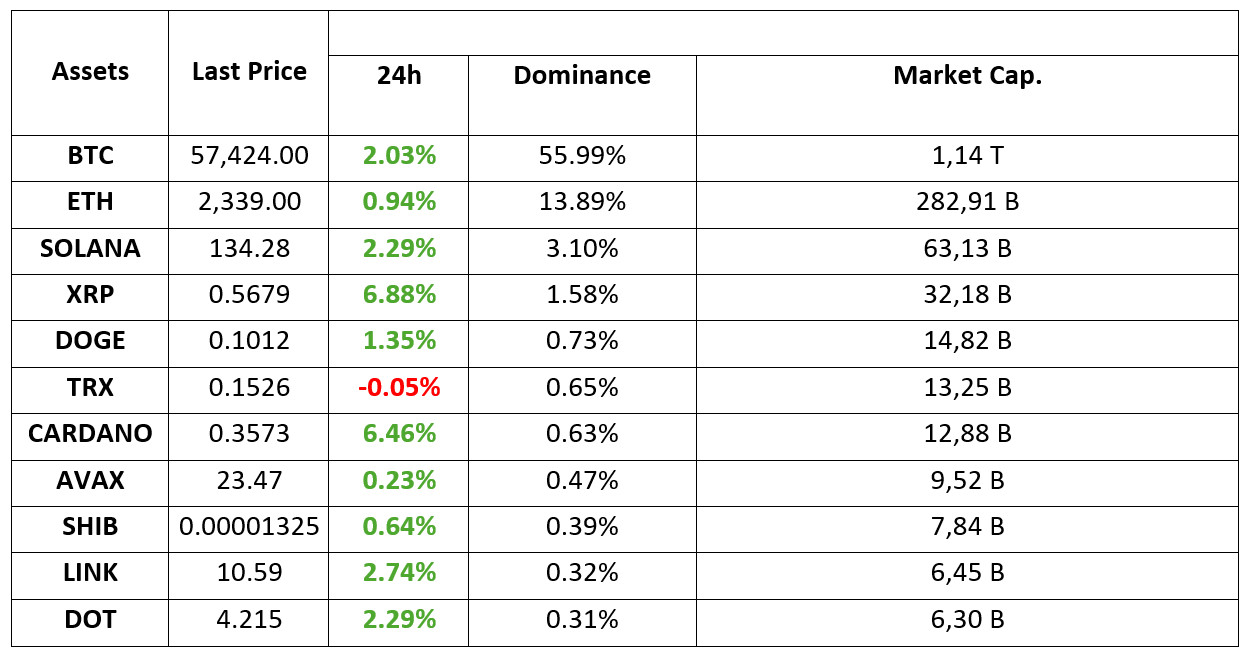
*Table prepared on 12.09.2024 at 14:00 (UTC)
WHAT’S LEFT BEHIND
US Producer Inflation Announced!
The United States of America (USA), the world’s largest economy, is deeply affecting traditional financial markets and the cryptocurrency sector. As of today, the eyes of the money markets were again focused on the data coming from the US.
US Annual Producer Price Index (PPI): Previous: 2.1%, Expected: 1.8%, Announced: 1.7
US Monthly Producer Price Index (PPI):Previous: 0.1%, Expected: 0.1%, Announced: 0.2%
US Annual Core Producer Price Index (PPI): Previous: 2.4%, Expected: 2.5%, Announced: 2.4
US Monthly Core Producer Price Index (PPI): Previous: -0.2%, Expected: 0.2%, Announced: 0.3
US Applications for Unemployment Benefits: Previous: 228 thousand, Expectation: 227 thousand,
Expected: 230 thousand
Critical Expiration in Bitcoin and Ethereum! September 13 for $1.61 Billion
Approximately $1.61 billion worth of Bitcoin and Ethereum (ETH) options expire tomorrow on leading cryptocurrency options exchange Deribit. Tomorrow’s major expiry event includes $1.32 billion worth of BTC options and $290 million worth of ETH options.
Net Outflows in Bitcoin and Ethereum ETFs!
Bitcoin and Ethereum ETFs experienced significant outflows. Some funds tried to stabilize with small inflows. Fidelity’s inflows somewhat mitigated losses in Bitcoin ETFs. Outflows totaled $43.9 million. In particular, Ark’s ARKB ETF experienced the most remarkable movement with an outflow of $54 million. Fidelity’s FBTC ETF offset some of this loss with an inflow of $12.6 million. Invesco’s BTCO ETF also added $2.6 million, while Grayscale’s GBTC and BTC funds recorded outflows of $4.6 million and $0.5 million, respectively.
HIGHLIGHTS OF THE DAY

INFORMATION:
*The calendar is based on UTC (Coordinated Universal Time) time zone. The economic calendar content on the relevant page is obtained from reliable news and data providers. The news in the economic calendar content, the date and time of the announcement of the news, possible changes in the previous, expectations and announced figures are made by the data provider institutions. Darkex cannot be held responsible for possible changes that may arise from similar situations.
MARKET COMPASS
While the US Federal Reserve (FED) is almost certain to cut interest rates by 25 basis points at its September meeting, today’s US data seems to have underlined this belief once again. Producer Price Index (PPI) figures for August came in above market expectations. Although the July data was revised downwards, the higher-than-expected inflation in August seems to have led the markets to think that the FED has moved further away from a 50 basis points rate cut at its next meeting.
BTC, which soared to its peak on September 4 as recession concerns diminished and the FED was about to start its interest rate cut cycle, saw some pressure from these levels. Equity markets also seem to have preferred to remain somewhat cautious for now as the weekend approaches. US indices are slightly negative.
Compared to the past weeks, there are still signs that overall market sentiment is more risk averse. However, we can observe that major digital assets are struggling as they approach some of their critical resistances. While it is hard to say that there is a strong upside potential, in the short-term picture, it seems more logical to consider pullbacks as long positions. Still, it may be healthy to keep Kar-Al points close in order to avoid downside risks.
TECHNICAL ANALYS
BTC/USDT
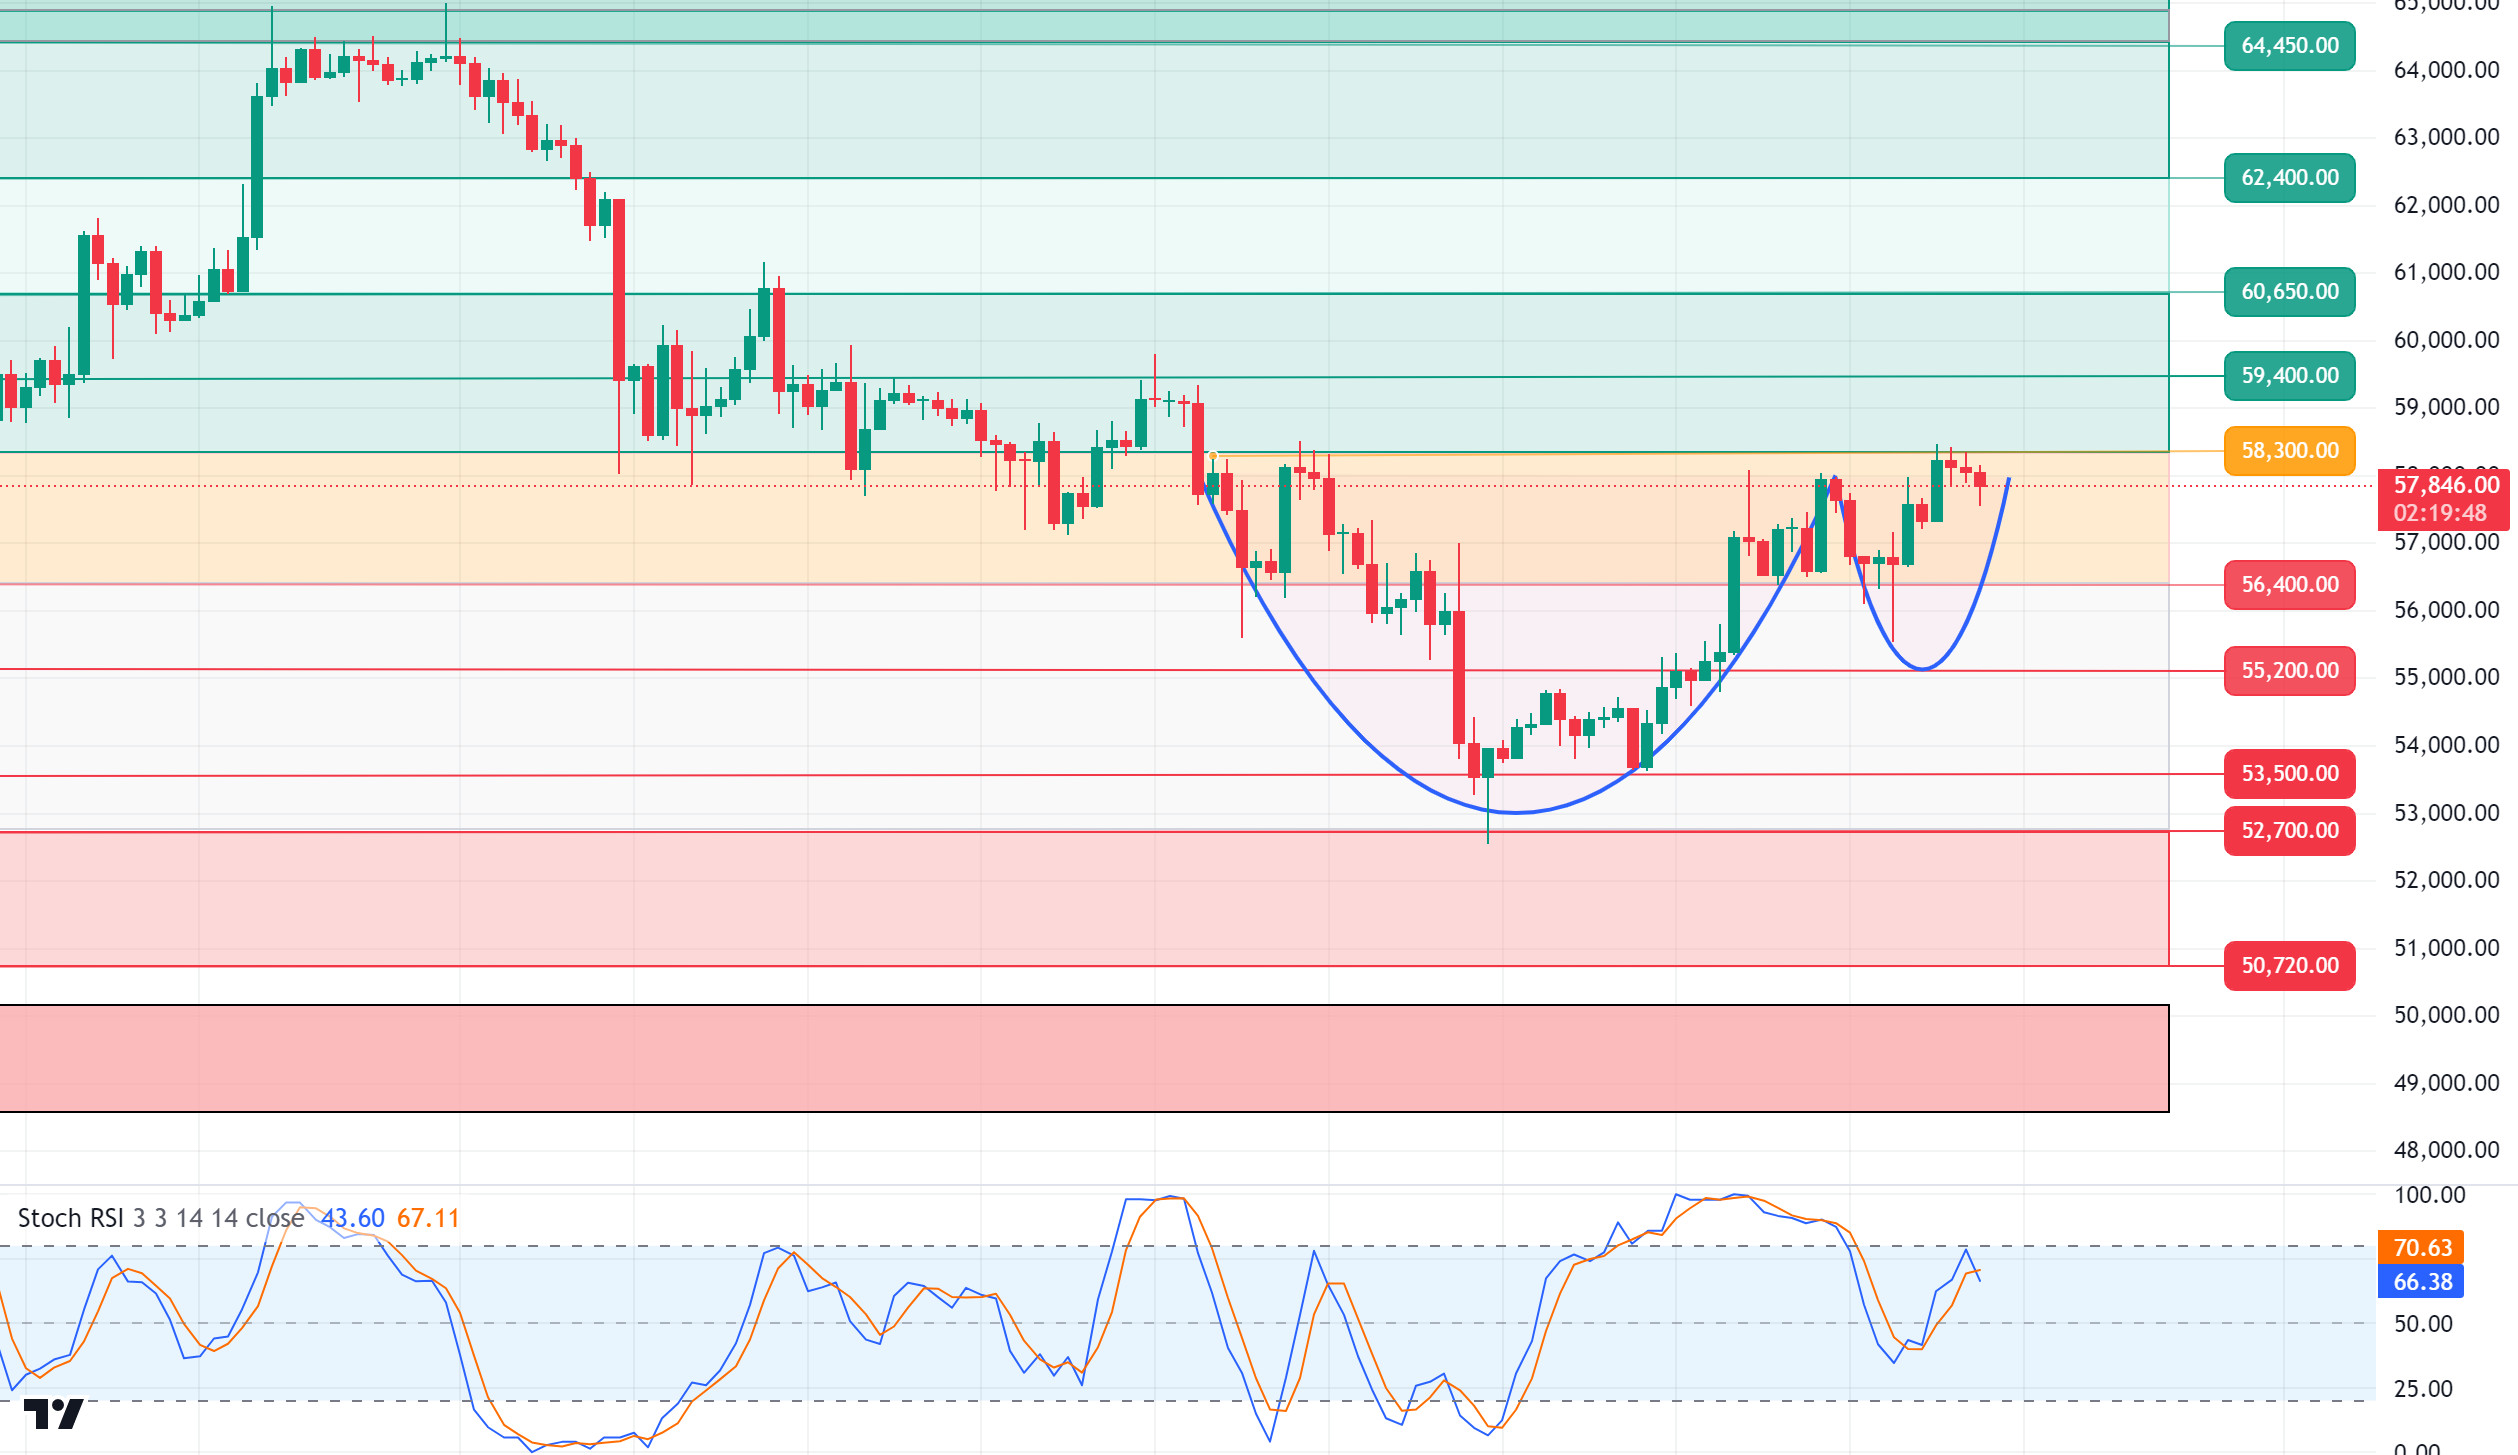
Bitcoin miners sold a large amount as mining difficulty reached an all-time high. According to shared data, miners sold 30 thousand BTC in the last four days. In addition, Bitcoin ETF outflows turned negative again after a two-day positive trend. Despite all this, Bitcoin continues to push the 58,000 level. Undoubtedly, we can say that the reason for the strong stance is the positive inflation data coming from the US and the possibility of interest rate cut expectations gaining certainty. In the BTC 4-hour technical analysis, the price, which tested the 58,300 resistance level during the day, failed to pass this level and fell back to 57,700 levels. In line with the data released today, the positive opening of the US stock markets, showing that the inflationary pressures of the US economy have eased slightly and the labor market is relatively stable, may enable BTC to exceed 58,000 levels. Otherwise, the 56,400 level appears as a support point in the possibility of negative pricing.
Supports 57,200 – 55,200 – 56,400
Resistances 58,300 – 59,400 – 60,650
ETH/USDT
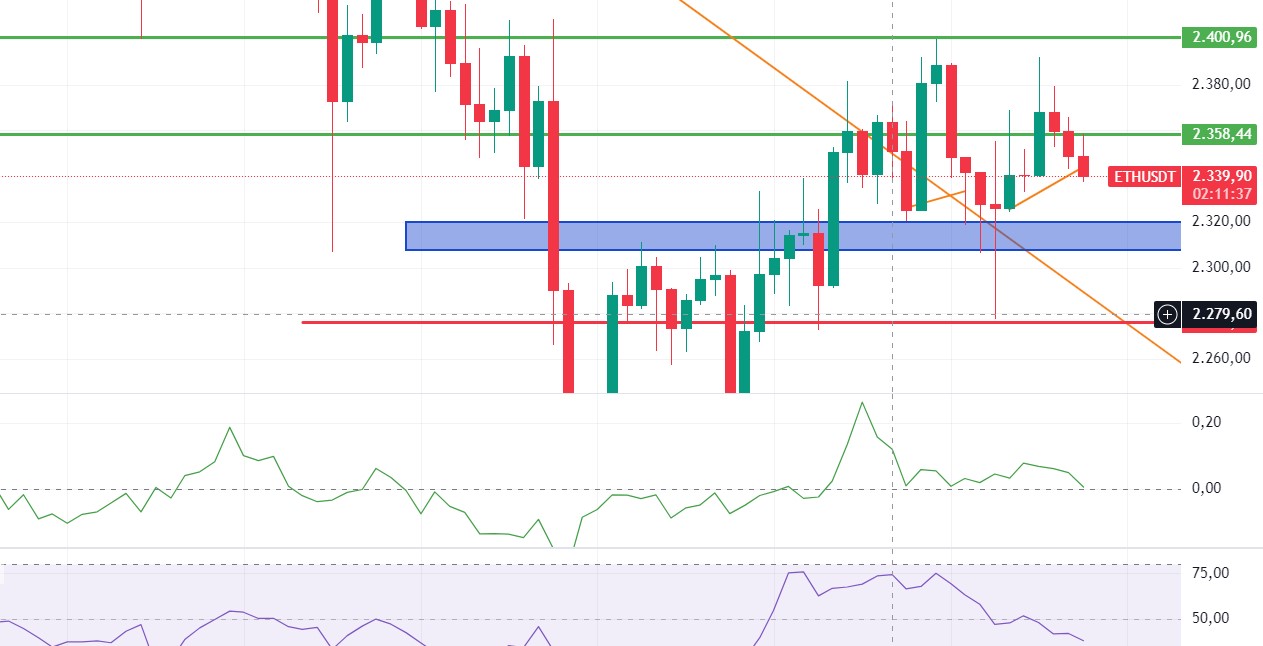
The Arbitrum team transferred a high number of Ethereum to exchanges. At the same time, MFI and CMF continue to be positive structures in Ethereum, which has retreated again after the unemployment benefits and core producer price index data announced in the US. For this reason, it can be expected to retest the 2,400 level again, although it retreated a little more during the day. The 2,307 level is the first main support point to follow. Breaking this level may bring sharp declines.
Supports 2,307 – 2,273 – 2,194
Resistances 2,358 – 2,400 – 2,451
LINK/USDT
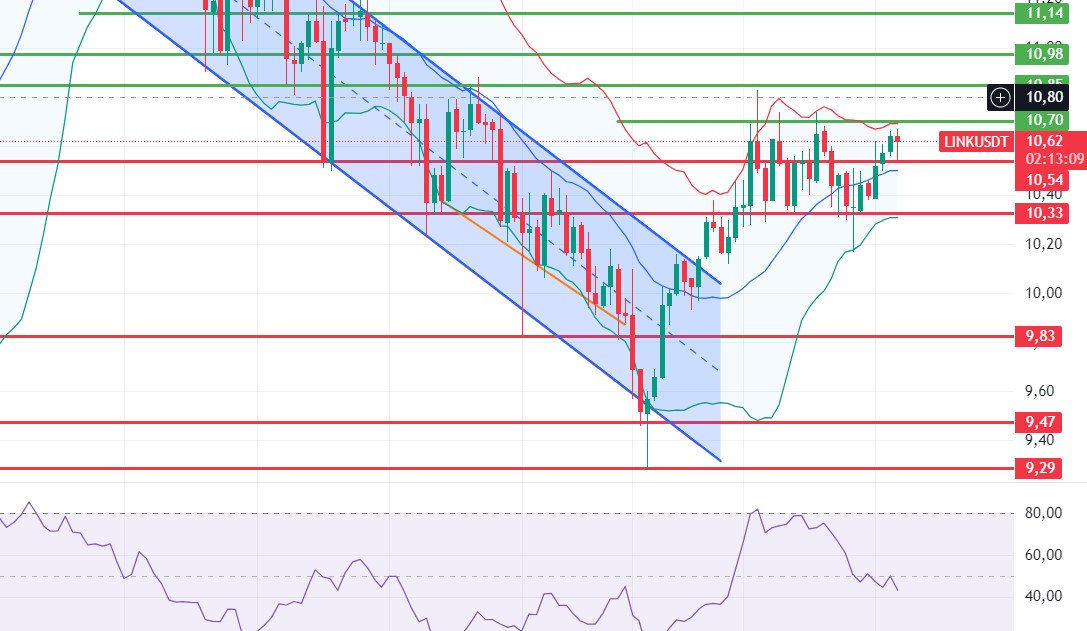
LINK, which tested the 10.54 level with the retracement in the market, continues to rise with a large positive mismatch in MFI. Closures above 10.70, the Bollinger upper band, and 10.85, the main resistance level, could accelerate the rise. Breaking the 10.54 intermediate support may cause retracements back to 10.33 levels.
Supports 10.54 – 10.33 – 9.83
Resistances 10.70 – 10.85 – 11.45
SOL/USDT
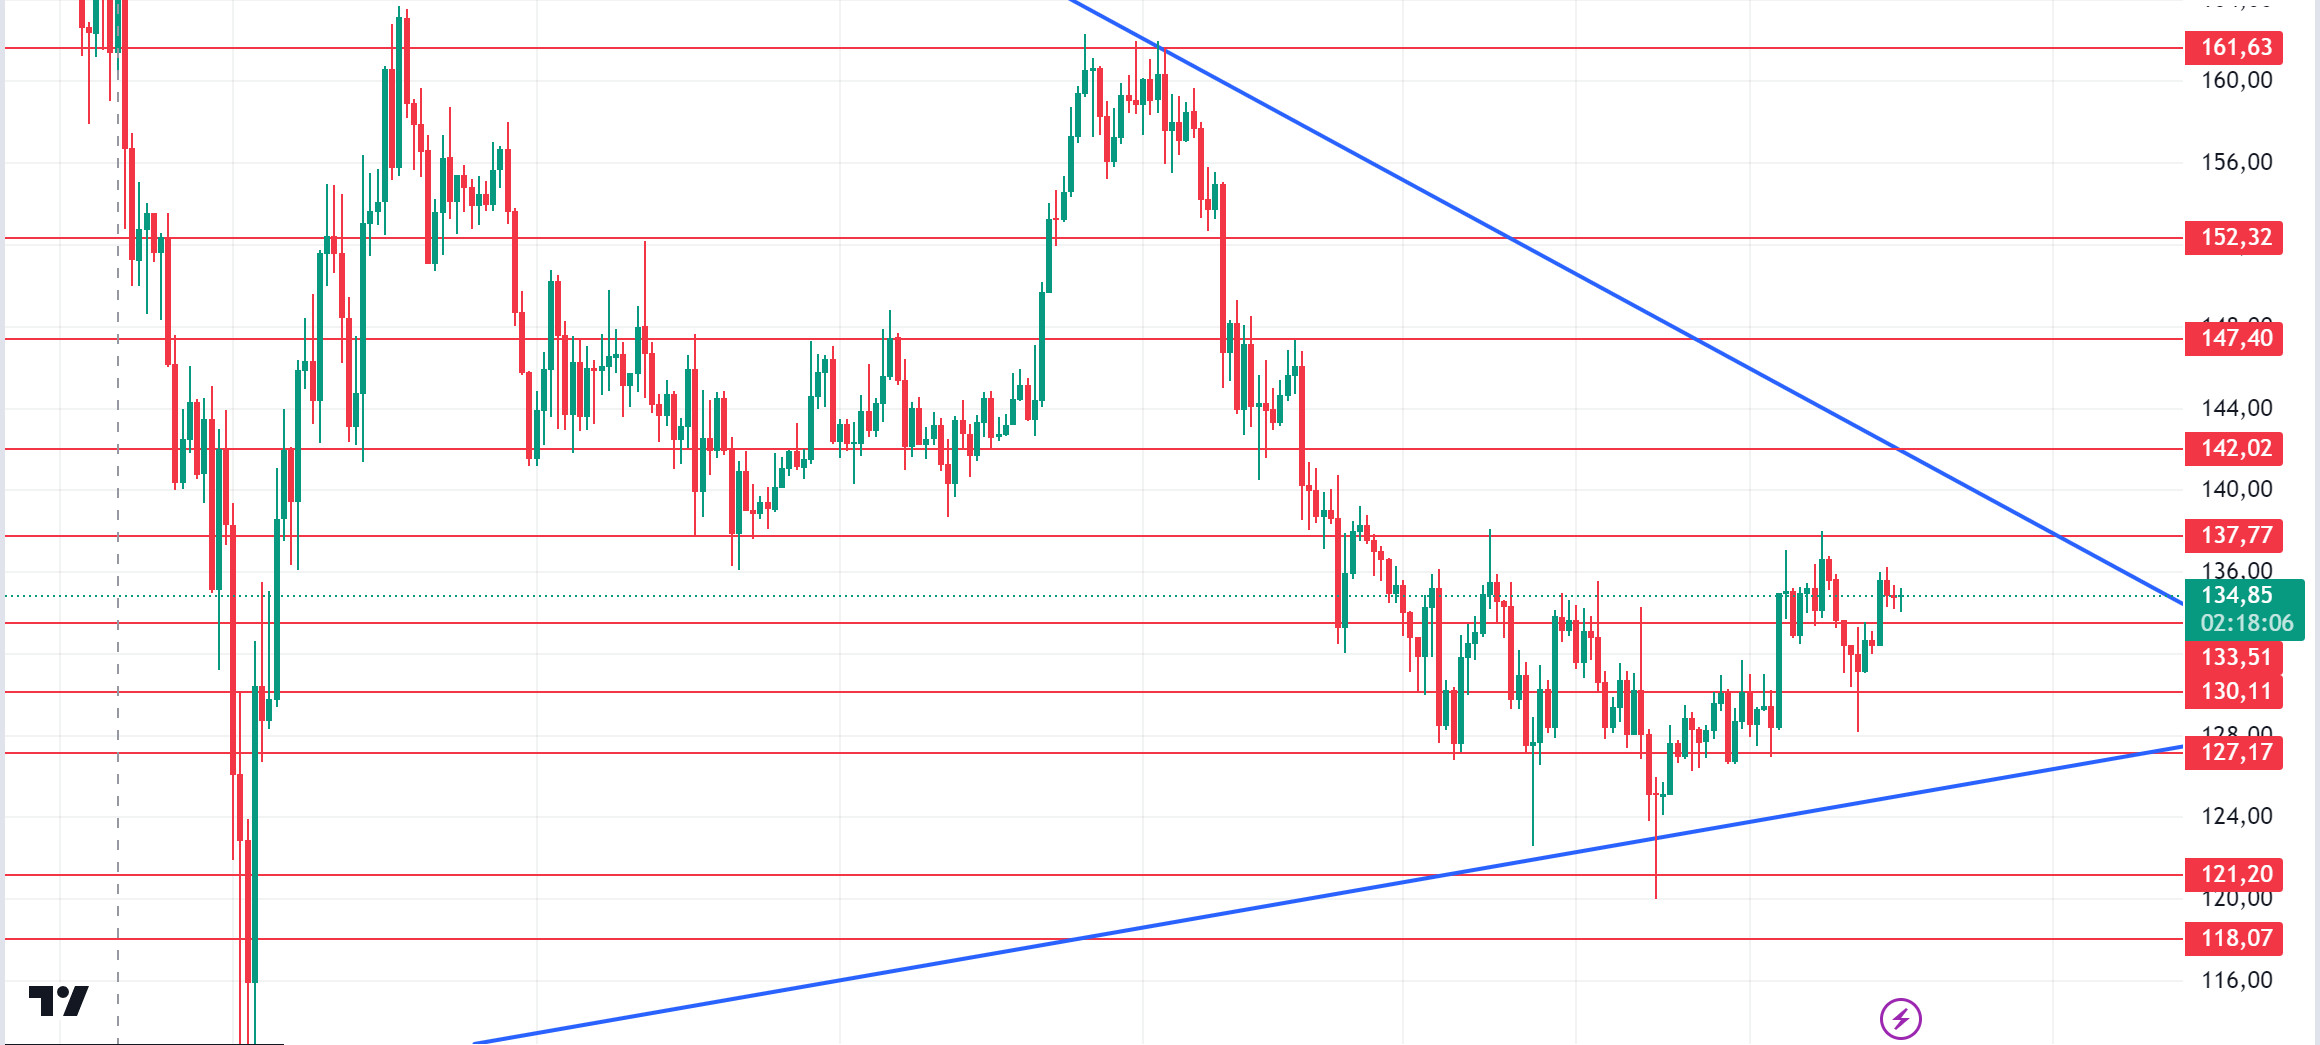
The higher-than-expected unemployment claims and August PPI inflation data from the US means that inflationary pressure is still effective in the market. While this data is negative news for the cryptocurrency market, SOL is down 0.5%. In the Solana ecosystem, according to data from Lookonchain, pump.fun, the star of the meme season and imitated on every network, sold 9,940 more SOL. There are still 438,484 SOLs in the project’s wallet. The platform’s effort to keep SOL, the native token of its ecosystem, under pressure is a matter of curiosity. When we examine it technically, we see a narrowing triangle formation. SOL tried the important level of $ 138. But as a result of yesterday’s and today’s data from the US, it retreated a little. If the rises continue due to the increase in volumes, it may test the resistance levels 137.77 – 142.02. If it rises above this level, the rise may continue. In case of profit sales due to yesterday’s rises, a potential rise should be followed if it reaches the support levels of 133.51 – 130.11.
Supports 133.51 – 130.11 – 127.17
Resistances 137.77 – 142.02 – 147.40
ADA/USDT
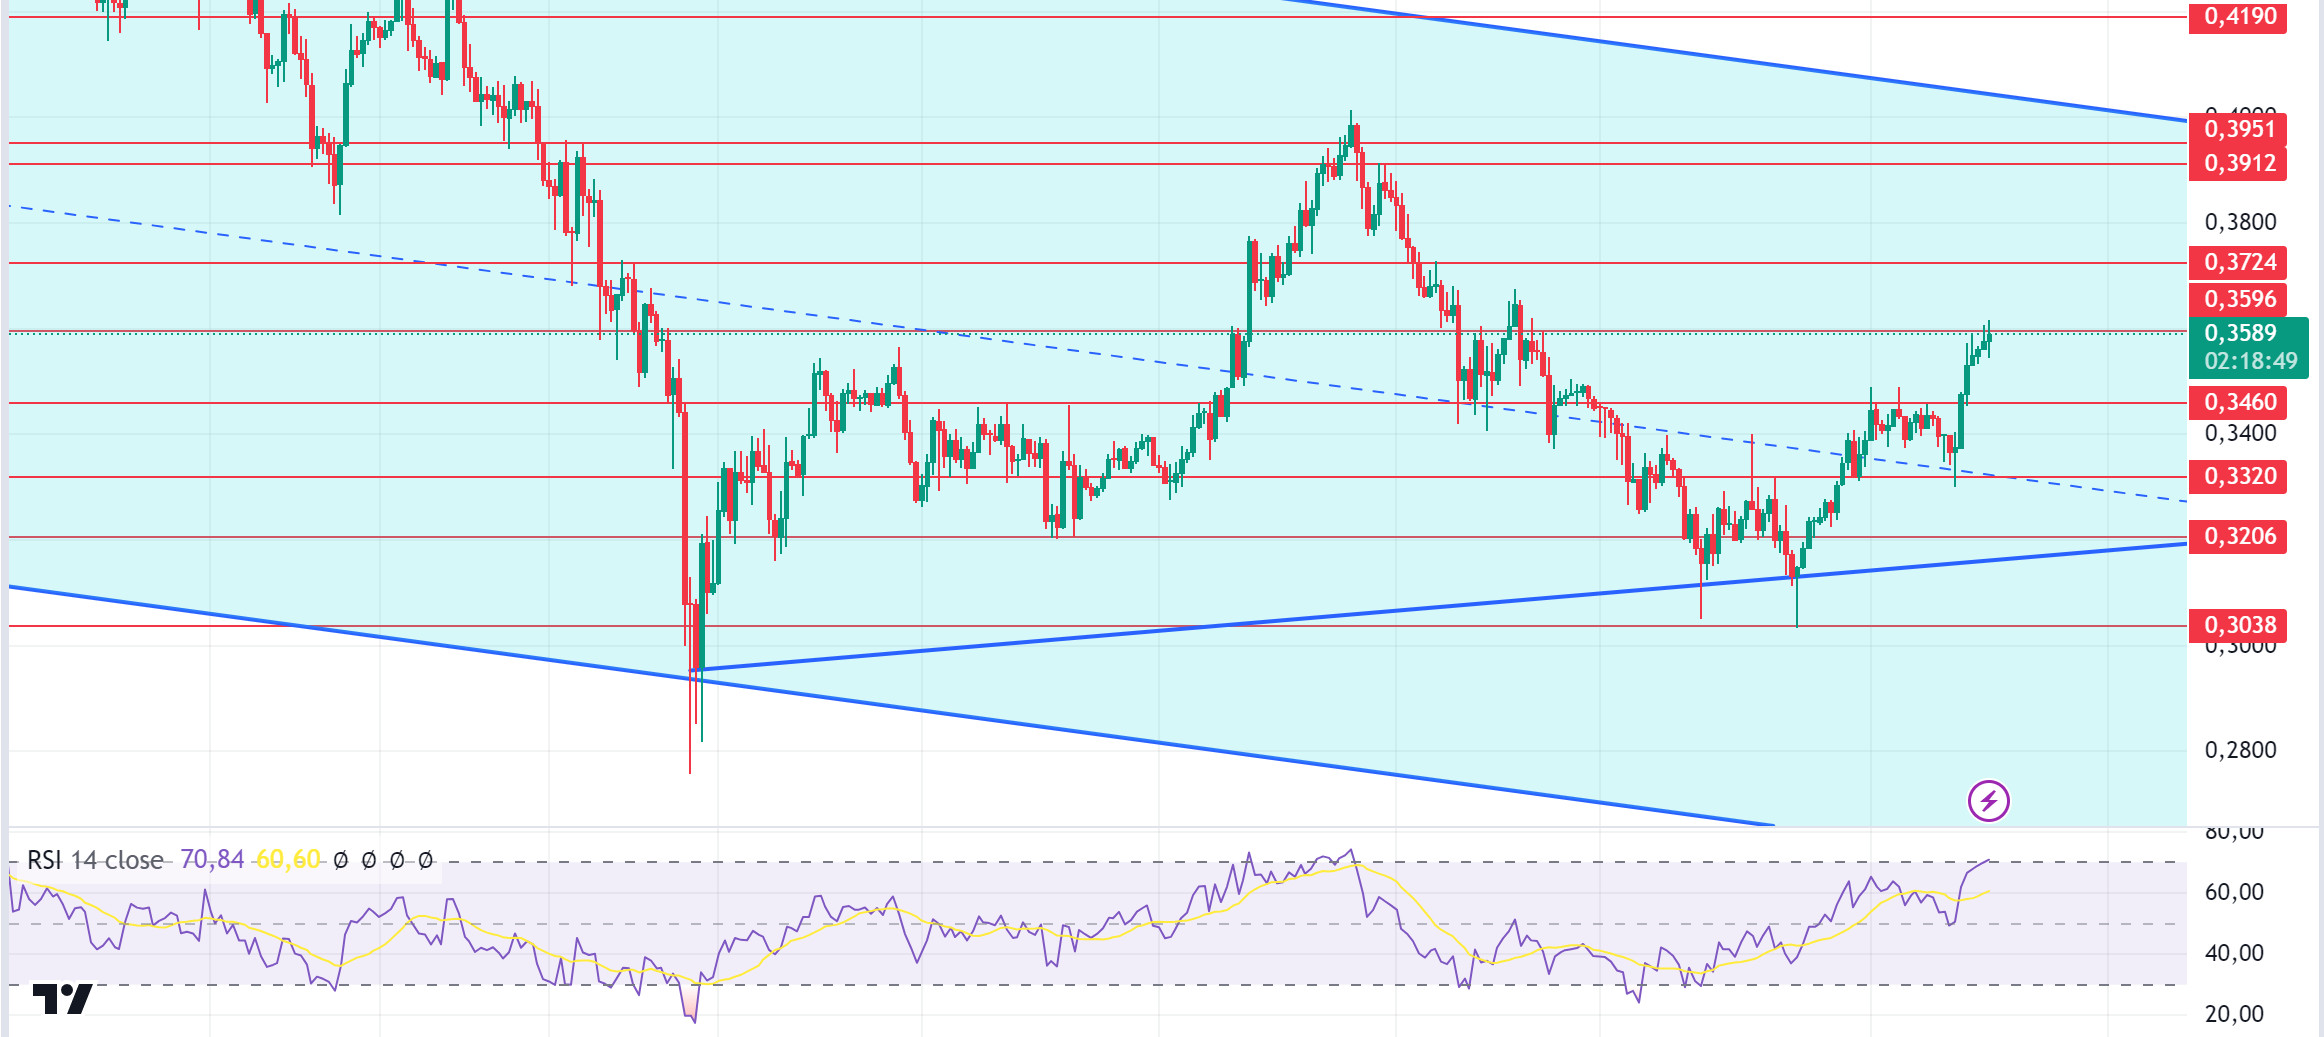
High unemployment claims from the US and higher than expected August PPI inflation data mean that inflationary pressure is still effective in the market. While this data is negative news for the cryptocurrency market, the local token ADA ignored this data and did not show a downward trend. In the Cardano ecosystem, founder Hoskinson wants to move beyond software to hardware design. This reiterates the fundamental diversity that the blockchain has always boasted. As ADA’s valuation surpassed $0.35 for the first time this month, the Cardano network witnessed some key indicators rise. Funding rates, open interest and active addresses are all on the rise. ADA is consolidating in a narrow range between $0.3020 and $0.3950. When we look at the chart of ADA, it has exceeded the middle level of the falling channel. On the other hand, the RSI recently entered the overbought zone, signaling a potential price correction. ADA’s price is hovering above a critical resistance. A rise in volume could push ADA past the 0.3951 resistance. In this scenario, 0.3596 – 0.3724 levels can be followed as resistance points. If the volume falls, 0.3460 – 0.3320 levels can be followed.
Supports 0.3460 – 0.3320 – 0.3206
Resistances 0.3596 – 0.3724 – 0.3912
AVAX/USDT
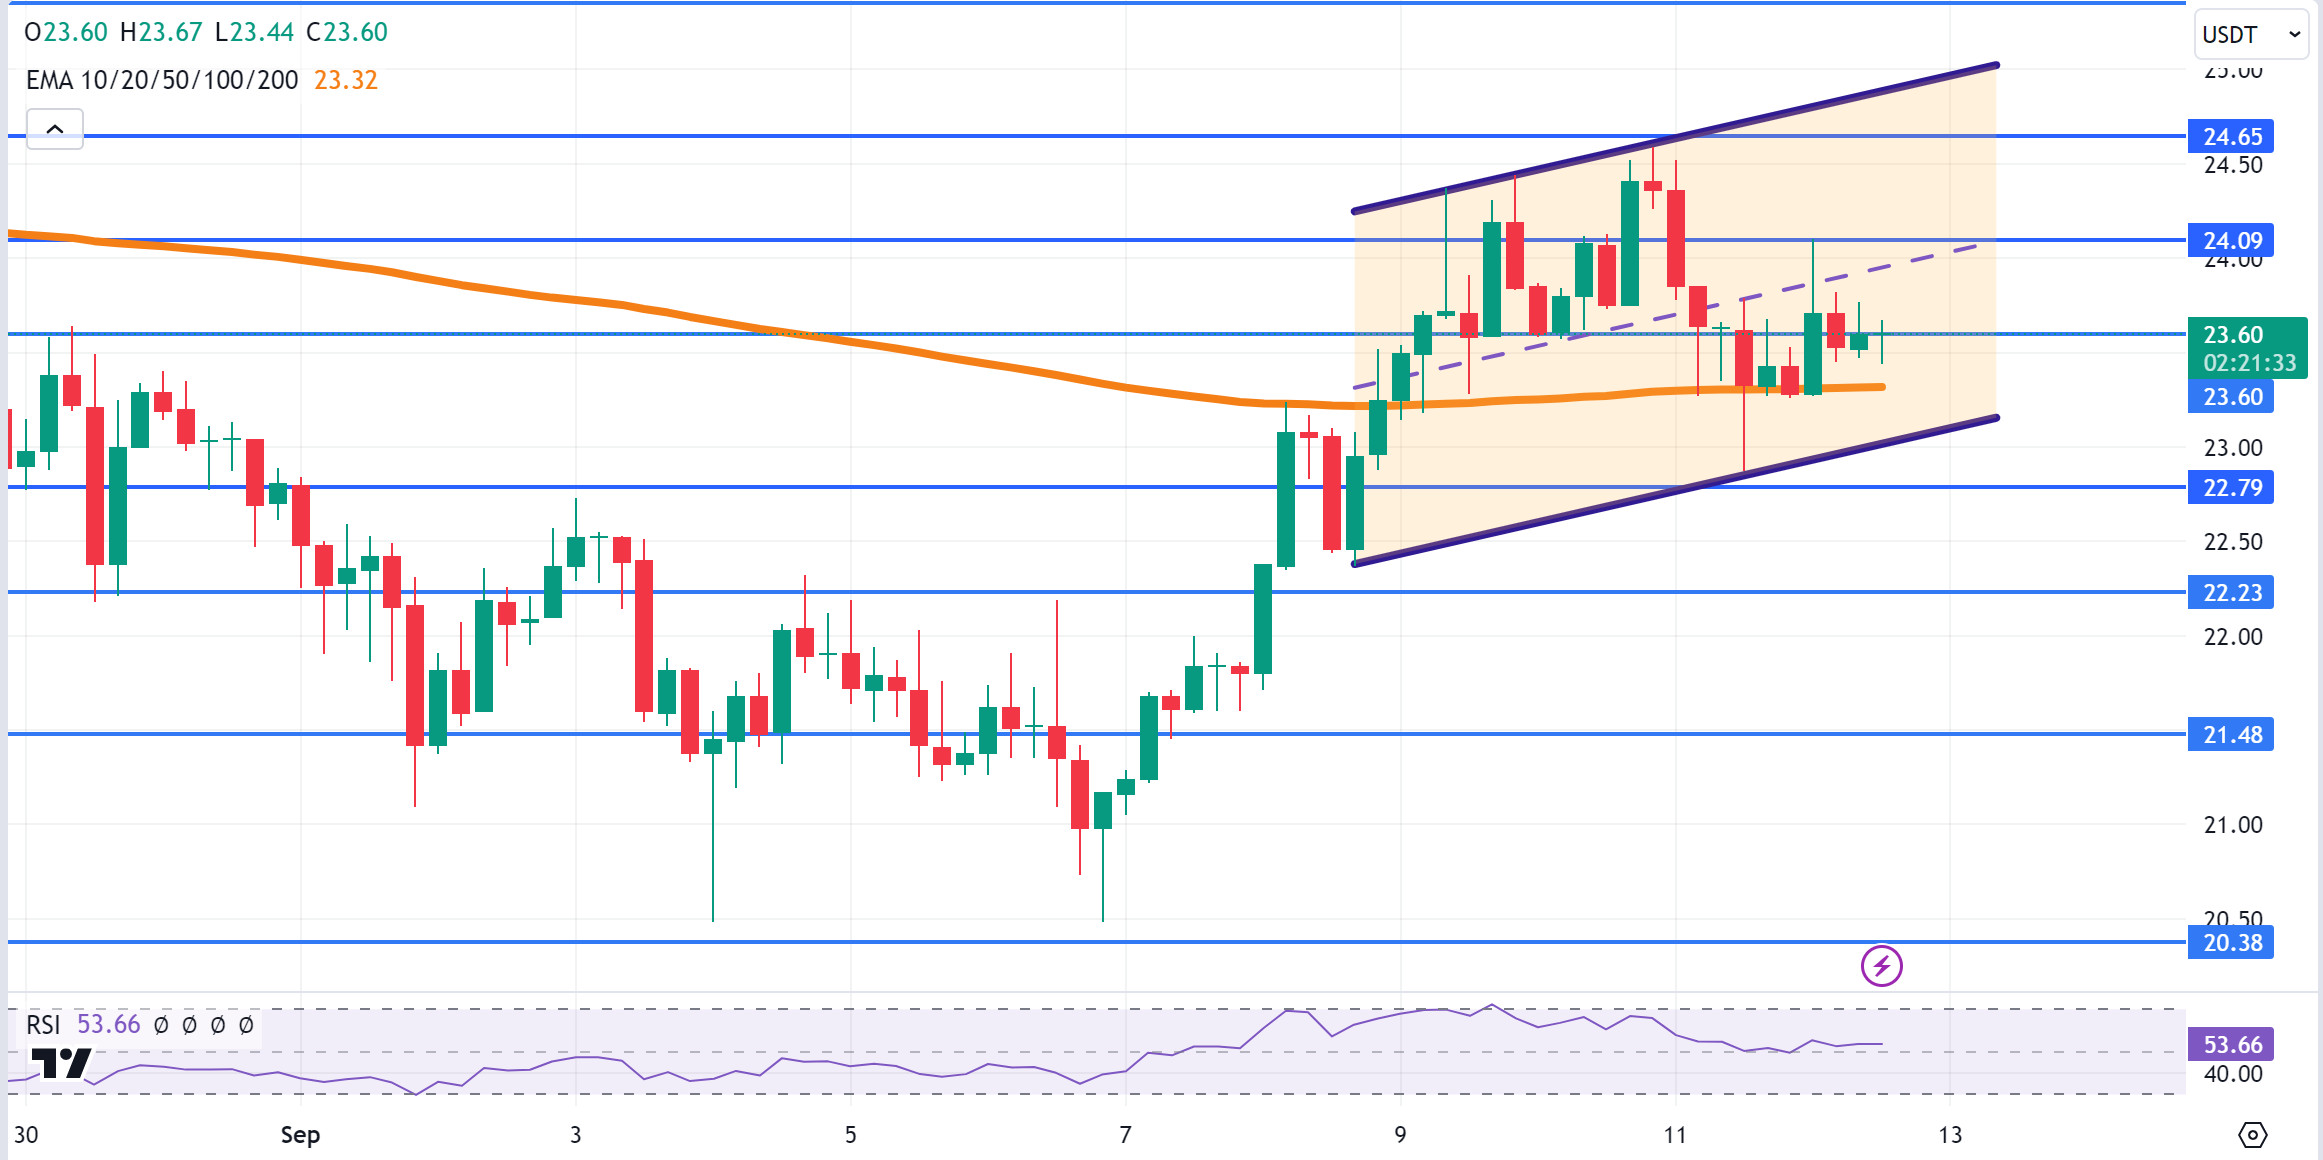
AVAX, which opened today at 23.28, is trading at 23.60 after the US unemployment claims and producer price index data.
Continuing its movement within the ascending channel, AVAX has tested the EMA200 support many times on the 4-hour chart and is trying to break the 23.60 resistance with the reaction it receives from here. If it closes the candle above 23.60 resistance with the volume purchases that may come from here, it may want to move to the middle band of the channel and test the 24.09 resistance. If there is no reaction from the lower band of the channel after the candle closure under the EMA200, it may test 22.79 and 22.23 supports. As long as it stays above 20.38 support during the day, we can expect the upward appetite to continue. With the break of 20.38 support, sales may increase.
(EMA200: Orange)
Supports 22.79 – 22.23 – 21.48
Resistances 23.60 – 24.09 – 24.65
TRX/USDT
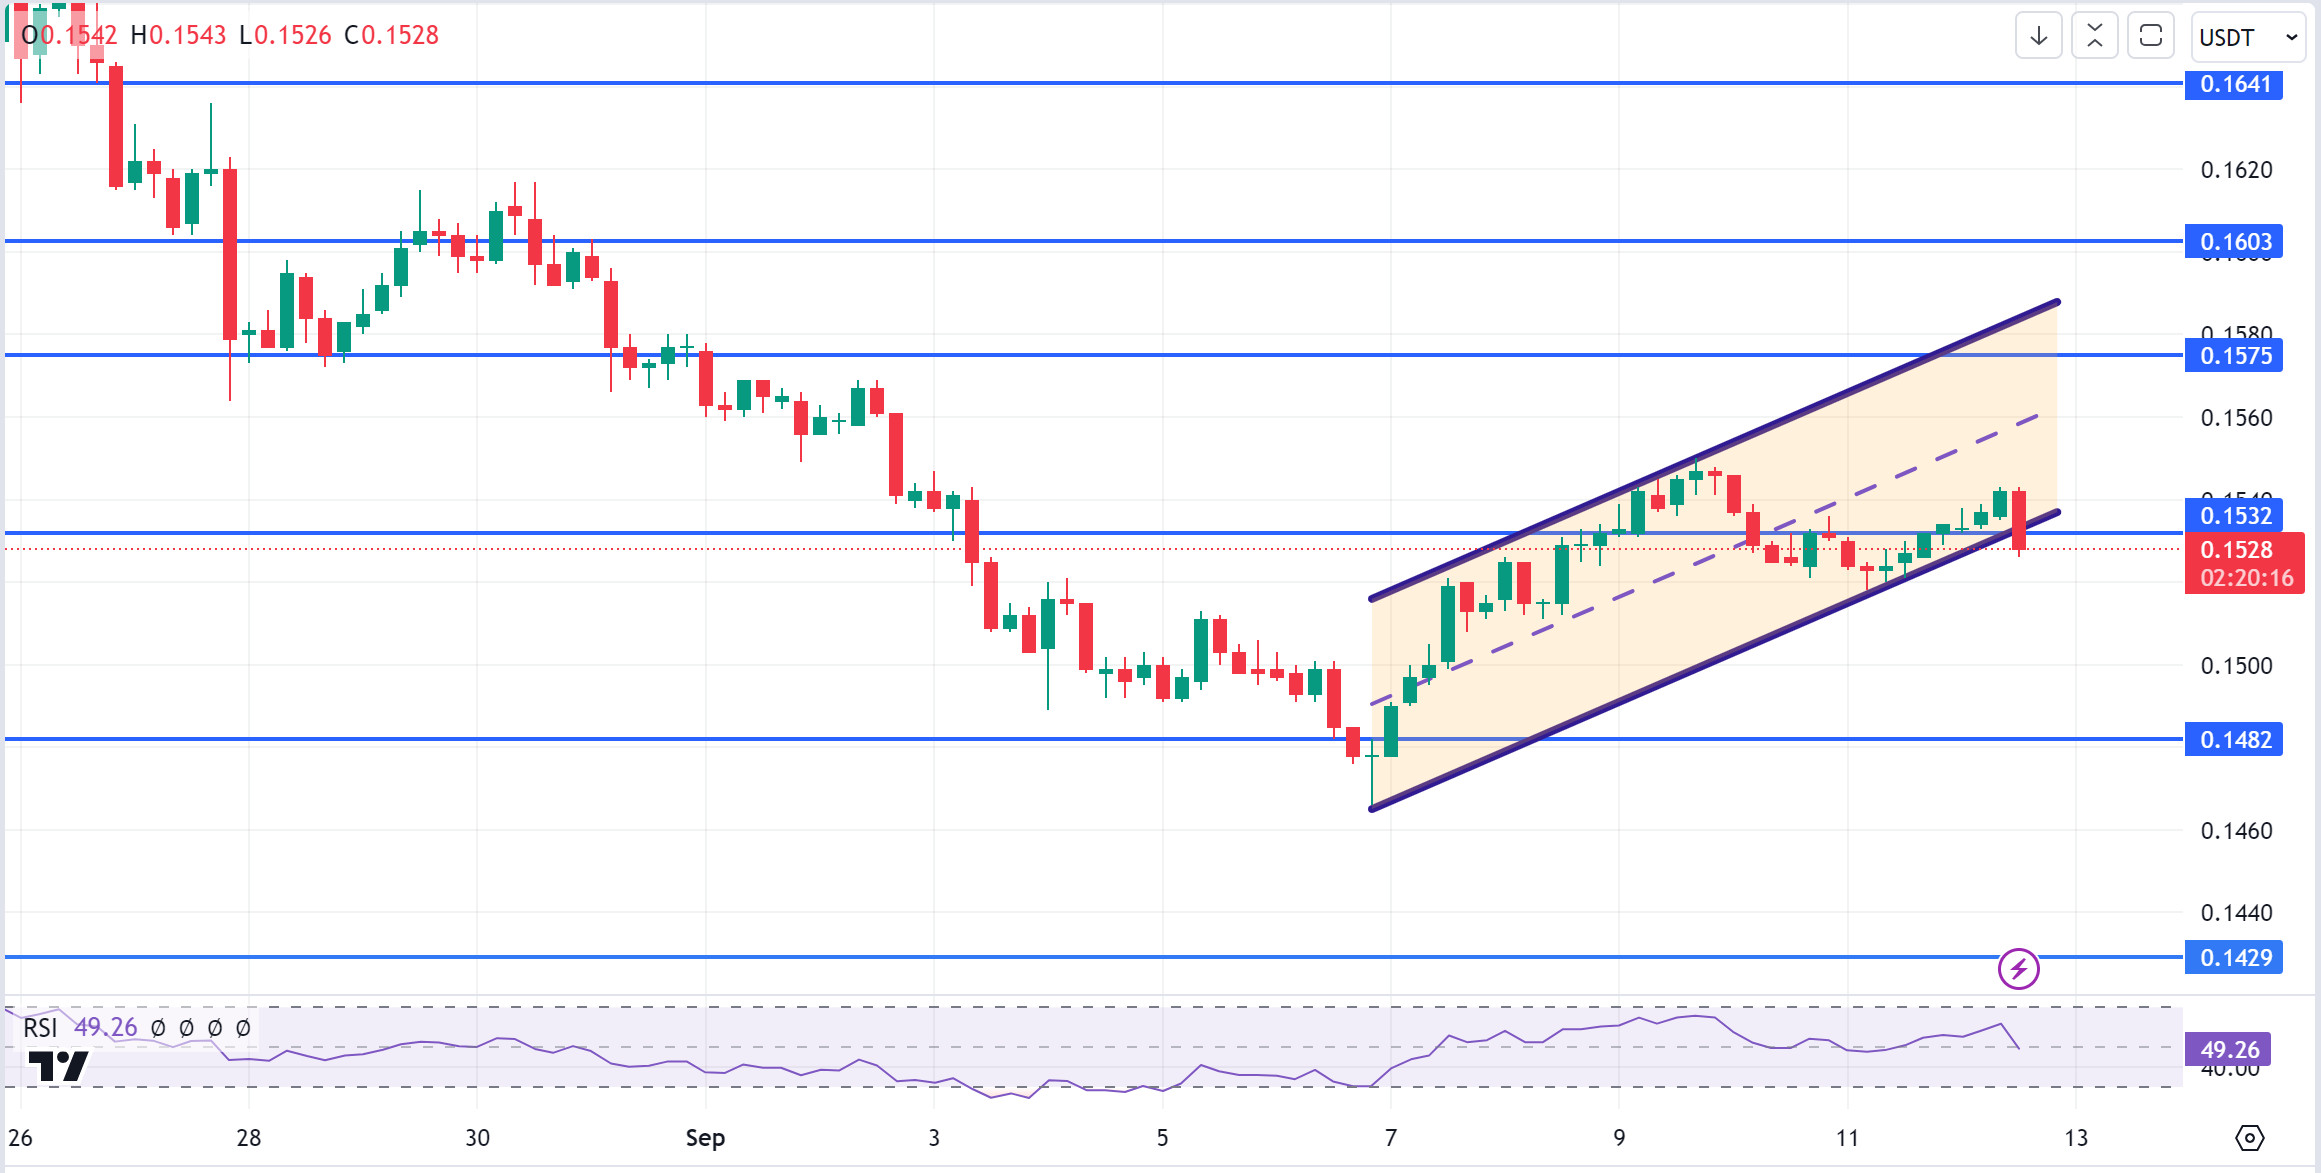
TRX, which started today at 0.1533, is trading at 0.1528 after the US data. It is currently continuing its movement within the rising channel on the 4-hour chart and can be expected to rise from the lower band of the channel. In such a case, it may continue its movement to the upper band of the channel and test the 0.1575 resistance. If there is no reaction from the lower band of the channel and the decline continues, it may want to test 0.1482 support. As long as TRX stays above 0.1482 support, it can be expected to continue its upward demand. If this support breaks down, sales may increase.
Supports 0.1532 – 0.1482 – 0.1429
Resistances 0.1575 – 0.1603 – 0.1641
XRP/USDT
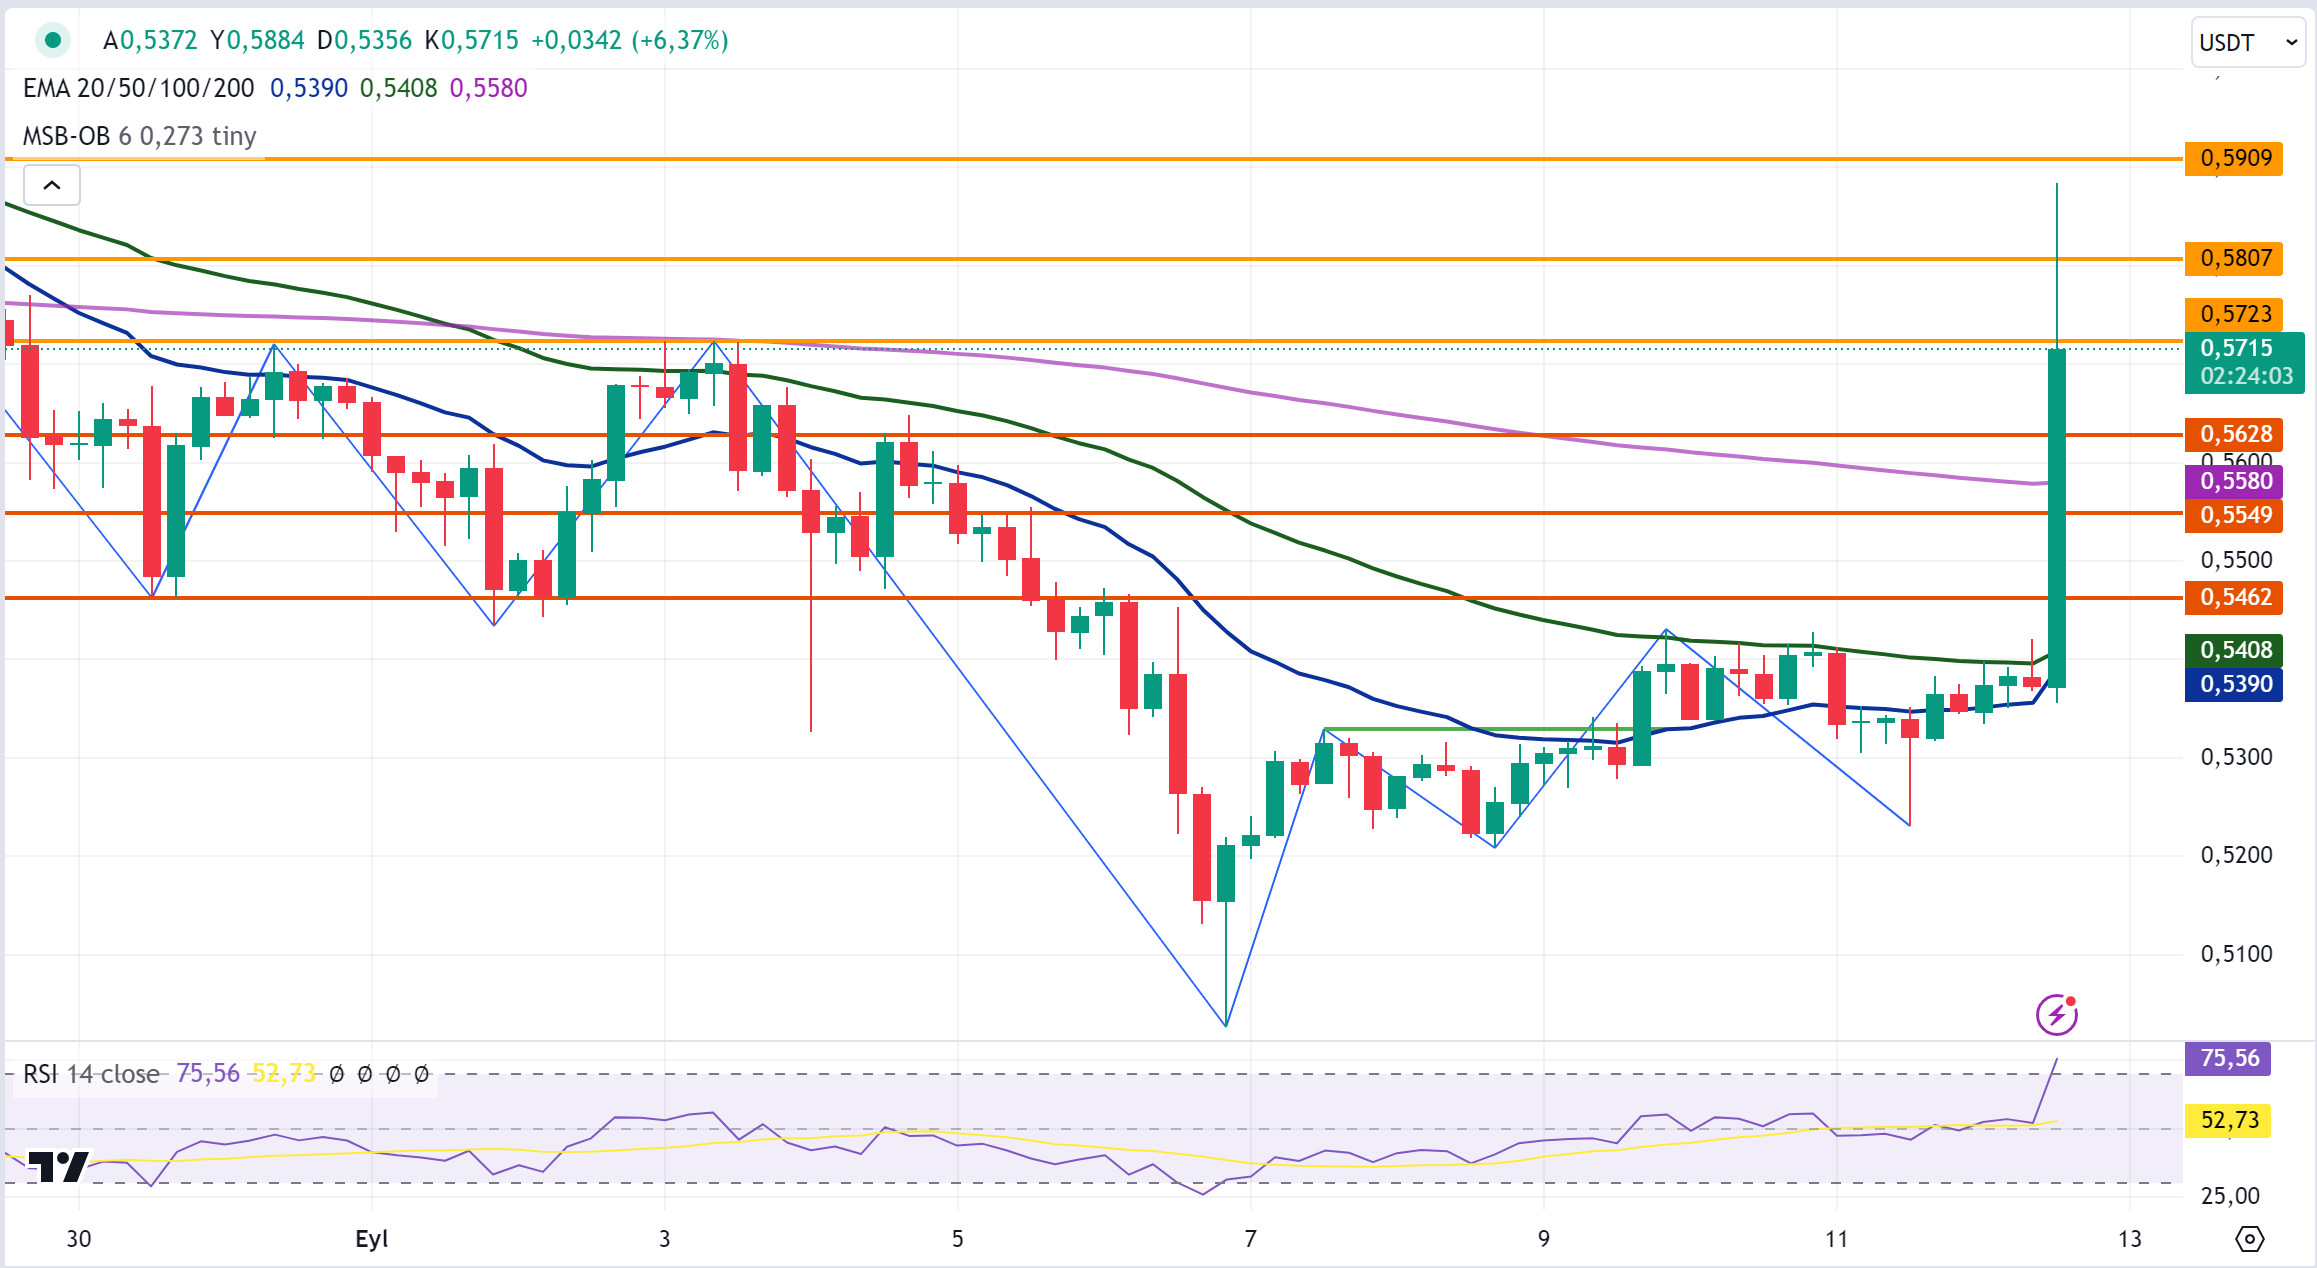
After starting today at 0.5346, XRP continued to trade in a horizontal band between EMA20 (Blue Color) and EMA50 (Green Color) in the 4-hour analysis, while GrayScale, the news that it will launch the first US fund for XRP and the opening of the ETF path for XRP in the future caused a sharp rise in XRP and XRP rose to 0.5882 with this rise. XRP, which fell after the rise, is currently trading at 0.5715. If the rise continues, XRP may test the resistance levels of 0.5723-0.5807-0.5909. In case of a decline, it may test the support levels of 0.5628-0.5549-0.5462.
Supports 0.5628 – 0.5549 – 0. 5 462
Resistances 0.5723 – 0.5807 – 0.5 909
DOGE/USDT
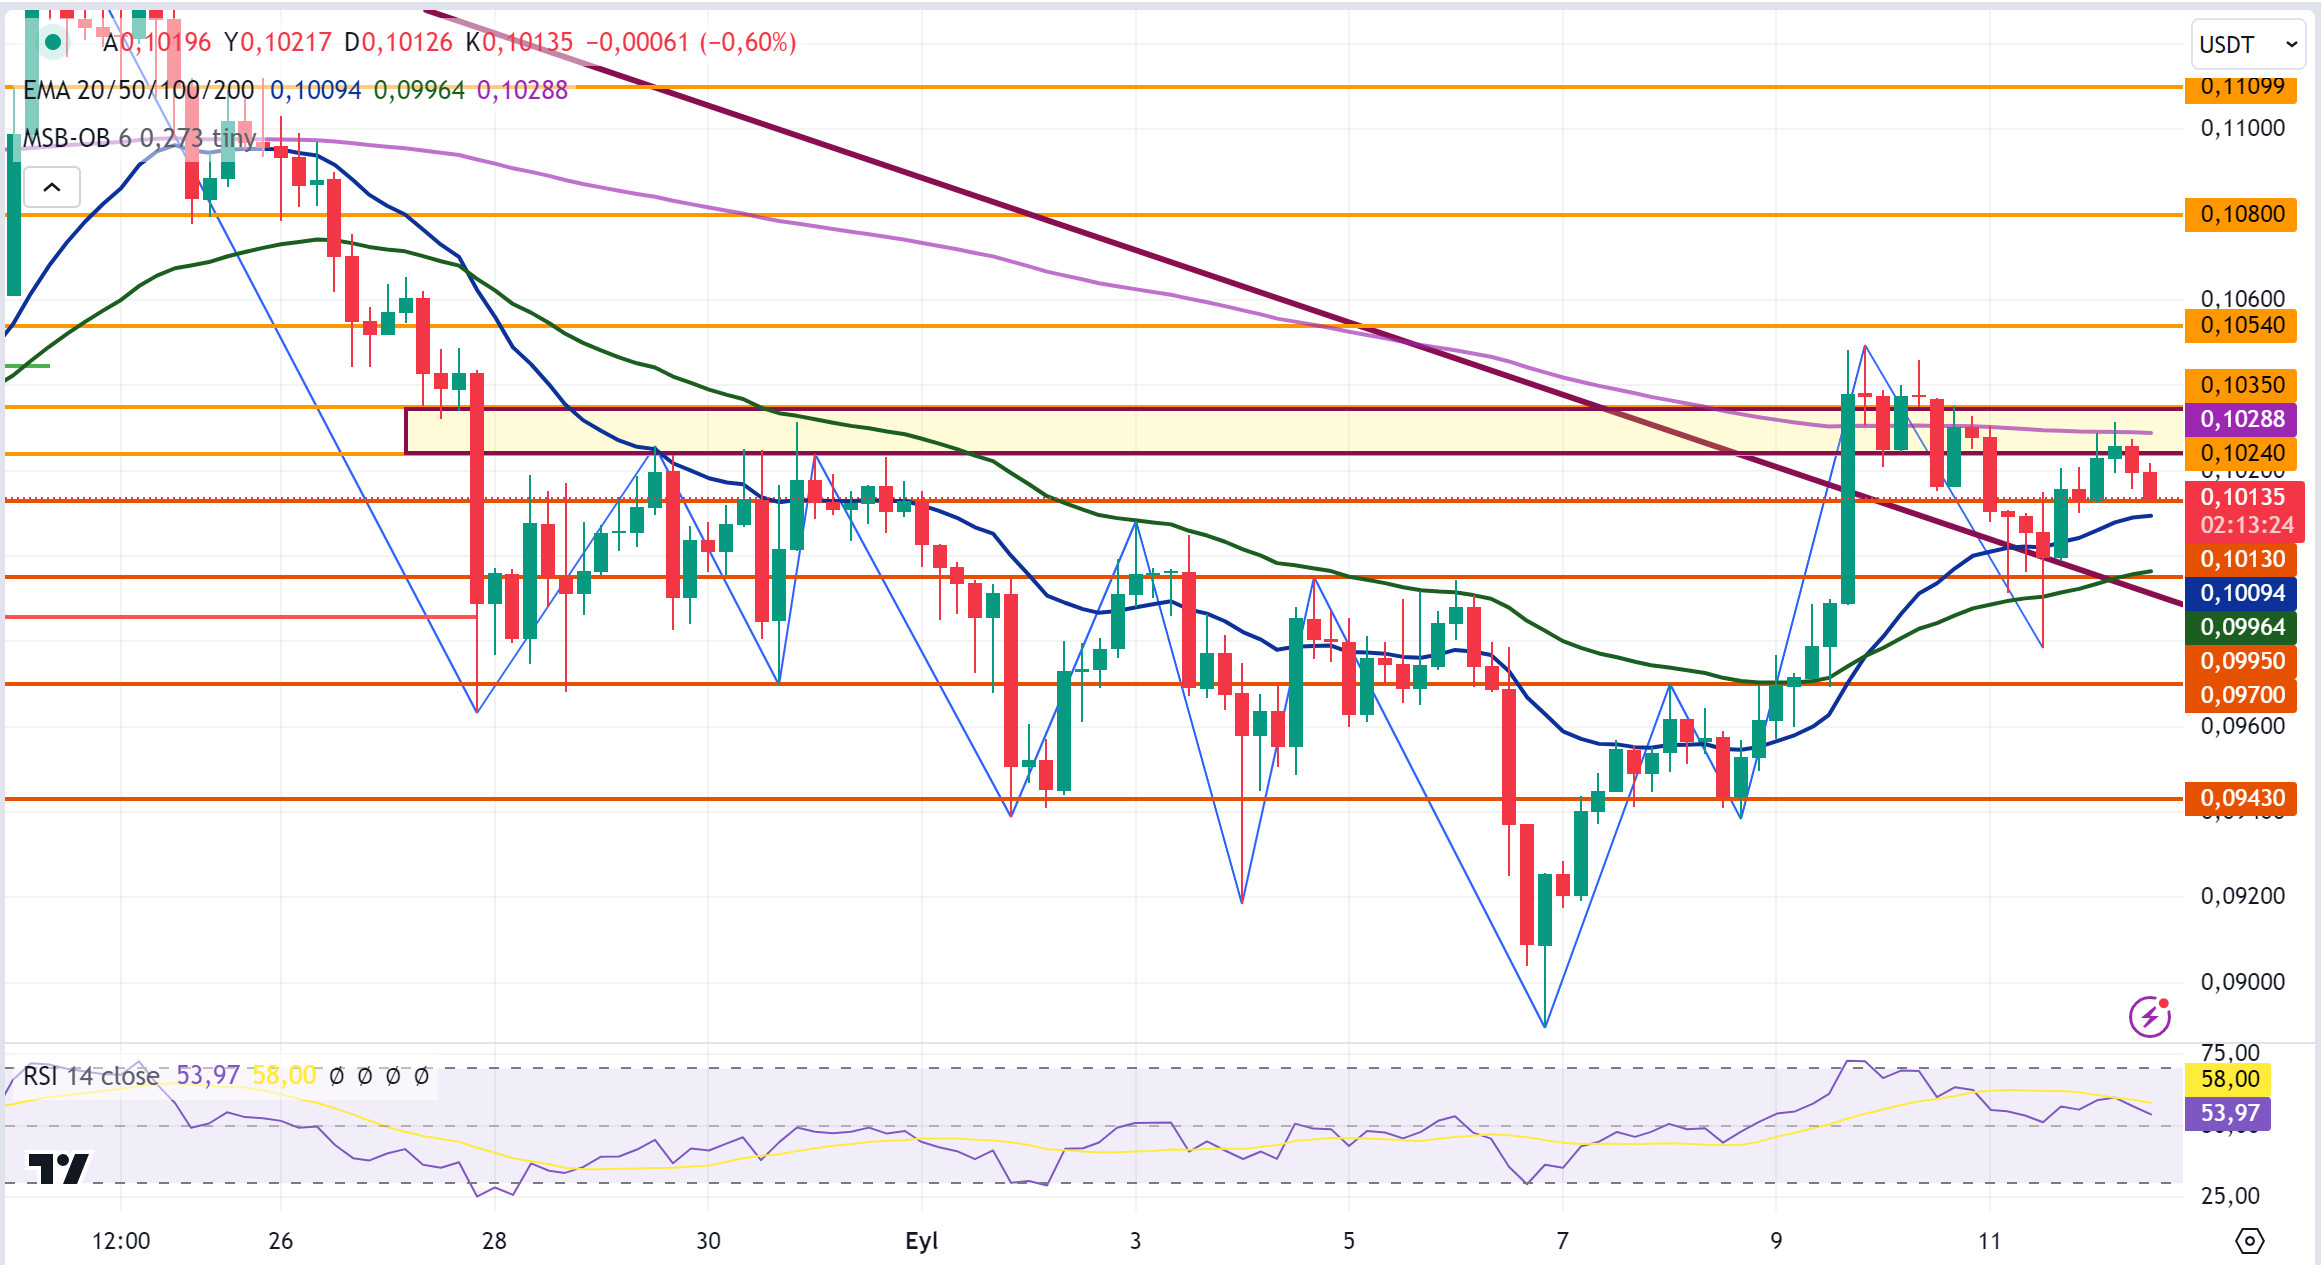
In the 4-hour analysis, DOGE fell to the starting level of the day with the decline it experienced after starting the day with a rise. Today, DOGE, which failed to break the EMA200 (Purple Color) level after testing the EMA200 level, is testing the 0.1013 support level in the last candle. If the decline in DOGE continues and the decline deepens with the break of the 0.1013 support level, it may test the 0.0995-0.0970 support levels. With the reaction purchases that may come at the 0.1013 support level in question, DOGE may test the resistance levels of 0.1035-0.1054-0.1080 with the rise in case the decline is replaced by the rise.
When DOGE continues to decline, it may start to rise with purchases that may come at the 0.0995 support level and may offer a long trading opportunity. In case the 0.1013 support level cannot be broken and the rise starts, it may offer a short trading opportunity with reaction sales at the EMA200 level.
Supports 0.1013 – 0.0995 – 0.0970
Resistances 0.1035 – 0.1 054 – 0.1080
DOT/USDT
The Tie offers a custom dashboard for the Polkadot ecosystem, providing institutional investors with in-depth analytics on Polkadot-based assets. This dashboard allows users to track key metrics such as account, token, transaction and TVL (Total Value Locked) in the Polkadot ecosystem. It also provides information on inter-parachain interactions and Cross-Consensus Messaging (XCM) transactions, helping to better understand Polkadot’s network performance and cross-chain messaging dynamics. By making the Polkadot ecosystem more transparent and analyzable, this dashboard can increase institutional investor interest and contribute to the growth of the ecosystem.
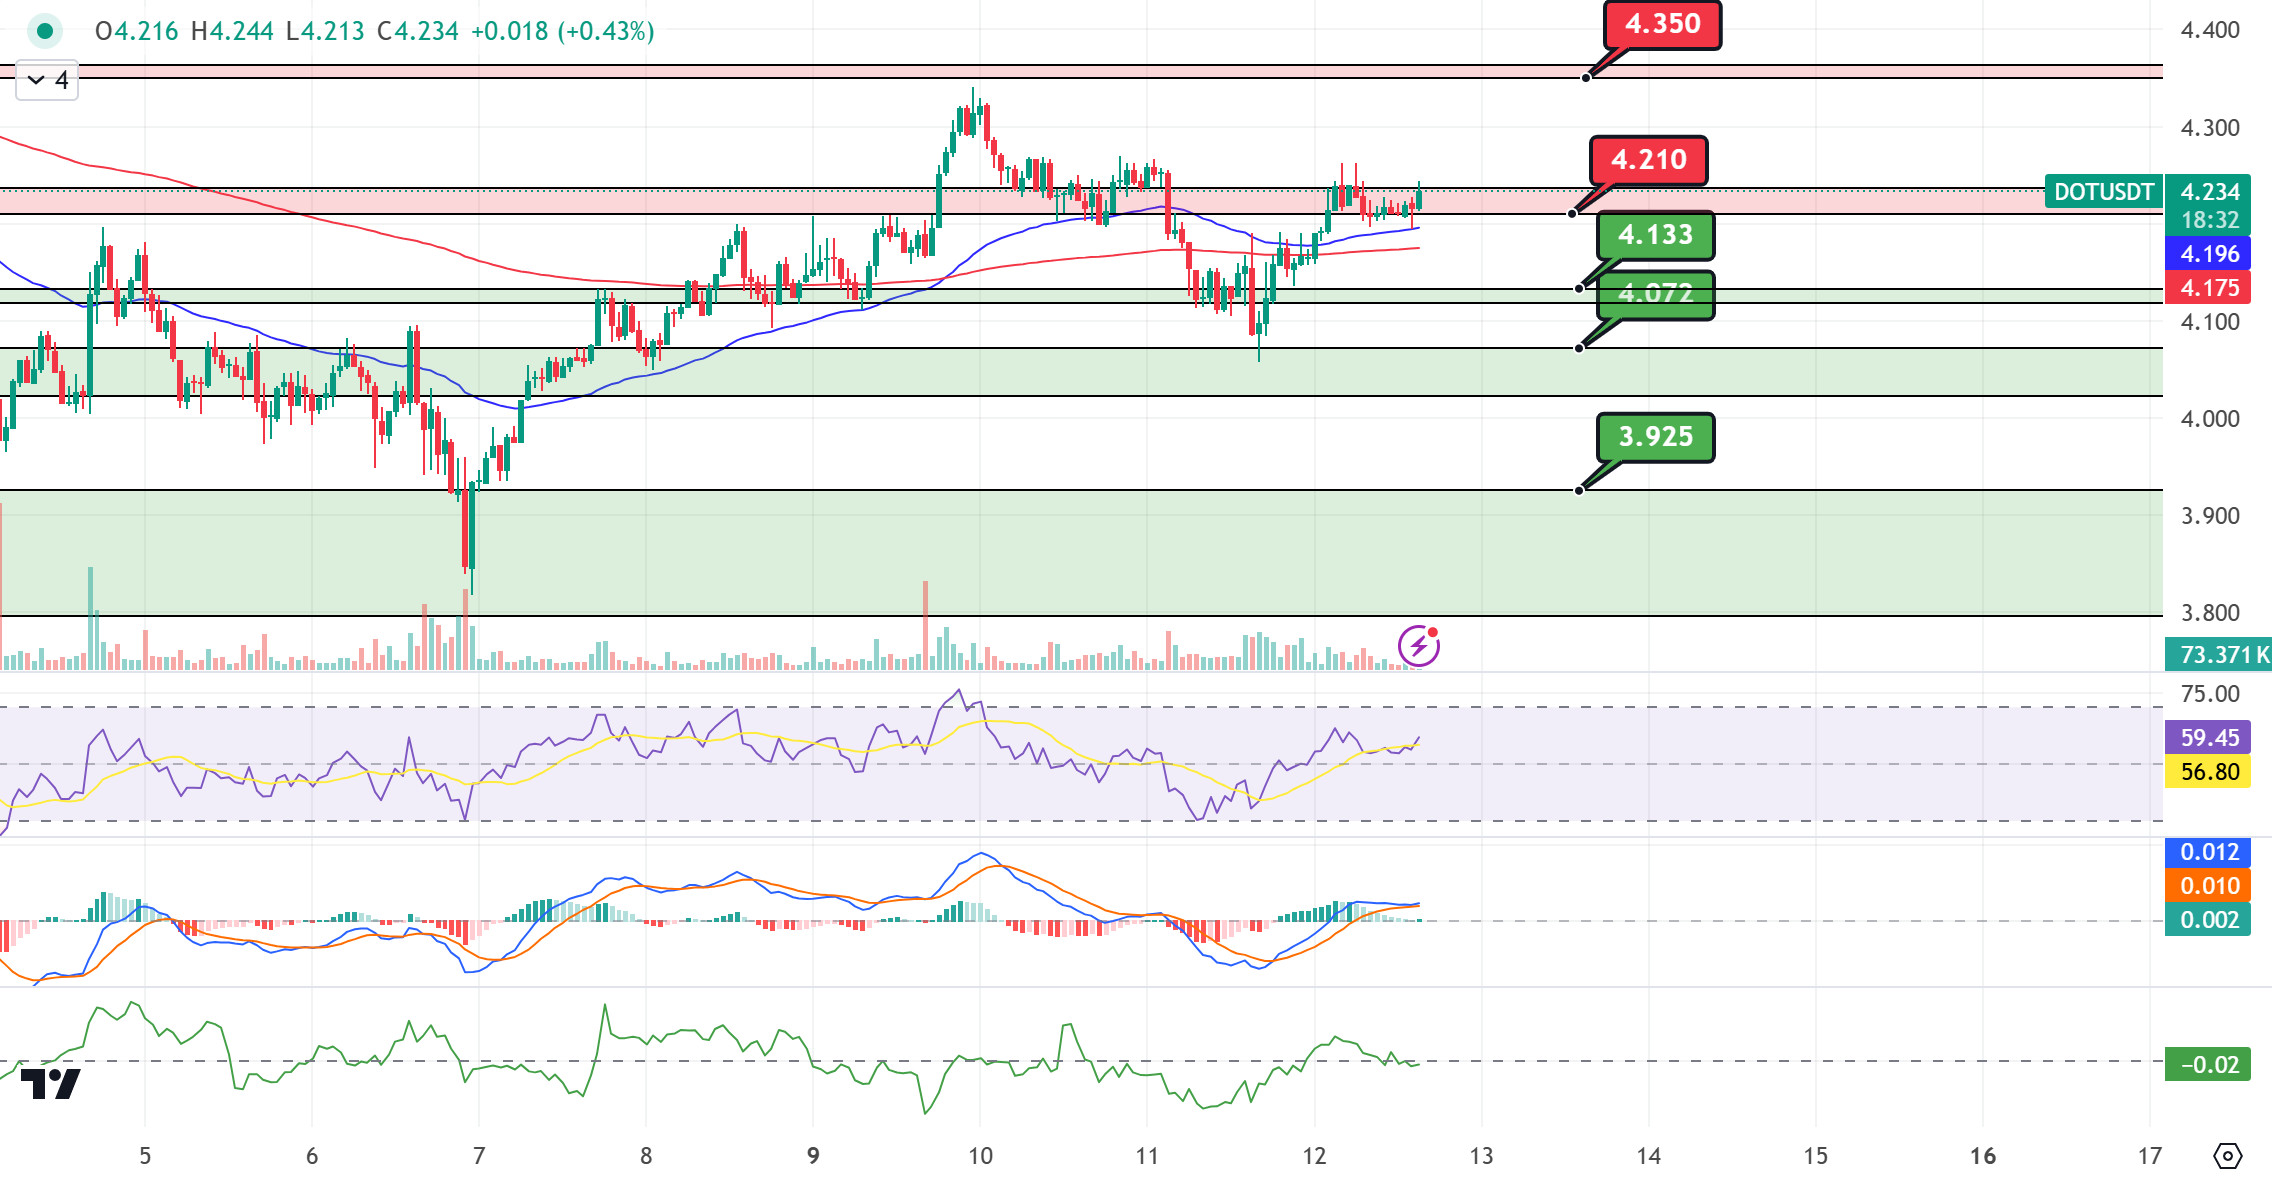
When we examine the Polkadot (DOT) chart, the price is at the resistance level of 4,210 band with the reaction from the EMA50 level. If the price can maintain above the 4,210 resistance level, its next target may be the 4,350 resistance level. In the negative scenario, if the price is rejected from the 4,210 resistance, it may retreat towards the EMA50 level. If we see a movement below the EMA50, the first reaction we should expect may be the 4,133 levels.
(Blue line: EMA50, Red line: EMA200)
Supports 4,133 – 4,072 – 3925
Resistances 4.210 – 4.350 – 4.454
SHIB/USDT
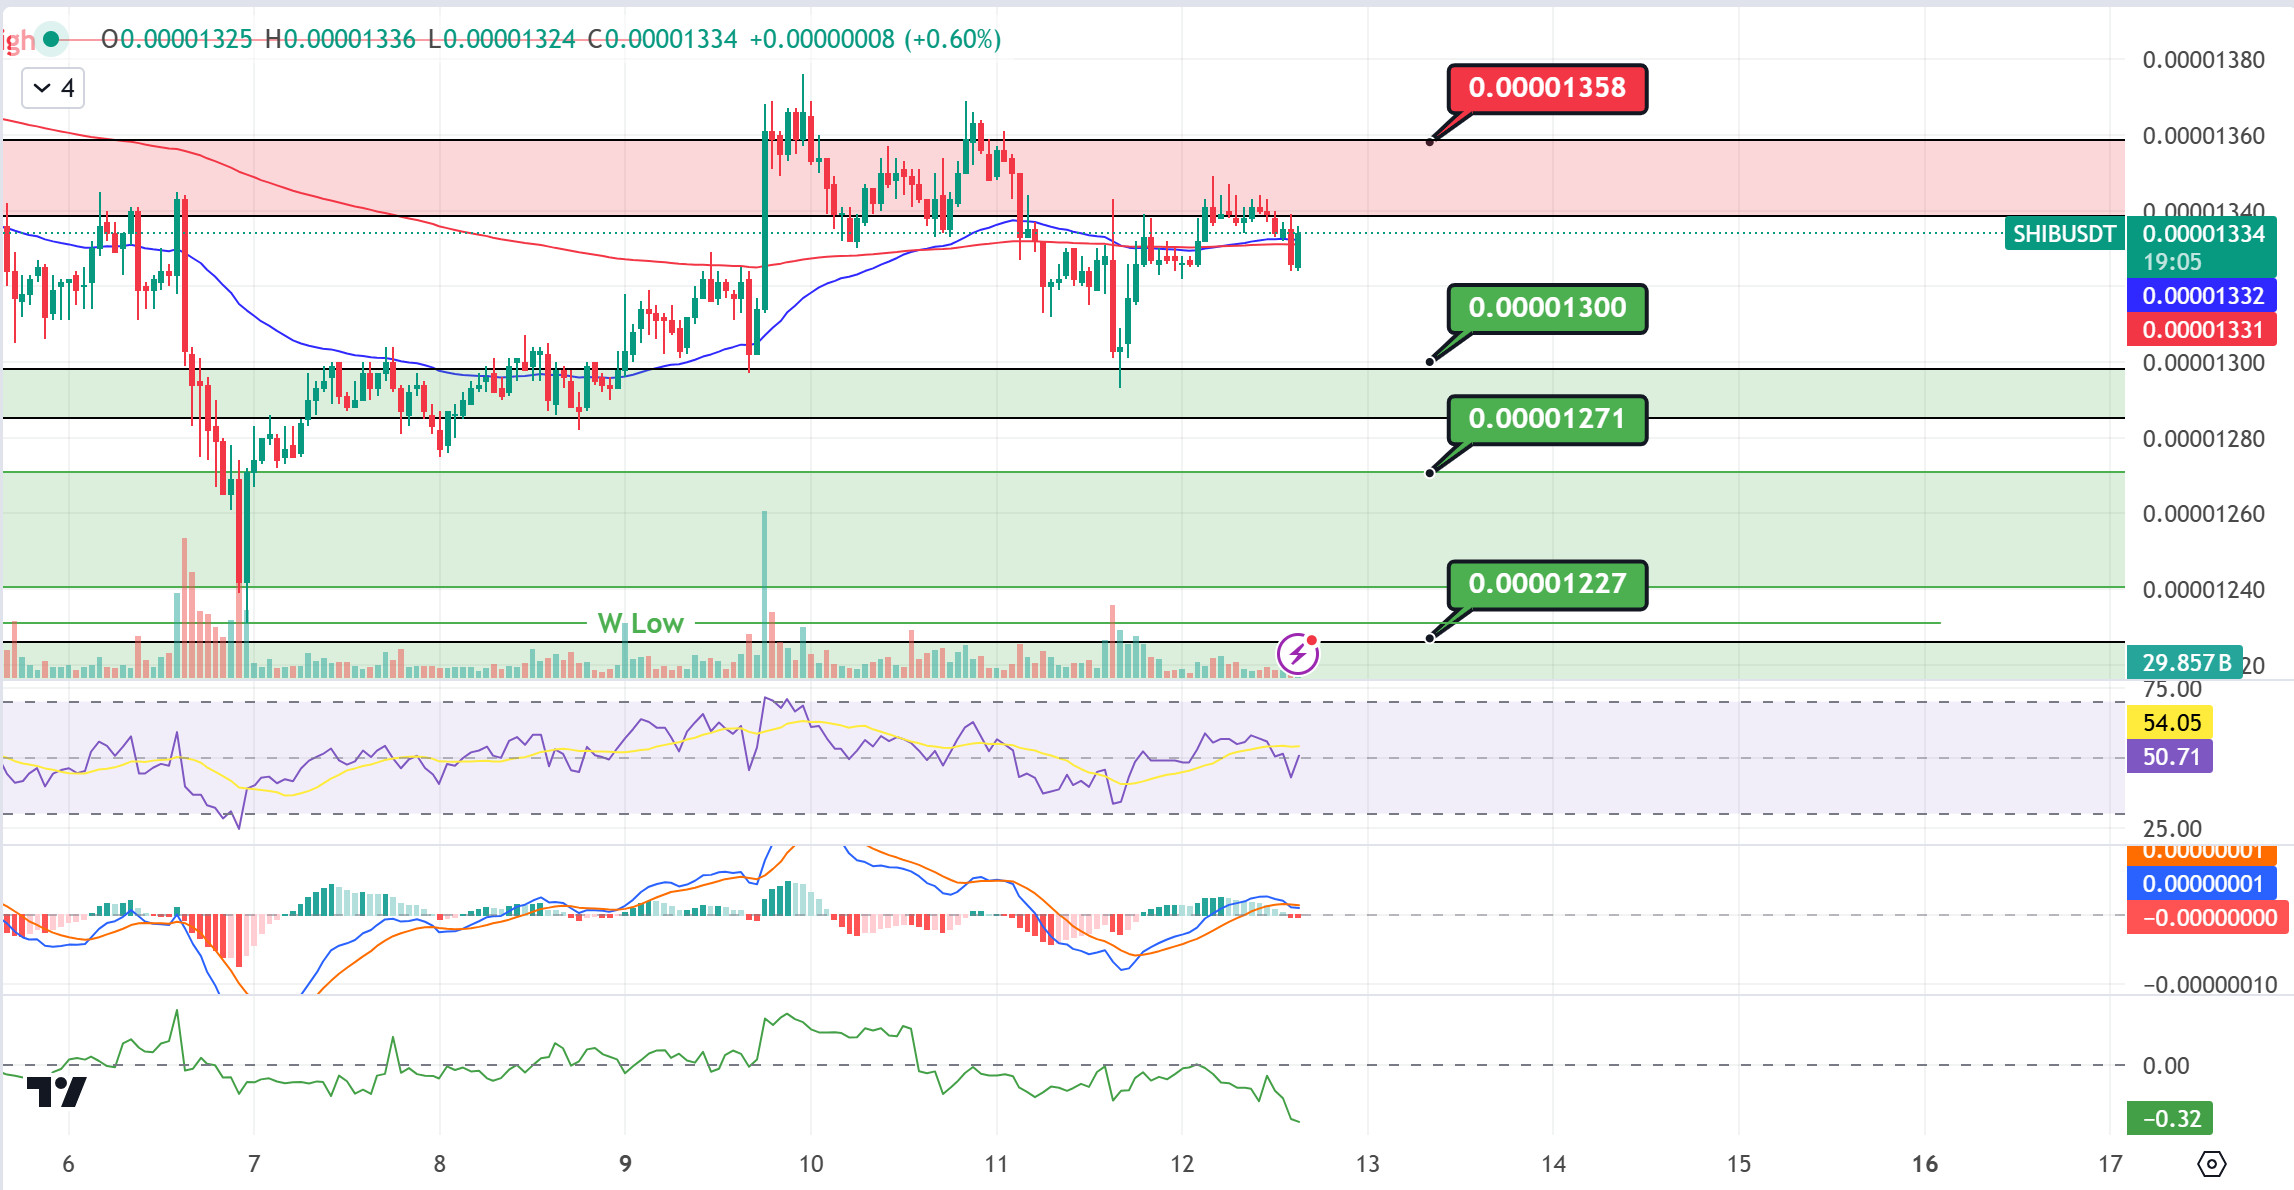
When we examine the chart of Shiba Inu (SHIB), the price seems to have broken down the EMA50 and EMA200 levels with increasing selling pressure at 0.00001358. When we analyze the MACD and CMF oscillators, we see that the selling pressure increased compared to the previous hour. In the negative scenario, the price may want to test the 0.00001300 support band. In the positive scenario, if the selling pressure decreases, the price may want to break the selling pressure at 0.00001358.
(Blue line: EMA50, Red line: EMA200)
Supports 0.00001300 – 0.00001271 – 0.00001227
Resistances 0.00001358 – 0.00001412 – 0.00001443
LEGAL NOTICE
The investment information, comments and recommendations contained herein do not constitute investment advice. Investment advisory services are provided by authorized institutions on a personalized basis, taking into account the risk and return preferences of individuals. The comments and recommendations contained herein are of a general nature. These recommendations may not be suitable for your financial situation and risk and return preferences. Therefore, making an investment decision based solely on the information contained herein may not produce results in line with your expectations.


