
Technical Analysis
BTC/USDT
As diplomatic contacts accelerated ahead of the China-US leaders’ summit, the tone between the two countries softened noticeably. Chinese Foreign Minister Wang Yi and his US counterpart Marco Rubio called for a “constructive atmosphere” ahead of the APEC summit, while it was reported that a preliminary framework agreement based on mutual understanding was reached during negotiations in Kuala Lumpur. President Trump announced that the investigation into China’s Phase One Trade Agreement could be suspended until the leaders’ meeting. On the geopolitical front, as Ukraine prepares to present a new ceasefire draft within the next 10 days, Russia successfully tested its nuclear-powered “Burevestnik” missile. Trump called the test “an unnecessary provocation.”
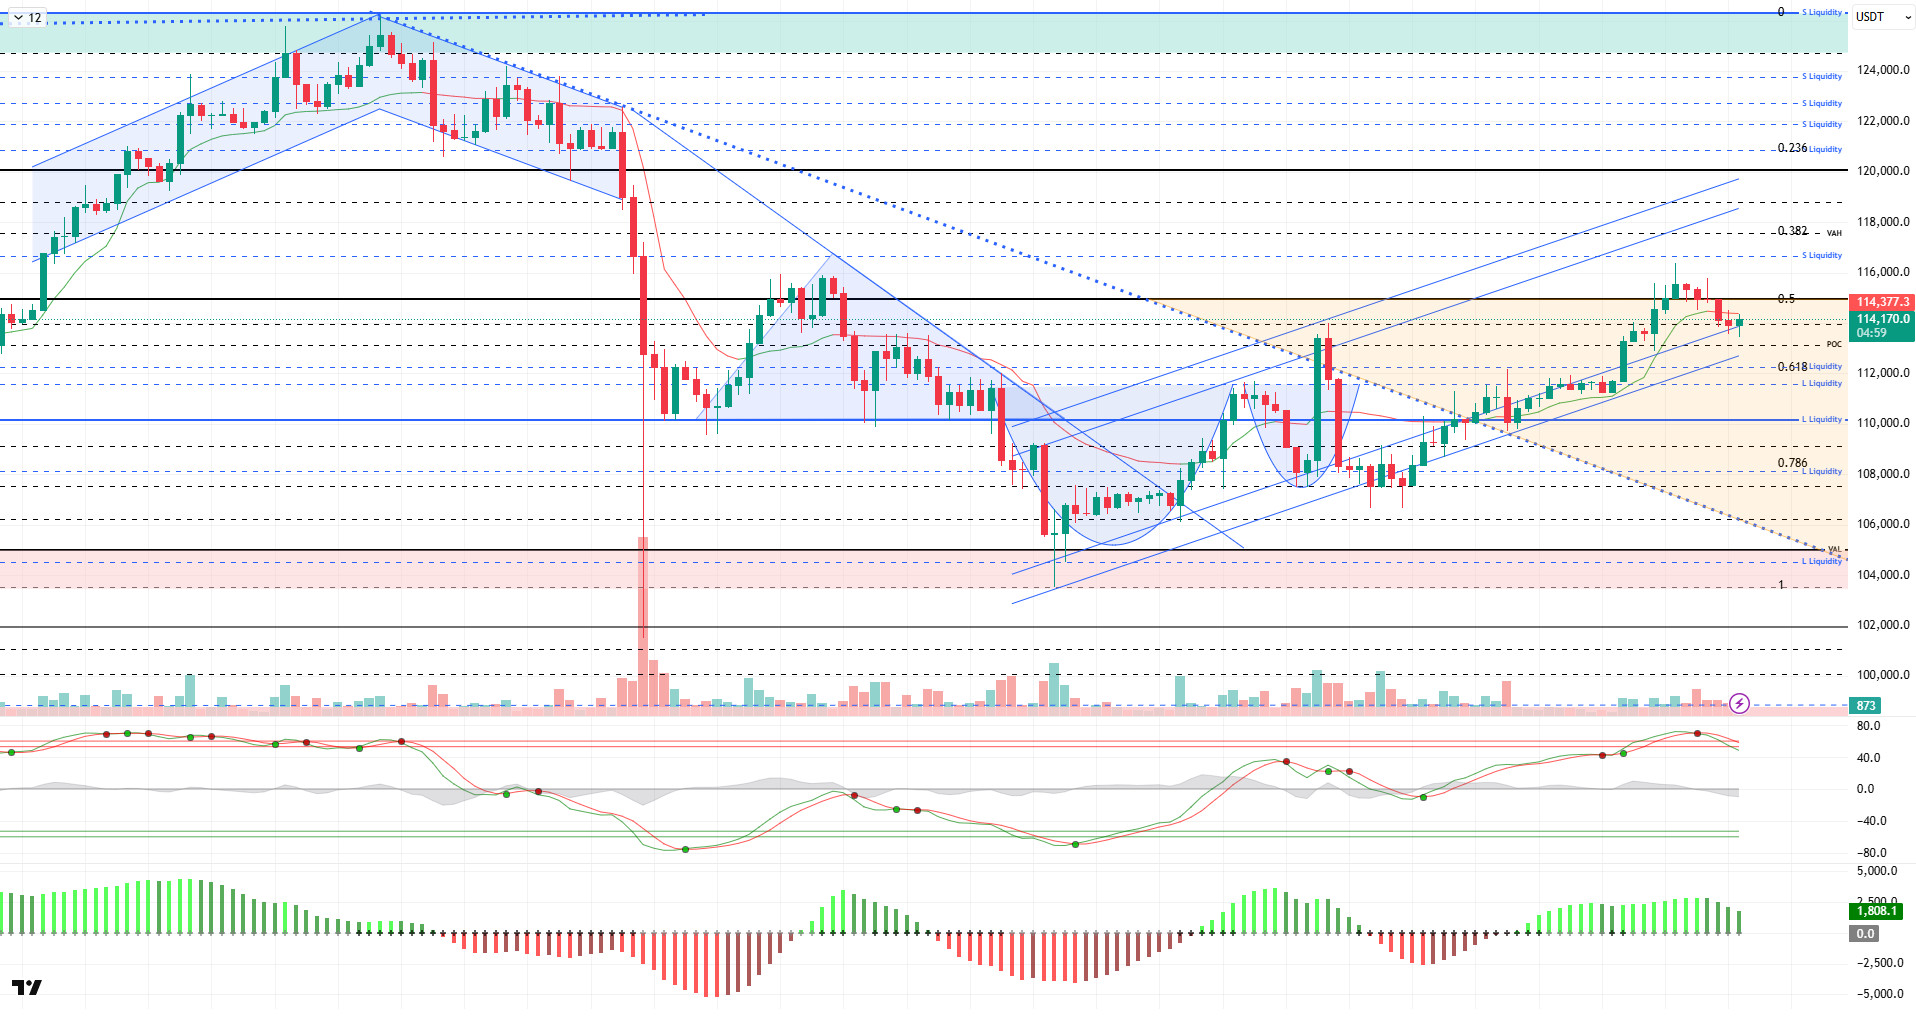
From a technical perspective, BTC failed to hold above the 115,000-level compared to the previous analysis and fell back to the trend line at 113,500. After recovering somewhat, the price continues to trade just above the 114,000 level. BTC, which is heading towards the POC area, appears to be consolidating slightly after the rise.
Technical indicators show that the Wave Trend (WT) oscillator gave a sell signal in the oversold zone. The Squeeze Momentum (SM) indicator’s momentum, which had gained traction in the positive zone, has weakened. The Kaufman Moving Average (KAMA) is currently at $114,300, positioned just above the price.
According to liquidation data, the buying level has gained fragmented intensity in the 108,000–111,000 band, while the point of increased accumulation is 112,450 in the short term. In contrast, the selling level continues to maintain its intensity above 116,400 in the short term and 120,000 in the long term. The total liquidation amount in the market over the last 24 hours was recorded at $291 million.
In summary, developments in the reconciliation process between the US and China are viewed positively by the markets, while the agreement will be submitted to the leaders for final approval. The lack of concrete progress on reopening the US government remains another factor creating uncertainty. On the Russia-Ukraine front, Ukraine is preparing to present a draft ceasefire agreement, while Russia is seen flexing its muscles with missile strikes. On the technical side, BTC has once again surpassed the 110,000 reference level, and trading volumes have balanced out in liquidity data. With the price settling above the 110,000 level, we followed the 115,000 resistance area. In the coming period, the price holding within the rising channel stands out as a critical threshold, and closes above the 115,000 level could make the 120,000 level a target. In the event of potential selling pressure, we will monitor the 112,450 liquidity zone.
Supports: 114,000 – 112,600 – 111,400
Resistances: 115,000 – 116,600 – 117,400
ETH/USDT
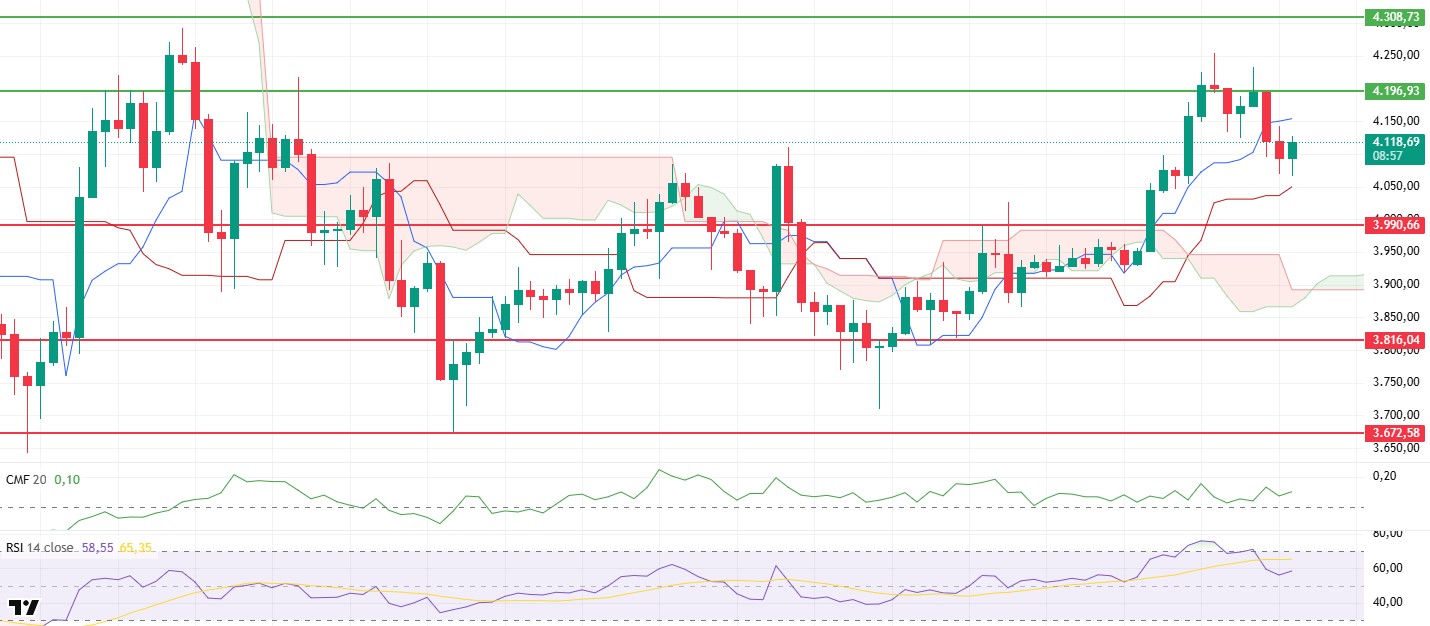
The Ethereum price fell back slightly as expected yesterday evening, dropping to $4,060. Buyers stepped in at this level, and the price rebounded to $4,120 by morning. Looking at intraday movements, it is noteworthy that buyers are still active in the market in the short term, but there are signs of a weakening in overall momentum.
The Relative Strength Index (RSI) indicator shows that the necessary correction has taken place by turning downward from the overbought zone. This decline in the RSI indicates that the price has moved away from the overbought zone in the short term and has entered a balancing process. There is some deterioration in the strong momentum structure, which indicates that the price may move sideways or show a slight correction trend for a while.
The Chaikin Money Flow (CMF) indicator, on the other hand, rebounded and gained upward momentum in positive territory, unlike yesterday. The CMF gaining strength in positive territory indicates increased liquidity inflows into the market and buyers finding support again. This structure confirms that the price maintains overall buyer pressure despite short-term pullbacks.
The overall outlook in the Ichimoku indicator remains positive. The price is still trading above the Kijun level and the kumo cloud. However, the loss of the Tenkan level can be interpreted as a sign of weakness in the short term. This structure indicates that short-term pullbacks may continue, but the overall trend is still upward. In the medium term, the price remaining above the cloud confirms that the upward trend is technically supported.
The current technical outlook shows that Ethereum retains its potential to rise to the $4,196 level. This area should be monitored as the main resistance in the short term. For the upward movement to gain strength, the price needs to close above $4,196. Otherwise, $4,060 is the first support level, while $3,990 is the main support level. If the price falls below $3,990, selling pressure may increase and the price may retreat to the $3,900 range.
Top of Form
Below the Form
Supports: 3,990 – 3,816 – 3,672
Resistances: 4,196 – 4,308 – 4,442
XRP/USDT
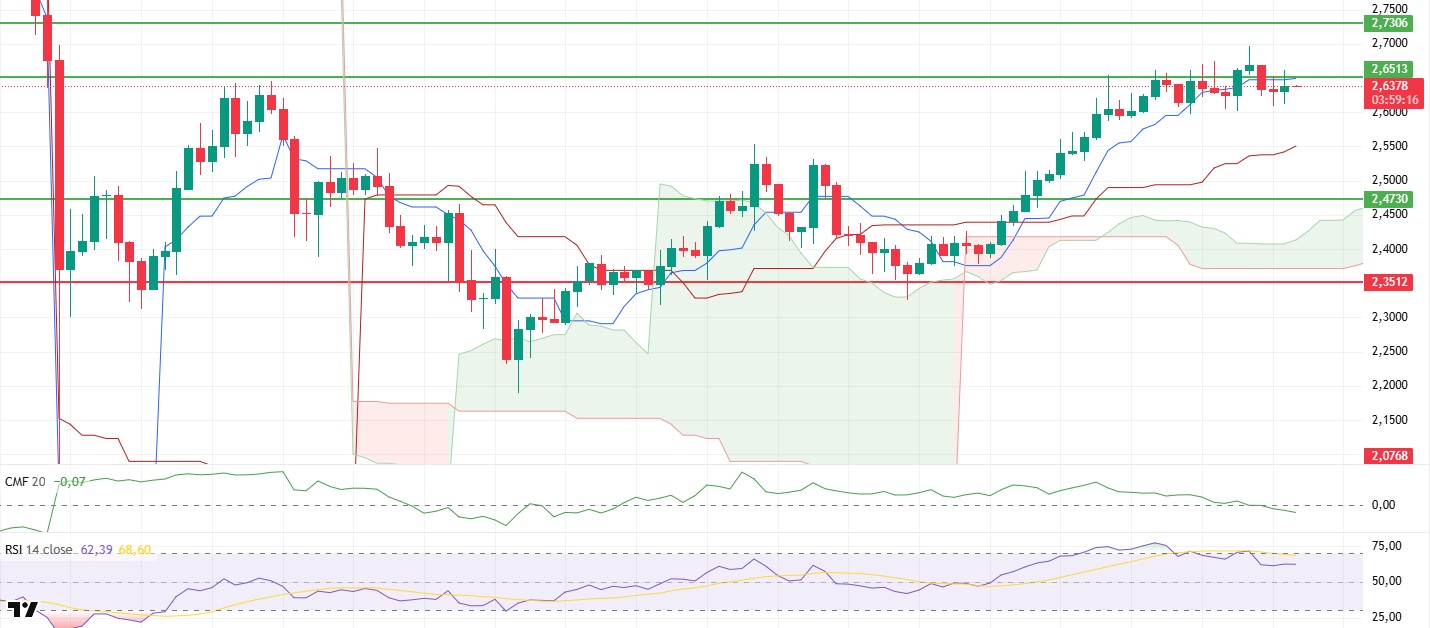
The XRP price has been moving sideways within a narrow range between $2.60 and $2.65 since yesterday evening. This consolidation process indicates that the balance between buyers and sellers is being maintained in the short term and that the search for direction continues. The price remaining within this range signals that energy is building up in the market ahead of a strong breakout.
The Chaikin Money Flow (CMF) indicator has weakened in recent hours and moved into negative territory. This pattern indicates that capital outflows have increased again in the market and buying appetite has decreased on the spot side. The CMF’s movement into negative territory suggests that the upward movement may be limited in the short term and that the price lacks volume support.
The Relative Strength Index (RSI) indicator has moved out of the overbought zone and started to trend sideways. This suggests that the short-term correction is complete and the market is attempting to build new upward momentum. The RSI’s balanced position is setting the stage for renewed upside potential.
The overall structure of the Ichimoku indicator remains unchanged. The price continues to stay above the Tenkan and Kijun levels. The absence of any weakening below the Kumo cloud confirms that the medium-term trend remains positive. This technical picture supports that the overall trend is still bullish despite short-term fluctuations.
Although the XRP price is generally moving within a narrow consolidation range, the mixed trend of technical indicators suggests caution is warranted in the short term. The CMF remaining in negative territory could create pressure in the short term, but with the RSI stabilizing, the possibility of a new upward momentum forming is strengthening. While the price may test the $2.55 level in the short term, a clear break above $2.65 could provide the upward momentum needed to regain momentum. The overall trend remains positive, but limited correction potential persists in the short term.
Supports: 2.4730 – 2.3512 – 2.2100
Resistances: 2.6513 – 2.7306 – 2.8576
SOL/USDT
Huaxia Solana ETF officially began trading on the Hong Kong Stock Exchange on October 27, 2025. Bitwise launched BSOL, the first US spot Solana ETF traded on the NYSE.
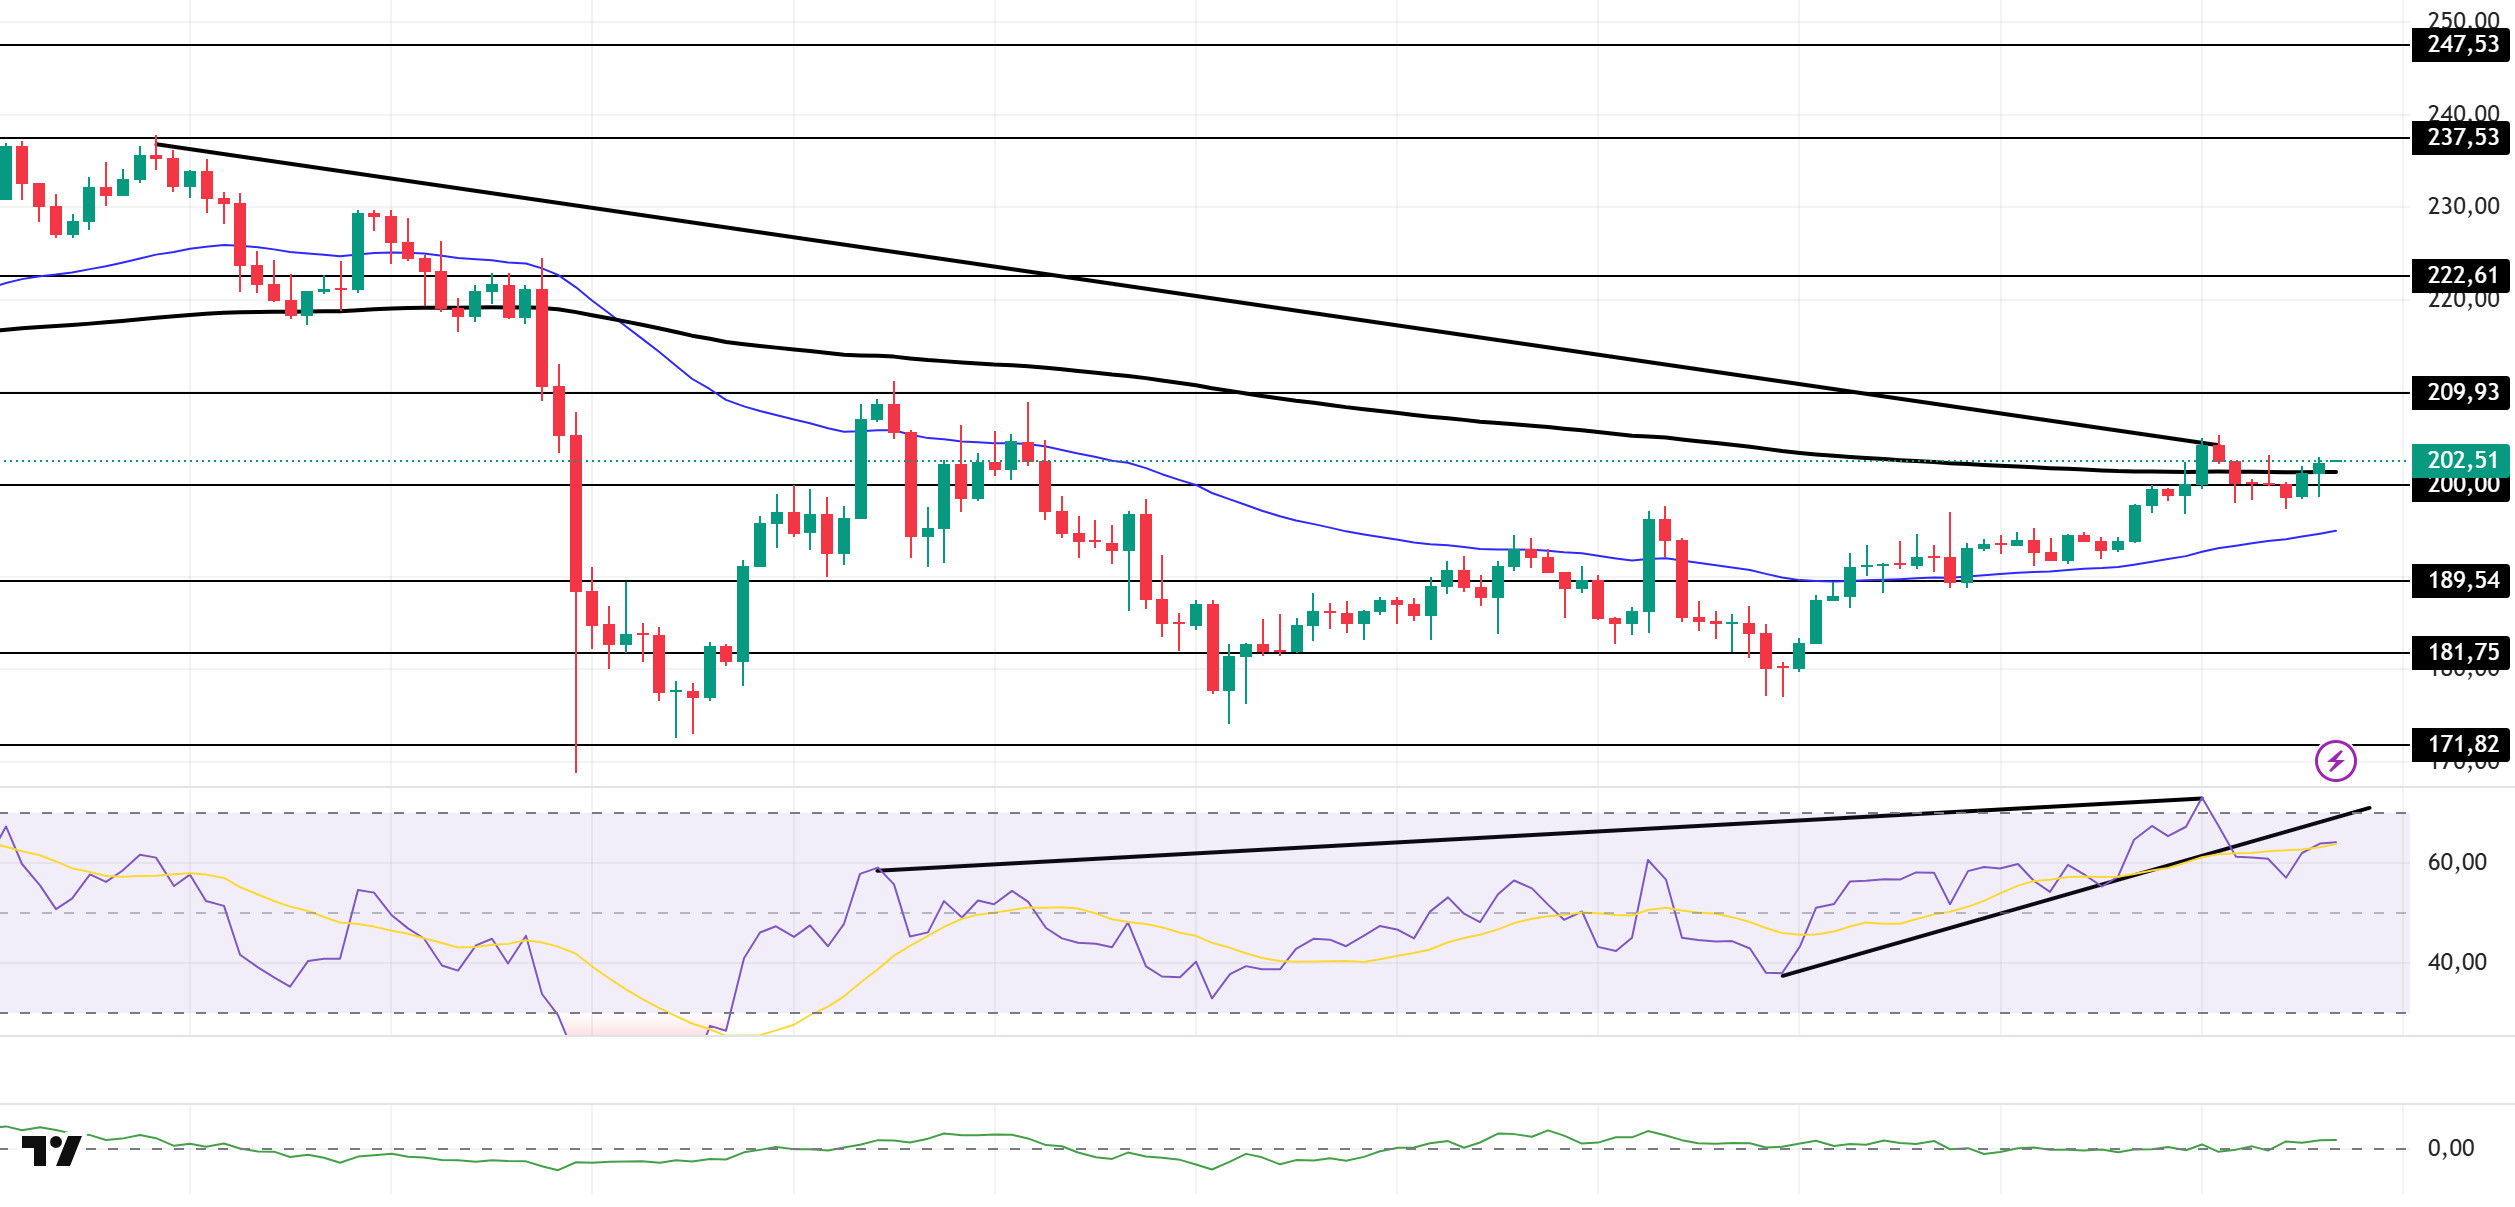
The SOL price continued its sideways movement. The asset broke above the 200 EMA (Black Line) moving average but failed to hold above it, pulling back and starting to trade below the moving average again. Currently testing the strong support level of $200.00, the price could test the 50 EMA (Blue Line) moving average and the $189.54 level if the pullback continues. If the uptrend continues, the $222.61 level should be monitored.
On the 4-hour chart, it remained below the 50 EMA (Exponential Moving Average – Blue Line) and 200 EMA (Black Line). This indicates a possible downtrend in the medium term. At the same time, the price being between the two moving averages shows us that the asset is in a decision phase in the short term. The Chaikin Money Flow (CMF-20) remained positive near the neutral level. However, the decrease in money inflows could push the CMF into negative territory. The Relative Strength Index (RSI-14) retreated from the overbought zone and began to settle in the middle of the positive zone. At the same time, it remained below the rising line that began on October 22. This could increase selling pressure. Additionally, bearish divergence should be monitored. In the event of an uptrend due to macroeconomic data or positive news related to the Solana ecosystem, the $237.53 level stands out as a strong resistance point. If this level is broken upwards, the uptrend is expected to continue. If pullbacks occur due to developments in the opposite direction or profit-taking, the $181.75 level could be tested. A decline to these support levels could increase buying momentum, presenting a potential upside opportunity.
Supports: 200.00 – 189.54 – 181.75
Resistances: 209.93 – 222.61 – 237.53
DOGE/USDT
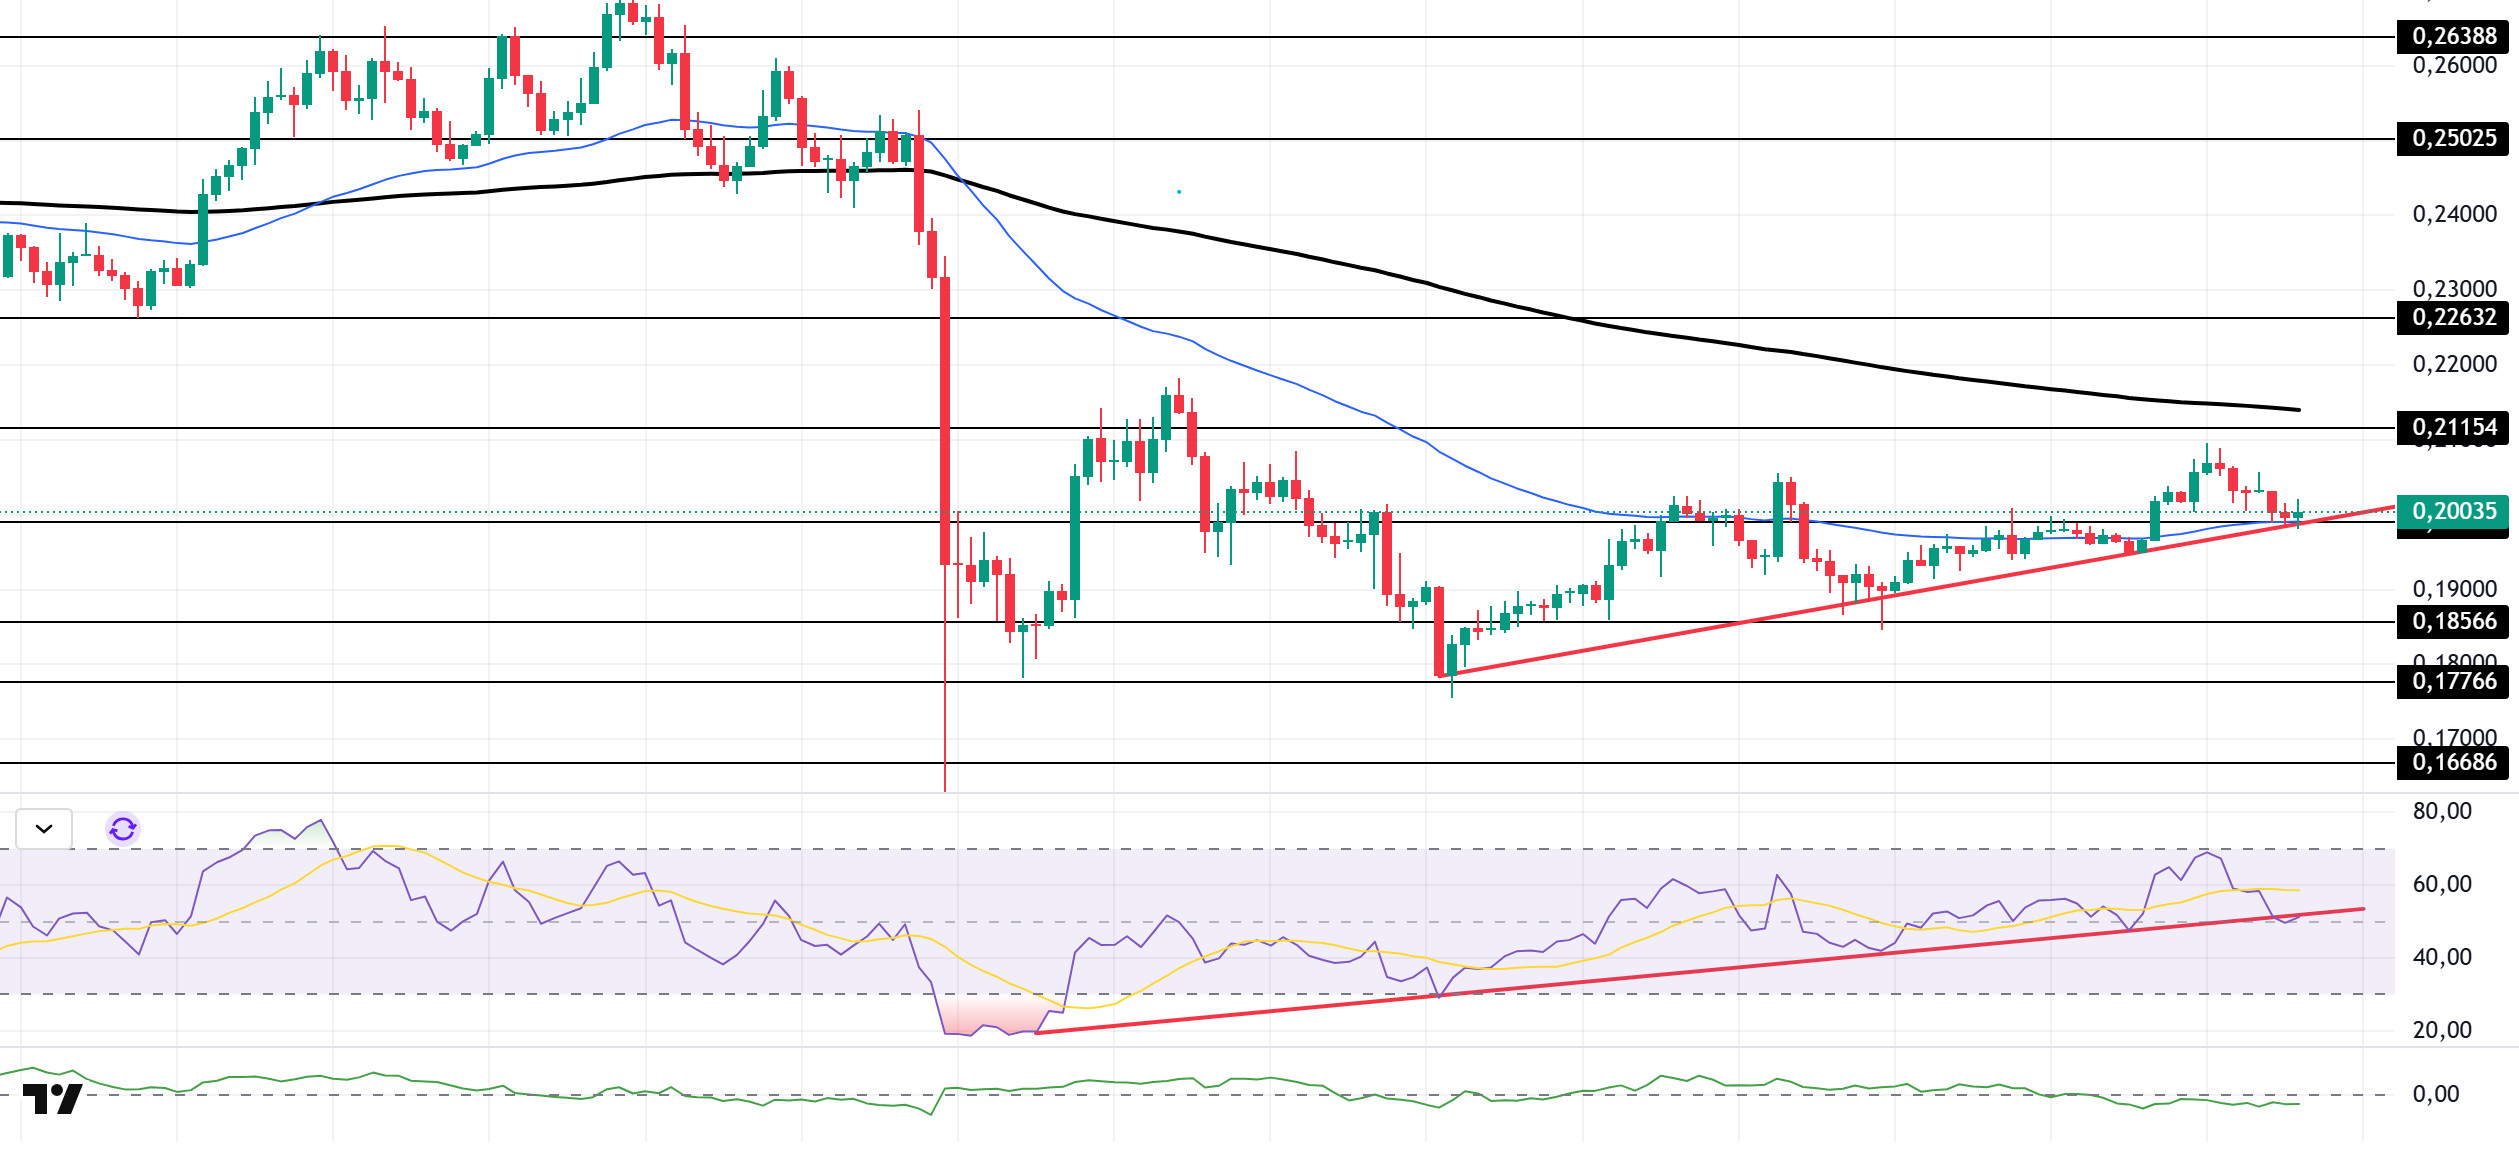
The DOGE price experienced a slight decline. The asset continues to hold onto the upper region of the upward trend that began on October 17. This indicates increased upward pressure. Currently testing the rising trend line and the 50 EMA (Blue Line) moving average for support, the price could test the 200 EMA moving average as resistance if it experiences an uptrend. It could test the $0.17766 level on candle closes below the rising trend line.
On the 4-hour chart, the 50 EMA (Exponential Moving Average – Blue Line) remained below the 200 EMA (Black Line). This indicates that a medium-term downtrend may begin. The price being between the two moving averages shows that the price is in a decision phase in the short term. The Chaikin Money Flow (CMF-20) also remained in negative territory. Additionally, a decline in money inflows could push the CMF deeper into negative territory. The Relative Strength Index (RSI-14) is currently testing the upward trend that began on October 12 as support. At the same time, it experienced a pullback and retreated to a neutral level. This signaled that the downward trend could increase. In the event of an upturn driven by political developments, macroeconomic data, or positive news flow in the DOGE ecosystem, the $0.22632 level stands out as a strong resistance zone. Conversely, in the event of negative news flow, the $0.17766 level could be triggered. A decline to these levels could increase momentum and potentially initiate a new upward wave.
Supports: $0.19909 – $0.18566 – $0.17766
Resistances: 0.21154 – 0.22632 – 0.25025
AVAX/USDT
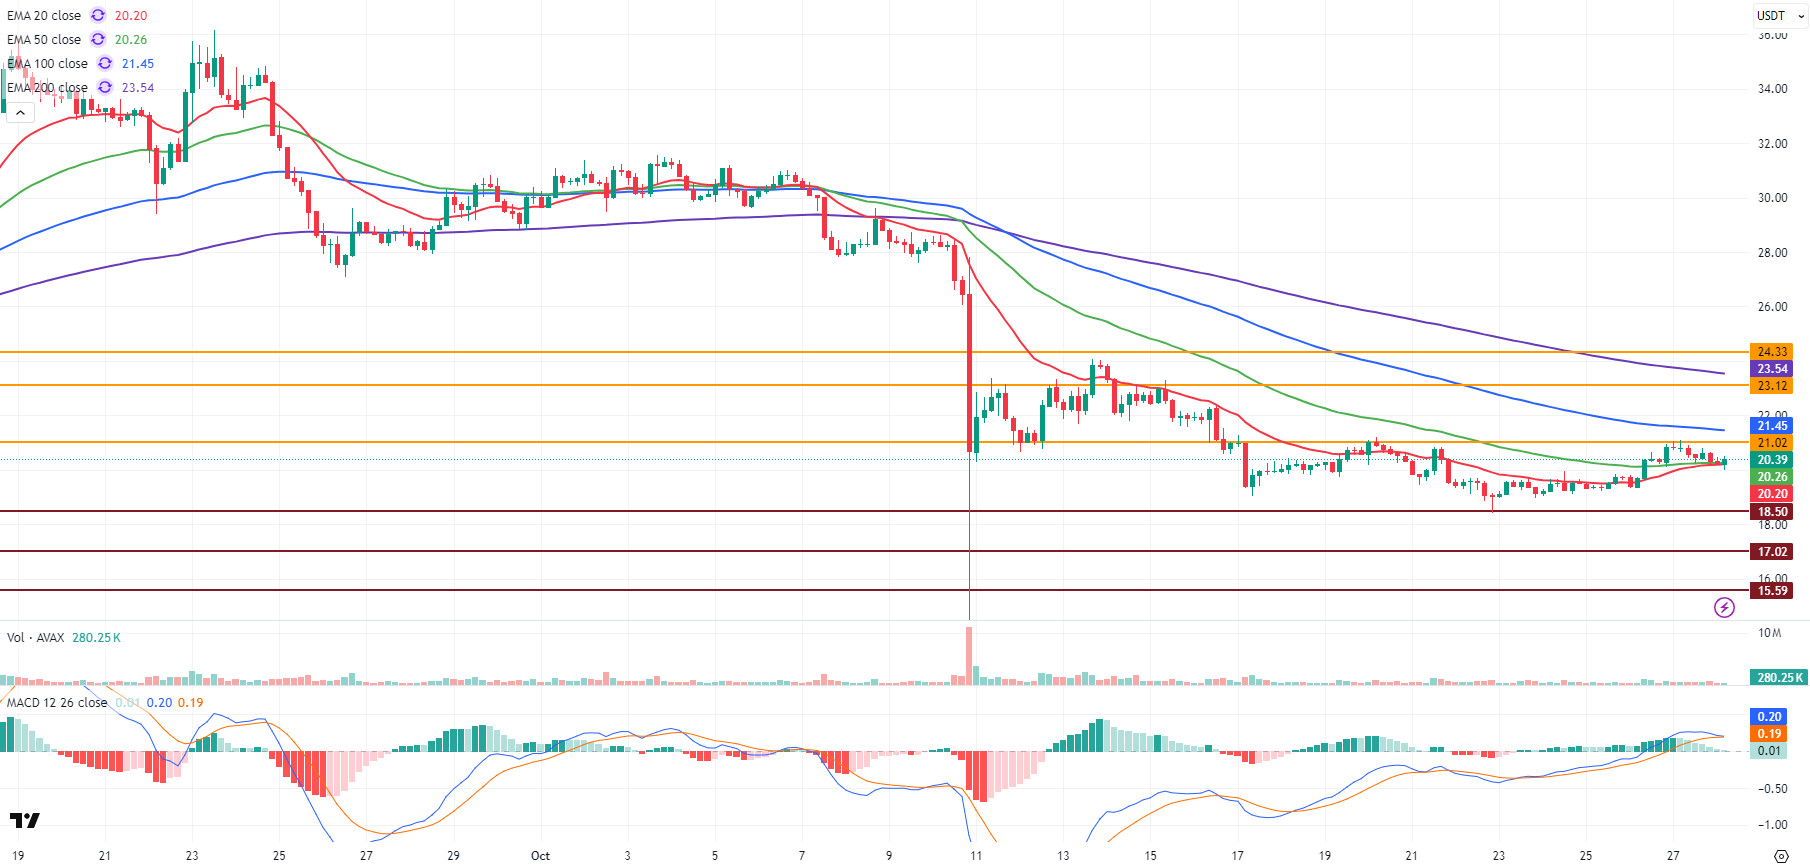
Starting the day at $20.82, AVAX tested the $21.02 resistance level during the day but failed to break through it, resulting in a decline. Following the selling pressure at the resistance level, AVAX experienced a decline, closing the day at $20.33 and losing approximately 2.35% in value on a daily basis. With yesterday’s decline, AVAX tested the 20 and 50-period Exponential Moving Average (EMA) levels on the 4-hour chart. AVAX, which also had a weak start to the new day, continues to trade above the EMA20 and EMA50 levels after testing these areas once again during its decline, thanks to limited buying. AVAX showed a strong recovery trend throughout the past week, but it has been unable to sustain itself at the resistance level due to the lack of volume accompanying the rise. This indicates that momentum has weakened in the short term and the rise may be limited.
On the 4-hour chart, the Moving Average Convergence/Divergence (MACD) line has crossed the signal line and is pointing down. This view indicates that momentum is weakening and selling pressure may increase again. If the MACD line crosses the signal line downward, the decline may gain momentum. AVAX is currently trying to hold just above the EMA20 and EMA50 levels. These areas stand out as the first important support zone in the short term. If AVAX falls below these levels and closes there, selling pressure may increase. In upward movements, the EMA100 and EMA200 levels are important resistance areas for AVAX in the continuation of the uptrend. Breaking through these areas could allow the upward momentum to regain strength.
From a technical perspective, the $21.02 level remains the first strong resistance level for AVAX. If this level is broken, the EMA100 at $23.12 and subsequently the EMA200 at $24.33 could come into play. Breaking through the EMA100 and EMA200 levels is particularly critical for the trend to turn positive in the medium term. In downward movements, the EMA20 and EMA50 levels, followed by the $18.50 level, act as strong support levels. If there are closes below these levels, selling pressure may increase, causing AVAX to retreat to the $17.02 and $15.59 levels. In the overall outlook, while momentum is weakening on the MACD side, AVAX maintaining its position above the EMA20 and EMA50 can be considered a supportive factor in the short term. However, if there are closes below these levels ( ), selling pressure could increase and the decline could gain momentum. Continued weak momentum in the short term suggests that AVAX may struggle to break above the $21 level. Expecting sustained gains without an increase in volume may be premature at this point.
(EMA20: Red Line, EMA50: Green Line, EMA100: Blue Line, EMA200: Purple Line)
Support Levels: 18.50 – 17.02 – 15.59
Resistances: 21.02 – 23.12 – 24.33
LINK/USDT
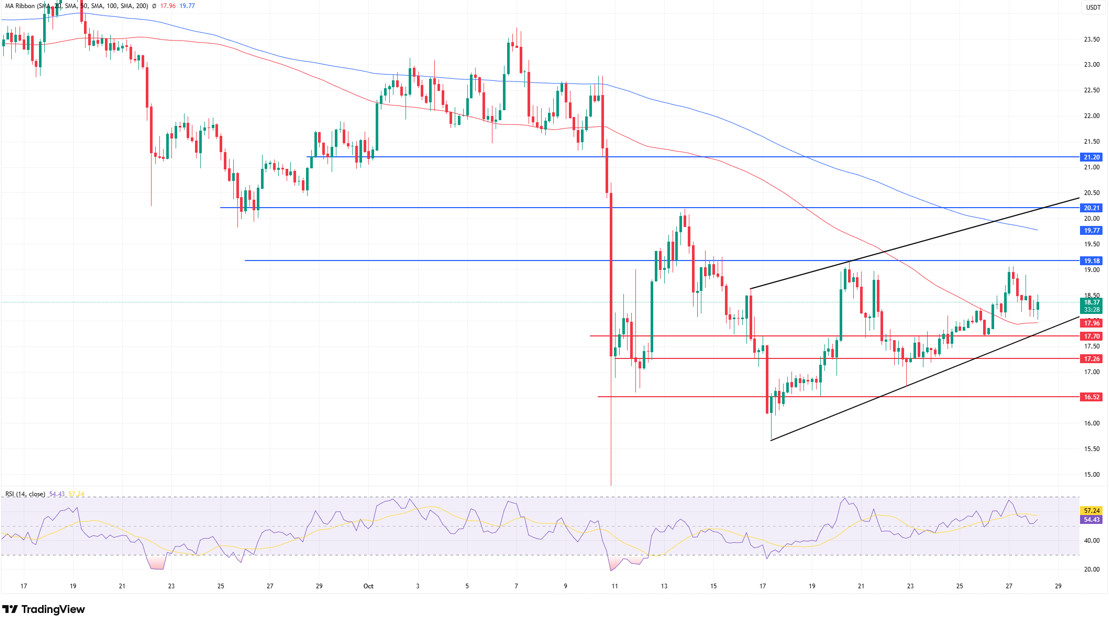
As we mentioned in yesterday’s analysis, the $19 level remains the most critical resistance level for LINK. We see that the price has entered a pullback trend due to the selling pressure from the region we mentioned. The failure to maintain stability above the $19 band has caused the upward momentum to weaken and the price to ease to the $18 region in the short term. However, this pullback continues within an ascending channel in terms of the overall structure. If this channel support is lost, the chart structure could signal a bearish trend. However, it is too early to discuss such a scenario at this point, meaning the trend has not yet broken down.
The price’s current position is a critical equilibrium point, as it aligns with both the lower band of the ascending channel and the area where the 100-day moving average passes. If this level holds, the price has a high potential to regain upward momentum and test the $19 resistance. However, a 4-hour close below $17.70 could weaken both the rising channel and the short-term positive structure. In this case, the price is likely to pull back first to the $17.26 intermediate support level and then to the $16.52 region. Indeed, a 4-hour close at the $17.70 level, which we mentioned above as a “bearish” signal, could pull us down to the $16.52 region. To speak of the sustainability of a possible upward movement, we need to close above the 19.18 resistance zone, break above the current channel’s middle band, and then rise above both our 200-day moving average and the 20-dollar level, which is the channel resistance.
The Relative Strength Index (RSI) indicator is currently hovering around the 55 level and continues to move in positive territory. While this indicates that buyers are still active in the market, the weakening that began yesterday at the 67 level is still ongoing. If the RSI falls below the 50 level, it will signal that selling pressure could regain strength and that the risk of the price testing the support line around $17.70 has increased.
Specifically, the $17.70–18.00 range can be interpreted as the main defense line for maintaining the short-term uptrend. A potential rebound from this area could push the price back into a positive trend and initiate a recovery movement towards the $19–20 range. However, a break below this area could trigger a new wave of correction, as mentioned in yesterday’s analysis, which could deepen the price down to the $16.52 region.
Supports: 17.70 – 17.26 – 16.52
Resistances: 19.18 – 20.21 – 21.20
Legal Notice
The investment information, comments, and recommendations contained herein do not constitute investment advice. Investment advisory services are provided individually by authorized institutions taking into account the risk and return preferences of individuals. The comments and recommendations contained herein are of a general nature. These recommendations may not be suitable for your financial situation and risk and return preferences. Therefore, making an investment decision based solely on the information contained herein may not produce results in line with your expectations.

