
Weekly Fundamental Analysis Report
Fear & Greed Index
Source: Alternative.me
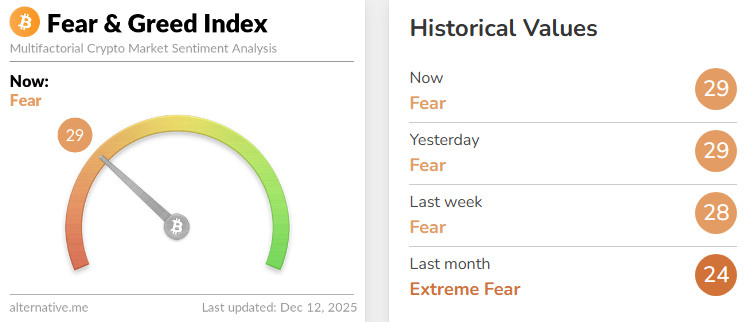
- Change in Fear and Greed Value: +1
- Last Week’s Level: 28
- This Week’s Level: 29
The Fear and Greed Index showed a limited increase from 28 to 29 this week, remaining in the fear zone but signaling a gradual shift away from the deep panic atmosphere that followed the sharp sell-off in October. In the early days of the week, Bitcoin spot ETFs saw a strong daily inflow at the beginning of December, followed by a fluctuating but generally more balanced flow, which supported the perception that institutional investors had not completely given up, preventing the index from falling further. In the middle of the week, the Federal Reserve cut its policy rate by 25 basis points, bringing the corridor to 3.50-3.75 range, was seen as supportive for crypto markets in terms of dollar liquidity and financial conditions. However, the projections released did not allow for a very aggressive easing cycle in the coming period, thus limiting excessive optimism. This dual effect caused the index to record a cautious improvement with only a one-point upward movement. The weekly jobless claims, announced immediately after the Fed’s decision, jumped to 236,000, showing one of the sharpest weekly increases in recent years, raising concerns about weakening employment and dampening risk appetite. During the same period, Bitcoin tested around $94,000 after the Fed’s decision, then fluctuated again in the $90,000-95,000 range, while stock markets saw profit-taking in AI-themed indices, revealing that crypto was priced more cautiously than other risky assets. This dynamic also stood out among the price dynamics preventing the index from exiting the fear zone.
Crypto Fund Flows
Source: Coinshares
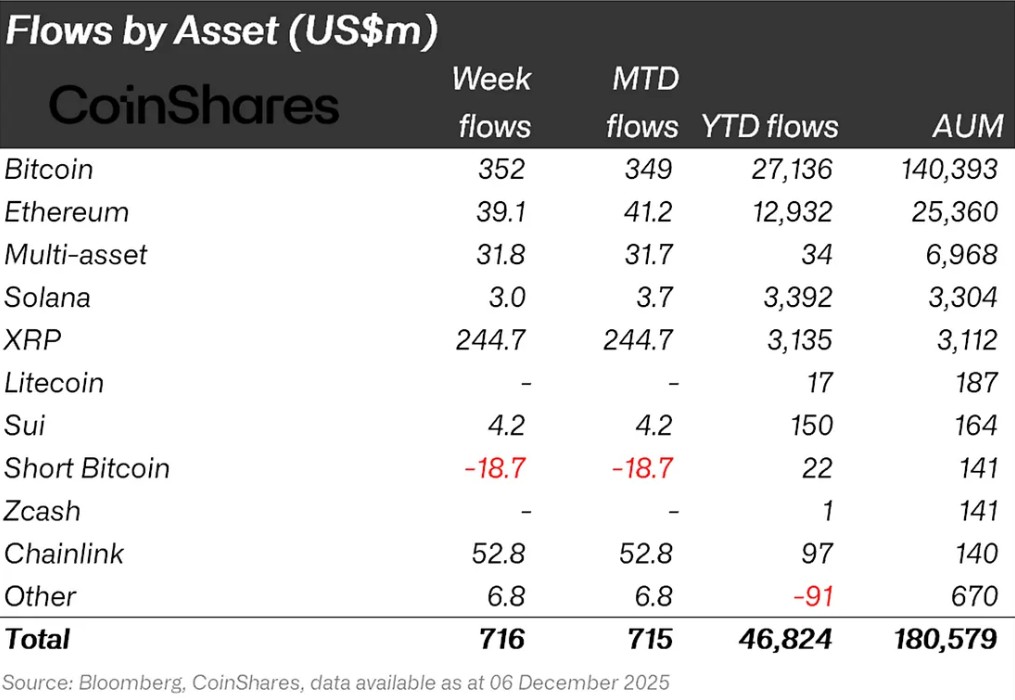
Overview: Crypto markets are continuing a calm week following the Fed’s 25 basis point interest rate cut. Generally positive statements from Fed members kept the market flat, while these developments provided limited support to Bitcoin. As a result, Bitcoin gained approximately 1% in value over the week.
Bitcoin (BTC): Bitcoin continues to see weak inflows from investors this week. Bitcoin-focused funds saw inflows of $352.0 million.
Ethereum (ETH): Along with spot ETH inflows, Ethereum saw $39.1 million in inflows this week.
Solana (SOL): Solana saw inflows of $3.0 million.
SUI: Sui’s stablecoin initiatives continue to have a positive impact. This trend continued with $4.2 million in inflows into Sui.
Ripple (XRP): This week, XRP saw $244.7 million in fund inflows.
Multi-asset: Inflows were observed in the multi-asset group.
Other: Sector-specific and project-based increases in altcoins, along with the general market outlook, brought in $6.8 million in fund inflows.
Fund Outflows:
Short Bitcoin: Short Bitcoin saw an outflow of 18.7 million dollars.
Total MarketCap
Source: Tradingview
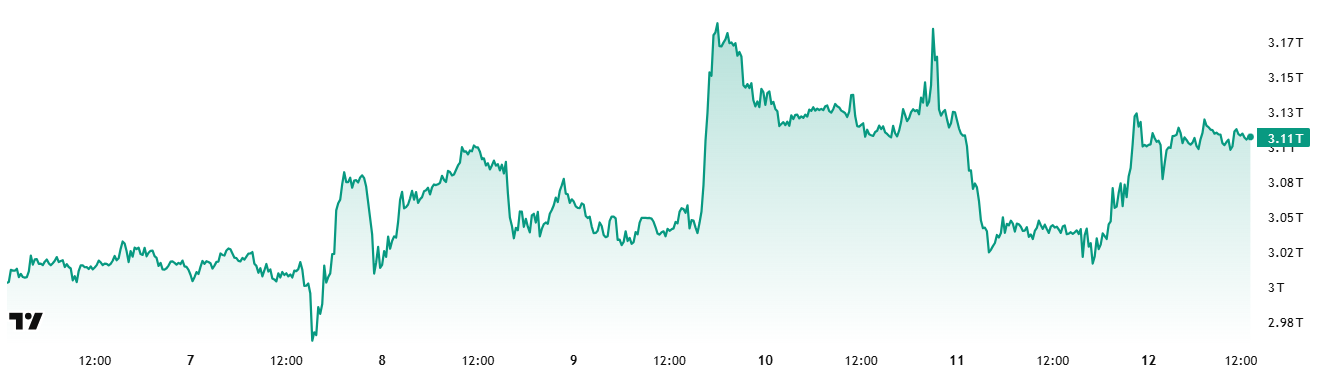
- Market Value Last Week: $3.04 Trillion
- This Week’s Market Value: $3.11 Trillion
This week, the cryptocurrency market grew by approximately $71 billion, advancing 2.36% and bringing the total market value to $3.11 trillion. The week’s peak was $3.2 trillion, while the lowest level was $3.01 trillion. Thus, the market moved within a band of 187 billion dollars, which translates to a volatility of 6.22%. Although wider than last week’s range of 12.39%, it can be considered within the crypto market’s typical weekly average candle size.
Total 2
Starting the week with a market value of $1.23 trillion, the Total 2 index rose 2.5% during the week, gaining approximately $30 billion in value and ending the period at around $1.25 trillion. The weekly high was $1.31 trillion, while the low was $1.22 trillion. In other words, the index fluctuated within a range of $85 billion, which corresponds to a volatility of approximately 6.97% for the period. With this rise, Total 2 is now positioned about 40% away from its all-time high. Therefore, if the decline is seen as a corrective movement, it can be said that an upward trend is beginning to form on the altcoin side.
Total 3
Total 3 started the week with a total value of $0.862 trillion, grew by approximately $8.95 billion during the week, recording an 1.04% increase, and closed the period at $0.871 trillion. The volatility between the week’s highest and lowest values was only 6.08%. Thus, Total 3 retained its title as the most stable index this week, and interestingly, this picture has not changed for five weeks.
The index-volatility ranking of Total 2 > Total > Total 3 indicates that the dominant movement in the majors first intensified in Ethereum and then in Bitcoin. Furthermore, Ethereum’s total market share has seen a significant increase during this period.
Altcoin Season Index
Source: Coinmarketcap
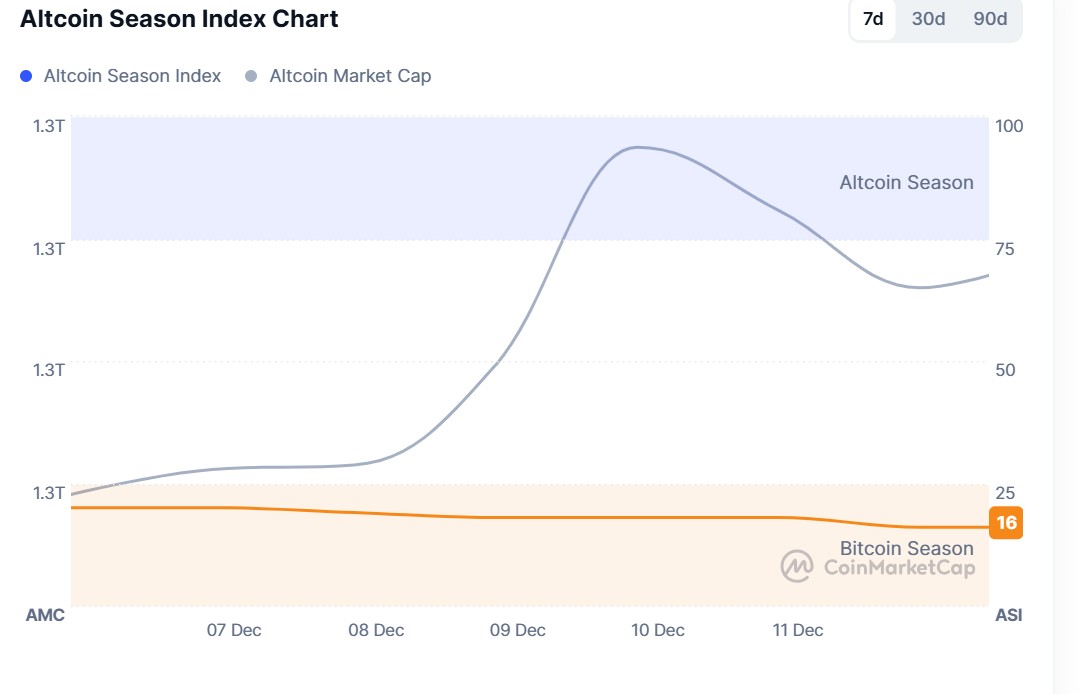
- Last Week’s Index Value: 21/100
- This Week’s Index Value: 16/100
Between December 7 and December 12, 2025, after a slight increase in the correlation between altcoin market dominance (Altcoin Market Cap) and the Altcoin Season Index, a decline occurred again. The chart shows that this week, on December 10 , the index rose to 18, indicating that the Altcoin Market Cap reached 1.27T. When the index rose this week, the top 5 coins leading the rise were Aster, Zec, M, Merl, and Dash. On December 11, the index fell from 18 to 16, indicating the potential for a decline in the altcoin season.
Bitcoin Dominance
Source: Tradingview
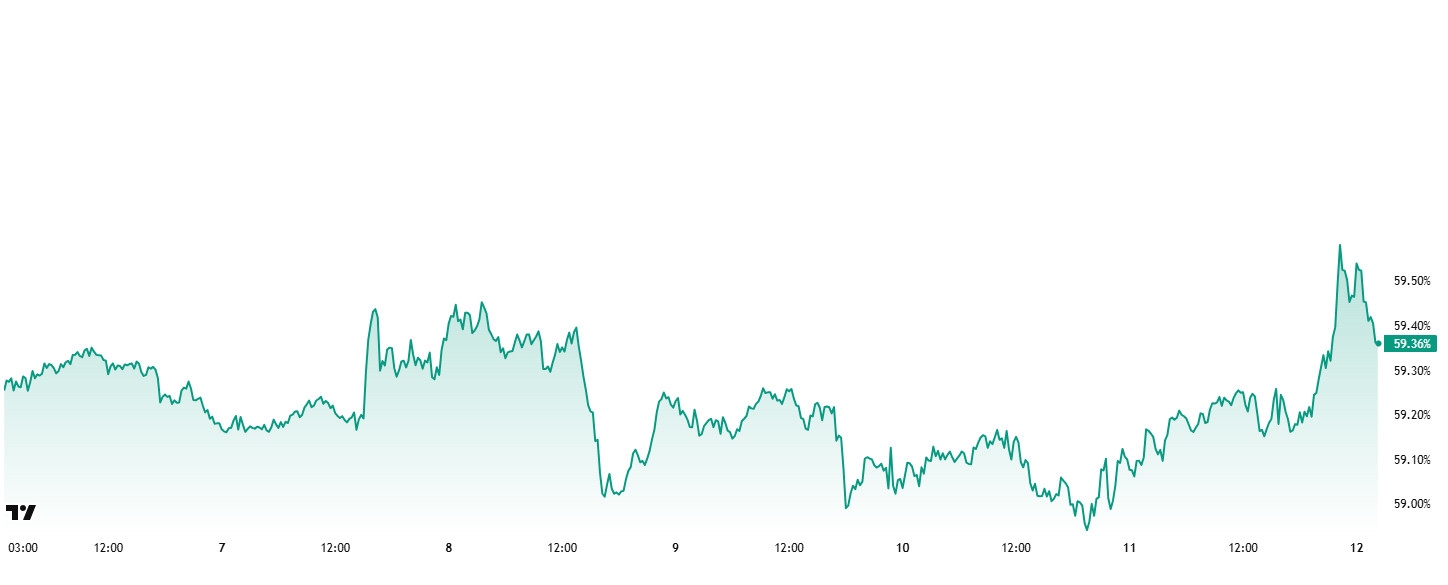
Weekly Change
- Last Week’s Level:36%
- This Week’s Level:36%
Bitcoin dominance started the week at 59.44%, fell to 59.04% during the week, but then rose slightly and is currently at 59.36%.
This week, Strategy purchased 10,624 Bitcoin, Lion Group Holding LTD. purchased 88.5 Bitcoin, and Vanadi Treasury purchased 10 Bitcoin. Furthermore, data on Bitcoin spot ETFs shows that there has been a total net inflow of $237.4 million to date.
Based on weekly data, while there has been a limited recovery in institutional buying appetite, an increase in buy positions has also been observed among retail investors trading through the ETF channel. Despite a partial decrease in uncertainty following the FED meeting, capital inflows into crypto assets generally remained weak, limiting the buying momentum in Bitcoin. Although the recent resumption of net inflows into spot Bitcoin ETFs points to a partial recovery in retail investor demand, the sustainability of this trend has not yet been confirmed. Under current macroeconomic conditions, it is noteworthy that Bitcoin has maintained a relatively more resilient pricing structure compared to Ethereum and other major altcoins. In this context, if the gradual increase in institutional and retail investor demand continues, BTC dominance is expected to maintain its current strong outlook and remain in a horizontal consolidation trend within the 58%–61% range.
Ethereum Dominance
Source: Tradingview
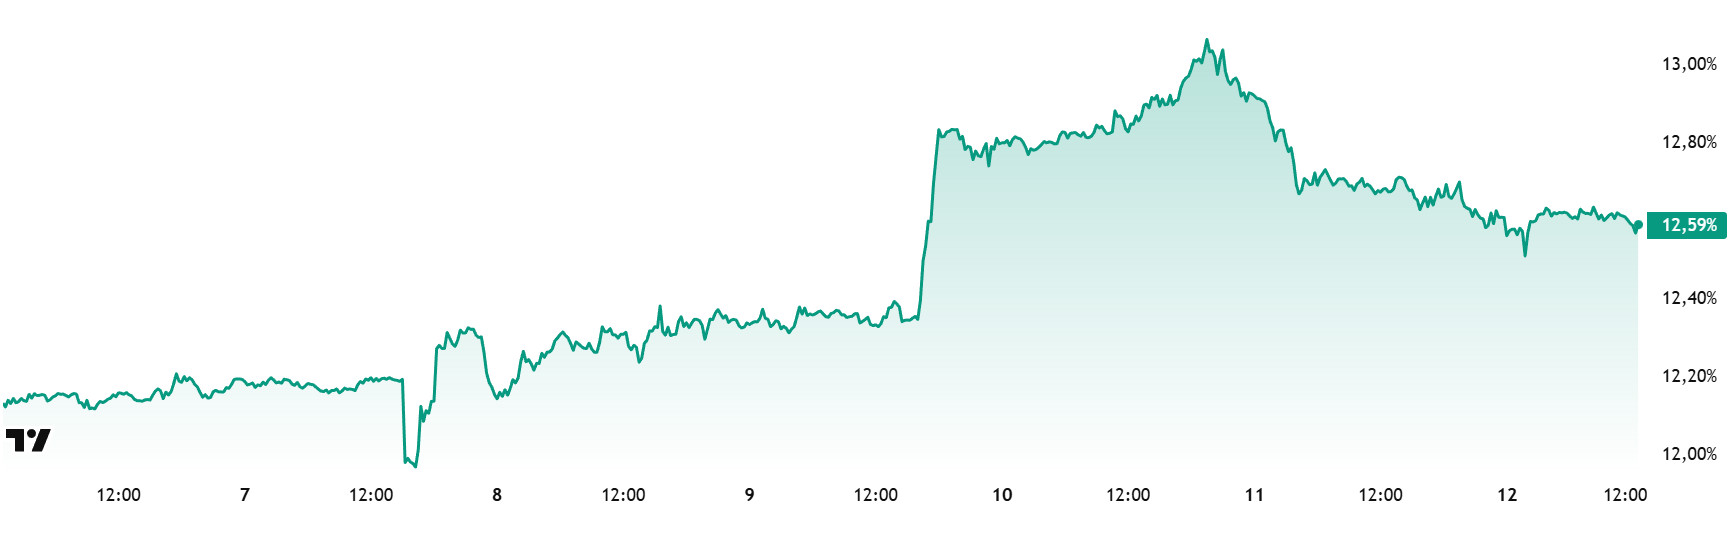
Weekly Change:
- Last Week’s Level: 12.17%
- This Week’s Level: 1 2.59%
Ethereum dominance, which rose to 15% levels in mid-August, lost momentum and entered a downward trend. However, this negative outlook ended above the 11.50% level at the end of November and regained positive momentum.
Accordingly, Ethereum dominance ended last week at 12.17% and is currently trading at around 12.59% based on the latest data. During the same period, Bitcoin dominance recorded a negative trend, unlike Ethereum dominance.
The key developments affecting Ethereum dominance are as follows:
The Ethereum Foundation announced that BPO-1 has been activated and the blob capacity per block has been increased to 15. This improvement aims to increase Layer 2 efficiency without requiring a hard fork. The Foundation stated that capacity will increase further with BPO-2, which will be implemented in January. This step will provide significant gains in terms of cost and performance, especially in L2 solutions.
SharpLink announced that it received 446 ETH in rewards last week, bringing its total staking rewards to 8,776 ETH. The company’s staking strategy began on June 2, 2025. It was noted that 100% of all ETH positions are in institutional staking. This demonstrates the company’s confidence in its long-term staking revenue model.
The x402 Hackathon organized by EigenCloud has officially started, with the application deadline set for January 5, 2026. The event is supported by the Ethereum Foundation, Coinbase, Polygon, and other major ecosystem players. There is no cash prize for this hackathon; participants will gain access to marketing, mentorship, and potential grant opportunities. The organization’s focus is on developing next-generation smart agents and on-chain payment solutions.
BlackRock has filed an official S-1 application with the SEC for the iShares Staked Ethereum Trust ETF. This ETF will be the company’s fourth crypto-focused product. The new application coincides with growing market interest in Ethereum staking products.
Bitcoin Spot ETF
Source: Darkex Research Department
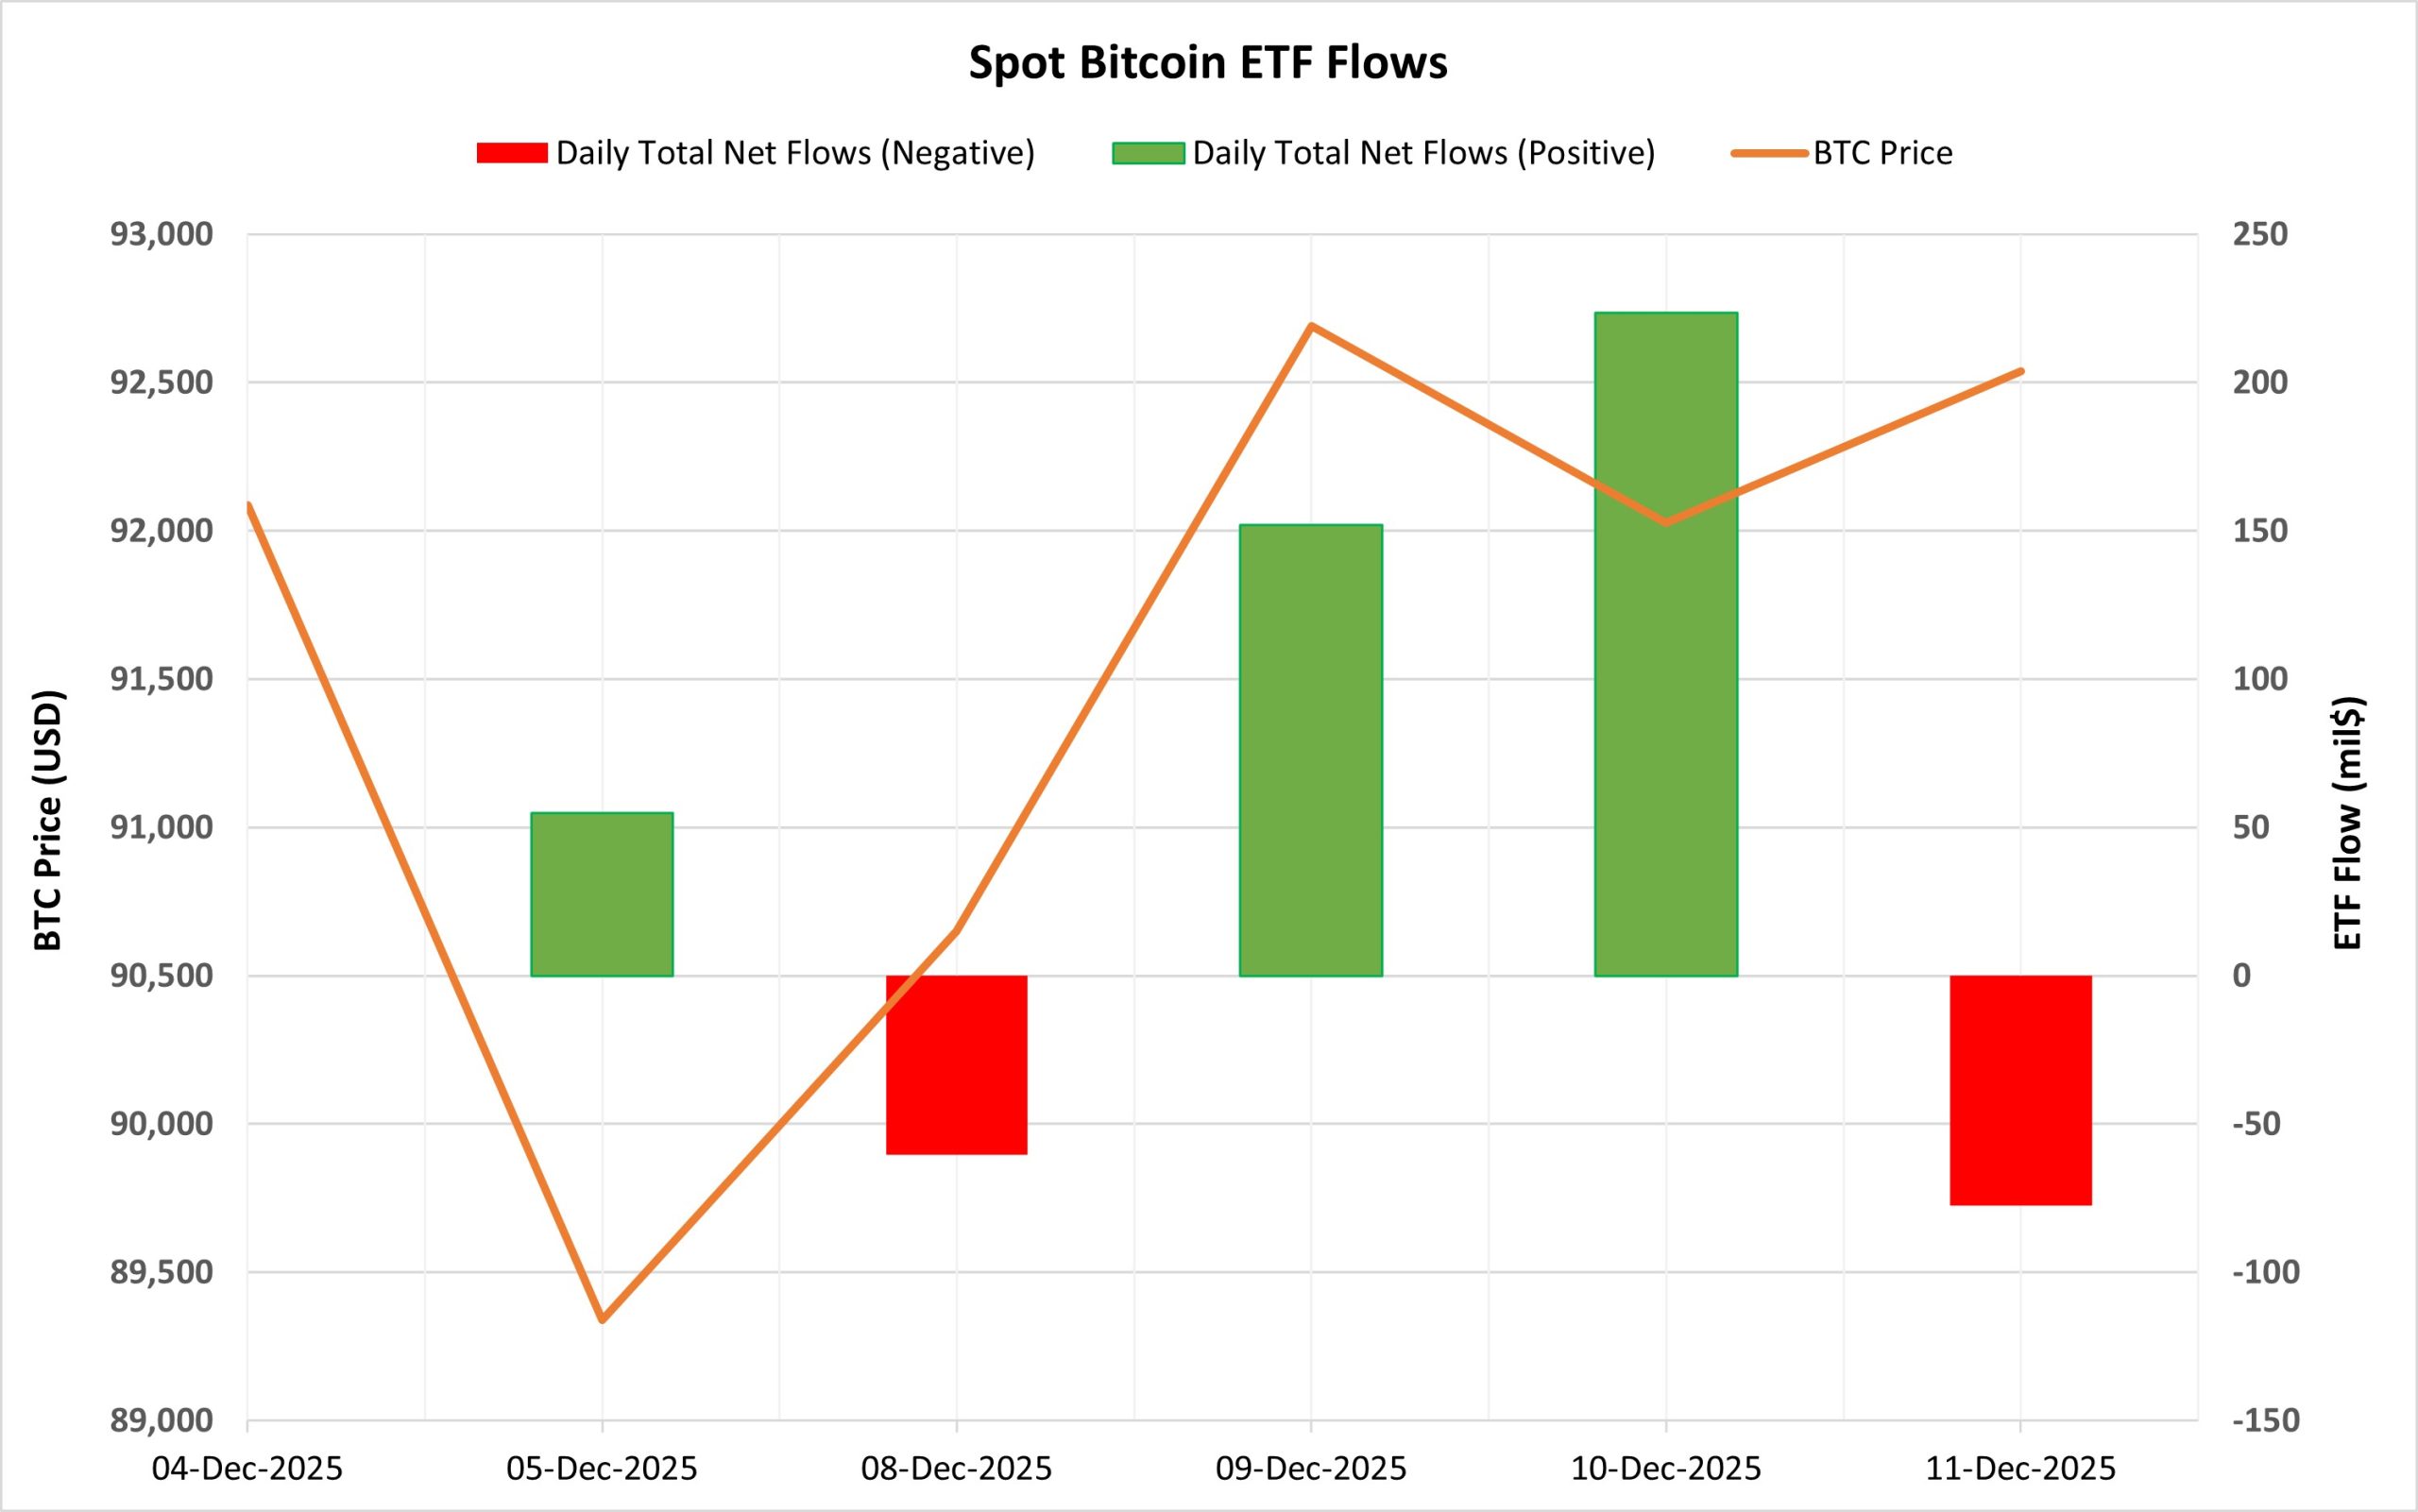
Netflow Status: Between December 5-11, 2025, there was a total net inflow of $292.3 million into Spot Bitcoin ETFs. During this period, flows were volatile, and no clear flow series emerged. Strong inflows on December 9 ($151.9 million) and December 10 ($223.5 million), ahead of and on the day of the Fed’s interest rate decision, were the main factors keeping the total positive during this period. Outflows observed on December 8 and 11 reflected investors’ short-term cautious stance. Fund-wise, inflows into Fidelity FBTC and BlackRock IBIT stood out.
Bitcoin Price: Bitcoin opened at $92,085 on December 5 and closed at $92,537 on December 11. During this period, the BTC price gained 0.49%. Despite strong inflows, the limited reaction on the price side pointed to a cautious search for balance in the market.
Cumulative Net Inflow: At the end of the 480th trading day, the cumulative total net inflow of Spot Bitcoin ETFs rose to $57.837 billion.
| DATE | COIN | Open | Close | Change % | ETF Flow (mil$) |
|---|---|---|---|---|---|
| 05-Dec-2025 | BTC | 92,085 | 89,339 | -2.98% | 54.8 |
| Dec 8, 2025 | 90,406 | 90,649 | 0.27% | -60.4 | |
| December 9, 2025 | 90,649 | 92,690 | 2.25% | 151.9 | |
| 10-Dec-2025 | 92,690 | 92,027 | -0.72% | 223.5 | |
| 11-Dec-2025 | 92,027 | 92,537 | 0.55% | -77.5 | |
| Total for Dec 5–11, 2025 | 0.49 | 292.3 |
This period presented a macro-focused, news flow-sensitive outlook for Spot Bitcoin ETFs. Inflows prior to and on the day of the Fed’s interest rate decision showed that institutional investors were not entirely risk-averse. However, the lack of continuity in flows and the limited price reaction revealed a cautious stance prevailing in the market. In the coming days, more stable ETF inflows could create a supportive environment for the BTC price. Otherwise, due to the volatile flow structure, a flat and volatile price outlook may continue to prevail in the short term.
Ethereum spot ETF
Source: Darkex Research Department
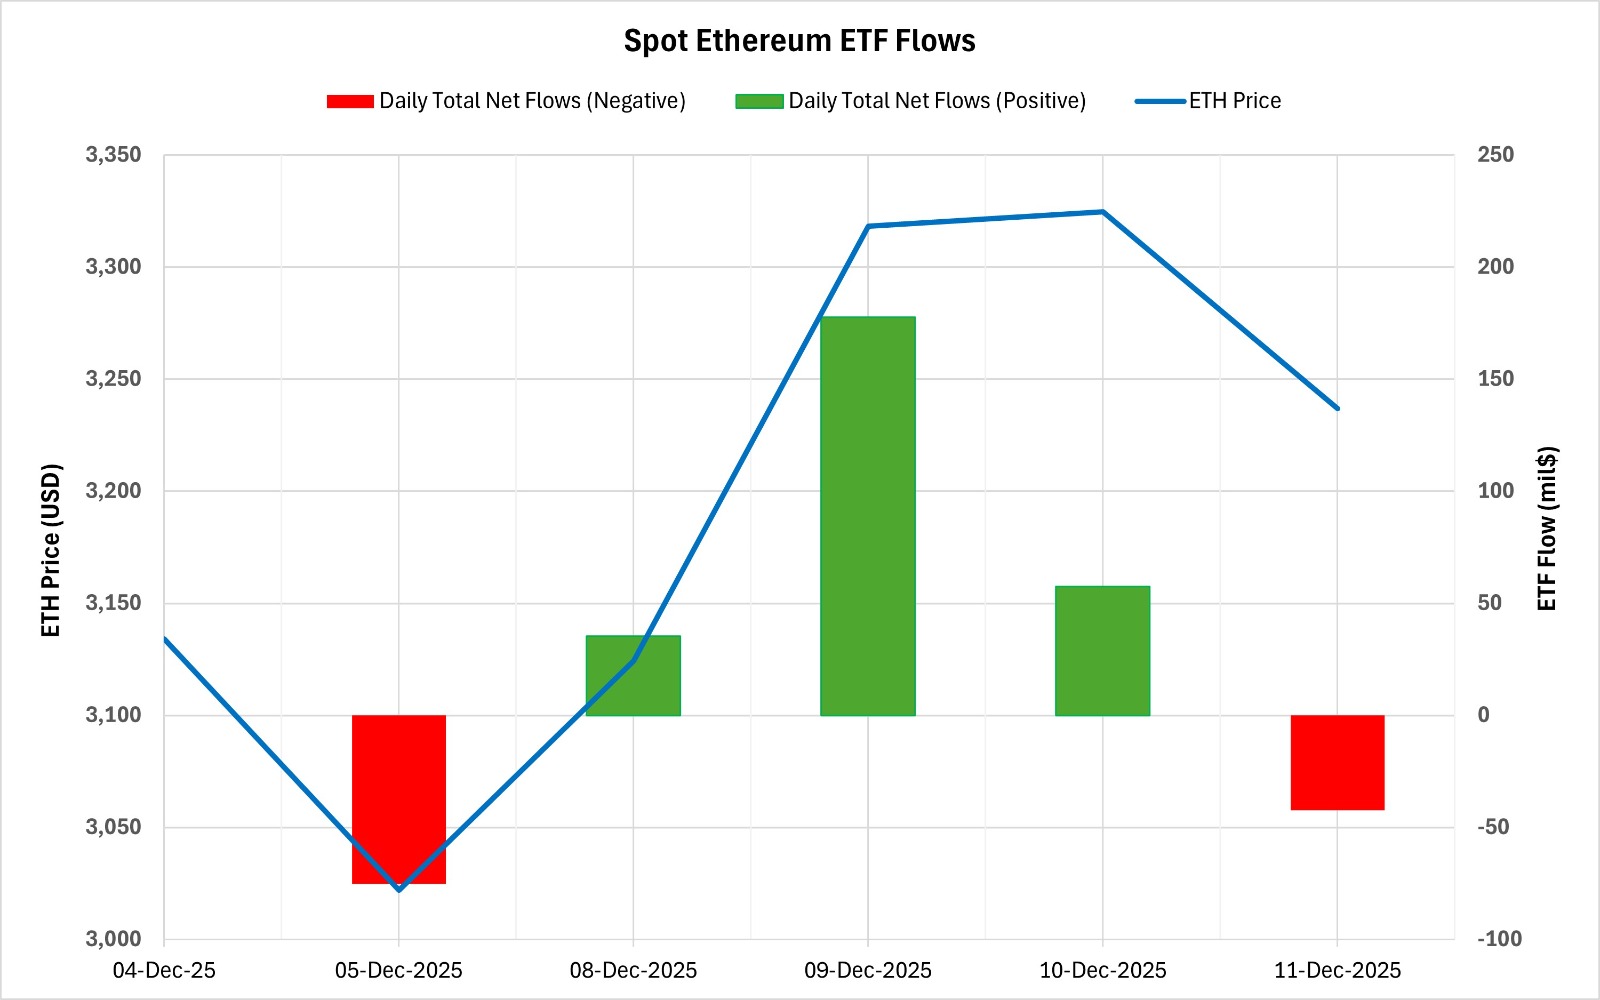
Between December 5-11, 2025, a total of $153.3 million in net inflows occurred into Spot Ethereum ETFs. While no clear net flow pattern emerged over the week, the three-day positive flow observed ahead of the Fed’s interest rate decision was the main factor keeping the period’s total on the positive side. The strong inflow of $177.7 million recorded on December 9 stood out as the most notable day of this process. In terms of funds, inflows into BlackRock ETHA and Fidelity FETH were decisive. The cumulative total net inflow into Spot Ethereum ETFs rose to $13.127 billion as of the 350th trading day.
| DATE | COIN | Open | Close | Change % | ETF Flow (mil$) |
|---|---|---|---|---|---|
| 05-Dec-2025 | ETH | 3,134 | 3,022 | -3.58% | -75.2 |
| Dec 8, 2025 | 3,060 | 3,124 | 2.10% | 35.5 | |
| December 9, 2025 | 3,124 | 3,318 | 6.21% | 177.7 | |
| 10-Dec-2025 | 3,318 | 3,325 | 0.19% | 57.6 | |
| December 11, 2025 | 3,325 | 3,237 | -2.64% | -42.3 | |
| Total for Dec 5–11, 2025 | 3.28% | 153.3 |
Ethereum opened at $3,134 on December 5 and closed at $3,237 on December 11, gaining 3.28% in value during this period. The upward movement in price gained momentum, particularly with the strong 6.21% daily increase seen on December 9, presenting a picture consistent with ETF inflows. However, the weakening seen in both price and inflows on the last trading day of this period indicated that investors were once again taking a cautious stance. Overall, this period presented a picture of volatile inflows but a relatively strong price. Although a persistent and strong inflow trend has not yet formed on the ETF side, the impact of positive days on the price was clearly felt. If inflows regain stability in the coming period, the rise in the Ethereum price could be based on more solid ground. However, if the uncertainty in flows persists, short-term volatility on the ETH side is likely to continue.
Bitcoin Options Distribution derivatives.
Source: Laevitas
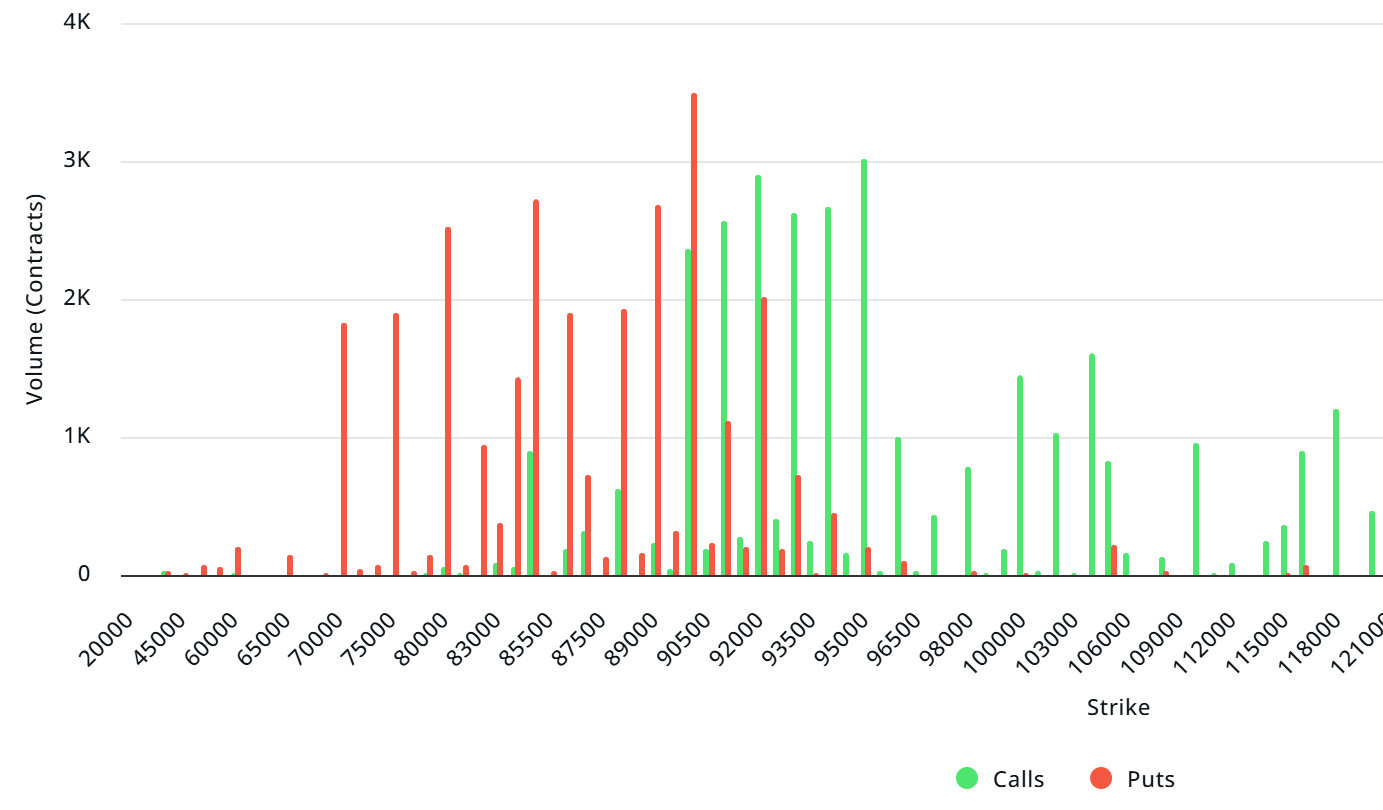
BTC: Notional: $3.49B | Put/Call: 1.09 | Max Pain: $90K
Deribit Data: Deribit data shows that BTC option contracts with a notional value of approximately $3.49 billion expire today. At the same time, looking at the risk transformation over the next week based on data from the last 24 hours, put options are dominating over call options in terms of risk hedging. However, call options have started to increase in the following days. When examining expected volatility (IV), it is below realized volatility (RV). On the other hand, the negative spread metric indicates low risk appetite in the market and shows that put options are expensive. Skew values are also pointing downward today and for the coming week.
Laevitas Data: Examining the chart, we see that put options are concentrated in a wide band between $70,000 and $92,000. Call options, on the other hand, are spread across a wide base between $90,000 and $104,000. At the same time, the $95,000 level appears to be resistance, while the $90,000 level appears to be support. On the other hand, there are 2.36K put options at the $90,000 level , where they peaked, and a decrease in put volume is seen after this level. Furthermore, 3.01K call option contracts peak at the $95,000 level. Looking at the options market, we see that put contracts are slightly dominant on a daily and weekly basis.
Option Maturity:
Call/Put Ratio and Maximum Pain Point: Looking at options in the latest 7-day data from Laevitas, the number of call options decreased by approximately 34% compared to last week, reaching 96.34K. In contrast, the number of put options decreased by 19% compared to last week, reaching 94.25K. The put/call ratio for options is set at 1.09. This indicates that there is slightly more demand for call options than put options among investors. Bitcoin’s maximum pain point is seen at $90,000. BTC is currently priced at $92,400, and if it does not break below the pain point of $90,000, the upward trend is expected to continue.
Ethereum Options Distribution
Source: Laevitas
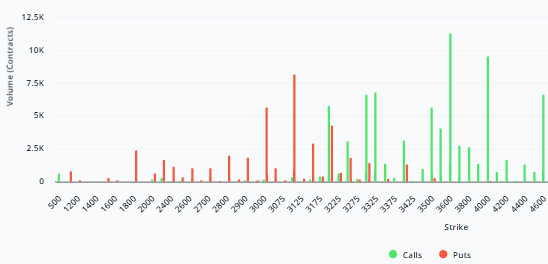
ETH: $0.79 B notional | Put/Call: 1.24 | Max Pain: $3,100
Laevitas Data: Looking at the data in the chart, we see that put options are concentrated in a fairly wide band, particularly between the $2,800 and $3,200 price levels. The highest put volume is at the $3,100 level, with approximately 9K contracts. On the other hand, in call options, there is a noticeable concentration between the $3,200 and $4,000 levels. The highest call volume appears to be approximately 12K at the $3,600 level.
Deribit Data: Despite ATM volatility remaining at high levels, the fact that the risk reversal is only slightly negative indicates that downside risks are not being priced in strongly and that there is actually no expectation of a sharp decline. The volume contraction on both sides suggests that market participants are mostly in a phase of monitoring the ” ,” indicating that the market has entered a wait-and-see mode. Considering the weakening hedge demand and the unwinding of put volume, we can say that the perception of downside risk has decreased and that the possibility of an upward movement is one step ahead in the event of a breakout.
Option Maturity:
Ethereum options with a nominal value of $0.79 billion expired on December 12. The Max Pain level was calculated at $3,100, while the put/call ratio stood at 1.24.
Legal Notice
The investment information, comments, and recommendations contained in this document do not constitute investment advisory services. Investment advisory services are provided by authorized institutions on a personal basis, taking into account the risk and return preferences of individuals. The comments and recommendations contained in this document are of a general nature. These recommendations may not be suitable for your financial situation and risk and return preferences. Therefore, making an investment decision based solely on the information contained in this document may not result in outcomes that align with your expectations.
